Article

Evaluation of Complete Fertilizer in the Aspect of the Antioxidant Enzyme System of Maize Hybrids

1
Institute of Land Use, Engineering and Precision Farming Technology, University of Debrecen, 138 Böszörményi St., 4032 Debrecen, Hungary
2
Institute of Food Science, University of Debrecen, 138 Böszörményi St., 4032 Debrecen, Hungary
*
Author to whom correspondence should be addressed.
Agronomy 2021, 11(11), 2129; https://doi.org/10.3390/agronomy11112129
Submission received: 21 September 2021 / Revised: 19 October 2021 / Accepted: 21 October 2021 / Published: 24 October 2021
(This article belongs to the Special Issue Horticultural Genetics and Biotechnology)

Abstract

:
Studies on physiological and biochemical processes in crops are highly relevant for breeders to produce hybrids with high yield. Two different maturity groups of maize hybrids were tested in this study. The research site was located at the Látókép Experimental Station of the University of Debrecen and the experiment lasted for 2 years. The examined nitrogen ranges were separated into two parts. Firstly, the effects of nitrogen fertilizer ranging from 120–300 kg ha−1 were examined, supplemented with a constant, high-level P2O5 and K2O. Secondly, the optimal ratio of N:P:K was measured. In order to monitor the health status of maize hybrids, stress indicators including the activity of ascorbate peroxidase (APX), and superoxide dismutase (SOD), the rate of lipid peroxidation (LP), and grain yield were measured. The samples were taken in five phenological stages. Variance analysis based on nitrogen fertilizer showed variation in sampling times and fertilizers on APX, LP, and SOD. Variance analysis based on NPK indicated variation in sampling times, years, and fertilizer levels on APX, LP, and SOD. Correlation analysis showed that yield correlated negatively with SOD during the use of NPK fertilizer, as the use of nitrogen fertilizer cannot make corrections to yield with SOD but phosphorus and potassium can correlate with yield, and SOD. Principal component analysis showed that NPK5 and N5 had maximum stability and effect on yield. The activity of APX had the highest value during silking, and LP was in the V14 leaf stage. The correlation and principal component analysis showed that silking and the V14 leaf stage are the most important stages for yield, thus, higher attention must be paid to these stages in the LP and the activation of APX to achieve maximum yield.

1. Introduction

The adaptability of modern maize hybrids to abiotic stress factors is variable. The responses of maize to different abiotic stressors can be measured and evaluated based on the activity level of antioxidant enzymes. Effects of weather extremities, nutrition, and other abiotic stressors during crop production can be properly monitored by examining plant physiological parameters. Successful crop production requires detailed knowledge of the abiotic stress responses of new maize hybrids [1]. Optimizing water and fertilizer consumption causes reduced production costs, while saving resources, and reducing environmental pollution. Nitrogen (N) is a particularly important nutrient for crops, especially maize [2]. It is crucial to determine the optimal amount of applied nitrogen to manage highly effective and environment-friendly maize production, therefore, excessive N-fertilization can be prevented. In addition, maize needs different nutrients at different stages of its growth; during the growth of maize, nutrients are very important [3].
When plants are exposed to stress, a protective mechanism is triggered to mitigate the adverse effects resulting from oxidative stress. It has been revealed that plants with constitutive antioxidant-level are more resistant to various stress effects among the higher-order species (Nicotina tabacum L., Oriza sativa L.) [4]. Plant cells are protected by non-enzymatic and enzymatic antioxidants, including superoxide dismutase (SOD), and ascorbate peroxidase (APX) [5]. Superoxide dismutase is the first protective reaction against reactive oxygen species (ROS) that are triggered by environmental stresses, e.g., the transient increase in drought and SOD activity is consistently associated with increased stress tolerance [6,7].
Abiotic stresses lead to the production of ROS [8]. ROS are naturally produced as a by-product of various metabolic reactions in chloroplasts, mitochondria, and peroxisomes in all living cells. Under normal conditions, ROS molecules are neutralized by the antioxidant system [9]. However, the balance between the production and collection of ROS molecules in the cell is disturbed by various biological and non-biological stresses that can cause irreparable damage to the cell [10,11]. Cells remove or reduce their damaging effects through enzymatic or non-enzymatic mechanisms. One of the main mechanisms against free radicals is their sweeping by antioxidant enzymes. The first enzyme is the antioxidant SOD which mitigates the damage through dismutating superoxide anions to oxygen and hydrogen peroxide (H2O2). The increase in SOD activity leads to an increase in H2O2, followed by a hydroxyl radical (OH) [12]. During the decomposition of hydrogen peroxide ascorbate as a substrate is degraded by the APX process [13]. Tittal et al. [14] showed that the activity of antioxidant enzymes, SOD, catalase (CAT), and APX) increased as a result of potassium replenishment in sorghum (C4) seedlings under both normal and water stress conditions. In addition, by increasing the amount of potassium fertilizer, severe membrane damage was prevented due to the mechanism of oxygen-binding, as well as the activity of SOD, CAT, and glutathione reductase (GPX) under drought stress [14]. These enzymes respond differently in various stresses in each compartment [15,16,17,18]. As a result of nitrogen replenishment—under water stress conditions—the photosynthetic system functioned properly in the leaf, and lipid peroxidation levels also decreased with increasing enzyme activity and decreasing malondialdehyde (MDA) content [19]. Zhang et al. [20] concluded that the effect of N-replenishment on antioxidant enzyme activity and MDA concentration is associated with different water and nitrogen dose treatments. A correlation between increasing fertilizer doses and the activity of APX was detected. Based on the results obtained, the MDA concentration in tissues was slightly elevated with increasing fertilizer treatment [21]. In addition to decreases in MDA concentration at higher N doses, a lower peroxidation level was measured under water stress conditions. Cell membrane stability was affected by lipid peroxidation caused by oxygen species under stress conditions [22]. At the maturing seed stage, magnetic water appears to cause oxidative stress and H2O2 production, which is accumulated by CAT and APX, and by increasing the biosynthesis of anthocyanins as a non-enzymatic antioxidant. The membrane has maintained its integrity due to the lack of change in lipid peroxidation. Increased activity of these two enzymes and no change in the superoxide dismutase activity, which itself produces hydrogen peroxide, prevented damage to the membrane and reduced lipid peroxidation.
This 38-year long-term study aimed to clarify the physiological and biochemical impacts of different fertilizer managements, focusing on nitrogen, phosphorus, and potassium. To achieve this goal, the activity of SOD, and APX—as part of the antioxidant enzyme system—and the rate of lipid peroxidation of two different maturity group maize hybrids were examined. This research aims to further clarify the role of enzymes and lipid peroxidation measured at each important phenological stage of maize in terms of grain yield production. Results suggest that data of plant physiological parameters measured at the most important phenological stages—and thus by precise monitoring of the health status of the maize—can be used to determine the right and optimal ratio of applied macronutrients (N:P:K) and to maximize yield production.

2. Materials and Methods

2.1. The Field Experiment

The experimental plants were two maize (Zea mays L.) hybrids with different FAO numbers and a group of maturity: Hybrid 1-FAO 350-370, Hybrid 2-FAO 490. The experiments were carried out at the Látókép Experimental Station of the University of Debrecen (47°83′30 N, 21°82′60 E, 111 m asl). These hybrids are resistant to abiotic stress. The experiment was established in 1983 and has been continuing with unchanged parameters for 38 years using the same nutrient replenishment scheme, location, soil tillage and agrotechnical support. The experiment is a two-factor field experiment with a strip-plot design and four replications, allowing for appropriate statistical evaluation. Four replications were applied during the leaf sampling, and the fifth replication was randomly selected from the first four.
The climatic-meteorological factors of the experimental area are characterized by continental and often extreme conditions, the soil is calcareous chernozem with 80–90 cm depth top soil and 2.7 Hu% humus. The soil has a pH of 6.6 (slightly acidic). In terms of its physical variety, it is a clayey loam, with a plasticity index KA 44 according to Arany. The date of sowing was 20 April 2019 and 17 April 2020 and the harvesting dates were 9 October 2019 and 23 October 2020, when a soil disinfectant containing Teflutrin was also applied at a dose of 15 kg ha−1. Plant density was 73,000 plants in each plot which was 7.6 square meters by the randomized complete block design. In the first part, (first experiment) the effect of nitrogen ranges from 0 to 300 kg ha−1 (control N0, P2O5 0 and K2O 0: N2 120 kg ha−1 N, P2O5 (184 kg ha−1) and K2O (216 kg ha−1): N5 300 kg ha−1 N) P2O5 (184 kg ha−1) and K2O (216 kg ha−1)) was examined with a constant high level. The second part (second experiment) measured the optimal ratio of nitrogen:phosphorus:potassium (N:P:K) for maize (control with N:0, P:0, K:0; NPK2 60 kg ha−1 N, 46 kg ha−1 P2O5, 54 kg ha−1 K2O; NPK5 150 kg ha−1 N, 115 kg ha−1 P2O5, 135 kg ha−1 K2O), and the negative control without fertilizer supplement was also measured. The phosphorus and potassium fertilizer were applied before winter plowing, the nitrogen fertilizer was applied in the spring before the sowing begins.
Five important phenological phases for maize were used for the study (four leaves (V4), six leaves (V6), eight leaves (V8), fourteenth leaves (V14) and silking. The heat sums were different at the time of sampling in the 2 years (2019–2020).
Samples were taken from the 4th (fully developed) leaf during the first three samplings, from the 10th (fully developed) leaf at the 4th sampling, and the leaf opposite to the cob at the last sampling. Samples were transported in liquid nitrogen and stored in a −80 °C deep freezer until processing.

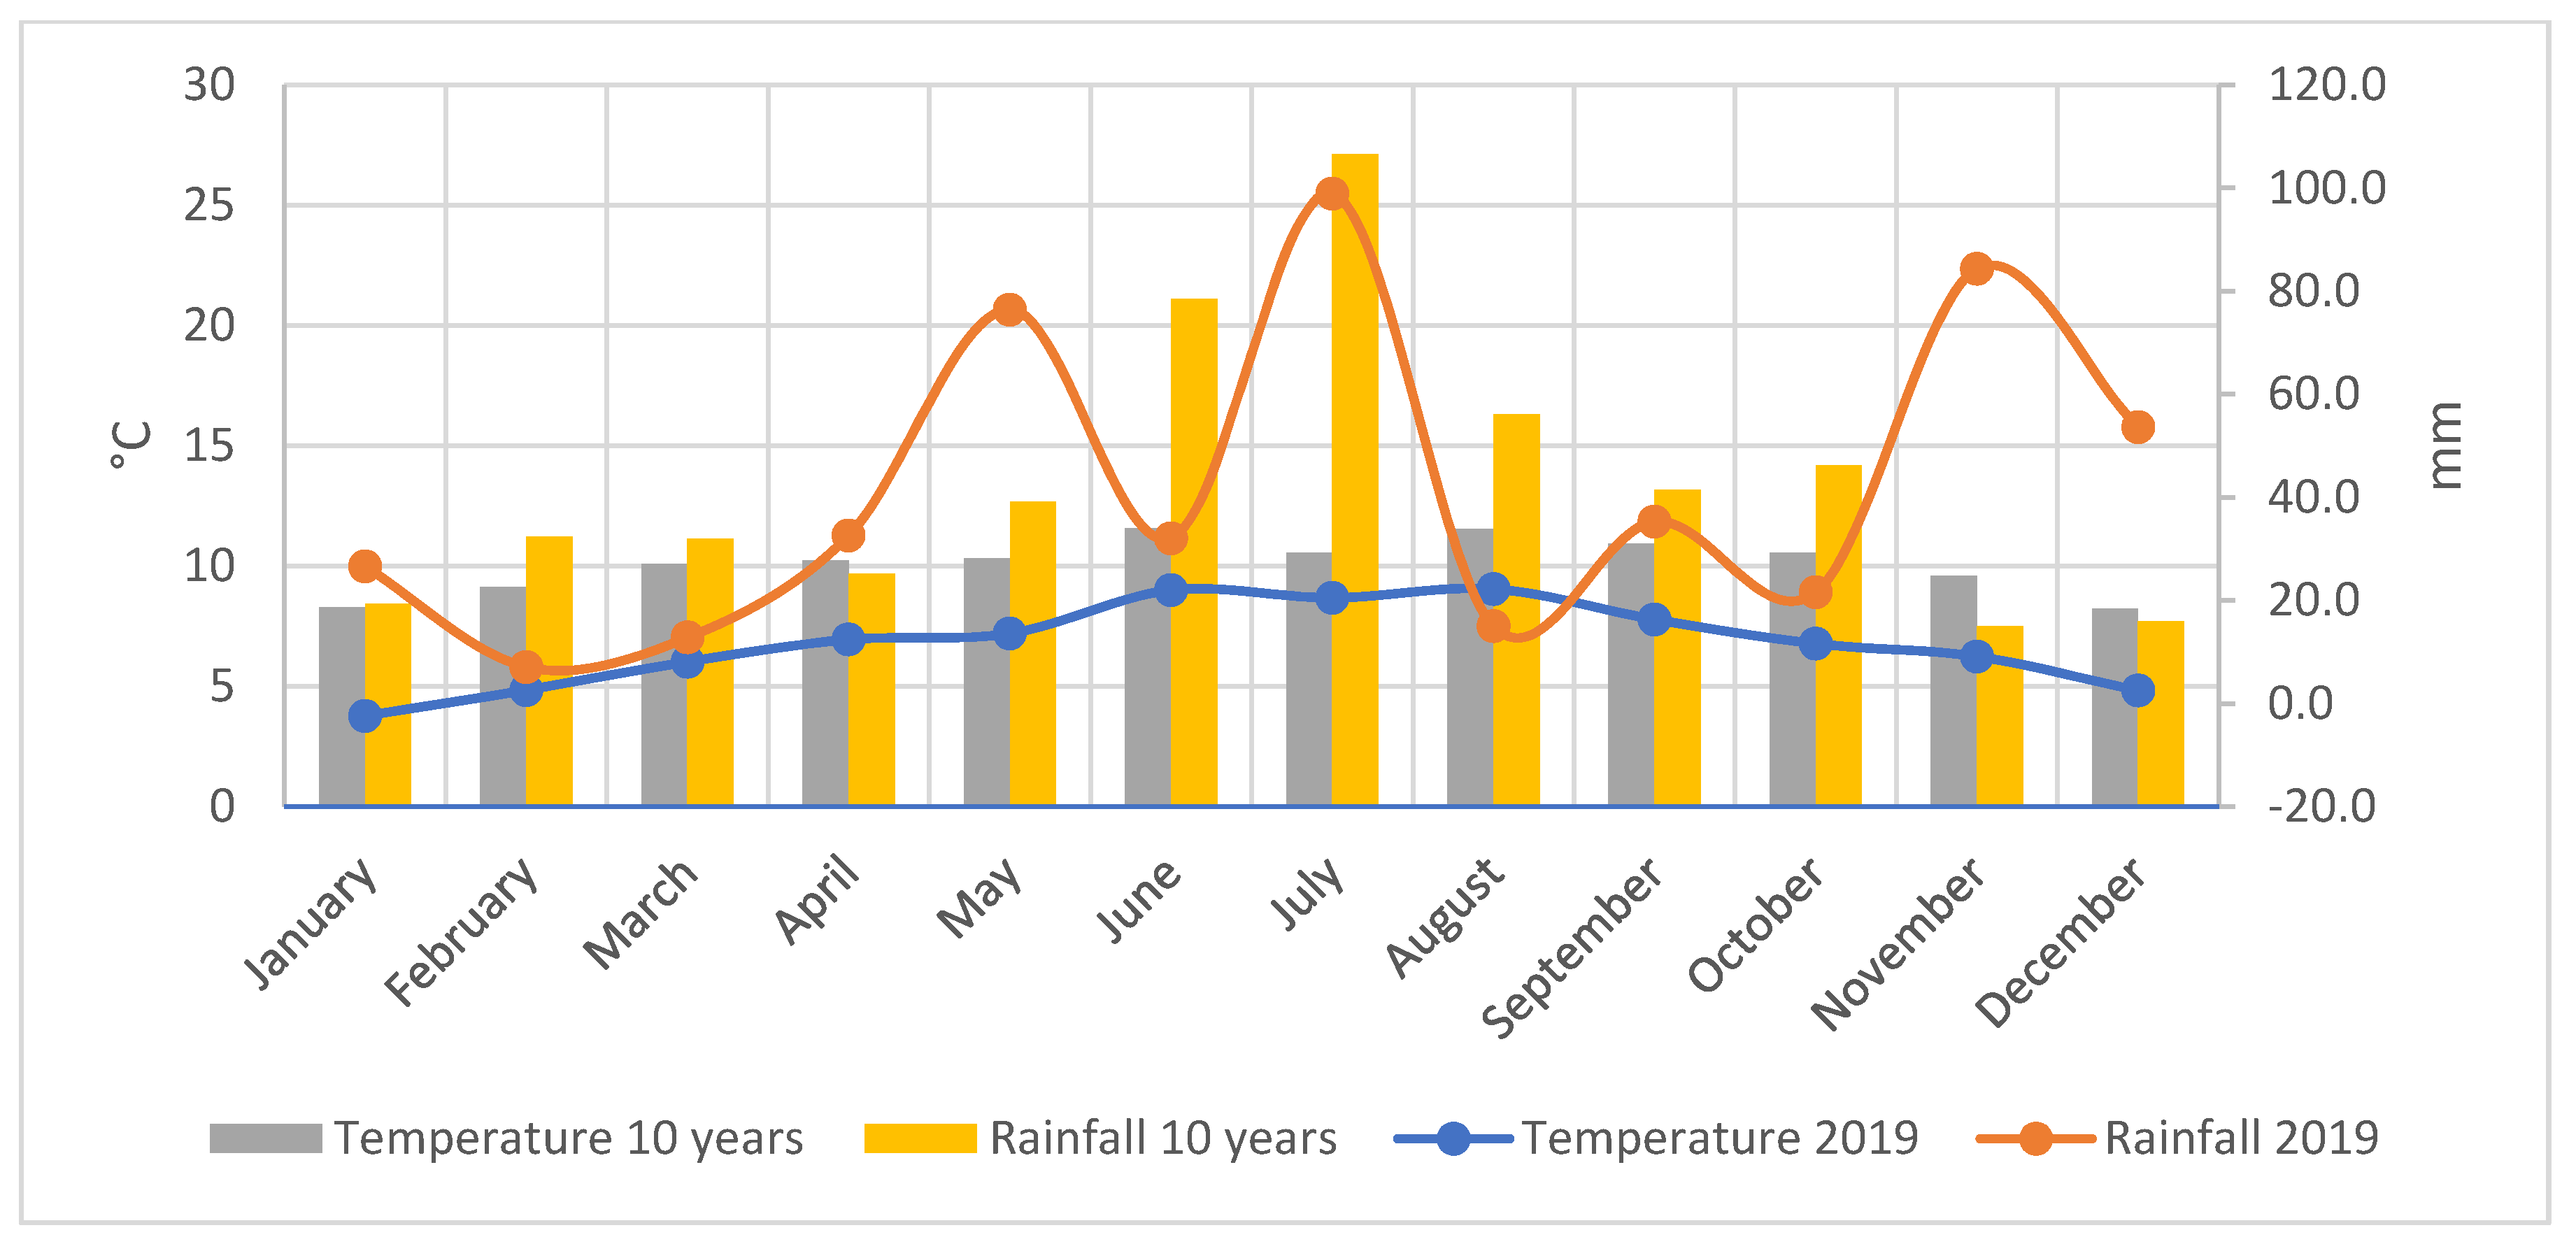
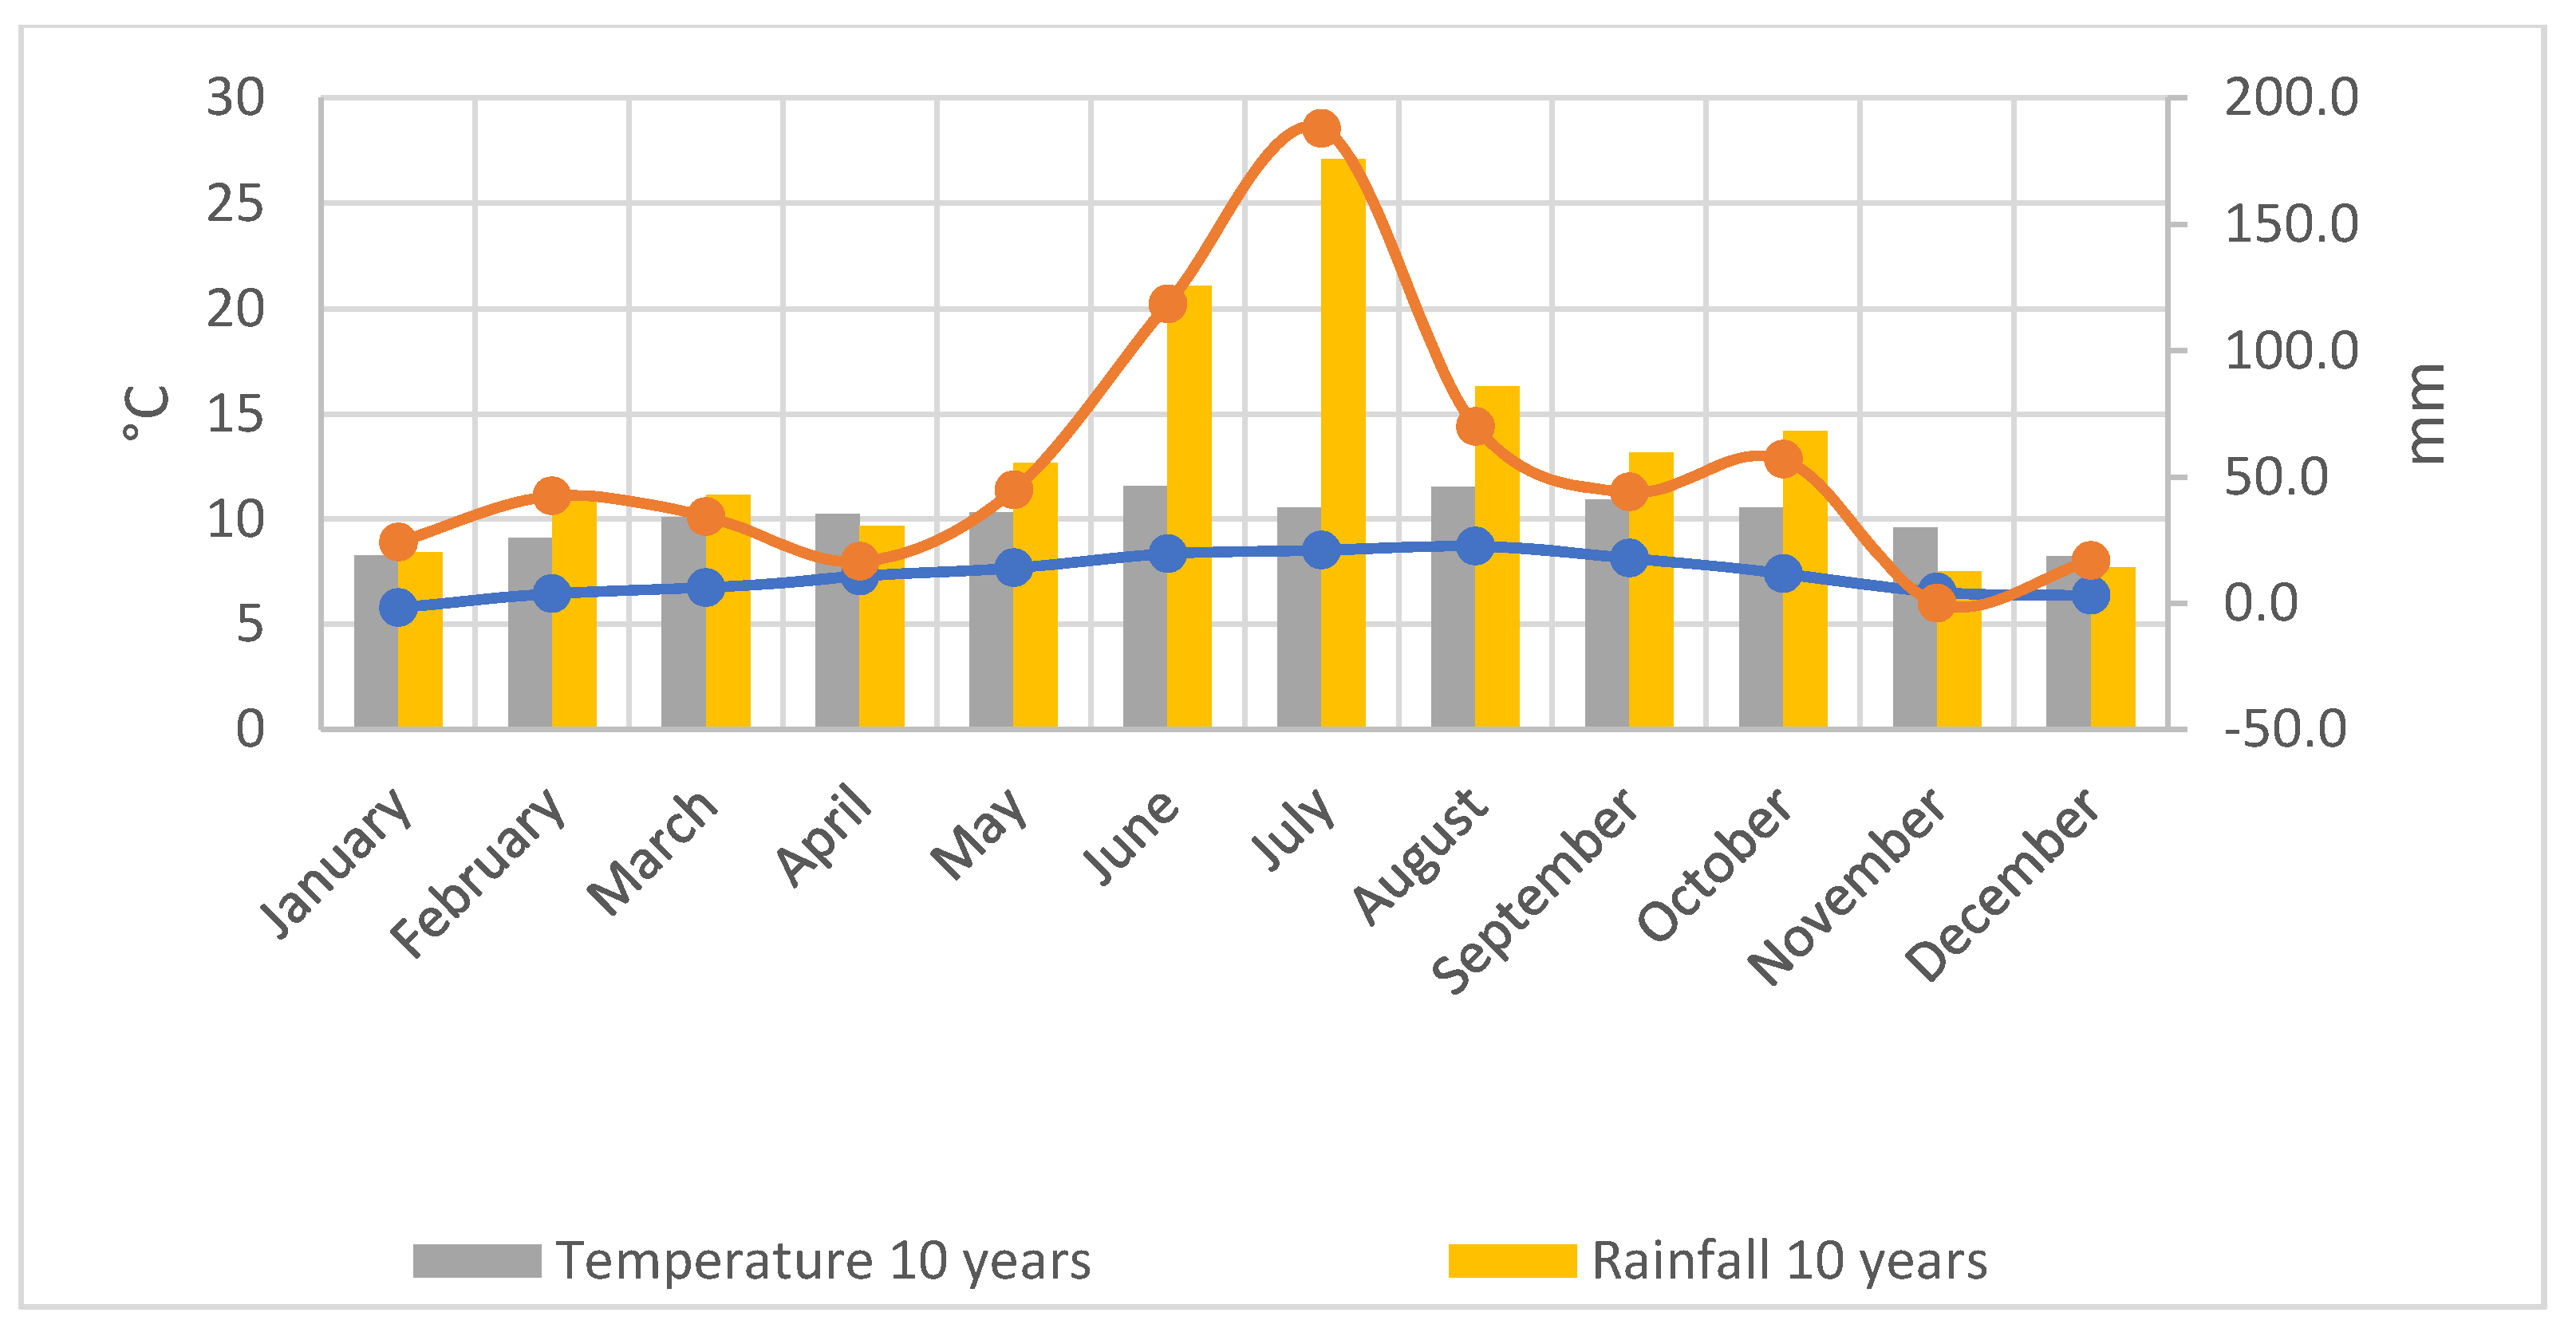
2.2. Climatic Conditions of the Experimental Site (2019–2020)

Overall, 2019 was a year of highly variable, even hectic weather conditions. A positive temperature anomaly in April was followed by a negative anomaly of similar magnitude in May. Temperature in June was well above average, followed an average July and a clearly above average August, with the positive anomaly continuing into the autumn. Monthly precipitation was average in April and well above average in May, followed by June and July with a clear precipitation deficit. The average monthly rainfall for August ended the autumn months with a deficit. Compared to the five years, the growing season of 2019 showed probably the most unfavourable picture, with very low precipitation and high maximum temperatures. In June in particular, the strong positive temperature anomaly was coupled with exceptionally high irradiance values. In terms of heat sum, the second highest value in five years was obtained with 1723.7 °C degree days (Figure 1).
Rainfall in the spring was followed by especially high monthly totals in the three summer months. There was a slightly positive precipitation anomaly in autumn. In terms of air temperature conditions, the most striking feature was the significant negative temperature anomaly in May, which, coupled with the lack of precipitation in the spring, negatively affected development during the sowing and emergence period. For the summer months, June and July brought average or slightly cooler than average weather, while August was a warmer than average summer period, a trend that continued into the autumn months. However, it can be noted that the persistent heat waves that were frequent in the past were absent in 2020. The abundant rainfall around the silking period and moderately high temperatures at this critical stage of development probably helped to produce a high yield. The approximately 1500 °C degree days was the lowest value in five years (Figure 2). Meteorological data of two years were measured and collected by the own experimental site’s meteorological station with certification and calibration. Delta T devices, Campbell and Vaisala sensors were used on the meteorological station for the measurements.

2.3. Rate of Lipid Peroxidation

The lipid peroxidation value was calculated from the amount of malondialdehyde (MDA) with an extinction coefficient of 155 mM−1 cm−1, determined in the fresh weight of MDA μmol g−1 FW, based on the description of Heath–Packer [23].
For lipid peroxidation (LP) measurements, 100 mg leaf samples without leaf blades were used. The samples were digested with 0.25% concentrated thiobarbituric acid (TBA) and 10% concentrated trichloroacetic acid (TCA) with liquid nitrogen and afterwards were centrifuged at 10,800 rpm for 25 min at 4 °C. The supernatant was pipetted and a 200 µL plant sample was mixed with 800 µL of 0.5% TBA and 20% TCA and placed in a water bath for 30 min at 95 °C. The samples were placed on ice, centrifuged at 10,800 rpm for 10 min at 4 °C, the supernatant was pipetted, and the absorbance at 532 nm was measured with a spectrophotometer. The blank was measured at 600 nm.
Calculation formula: concentration of MDA (mM) = (ABS 532 − ABS 600)/155

2.4. Enzyme Assays

The activity of ascorbate peroxidase (APX) was measured with a decrease in absorbance at 290 nm over 1 min with a spectrophotometer based on the method of Nakano–Asada [24], with modifications by [25]. During sample processing, 500 mg of the plant sample was crushed with isolation buffer, then centrifuged at 2 °C for 20 min and stored on ice until measurement. Two ml of Tris-HCl solution and 100 µL of ascorbate solution were added to 50 µL of plant sample during measurement. The decrease in 1 min was determined, and 100 µL of H2O2 was added to the same mixture. The difference between the two values was calculated from the 290 nm absorbance peroxide content. The calculation form of ascorbate peroxidase (APX) was: enzyme activity (units/L) = (ΔABS × total assay volume)/(Δt × ε × l x enzyme sample volume).
Extinction coefficient = ε of substrates in units of M−1 cm−1), and l represents the cuvette diameter (1 cm). Enzyme activity (unit) was defined as the amount of enzyme that oxidized 1 μmol of substrate/min.
The activity of SOD was measured with 400 mg leaf sample without leaf blades was used for the superoxide dismutase analysis [26,27]. The samples were digested with a buffer containing K2HPO4, polyvinylpyrrolidone (PVP), phenylmethylsulfonyl fluoride (PMSF) and ethylenediaminetetraacetic acid (EDTA). The pH of the buffer was adjusted to pH 7.8 with phosphoric acid. The resulting mixture was centrifuged at 10,000 rpm for 14 min at 4 °C and the supernatant was then removed with a pipette. The absorbance was measured by spectrophotometer at 560 nm and the instrument was zeroed with distilled water. For the measurement, 2675 mL of the buffer solution, 250 µL of methionine, 25 µL of riboflavin, 25 µL of nitro blue tetrazolium chloride (NBT) were added to a reaction tube and finally, 25 µL of plant sample were added. NBT was added to the reaction mixture every minute.

2.5. Statistical Analysis

Methods of variance analysis are statistical models that can examine the differences between groups or categories. The basis of these methods was the separation of variance or dispersion of data into several components [28]. Tukey [29] proposed a multiple comparison method based on student domain statistics. In his method of qα(α,f) for all mean pairs, comparisons are used to determine the critical value. Therefore, the Tukey test declares that the two means have a significant difference if the absolute value of the difference between their samples is more than Tα = qα (α,f) Syi [29]. The most widely used statistical index of bivariate correlation is the Pearson torque correlation coefficient, commonly called the Pearson correlation. Abbreviated as (r), the Pearson coefficient shows the degree to which there is a linear relationship between quantitative variables. A problem with a large number of variables is known as a multidimensional difficulty [30]. Principal component analysis (PCA) is a multivariate technique whose main purpose is to reduce the dimension (number of variables) of a multivariate data set as much as possible to explain the changes of the primary variables in the data. This goal is achieved by converting the initial variables into a new set of uncorrelated variables called principal components, linear combinations of the main (primary) variables. They are arranged in such a way that the few first principal components calculate the maximum variability in the principal variables. Distribution biplots are suitable for analyzing the relationships between two variables, but their weakness in more complex relationships is due to many variables. However, PCA tries to figure out the relationships between the variables in other ways [31].

3. Results

3.1. The Pure Database of the Values in the Control and the Two Highest N Fertilizer Levels

The activity of the APX was higher in 2020, averaged over two maturity group hybrids. The value of APX was characterized by different dynamics in the two study years. In 2019 the activity of APX increased steadily and then nearing the end of the growing season, under silking, the value reached the peak. In 2020, a reverse trend was observed at the beginning of the growing season, the activity of APX was the highest and then decreased gradually. The activity of SOD reduced in both years approaching the end of the growing season (Table 1, Table 2 and Table 3).

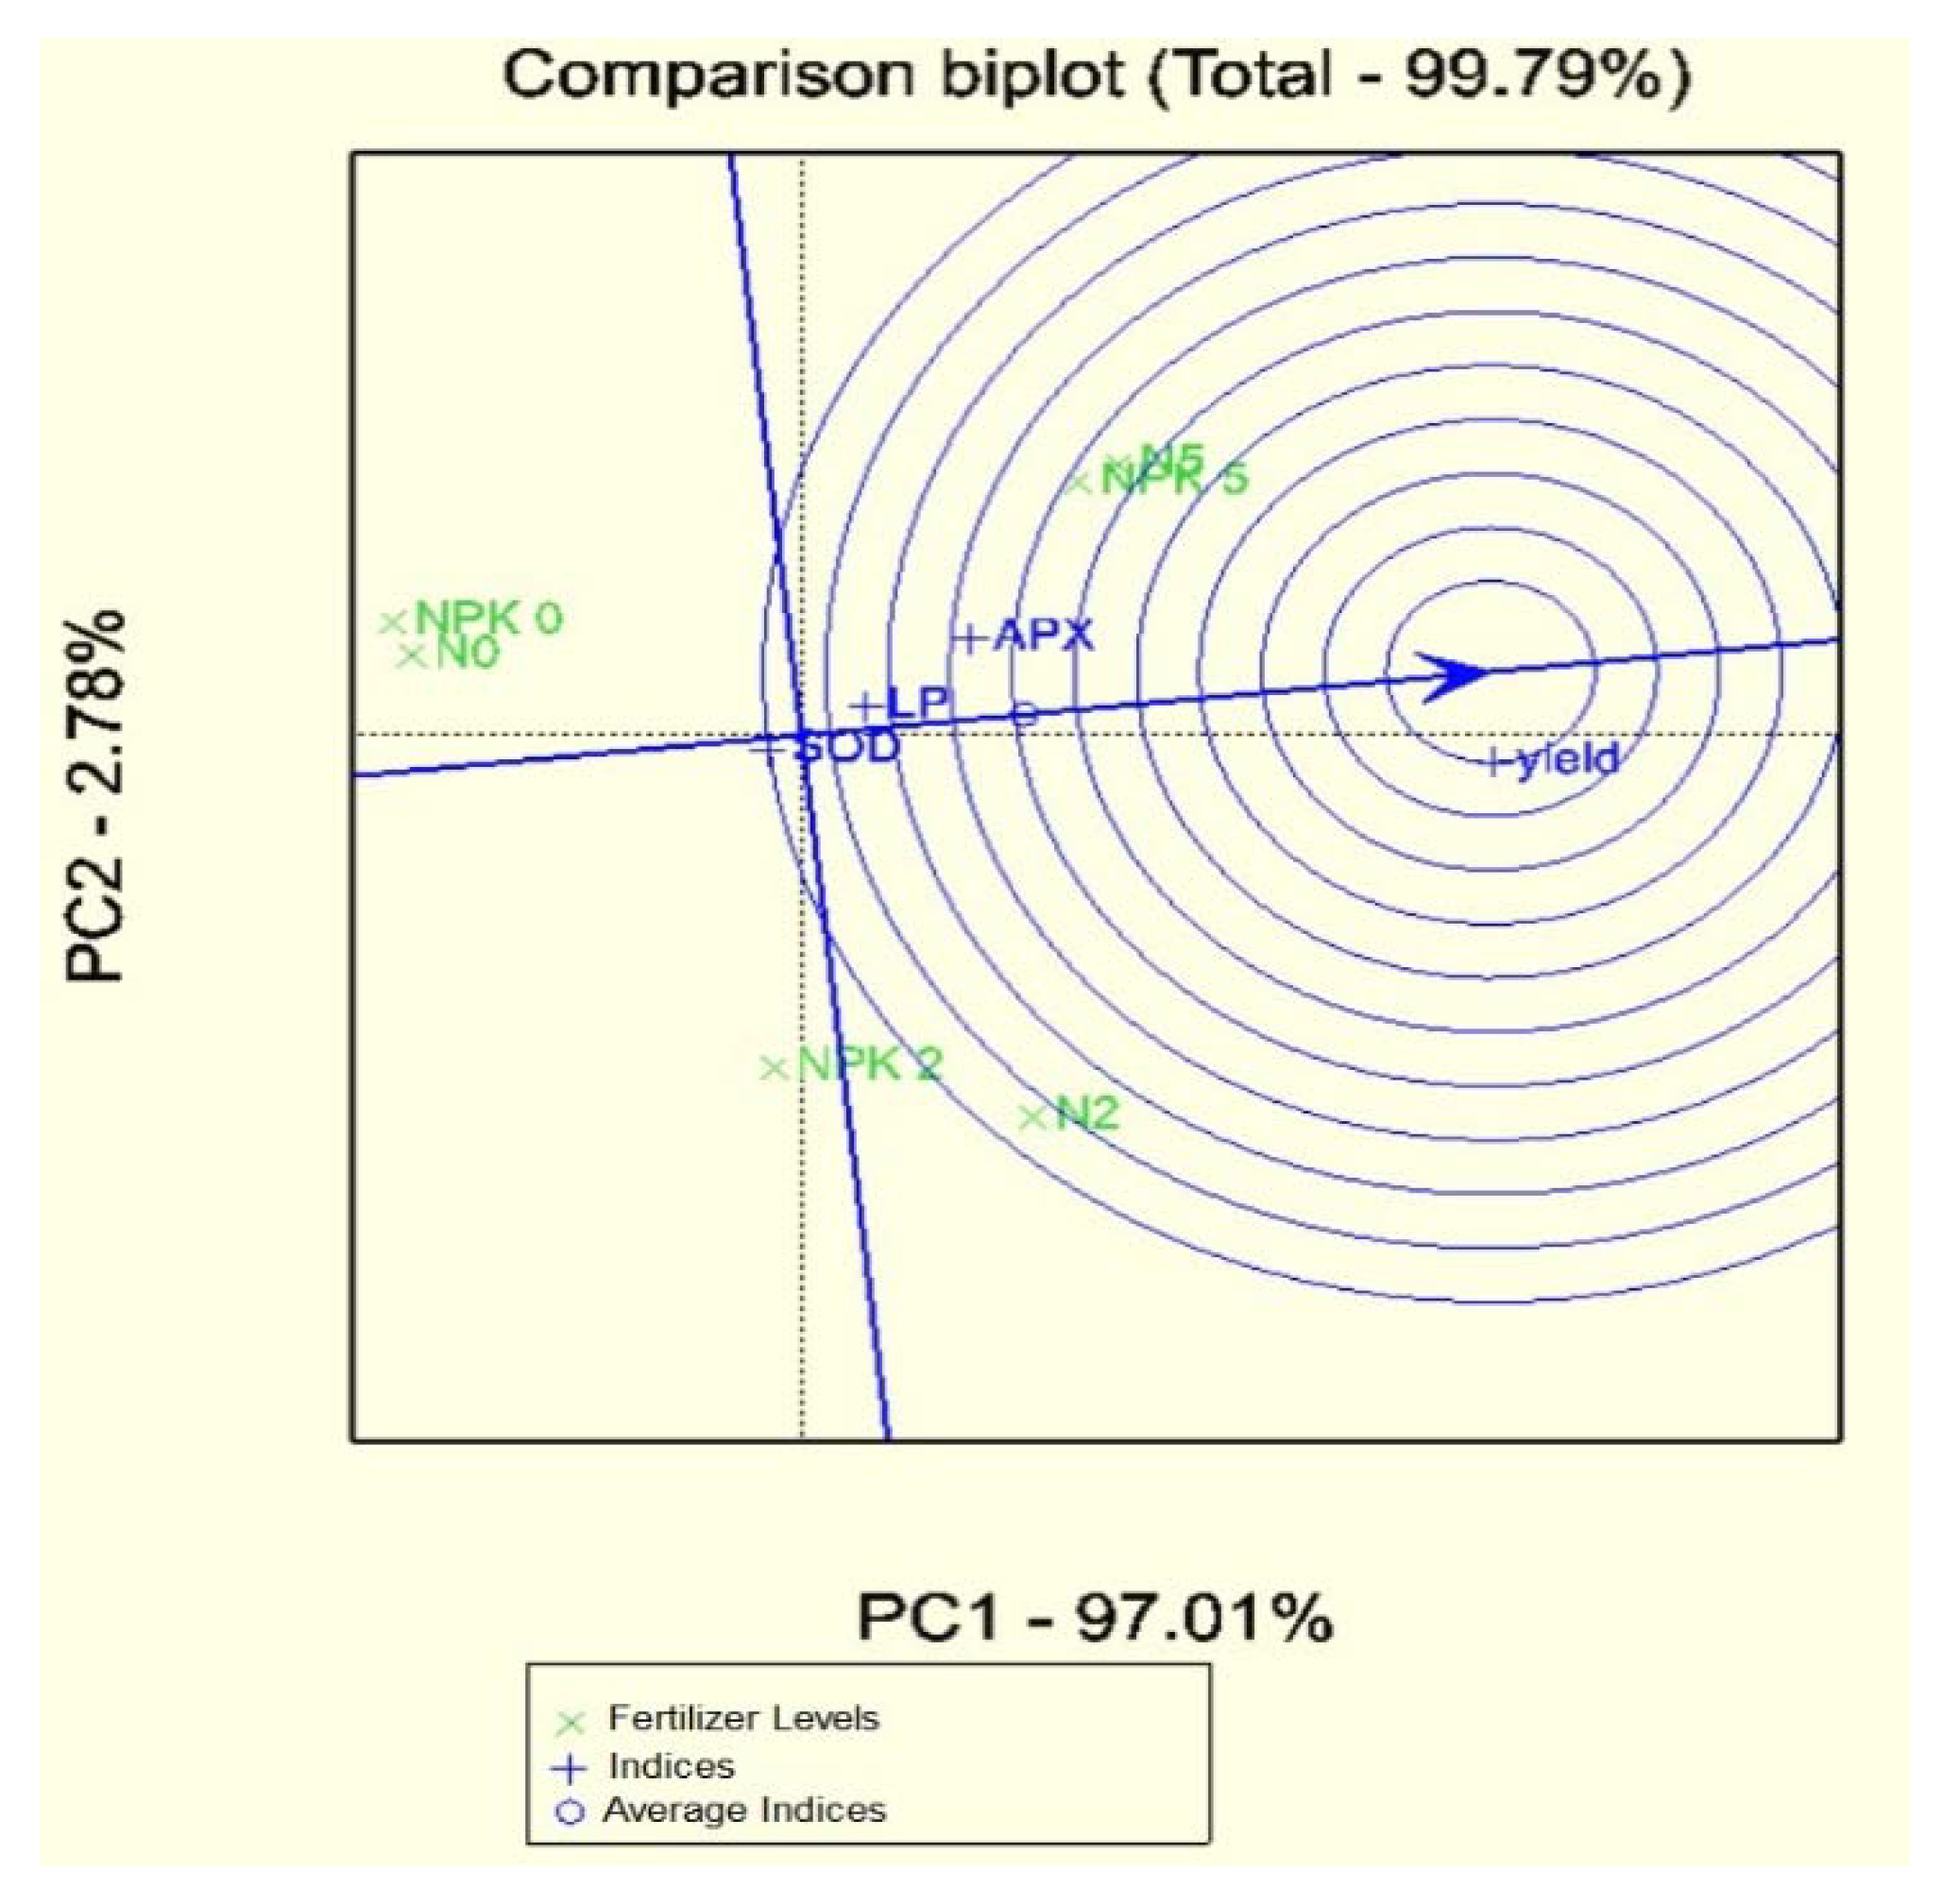
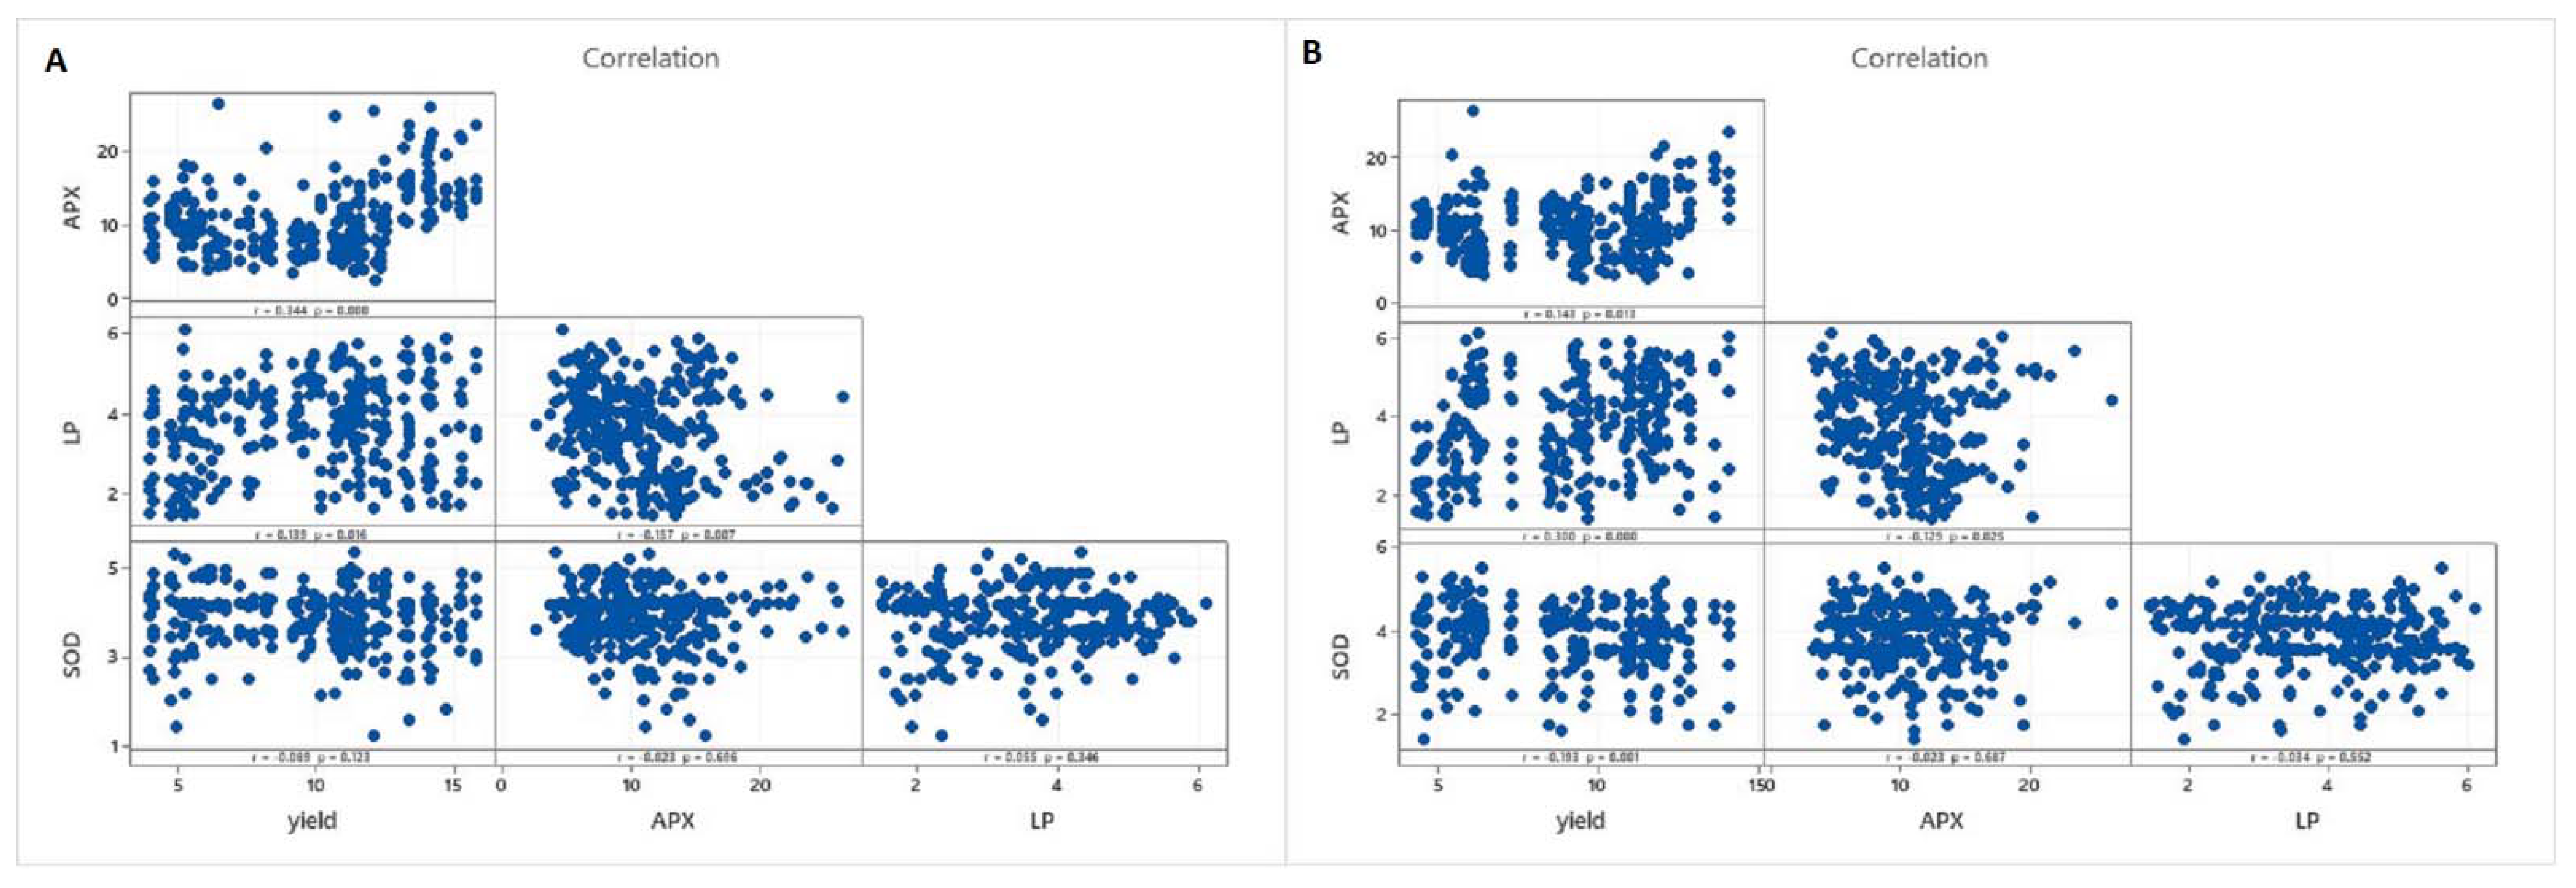
3.2. Statistical Analyses of the Database

Variance analysis based on the nitrogen fertilizer indicates significant sampling times effect, year, fertilizer levels effect, year in hybrid interaction, year in fertilizer levels interaction, and year in hybrid in fertilizer levels interaction on APX activity. Also, the sampling times effect, year, fertilizer levels, and year in fertilizer levels were significant on the LP index. This analysis showed that the effect of crop year, hybrids, fertilizer levels, year in fertilizer level interaction, hybrid in fertilizer levels interaction, and years in hybrids in fertilizer levels were significant on the grain yield index. This result showed that there is a variation in years, sampling times, and fertilizer on indices (Table 4).
Tukey grouping based on the nitrogen fertilizer showed that activity of APX had a higher value at the silking stage. After that, in V4 leaf stage, V6 leaf stage, V14 leaf stage and V8 leaf stage, there was a maximum density of the APX. In addition, silking stage and V14 leaf stage had maximum amount and density with the first group. The second group includes the V6 leaf stage with the V14 leaf stage, and the third group includes the V8 leaf stage. The lipid peroxidation (LP) had a maximum amount in the V6 leaf stage, followed by the V14 leaf stage, silking, V8 leaf stage, and V4 leaf stage. Based on the Tukey grouping, the V6 leaf stage and V14 leaf stage were the first groups of the maximum performance of the LP. The second group includes silking, V8 leaf, and V4 leaf stages in the LP. This analysis showed that activity of the SOD was maximum in the V14 leaf stage, followed by the V6 leaf stage, V4 leaf stage, V8 leaf stage, and the silking stage. The first group includes the V14 leaf stage, V6 leaf stage, and V4 leaf stage, and the second group includes the V8 leaf stage and silking stage (Table 5).
The variance analysis based on the NPK fertilizer showed a significant effect of sampling times, years, fertilizer levels, years in fertilizer levels interaction, hybrids in fertilizer levels interaction, and years in hybrids in fertilizer levels on the activity of APX. Also, a significant effect of sampling times, years, fertilizer levels, and years in fertilizer levels interaction was shown on LP. This result indicated a significant effect of sampling time, years, hybrids, fertilizer levels, and years in fertilizer levels on the activity of SOD. In addition, the variance analysis showed a significant effect of different years, hybrids, fertilizer levels, years in hybrids interaction, years in fertilizer levels interaction, hybrids in fertilizer levels, and years in hybrids in fertilizer levels interaction on grain yield study. This result showed variation in sampling times, years, and fertilizer levels based on the NPK fertilizer on the activity of SOD, and APX, and the rate of LP (Table 6).
Tukey grouping based on the NPK fertilizer showed that APX had higher activity in the silking stage. After that, the V6 leaf stage, V4 leaf stage, V14 leaf stage, and V8 leaf stage had a maximum density of the APX. In addition, the silking stage had the maximum amount and density in the first group. The second group includes the V6 leaf stage, and the third group includes the V4 leaf stage, the V14 leaf stage, and the V8 leaf stage. The LP density had a maximum amount in the V6 leaf stage and after that silking, the V14 leaf stage, the V8 leaf stage, and the V4 leaf stage. Based on the Tukey grouping, the V8 leaf stage and silking leaf stage were the first groups of the maximum performance of LP. The second group includes the V14 leaf stage, and the third group includes the V8 leaf stage with the V4 leaf stage in the LP index. This analysis showed that SOD activity was the maximum in the V4 leaf stage, the V14 leaf stage, V6 leaf stage, V8 leaf stage, and silking. The first group includes the V4 leaf stage. The second group includes the V14 leaf stage, the V6 leaf stage, and the V8 leaf stage, and the third group includes silking on the SOD activity (Table 7).
Correlation analysis based on the nitrogen fertilizer showed that grain yield significantly correlated with APX and LP. Also, APX had a significant negative correlation with LP. However, yield did not correlate with the SOD index. Correlation analysis based on the NPK fertilizer indicated that yield had a significant negative correlation with SOD, and had a significant positive correlation with LP, and APX. Also, APX had a significant negative correlation with LP (Figure 3).
The biplot analysis showed that the first principal component covered 97.01% of all data, and the second principal component covered 2.78% of all data. Yield had a significant correlation with APX, LP, and SOD. The maximum effect was achieved with APX, followed by LP. The minimum significant effect of yield was achieved with SOD. In addition, NPK5 (NPK5 150 kg ha−1 N, 115 kg ha−1 P2O5, 135 kg ha−1 K2O), N 5 doses (N5 300 kg ha−1 N), and N 2 doses (N2 120 kg ha−1 N) had a maximum significant effect on yield, and NPK2, N0, and NPK 0 had no significant yield (Figure 4).
Principal component analysis based on the biplot showed that the first principal component covered 86.75% of all data, and the second principal component covered 7.65% of all data. APX had maximum activity in the silking stage, followed by the V4 leaf stage, the V6 leaf stage, the V14 leaf stage, and the V8 leaf stage. In this case, silking, the V4 leaf stage, and the V6 leaf stage are significant with APX activity. APX had a maximum effect on yield and (LP (Figure 5A). LP had maximum density in the V14 leaf stage, followed by the V6 leaf stage, the V4 leaf stage, silking, and the V8 leaf stage. All phenological stages had a significant effect on LP. In addition, LP density had a maximum effect with SOD and yield (Figure 5B). SOD had maximum density in V14 leaf stages after the V6 leaf stage, the V4 leaf stage, the V8 leaf stage, as well as silking. All stages had a significant effect on SOD density. Moreover, SOD had a significant maximum effect with the LP in this study (Figure 5C).

4. Discussion

Variance analysis based on nitrogen fertilizer showed variation in sampling times and fertilizer levels on APX, LP, and SOD. Also, hybrids showed variations in grain yield. Years in fertilizer levels interaction had a variation on the activity of APX, LP, and grain yield. Years in hybrids in fertilizer levels’ interaction had a variation on yield and APX. In addition, variance analysis based on NPK indicated variation in sampling times, years, and fertilizer levels on ascorbate APX, LP, and SOD. Also, hybrids showed variations in grain yield and the activity of SOD. Years in fertilizer interaction had a variation on the activity of APX, the rate of LP, SOD, and grain yield. Years in hybrids in fertilizer levels interaction showed a variation on APX, and grain yield. For this reason, NPK fertilization can change variation on hybrids. The use of phosphorus and potassium fertilizer can change density on SOD on hybrids, but if only nitrogen is applied, it cannot affect SOD density on hybrids. Complete fertilizer (NPK fertilizer) can cause stability and balance in maize hybrids on SOD, APX, and LP. As a result of nutrient replenishment, different maize hybrids respond differently to abiotic stress, due to which nutrient replenishment can eliminate the quantitative and qualitative decrease in yield caused by extreme abiotic effects. The study of the activity of enzymes acts as a marker process at different phenological stages, as a result of which we can immediately obtain information about the current physiological condition of our plant population during the growing season. The different macronutrients are determinants in enzymatic responses. The examination focused on the optimal nutrient supply and the effect of constant high phosphorus and potassium, with different levels of nitrogen. ROS appear as a result of oxidative stresses, classified as a common defense response against abiotic stresses [32,33]. Correlation analysis showed that grain yield correlated with SOD during the use of the NPK fertilizer. Nitrogen fertilization cannot make corrections to yield with SOD, but phosphorus and potassium can correlate with yield and SOD. APX and LP correlated with yield due to nitrogen fertilization. In addition, nitrogen can make contact with APX, and the rate of LP in yield. However, under the same conditions, the phosphorus application fertilizer in bio fertilizer levels had the greatest effect on increasing the activity of polyphenol oxidase and superoxide enzymes [20]. Increasing the nitrogen and phosphorus availability in the soil, both as chemical fertilizer and as a bio fertilizer, positively affects antioxidant enzymes, proline, soluble protein proteins, and malondialdhyde (MDA). Therefore, one of the metabolic responses of plants under environmental stress is the increase in the synthesis of soluble proteins, the accumulation of amino acids such as proline, which in the plant can lead to cell stability and maintenance of cell turpentine through osmotic regulation [34]. Based on the experimental results of Mao et al. [34], by providing optimal nutrient replenishment in the appropriate phenophase and observing the physiological processes of maize, a significant increase in the activity of SOD, CAT, POD, APX, and GR was measured in maize leaves, which increased the concentration of lipid peroxidation and its oxidation [35]. There was a strong correlation between early aging and N replenishment. The results obtained showed that the optimal amount of nitrogen was an effective method to prevent premature aging and provide stable maize yield [36]. Principal component analysis showed that NPK5 and N 5 had maximum stability and effect on yield. The activity of APX was the highest value in silking stage, and LP was in the V14 leaf stage. The correlation and principal component analysis showed that silking stage and the 14th leaf stage are the important stages for yield in maize and one must concentrate on these stages in the LP and APX to achieve maximum yield. On the other hand, the activity of SOD was the maximum value in the 14th leaf stage. In this case, control SOD in the 14th leaf stage can contribute to maximum yield performance. Zhang et al. [7] (using soil containing 0 (N0), 30 (N1), and 50 (N2) Kg/ha nitrogen) proposed that the higher N-dose (N2) increased the antioxidant enzymatic activity, which resulted in a decrease in the rate of lipid peroxidation concentration in maize. The activity of protective enzymes (peroxidase and superoxide dismutase enzymes) and the soluble protein content in the plant were significantly decreased in the control treatment, which led to significant leaf aging. At an N level of 247.5 kg ha−1, superoxide dismutase and peroxidase levels increased and MDA levels decreased, delaying the process of leaf aging in a later stage of development [37].
The plant used two systems (with enzyme, without enzyme) for defense in the activation of oxygen. Enzyme systems include SOD, APX, and LP. Complete fertilizer (NPK fertilizer) resulted in stability and balance in the activity of SOD, APX, and LP in maize. Correlation showed that increasing the activity of SOD caused decreasing yield of the maize hybrid. The 14th leaf stage is highly important to the rate of LP, the activity of APX, and SOD to achieve maximum maize grain yield production. Increasing the activity of antioxidant enzymes in conditions of low water stress can also effectively reduce the adverse effects of stress.

Author Contributions

Á.I. and J.N. supervised the experiment and wrote the manuscript, C.B. and A.S. (Adrienn Széles) and A.S. (Atala Szabó) performed the experiments and collected samples in the field, S.M.N.M. made a statistical analysis and reviewed the manuscript to submit, B.T. made the figures and reviewed the manuscript. All authors have read and agreed to the published version of the manuscript.

Funding

Project no. TKP2020-IKA-04 has been implemented with the support provided from the National Research, Development and Innovation Fund of Hungary, financed under the 2020-4.1.1-TKP2020 funding scheme, and supported by the EFOP-3.6.3-VEKOP−16-2017-00008. project.

Institutional Review Board Statement

Not applicable.

Informed Consent Statement

Not applicable.

Data Availability Statement

The data presented in this study are available upon request from the first author.

Conflicts of Interest

The authors declare that they have no competing interest.

References

  1. Nagy, J. Maize Production; Akadémiai Kiadó: Budapest, Hunguary, 2006. [Google Scholar]
  2. Mousavi, S.M.N.; Illés, Á.; Bojtor, C.; Nagy, J. The impact of different nutritional treatments on maize hybrids morphological traits based on stability statistical methods. Emir. J. Food Agric. 2020, 32, 666–672. [Google Scholar] [CrossRef]
  3. Bojtor, C.; Illés, Á.; Nasir Mousavi, S.M.; Széles, A.; Tóth, B.; Nagy, J.; Marton, C.L. Evaluation of the Nutrient Composition of Maize in Different NPK Fertilizer Levels Based on Multivariate Method Analysis. Int. J. Agron. 2021, 2021. [Google Scholar] [CrossRef]
  4. Parida, A.K.; Das, A.B. Salt tolerance and salinity effects on plants: A review. Ecotoxicol. Environ. Saf. 2005, 60, 324–349. [Google Scholar]
  5. Noctor, G.; Foyer, C.H. Ascorbate and glutathione: Keeping active oxygen under control. Annu. Rev. Plant Biol. 1998, 49, 249–279. [Google Scholar]
  6. Gratão, P.L.; Polle, A.; Lea, P.J.; Azevedo, R.A. Making the life of heavy metal-stressed plants a little easier. Funct. Plant Biol. 2005, 32, 481–494. [Google Scholar]
  7. Zhang, X.; Ervin, E.; Evanylo, G.; Sherony, C.; Peot, C. Biosolids impact on tall fescue drought resistance. J. Residuals Sci. Technol. 2005, 2, 174–180. [Google Scholar]
  8. Choudhury, F.K.; Rivero, R.M.; Blumwald, E.; Mittler, R. Reactive oxygen species, abiotic stress and stress combination. Plant J. 2017, 90, 856–867. [Google Scholar] [PubMed]
  9. Jubany-Marí, T.; Munné-Bosch, S.; López-Carbonell, M.; Alegre, L. Hydrogen peroxide is involved in the acclimation of the Mediterranean shrub, Cistus albidus L., to summer drought. J. Exp. Bot. 2009, 60, 107–120. [Google Scholar]
  10. Banu, M.N.A.; Hoque, M.A.; Watanabe-Sugimoto, M.; Matsuoka, K.; Nakamura, Y.; Shimoishi, Y.; Murata, Y. Proline and glycinebetaine induce antioxidant defense gene expression and suppress cell death in cultured tobacco cells under salt stress. J. Plant Physiol. 2009, 166, 146–156. [Google Scholar] [PubMed]
  11. Hozayn, M.; Qados, A.A. Magnetic water application for improving wheat (Triticum aestivum L.) crop production. Agric. Biol. J. N. Am. 2010, 1, 677–682. [Google Scholar]
  12. Cakmak, T.; Cakmak, Z.E.; Dumlupinar, R.; Tekinay, T. Analysis of apoplastic and symplastic antioxidant system in shallot leaves: Impacts of weak static electric and magnetic field. J. Plant Physiol. 2012, 169, 1066–1073. [Google Scholar]
  13. Vasconcelos, A.C.F.D.; Zhang, X.; Ervin, E.H.; Kiehl, J.D.C. Enzymatic antioxidant responses to biostimulants in maize and soybean subjected to drought. Sci. Agric. 2009, 66, 395–402. [Google Scholar]
  14. Tittal, M.; Mir, R.A.; Jatav, K.S.; Agarwal, R.M. Supplementation of potassium alleviates water stress-induced changes in Sorghum bicolor L. Physiol. Plant. 2021, 172, 1149–1161. [Google Scholar]
  15. Ahmad, P.; Jaleel, C.A.; Salem, M.A.; Nabi, G.; Sharma, S. Roles of enzymatic and nonenzymatic antioxidants in plants during abiotic stress. Crit. Rev. Biotech. 2010, 30, 161–175. [Google Scholar]
  16. Gill, S.S.; Tuteja, N. Reactive oxygen species and antioxidant machinery in abiotic stress tolerance in crop plants. Plant Physiol. Biochem. 2010, 48, 909–930. [Google Scholar] [PubMed]
  17. Sharma, P.; Jha, A.B.; Dubey, R.S.; Pessarakli, M. Reactive oxygen species, oxidative damage, and antioxidative defense mechanism in plants under stressful conditions. J. Bot. 2012, 2012, 26. [Google Scholar] [CrossRef] [Green Version]
  18. Das, K.; Roychoudhury, A. Reactive oxygen species (ROS) and response of antioxidants as ROS-scavengers during environmental stress in plants. Front. Environ. Sci. 2014, 2, 53. [Google Scholar]
  19. Jiang, Z.W.; Lin, W.X.; Li, Y.Z.; Zhuo, C.Y.; Yang, H.J.; Xie, H.A. Effects of nitrogen fertilizer rates on some physiological characteristics of ratoon rice. Fujian J. Agric. Sci. 2005, 20, 168–171. [Google Scholar]
  20. Zhang, L.X.; Li, S.X.; Zhang, H.; Liang, Z.S. Nitrogen rates and water stress effects on production, lipid peroxidation and antioxidative enzyme activities in two maize (Zea mays L.) genotypes. J. Agron. Crop Sci. 2007, 193, 387–397. [Google Scholar]
  21. Illes, A.; Bojtor, C.; Szeles, A.; Mousavi, S.M.N.; Toth, B.; Nagy, J. Analyzing the effect of intensive and low-input agrotechnical support for the physiological, phenometric, and yield parameters of different maize hybrids using multivariate statistical methods. Int. J. Agron. 2021, 2021. [Google Scholar] [CrossRef]
  22. Sudhakar, C.; Lakshmi, A.; Giridarakumar, S. Changes in the antioxidant enzyme efficacy in two high yielding genotypes of mulberry (Morus alba L.) under NaCl salinity. Plant Sci. 2001, 161, 613–619. [Google Scholar]
  23. Heath, R.L.; Packer, L. Photoperoxidation in isolated chloroplasts: I. Kinetics and stoichiometry of fatty acid peroxidation. Arch. Biochem. Biophys. 1968, 125, 189–198. [Google Scholar] [PubMed]
  24. Nakano, Y.; Asada, K. Hydrogen peroxide is scavenged by ascorbate-specific peroxidase in spinach chloroplasts. Plant Cell Physiol. 1981, 22, 867–880. [Google Scholar]
  25. Janda, T.; Szalai, G.; Tari, I.; Paldi, E. Hydroponic treatment with salicylic acid decreases the effects of chilling injury in maize (Zea mays L.) plants. Planta 1999, 208, 175–180. [Google Scholar]
  26. Giannopolitis, C.N.; Ries, S.K. Superoxide dismutases: I. Occurrence in higher plants. Plant Physiol. 1977, 59, 309–314. [Google Scholar]
  27. Beyer, W.F., Jr.; Fridovich, I. Assaying for superoxide dismutase activity: Some large consequences of minor changes in conditions. Anal. Biochem. 1987, 161, 559–566. [Google Scholar] [CrossRef]
  28. Fisher, R.A. Statistical methods for research workers. In Breakthroughs in Statistics; Springer: New York, NY, USA, 1992; pp. 66–70. [Google Scholar]
  29. Tukey, J.W. Comparing individual means in the analysis of variance. Biometrics 1949, 5, 99–114. [Google Scholar] [CrossRef]
  30. Meyers, L.S.; Gamst, G.; Guarino, A.J. Applied Multivariate Research: Design and Interpretation; Sage: Thousand Oaks, CA, USA, 2016. [Google Scholar]
  31. Li, J.; Linear, R.R. Principal Component Analysis. Multivariate Statistics; Springer: Berlin, Germany, 2014; Volume 487, pp. 163–183. [Google Scholar]
  32. Gossett, D.R.; Millhollon, E.P.; Lucas, M.C. Antioxidant response to NaCl stress in salt-tolerant and salt-sensitive cultivars of cotton. Crop Sci. 1994, 34, 706–714. [Google Scholar]
  33. Vranová, E.; Inzé, D.; Van Breusegem, F. Signal transduction during oxidative stress. J. Exp. Bot. 2002, 53, 1227–1236. [Google Scholar]
  34. Mao, S.; Islam, M.R.; Hu, Y.; Qian, X.; Chen, F.; Xue, X. Antioxidant enzyme activities and lipid peroxidation in corn (Zea mays L.) following soil application of superabsorbent polymer at different fertilizer regimes. Afr. J. Biotechnol. 2011, 10, 10000–10008. [Google Scholar]
  35. Liu, Y.; Wang, R.; Hua, L.; Xie, Z.; Chen, Y. Effects of N application rates on early senescence of spring maize. J. Anhui Agric. Univ. 2011, 42, 539–543. [Google Scholar]
  36. Mousavi, S.M.N.; Nagy, J. Evaluation of plant characteristics related to grain yield of FAO410 and FAO340 hybrids using regression models. Cereal Res. Commun. 2021, 49, 161–169. [Google Scholar]
  37. Liu, Y.; Wang, R.; Hua, L.; Xie, Z. Effects of N applied rate on leaf senescence and protective enzyme system at later growth stage of maize. J. Maize Sci. 2012, 20, 124–127. [Google Scholar]
Figure 1. Temperatures (°C) and precipitation (mm) at the Látókép Experimental Station of the University of Debrecen (2019).
Agronomy 11 02129 g001
Figure 2. Temperatures (°C) and precipitation (mm) at the Látókép Experimental Station of the University of Debrecen (2020).
Agronomy 11 02129 g002
Figure 3. Correlation analysis (A) correlation between N fertilizer and indices, (B) correlation between NPK fertilizer and indices. (Ascorbate peroxidase (APX), lipid peroxidation (LP), superoxide dismutase (SOD)) (N = 1881) (Blue dots: Points related to two variables).
Agronomy 11 02129 g003
Figure 4. Biplot of indices effect to grain yield (ascorbate peroxidase (APX), lipid peroxidation (LP), superoxide dismutase (SOD)) (N = 1881).
Agronomy 11 02129 g004
Figure 5. Biplot of the sampling times effect on (A) ascorbate peroxidase (APX), (B) the lipid peroxidation (LP), and (C) superoxide dismutase (SOD) (N = 1785).
Agronomy 11 02129 g005
Table 1. Tukey pairwise comparisons the effect of the different sampling time and years for the APX: ascorbate peroxidase, SOD: superoxide dismutase activity, and the LP: lipid peroxidation under control condition. Treatments with the same letter are not significantly different.
ControlAPX (Units 1 μmol of Substrate/min)LP (MDA × μmol −1 FW)SOD (Units/mg FW)
2019V48.043 ± 1.664 B4.331 ± 0.731 B3.870 ± 0.475 B
V68.166 ± 1.599 B4.180 ± 0.922 A3.958 ± 0.534 A
V85.315 ± 0.914 C4.150 ± 0.933 C3.940 ± 0.555 A
V146.470 ± 2.281 B3.820 ± 0.961 C4.123 ± 0.588 A
Silking13.738 ± 4.371 A4.493 ± 0.582 A3.799 ± 0.393 B
2020V415.040 ± 5.249 B2.206 ± 0.604 C4.313 ± 0.283 B
V613.440 ± 3.484 A4.191 ± 0.925 A4.258 ± 0.362 B
V812.632 ± 2.701 A2.570 ± 0.396 B3.599 ± 0.592 C
V1412.109 ± 2.871 B4.133 ± 0.906 A4.270 ± 0.615 A
Silking12.237 ± 2.858 B2.787 ± 0.998 C2.538 ± 0.540 D
V4 = four-leaf stage, V6 = six-leaf stage, V8 = eight-leaf stage, V14 = fourteenth-leaf stage, Silking= silking phenological stage. APX (Unit) was defined as the amount of enzyme that oxidized 1 μmol of substrate/min), LP: lipid peroxidation (MDA μmol × g−1 FW), SOD (units/mg FW) FW: fresh weight (means ± Standard deviation).
Table 2. Tukey pairwise comparisons the effect of the different sampling time and years for the APX: ascorbate peroxidase, SOD: superoxide dismutase activity and the LP: lipid peroxidation under 300 kg ha−1 N fertilizer with high-level P and K. Treatments with the same letter are not significantly different.
N5APX (Units 1 μmol of Substrate/min)LP (MDA μmol × g−1 FW)SOD (Units/mg FW)
2019V47.694 ± 1.850 B4.511 ± 0.748 A3.694 ± 0.480 B
V67.923 ± 0.830 B3.958 ± 0.739 C3.929 ± 0.522 B
V85.617 ± 0.890 C4.499 ± 1.080 B3.722 ± 0.402 B
V147.340 ± 2.765 C4.013 ± 0.797 C3.987 ± 0.563 B
Silking12.385 ± 3.117 A4.131 ± 0.488 C3.725 ± 0.395 A
2020V417.356 ± 4.654 A2.111 ± 0.437 D4.199 ± 0.322 A
V613.427 ± 2.416 B4.680 ± 0.846 A4.153 ± 0.335 A
V812.497 ± 2.816 B2.692 ± 0.512 C3.366 ± 0.603 B
V1413.183 ± 2.566 B4.339 ± 1.002 A4.228 ± 0.581 AB
Silking12.452 ± 2.596 B3.079 ± 1.088 B2.464 ± 0.495 C
V4 = four-leaf stage, V6 = six-leaf stage, V8 = eight-leaf stage, V14 = fourteenth-leaf stage, Silking= silking phenological stage. APX (Unit) was defined as the amount of enzyme that oxidized 1 μmol of substrate/min), LP: Lipid peroxidation (MDA μmol × g−1 FW), SOD (units/mg FW), FW: fresh weight (means ± Standard deviation).
Table 3. Tukey pairwise comparisons the effect of the different sampling times and years for the APX: ascorbate peroxidase, SOD: superoxide dismutase activity and the LP: lipid peroxidation under 150 kg ha−1 N fertilizer with an optimal ratio of phosphorus (P) and potassium (K). Treatments with the same letter are not significantly different.
N5APX (Units 1 μmol of Substrate/min)LP (MDA × μmol g−1 FW)SOD (Units/mg FW)
2019V48.558 ± 1.734 B4.323 ± 0.835 ABC3.851 ± 0.383 AB
V69.403 ± 2.166 BCB4.347 ± 0.902 BC3.495 ± 0.609 C
V85.210 ± 1.152 D4.526 ± 0.743 AB3.870 ± 0.550 BC
V147.201 ± 1.732 D3.601 ± 0.874 C3.929 ± 0.575 ABC
Silking12.307 ± 4.122 A4.915 ± 0.554 A3.813 ± 0.354 A
2020V412.549 ± 2.273 AB2.328 ± 0.861 C4.492 ± 0.252 A
V614.650 ± 4.429 A4.254 ± 1.086 A4.070 ± 0.552 A
V814.543 ± 2.221A B2.534 ± 0.259 C3.367 ± 0.744 AB
V1413.732 ± 3.020 A4.392 ± 0.964 A3.856 ± 0.880
Silking11.124 ± 3.643 B3.402 ± 1.123 B2.397 ± 0.580 C
V4 = four-leaf stage, V6 = six-leaf stage, V8= eight-leaf stage, V14= fourteenth-leaf stage, Silking= silking phenological stage. APX (Unit) was defined as the amount of enzyme that oxidized 1 μmol of substrate/min), LP: lipid peroxidation (MDA μmol × g−1 FW), SOD (units/mg FW) (means ± Standard deviation).
Table 4. Variance analysis based on nitrogen fertilizer.
IndicesSourceDfF-ValueIndicesSourceDfF-Value
APXSampling times418.47 **SODSampling times441.87 **
years1258.33 **years12.74 ns
hybrids11.54 nshybrids10.00 ns
fertilizer levels210.56 **fertilizer levels210.42 **
years*hybrids19.49 **years*hybrids14.22 *
years*fertilizer levels225.47 **years*fertilizer levels21.03 ns
hybrids*fertilizer levels22.06 nshybrids*fertilizer levels21.56 ns
years*hybrids*fertilizer levels25.28 **years*hybrids*fertilizer levels21.52 ns
LPSampling times416.36 **YieldSampling times40.04 ns
years185.23 **years1197.03 **
hybrids10.02 nshybrids1267.87 **
fertilizer levels224.87 **fertilizer levels21555.13 **
years*hybrids12.43 nsyears*hybrids12.18 ns
years*fertilizer levels28.39 **years*fertilizer levels2135.69 **
hybrids*fertilizer levels20.18 nshybrids*fertilizer levels28.88 **
years*hybrids*fertilizer levels20.26 nsyears*hybrids*fertilizer levels24.86 **
APX: ascorbate peroxidase, LP: lipid peroxidation, SOD: superoxide dismutase (N = 1785, DF = degrees of freedom). * p < 0.05; ** p < 0.01, ns; no significant.
Table 5. Tukey grouping based on the applied nitrogen fertilizer.
Sampling TimeNMeanGrouping Sampling TimeNMeanGrouping
APXSilking6012.4743ASODV14604.18247A
V46012.4412AV6604.11783A
V66010.5225BV4603.97373A
V14609.4396BV8603.65131B
V8609.0024CSilking603.10474C
LPV6604.27245AYieldSilking609.90354A
V14604.04745AV14609.90354A
Silking603.55468BV8609.90354A
V8603.38393BV6609.90354A
V4603.22379BV4609.90354A
(Ascorbate peroxidase (APX), lipid peroxidation (LP), superoxide dismutase (SOD)) (N = 1881, Grouping = treatments with the same letter are not significantly different).
Table 6. Variance analysis based on NPK fertilizer.
IndicesSourceDfF-ValueIndicesSourceDfF-Value
APXSampling times49.25 **SODSampling times422.20 **
years1119.75 **years16.25 *
hybrids11.96 nshybrids114.01 **
fertilizer levels210.78 **fertilizer levels210.98 **
years*hybrids10.16 nsyears*hybrids11.16 ns
years*fertilizer levels210.61 **years*fertilizer levels23.87 *
hybrids*fertilizer levels26.86 **hybrids*fertilizer levels20.34 ns
years*hybrids*fertilizer levels25.15 **years*hybrids*fertilizer levels21.07 ns
LPSampling times49.33 **YieldSampling times40.004 ns
years1112.65 **years113.60 **
hybrids10.05 nshybrids153.28 **
fertilizer levels213.22 **fertilizer levels22144.33 **
years*hybrids12.00 nsyears*hybrids17.24 **
years*fertilizer levels221.46 **years*fertilizer levels277.30 **
hybrids*fertilizer levels20.36 nshybrids*fertilizer levels25.86 **
years*hybrids*fertilizer levels20.35 nsyears*hybrids*fertilizer levels29.76 **
(Ascorbate peroxidase (APX), lipid peroxidation (LP), superoxide dismutase (SOD)) (N = 1881, DF = degrees of freedom). * p < 0.05; ** p < 0.01, ns; no significant.
Table 7. Tukey grouping based on the NPK fertilizer.
Sampling TimeNMeanGrouping Sampling TimeNMeanGrouping
APXSilking6012.0936ASODV4604.18261A
V66011.4721BV14604.06520B
V46010.2217CV6603.91775B
V14609.5283CV8603.79509B
V8609.3180CSilking603.19803C
LPV6604.13320AYieldSilking608.91745A
Silking604.00025AV14608.91745A
V14603.91477BV8608.91745A
V8603.47665CV6608.91745A
V4603.31037CV4608.91745A
(ascorbate peroxidase (APX), lipid peroxidation (LP), superoxide dismutase (SOD)) (N = 1881, Grouping = treatments with the same letter are not significantly different).
Publisher’s Note: MDPI stays neutral with regard to jurisdictional claims in published maps and institutional affiliations.

