Article

Genotypic and Phenotypic Characterization of Lettuce Bacterial Pathogen Xanthomonas hortorum pv. vitians Populations Collected in Quebec, Canada

1
Saint-Jean-sur-Richelieu Research and Development Centre, Agriculture and Agri-Food Canada, 430 Gouin Blvd., St-Jean-sur-Richelieu, QC J3B 3E6, Canada
2
Department of Biology, Sherbrooke University, 2500 University Blvd., Sherbrooke, QC J1K 2R1, Canada
*
Author to whom correspondence should be addressed.
Agronomy 2021, 11(12), 2386; https://doi.org/10.3390/agronomy11122386
Submission received: 18 October 2021 / Revised: 16 November 2021 / Accepted: 19 November 2021 / Published: 24 November 2021
(This article belongs to the Special Issue Horticultural Genetics and Biotechnology)

Abstract

:
Bacterial leaf spot of lettuce, caused by Xanthomonas hortorum pv. vitians, is an economically important disease worldwide. For instance, it caused around 4 million CAD in losses in only a few months during the winter of 1992 in Florida. Because only one pesticide is registered to control this disease in Canada, the development of lettuce cultivars tolerant to bacterial leaf spot remains the most promising approach to reduce the incidence and severity of the disease in lettuce fields. The lack of information about the genetic diversity of the pathogen, however, impairs breeding programs, especially when disease resistance is tested on newly developed lettuce germplasm lines. To evaluate the diversity of X. hortorum pv. vitians, a multilocus sequence analysis was performed on 694 isolates collected in Eastern Canada through the summers of 2014 to 2017 and two isolates in 1996 and 2007. All isolates tested were clustered into five phylogroups. Six pathotypes were identified following pathogenicity tests conducted in greenhouses, but when phylogroups were compared with pathotypes, no correlation could be drawn. However, in vitro production of xanthan and xanthomonadins was investigated, and isolates with higher production of xanthomonadins were generally causing less severe symptoms on the tolerant cultivar Little Gem. Whole-genome sequencing was undertaken for 95 isolates belonging to the pathotypes identified, and de novo assembly made with reads unmapped to the reference strain’s genome sequence resulted in 694 contigs ranging from 128 to 120,795 bp. Variant calling was performed prior to genome-wide association studies computed with single-nucleotide polymorphisms (SNPs), copy-number variants and gaps. Polymorphisms with significant p-values were only found on the cultivar Little Gem. Our results allowed molecular identification of isolates likely to cause bacterial leaf spot of lettuce, using two SNPs identified through genome-wide association study.

1. Introduction

Plant pathogens use a wide array of pathogenesis mechanisms to infect their hosts. Many fungi and oomycetes invade plants via appressoria or enzymatic activity [1]. Viruses use vectors to reach host plants and enter them through damaged cells [2]. Contrastingly, bacteria often use a cell-communication system, known as quorum sensing, to coordinate colonization of hosts [3] and inject effector proteins in plant cells using diverse secretion systems [4] (for a more complete review, see Giraldo and Valent [5]). Members of the bacterial genus Xanthomonas, which possess type I to VI secretion systems [6], are divided into 27 species known to cause disease on many mono and dicotyledonous plants. Those species are further subdivided into pathovars to differentiate strains according to their pathogenicity on different host species. Pathovars can be further divided into pathotypes to differentiate strains within pathovars according to their pathogenicity on varieties of the same host species.
Xanthomonas campestris pv. vitians (Brown) Dye, also known as Xanthomonas hortorum pv. vitians, the causative agent of bacterial leaf spot of lettuce (BLS), is a rod-shaped, aerobic Gram-negative bacteria. It is non-sporulating and possesses one polar flagellum. The recently sequenced X. hortorum pv. vitians strain B07-007 has a chromosome and a plasmid of 5,175,249 and 75,655 bp, respectively (Genbank accessionS CP016878 and CP16879). This bacterium, similar to many other xanthomonads, secretes an exopolysaccharide called xanthan and produces brominated aryl-polyene pigments called xanthomonadins. Those two products, responsible for the yellow and mucoid aspects of colonies on solid media, play important roles in maintaining fitness and in the infection process [7,8].
Since its first report in South Carolina in 1918 [9], BLS has been reported in many countries, such as Australia [10], Brazil [11], France [12], Germany [10], India [13], Italy [14], Japan [11], South Africa [13], Turkey [15], 2000), the United States [16] and Venezuela [17]. In Canada, the first report went back to 1994 [18], and since then, the disease has been observed in many lettuce fields over the years.
Conflicting reports have been published on required environmental conditions for disease development [19]. The optimum temperature reported for outbreaks to occur varies from cold to warm, and Barak et al. [20] mentioned that humid conditions also help disease development. Although conditions for BLS to occur remain unclear, symptoms are easily distinguishable. They consist of water-soaked lesions scattered on leaves that later become necrotic and papery. V-shaped lesions near veins due to systemic infection can also be observed [21].
According to the Food and Agriculture Organisation of the United Nations, lettuce production almost doubled in the last 20 years, going from 14 million tons in 1994 to 27 million tons in 2018 [22]. With a farm gate value of more than 82 million CAD in 2019, lettuce was Canada’s fourth most grown vegetable, according to Statistics Canada [23]. In the United States of America, the value of production was established by the U. S. Department of Agriculture to be over 3 billion CAD in 2019 [24].
No chemicals were registered in Canada against BLS until July 2017. Currently, the only registered bactericide, Confine Extra (Winfield Solutions LLC, St-Paul, MN, USA), uses mono and di-potassium salts of phosphorous acid to induce host plant defence mechanisms. However, continuous use of the same bactericide could lead to resistance in the bacterial population [25,26]. Therefore, the development of tolerant cultivars of lettuce towards BLS is the most promising option for controlling the disease [27]. Consequently, knowledge of Xanthomonas hortorum pv. vitians pathovar diversity in lettuce fields in Canada is crucial to lettuce breeders in order to develop tolerant cultivars.
The goals of this study were to characterize the pathotypes of Xanthomonas hortorum pv. vitians sampled in lettuce fields in Quebec through genotypic and phenotypic analyses and to develop a much-needed early detection tool using molecular markers identified through next-generation sequencing that could be used for diagnostic purposes. Xanthomonadin and xanthan will also be measured to investigate any correlation with disease severity on three different lettuce cultivars.

2. Materials and Methods

2.1. Purification of Bacterial Isolates

Bacterial isolates were purified from symptomatic lettuces harvested by the company Phytodata Inc. (Sherrington, QC, Canada) in fields located in the Monteregie region, in Quebec, during the summers of 2014 to 2017. Upon reception of the samples, symptomatic leaves were washed with sterile water, and five discs were cut with a 1-cm diameter punch while ensuring that each leaf disc contained both healthy and diseased tissues. The discs were soaked in 70% ethanol for one minute and then washed for another minute with a 0.05% bleach solution. After being rinsed three times with sterile water, the discs were cut in half and transferred into 10 mL of saline solution (NaCl 0.85% w/v in distilled water), and then sonicated in a FS20H ultrasonic bath (Thermo Fisher Scientific, Waltham, MA, USA) for 5 min. One hundred microlitres of each suspension was spread out on Yeast Dextrose Carbonate (YDC) media [28] amended with cycloheximide (50 mg/L) (Sigma-Aldrich, St. Louis, MO, USA) and incubated at 28 °C until isolated yellow and mucoid colonies developed. Isolates of X. hortorum pv. vitians were purified by re-streaking single colonies on YDC media and stored at −80 °C in a preservation broth (Tryptic soy broth 30 g/L, glycerol 100 mL/L) until usage. The same protocol was used to purify the isolates VT106 and B07-007 back in 1996 and 2007, respectively, but the discs were macerated in saline solution for 2 h instead of being sonicated.

2.2. DNA Extraction and MultiLocus Sequence Analyses

A total of 5 mL of nutrient broth (Thermo Fisher Scientific, Waltham, MA, USA) was inoculated with a single colony and incubated overnight at 150 rpm at room temperature. A volume of 2 mL of bacterial culture was centrifuged (5000× g, 1 min), and DNA was extracted from pellets using a Norgen Bacterial Genomic DNA Purification kit (Norgen Biotek, Thorold, ON, Canada) following the manufacturer’s instructions. A total of 10 to 100 ng of DNA was used in a 50-µL PCR reaction using OneTaq® polymerase (New England Biolabs, Ipswich, MA, USA) and previously described primers [29] for internal regions of housekeeping genes gyrB, rpoD and dnaK and primers XanfyuA 4F 5′-AYTCSTACGTGCAGAGCCTG-3′ and XanfyuA3R 5′-CGTRTAGCCSGGCATCTTCA-3′ for partial housekeeping gene fyuA. PCR was performed in a SureCycler 8800 (Agilent Technologies, Santa Clara, CA, USA) and the conditions for the PCR reaction were as follows: 95 °C for 2 min followed by 30 cycles of 94 °C for 20 s, 54 °C for 30 s, 68 °C for 1 min and a final elongation at 68 °C for 10 min. The PCR products were visualized on 0.7% agarose gels (BioShop Canada Inc., Burlington, ON, Canada) containing SYBR Safe dye (Invitrogen, Burlington, ON, Canada). The amplicons were Sanger-sequenced at the Centre d’expertise et de services Génome Québec (Montreal, QC, Canada). The sequences were verified using SeqMan Pro (DNASTAR, Madison, WI, USA), and a set of concatenated sequences was generated with the above-mentioned housekeeping genes. A phylogenetic tree was constructed by MEGA 5.1 (Pennsylvania State University, State College, PA, USA) with the neighbour-joining method using a bootstrap value of 1000. Reference strains X. axonopodis (CFBP 4924), X. axonopodis pv. alfalfae (CFBP 3836), X. axonopodis pv. allii (CFBP 6107), X. axonopodis pv. begonia (CFBP 2524), X. axonopodis pv. glycines (CFBP 2526), X. axonopodis pv. maculifoliigardeniae (CFBP 1155), X. axonopodis pv. malvacearum (CFBP 7153 and CFBP 2530), X. axonopodis pv. phaseoli (CFBP 2534), X. axonopodis pv poinsettiicola (CFBP 7277), X. axonopodis pv. vasculorum (CFBP 5823), X. axonopodis pv. vignicola (CFBP 7112), X. axonopodis pv. vitians (CFBP 2538), X. campestris pv. aberrans (CFBP 6865), X. campestris pv. barbareae (CFBP 5825), X. campestris pv. betae (CFBP 5852), X. campestris pv. bilvae (CFBP 3136), X. campestris pv. campestris (CFBP 5241), X. campestris pv. esculenti (CFBP 5857), X. campestris pv. incanae (CFBP 2527), X. campestris pv. mangiferaeindicae (CFBP 1716), X. campestris pv. paulliniae (CFBP 5862), X. campestris pv. raphani (CFBP 5827), X. campestris pv. viegasii (CFBP 5866 and CFBP 4477), X. hortorum pv. carotae (GenBank CM002307.1), X. hortorum pv. hederae (CFBP 4925), X. hortorum pv. perlargonii (CFBP 2533), X. hortorum pv. taraxaci (CFBP 410) and X. hortorum pv. vitians (NCPPB 2248) were included in this study. These reference strains were obtained from CIRM-CFBP: International Center for Microbial Resources (https://www6.inra.fr/cirm_eng/, accessed on 8 March 2017) or the National Collection of Plant Pathogenic Bacteria. Sequences of X. hortorum pv. carotae were retrieved from GenBank (accession no. CM002307.1). The nomenclature of Vauterin et al. was used [30].

2.3. Pathogenicity Assay

Seeds of three lettuce cultivars previously classified as susceptible (Paris Island Cos), intermediate (Romora) and tolerant (Little Gem) [31,32] (D. Rekika, pers. comm.) were sown in 128 cells plates with ProMix (ProMix BX Mycorrhizae, Premier Tech Biotechnologies, Rivière-du-Loup, QC, Canada) and grown in an Adaptis germinator (Conviron, Winnipeg, MB, Canada) for 14 days at 18 °C, at 75% humidity and a 16 h photoperiod at a light intensity of 400 μmol/m2/s. The plants were then transplanted in 10 cm plastic pots, fertilized with 10-52-10 fertilizer (Master Plant-Prod Inc., Brampton, ON, Canada) and cultivated in the same humidity and photoperiod conditions but at 20 °C for three days. Bacterial suspensions of 170 X. hortorum pv. vitians isolates were prepared in saline solution (0.85% w/v) by adjusting to 1 × 10⁸ CFU/mL. Three plants from each cultivar were spray-inoculated on both abaxial and adaxial leaf surfaces until run-off using a Phantom 100 air brush (Createx Colors, East Granby, CT, USA). X. hortorum pv. vitians strain B07-007 was used as positive control and sterile saline solution as the negative control. Pathogenicity was tested in parallel on tobacco leaves (Nicotiana tabacum L. cv. Xanthi) by injecting bacterial suspensions into the abaxial side of leaves with 1 mL needleless syringes (Terumo, Tokyo, Japan) until the solution infiltrated an area of approximately 2 cm in diameter. Inoculated plants were kept for two hours at room temperature and then incubated in a greenhouse at 24 °C during the daytime and 19 °C during the nighttime, at 70% relative humidity. In the first two days after inoculation, the lights were turned off, shade houses were deployed and misting was triggered every 30 min, for 20 s, from 8 am to 8 pm. From the third day, a 16 h photoperiod without shade houses was applied daily, and misting was triggered every hour. During the whole study, the plants were fertilized once a week with 6-11-31 fertilizer (Master Plant-Prod Inc., Brampton, ON, Canada) and 15.5-0-0 fertilizer (Yara International, Oslo, Norway). The severity of symptoms was evaluated 8 to 10 days after inoculation using a disease scale (Table 1). The scores were then converted to parametric values to conform to other analyses (Supplementary Table S2). All statistical analyses were conducted with the add-in software XLSTAT 2010 (Addinsoft, Paris, France).

2.4. Purification of Xanthan

The purification of xanthan was carried out with 8, 16, 8 and 16 isolates from previously identified pathotypes III, IV, V and VI, respectively (the number of isolates in pathotype I, 4, was too low for this analysis), using the protocol [33]. Briefly, 90 mL of broth (glucose 25 g/L, yeast extract 3 g/L, KH2PO4 2 g/L and MgSO4 1 g/L) were inoculated with 10 mL of bacterial suspension adjusted to 1 × 10⁸ CFU/mL in saline solution before being incubated at 150 rpm for 96 h at 28 °C. After incubation, 10 mL of culture was centrifuged for 1 h at 12,500× g. Both the pellet and the supernatant were kept separate. For the supernatant, isopropanol (30 mL) was added and mixed, followed by incubation on ice for 30 min prior to centrifugation for 1 h 30 at 9000× g. The supernatant was discarded, and both pellets were heated at 60 °C for 2 h to reduce water content and then dried in a vacuum bell containing Drierite desiccant (W A Hammond Drierite Co., Ltd., Xenia, OH, USA) for four days at room temperature. Xanthan production was expressed in grams of xanthan produced per gram of biomass.

2.5. Purification of Xanthomonadins

The protocol described by He et al. [7] was used to purify xanthomonadins. Briefly, 50 mL of no. 1 nutrient broth (Sigma-Aldrich, St. Louis, MO, USA) was inoculated with a single colony and incubated at 150 rpm, 28 °C, until the stationary phase (approximately 32 h). Cultures were adjusted to an optical density of 1.0 at 600 nm. A total of 100 µL was used to make 10-fold dilutions in sterile water. The diluted bacterial suspensions of 10−4 to 10−7 were respectively plated on Pseudomonas Agar F medium (Becton, Dickinson and Company, Franklin Lakes, NJ, USA). A total of 5 mL of adjusted cultures were centrifuged (5 min, 4000× g). The pellets were weighed, suspended with one mL of methanol and heated to 100 °C for 10 min [34]. The methanol extracts were centrifuged at 5000× g for 5 min. The supernatant was measured for optical density at 441 nm [35] on a Nanodrop 2000c (Thermo Fisher Scientific, Waltham, MA, USA).

2.6. Bacterial Genome Sequencing & De Novo Assembly

Ninety-six libraries for different isolates were prepared with a Nextera XT DNA library Prep Kit (Illumina, San Diego, CA, USA) following the manufacturer’s instructions. Library normalisation was realized using the NEBNext Library Quant Kit for Illumina (New England Biolabs, Ipswich, MA, USA). Sequencing was performed on an Illumina MiSeq instrument using MiSeq Reagent Kit v3 to generate 2 × 300 bp paired-end sequence reads. Reads were filtered for a quality score over 15 with Trimmomatic [36] (refer to supplemental data S1 for sequence quality evaluated with FASTQC [37] and MutliQC [38], Genbank BioProject PRJNA777907). After mapping with BWA 0.7.12 [39] against the reference genome sequences of Xanthomonas hortorum pv. vitians B07-007 (GenBank accession no. CP016878.1 (genome) and CP016879.1 (plasmid)), unmapped reads were used to perform a de novo assembly with SPAdes 3.12 [40] to investigate regions in the isolates’ genomes absent from the reference sequences.

2.7. Genome-Wide Association Study (GWAS)

Reads were mapped once again to the reference strain Xanthomonas hortorum pv. vitians strain B07-007 and to the previously generated de novo contigs (Supplementary data S2), using BWA. Variant calling was performed with Samtools 1.4.1 [41,42] following the WGS/WES Mapping to Variant Calls—Version 1.0 workflow available online (https://www.htslib.org/workflow/wgs-call.html, (accessed on 28 March 2017)) and associations between genotypes and observed phenotypes were analyzed using PLINK 1.07 software [43] with three datasets corresponding to single-nucleotide polymorphisms (SNP) identified with Samtools, gaps, which are represented by stretches of nucleotides with a coverage of zero present on sequenced genomes and copy number variants (CNV) obtained with CNV-Seq [44].

2.8. Diagnostic Tools

Two rhAmp® assays were developed with the rhAmp® (IDT, Coralville, IA, USA) Genotyping Design Tool based on bi-allelic SNPs identified with PLINK. The first assay, called Genome590650, targeted the SNP located at the position 590,650 of the reference strain X. hortorum pv. vitians B07-007’s chromosome (GenBank accession no. CP016878.1), with a p-value of 2.84x10⁻¹³ (Design ID: CD.GT.QVVG1980.1; Allele-Specific Primer 1: /rhAmp-F/TGGAAGATTAAAGATCGTGTAATCGATrCACCT/GT3/; Allele-Specific Primer 2: /rhAmp-Y/TGGAAGATTAAAGATCGTGTAATCGAArCACCT/GT3/; Locus Specific Primer: GCTGCGTCAGCTGTCCTGrAATCC/GT1/), and the second assay called Contig245_549 targeted the SNP located at the position 549 of de novo contig 245, with a p-value of 5.62 × 10⁻¹¹ (Design ID: CD.GT.SWKH0204.1; Allele-Specific Primer 1: /rhAmp-F/TCCGATGCGAATCTCCTrAAGTC/GT3/; Allele-Specific Primer 2: /rhAmp-Y/TCCGATGCGAATCTCCCrAAGTC/GT3/; Locus Specific Primer: GCAACGACAGCAGTCTTTTGGrATGCA/GT3/). Quantitative PCR amplifications were performed on an Mx3000P qPCR system with MxPro qPCR software (Agilent Technologies, Santa Clara, CA, USA) following the instructions of the rhAmp® SNP Genotyping kit, using 10–100 ng of DNA. Amplification conditions as follows: 95 °C for 10 min followed by 40 cycles (95 °C, 10 s; 60 °C, 30 s; 68 °C 20 s). Seventy-five unsequenced isolates were tested.

3. Results

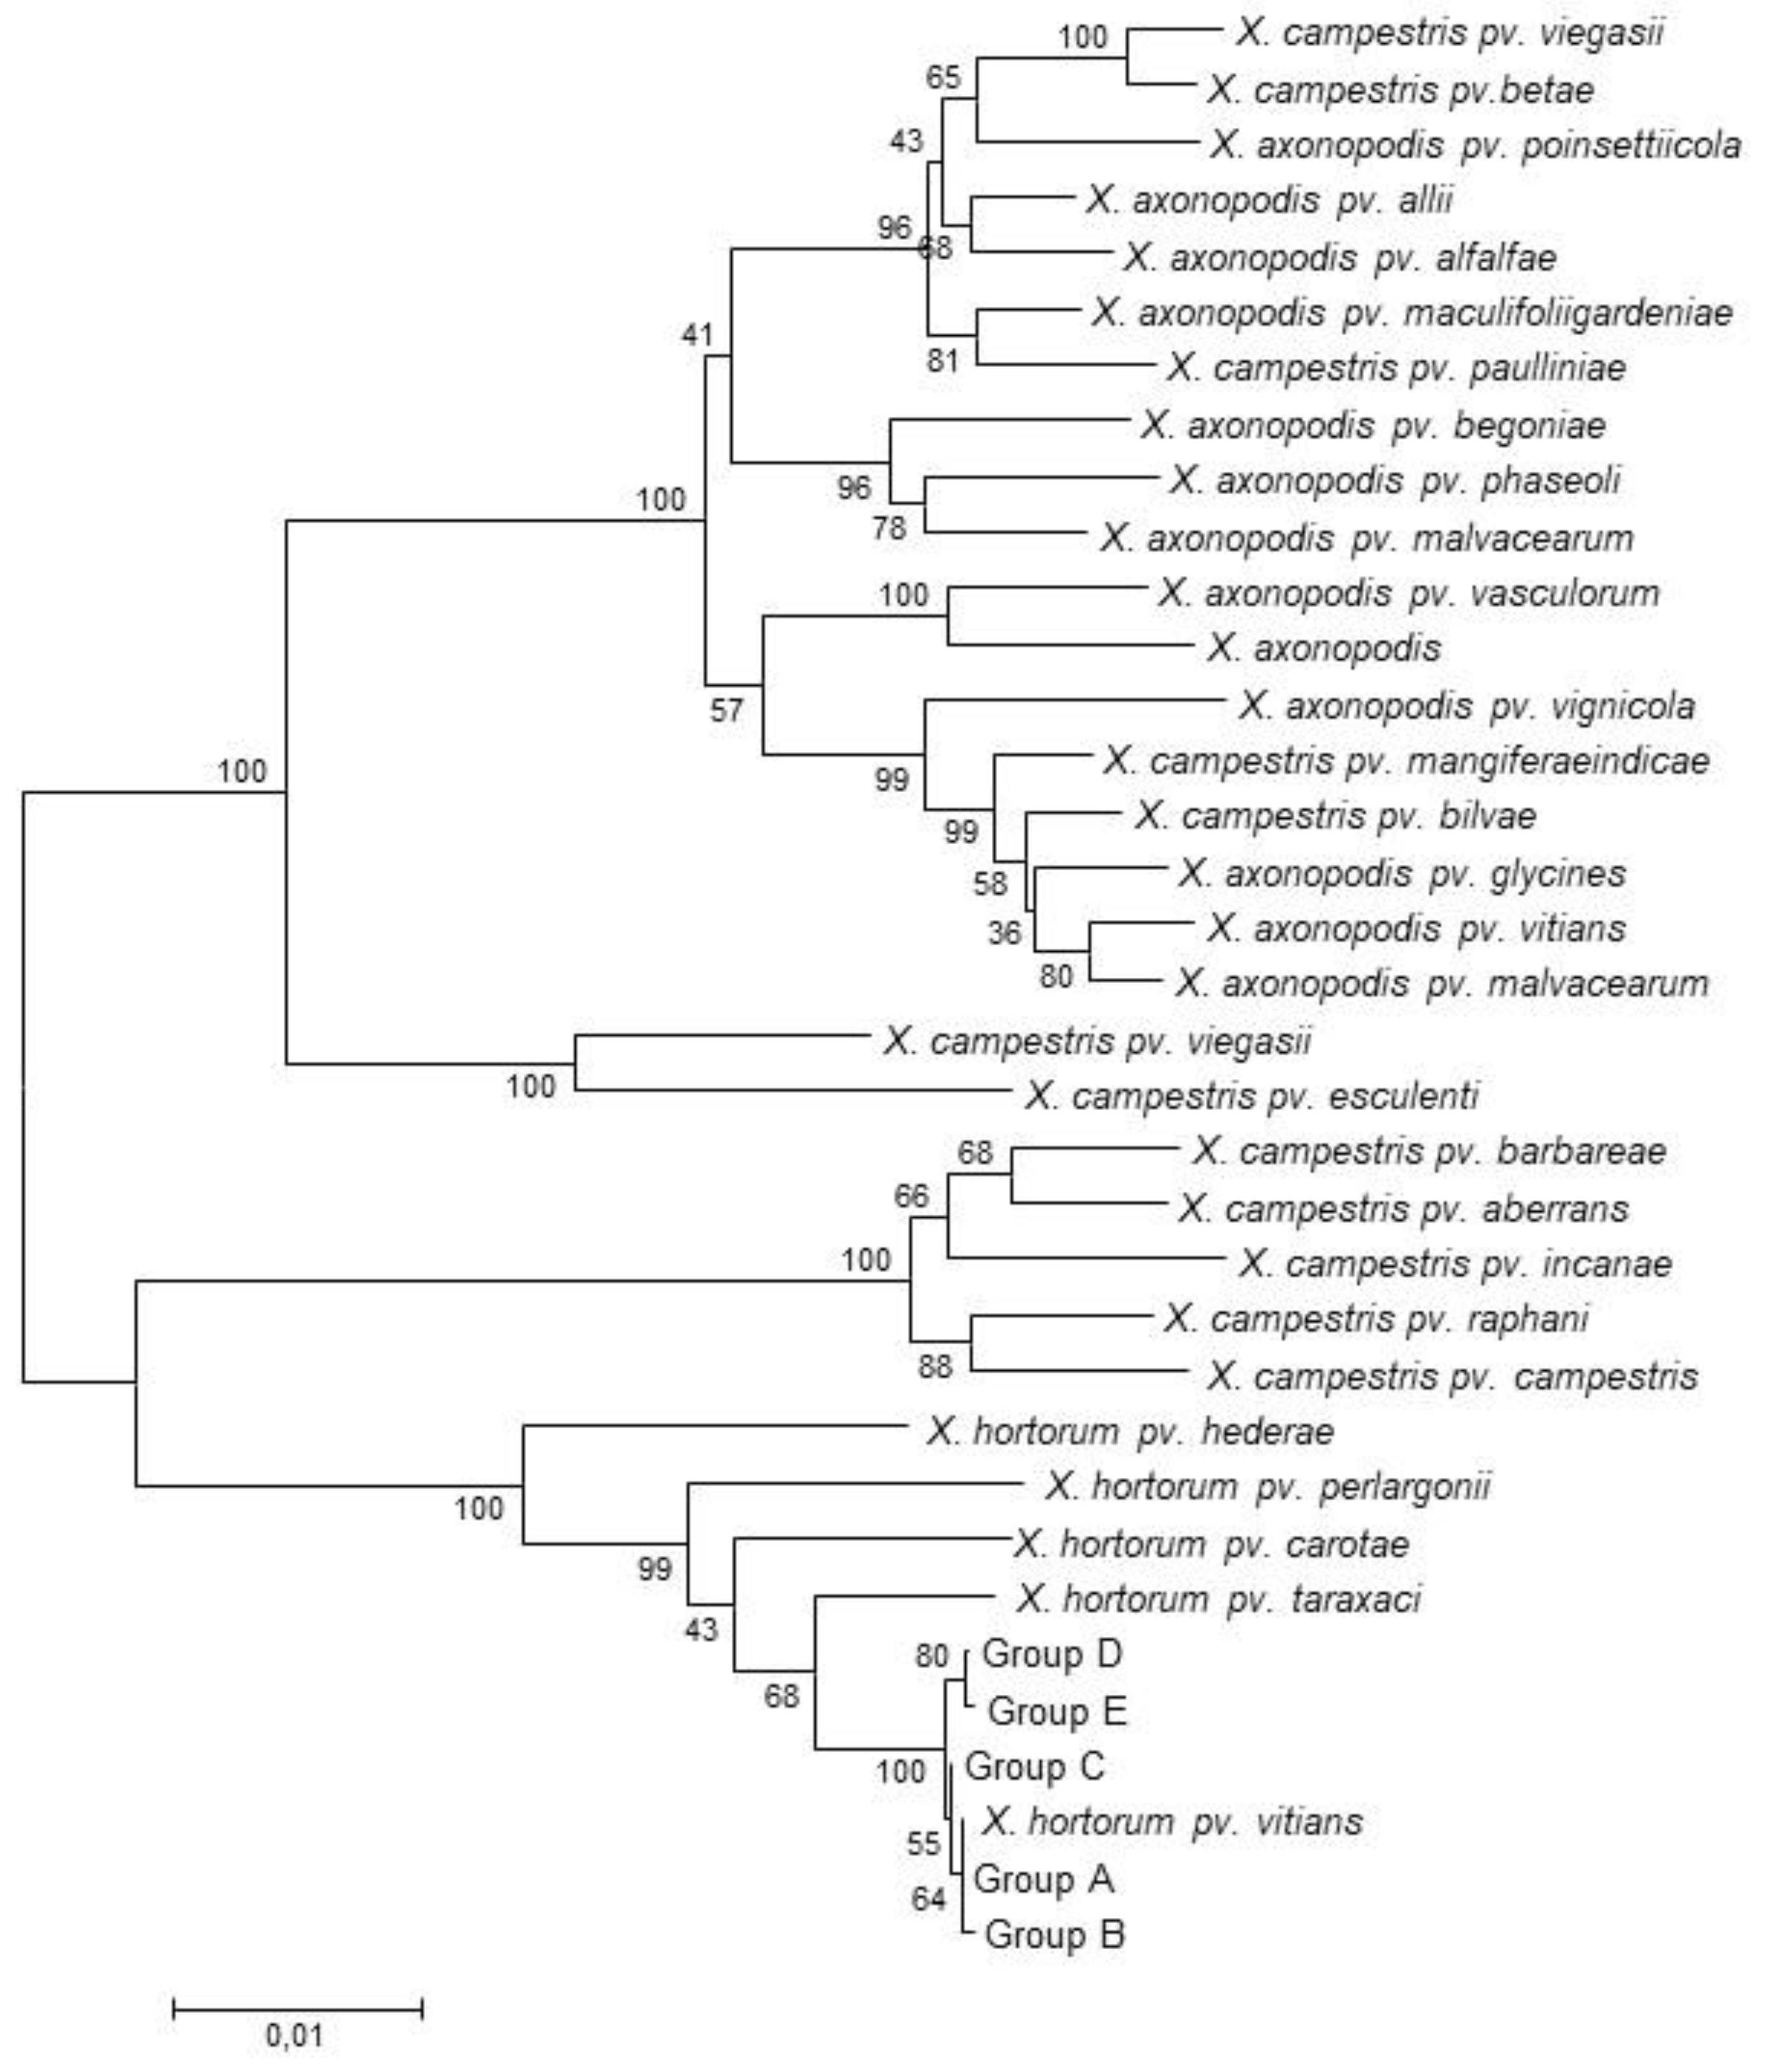
3.1. Multi Locus Sequence Analyses

Six hundred and ninety-four Xanthomonas hortorum pv. vitians isolates were collected between 2014 and 2017, and the strain B07-007 was isolated in 2007. Internal regions of the housekeeping genes fyuA, gyrB, rpoD and dnaK of all the isolates were amplified and sequenced. A neighbour-joining tree was generated with the concatenated sequences of purified isolates, along with the reference strains (Figure 1). The isolates were clustered into five distinct phylogroups, named A to E. Sequences of phylogroup A are identical to the sequence of the reference strain X. hortorum pv. vitians B07-007 while phylogroups B to E are all close to phylogroup A and to each other (Figure 1). Phylogroups A, B, C, D and E represent 427, 2, 21, 25 and 220 isolates, respectively. Although all phylogroups were present in 2014, only phylogroups A and E were observed in the following three years.

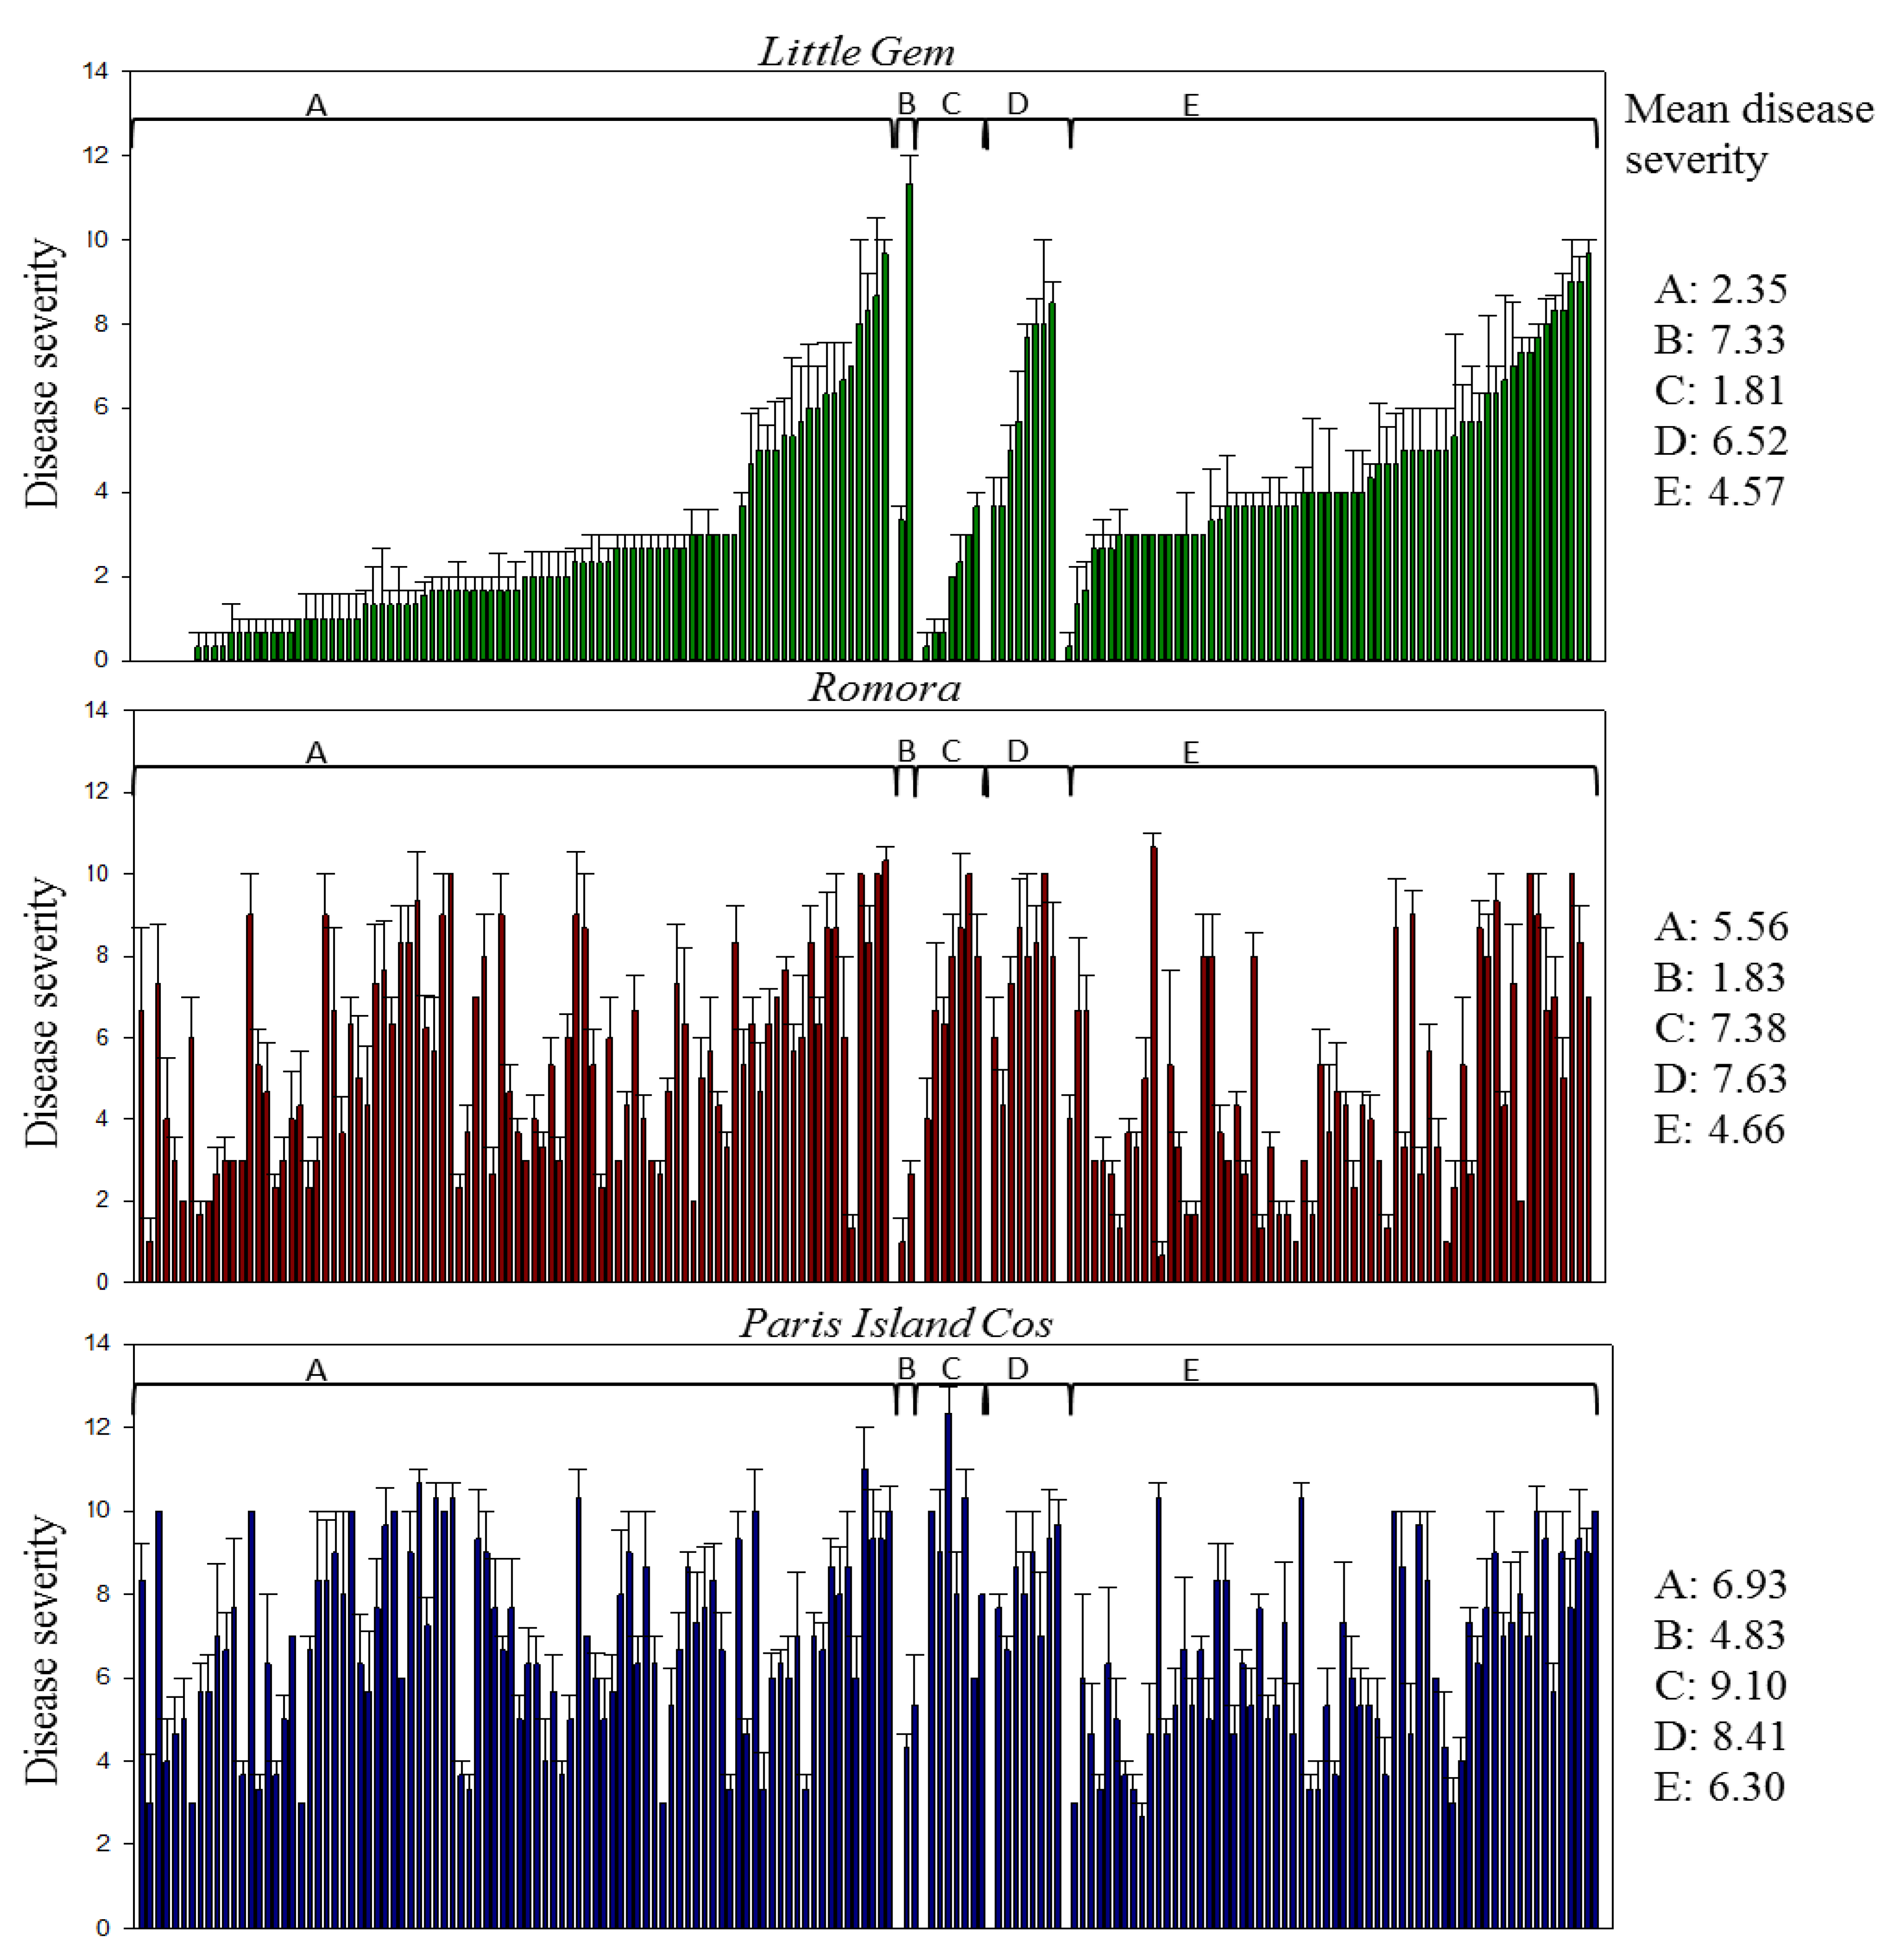
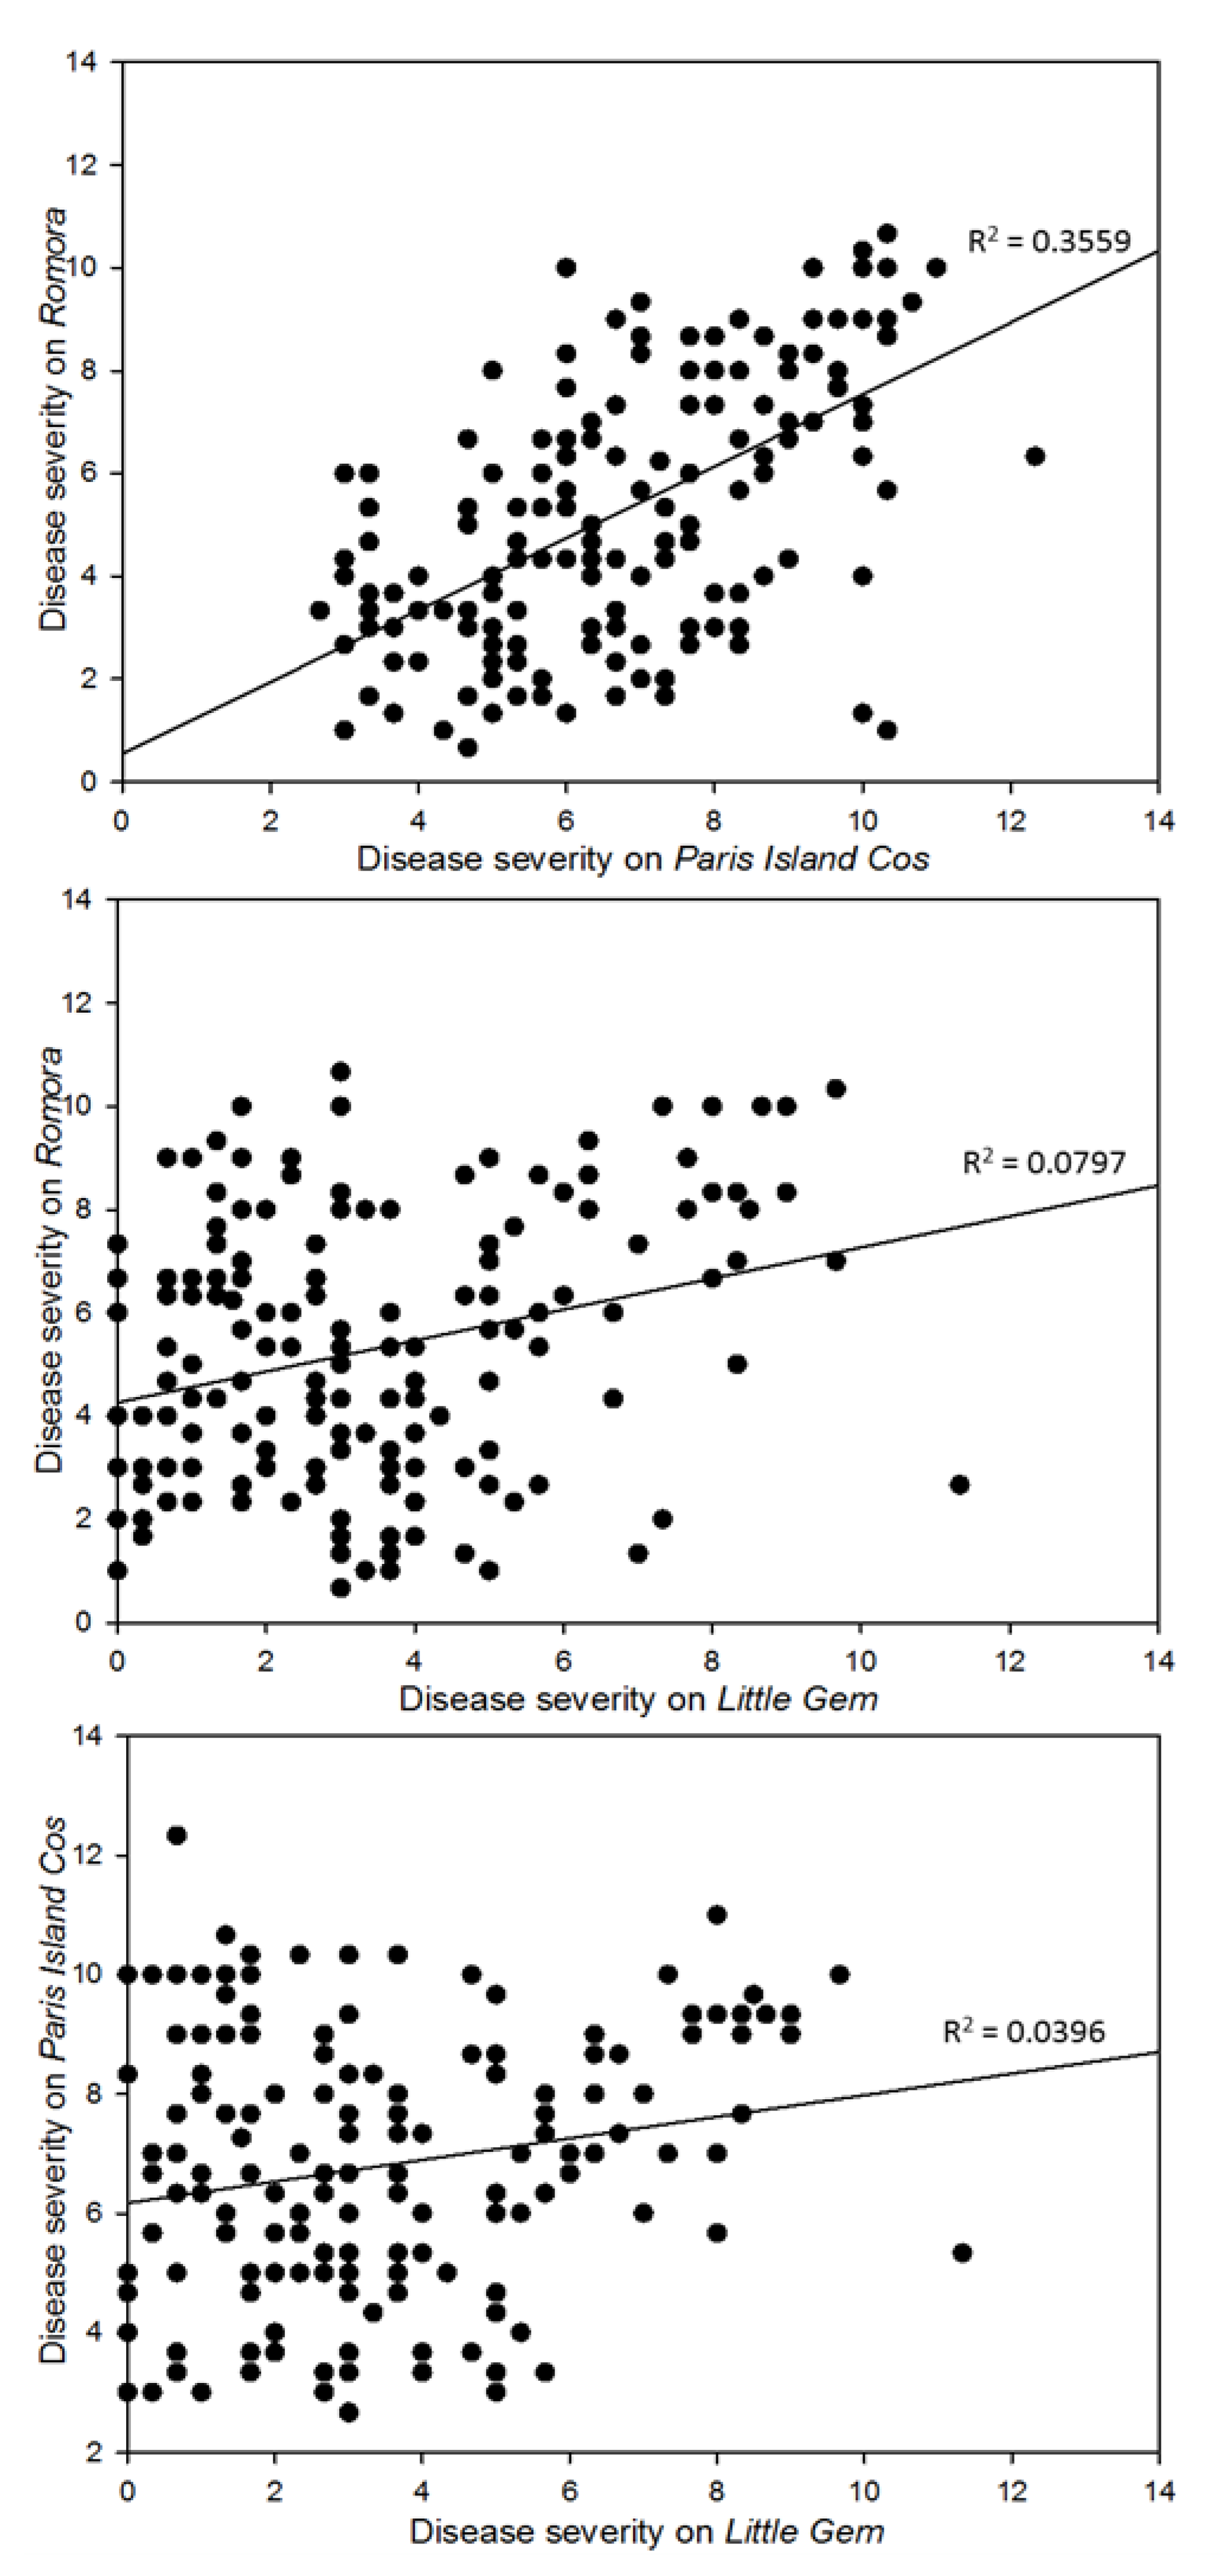
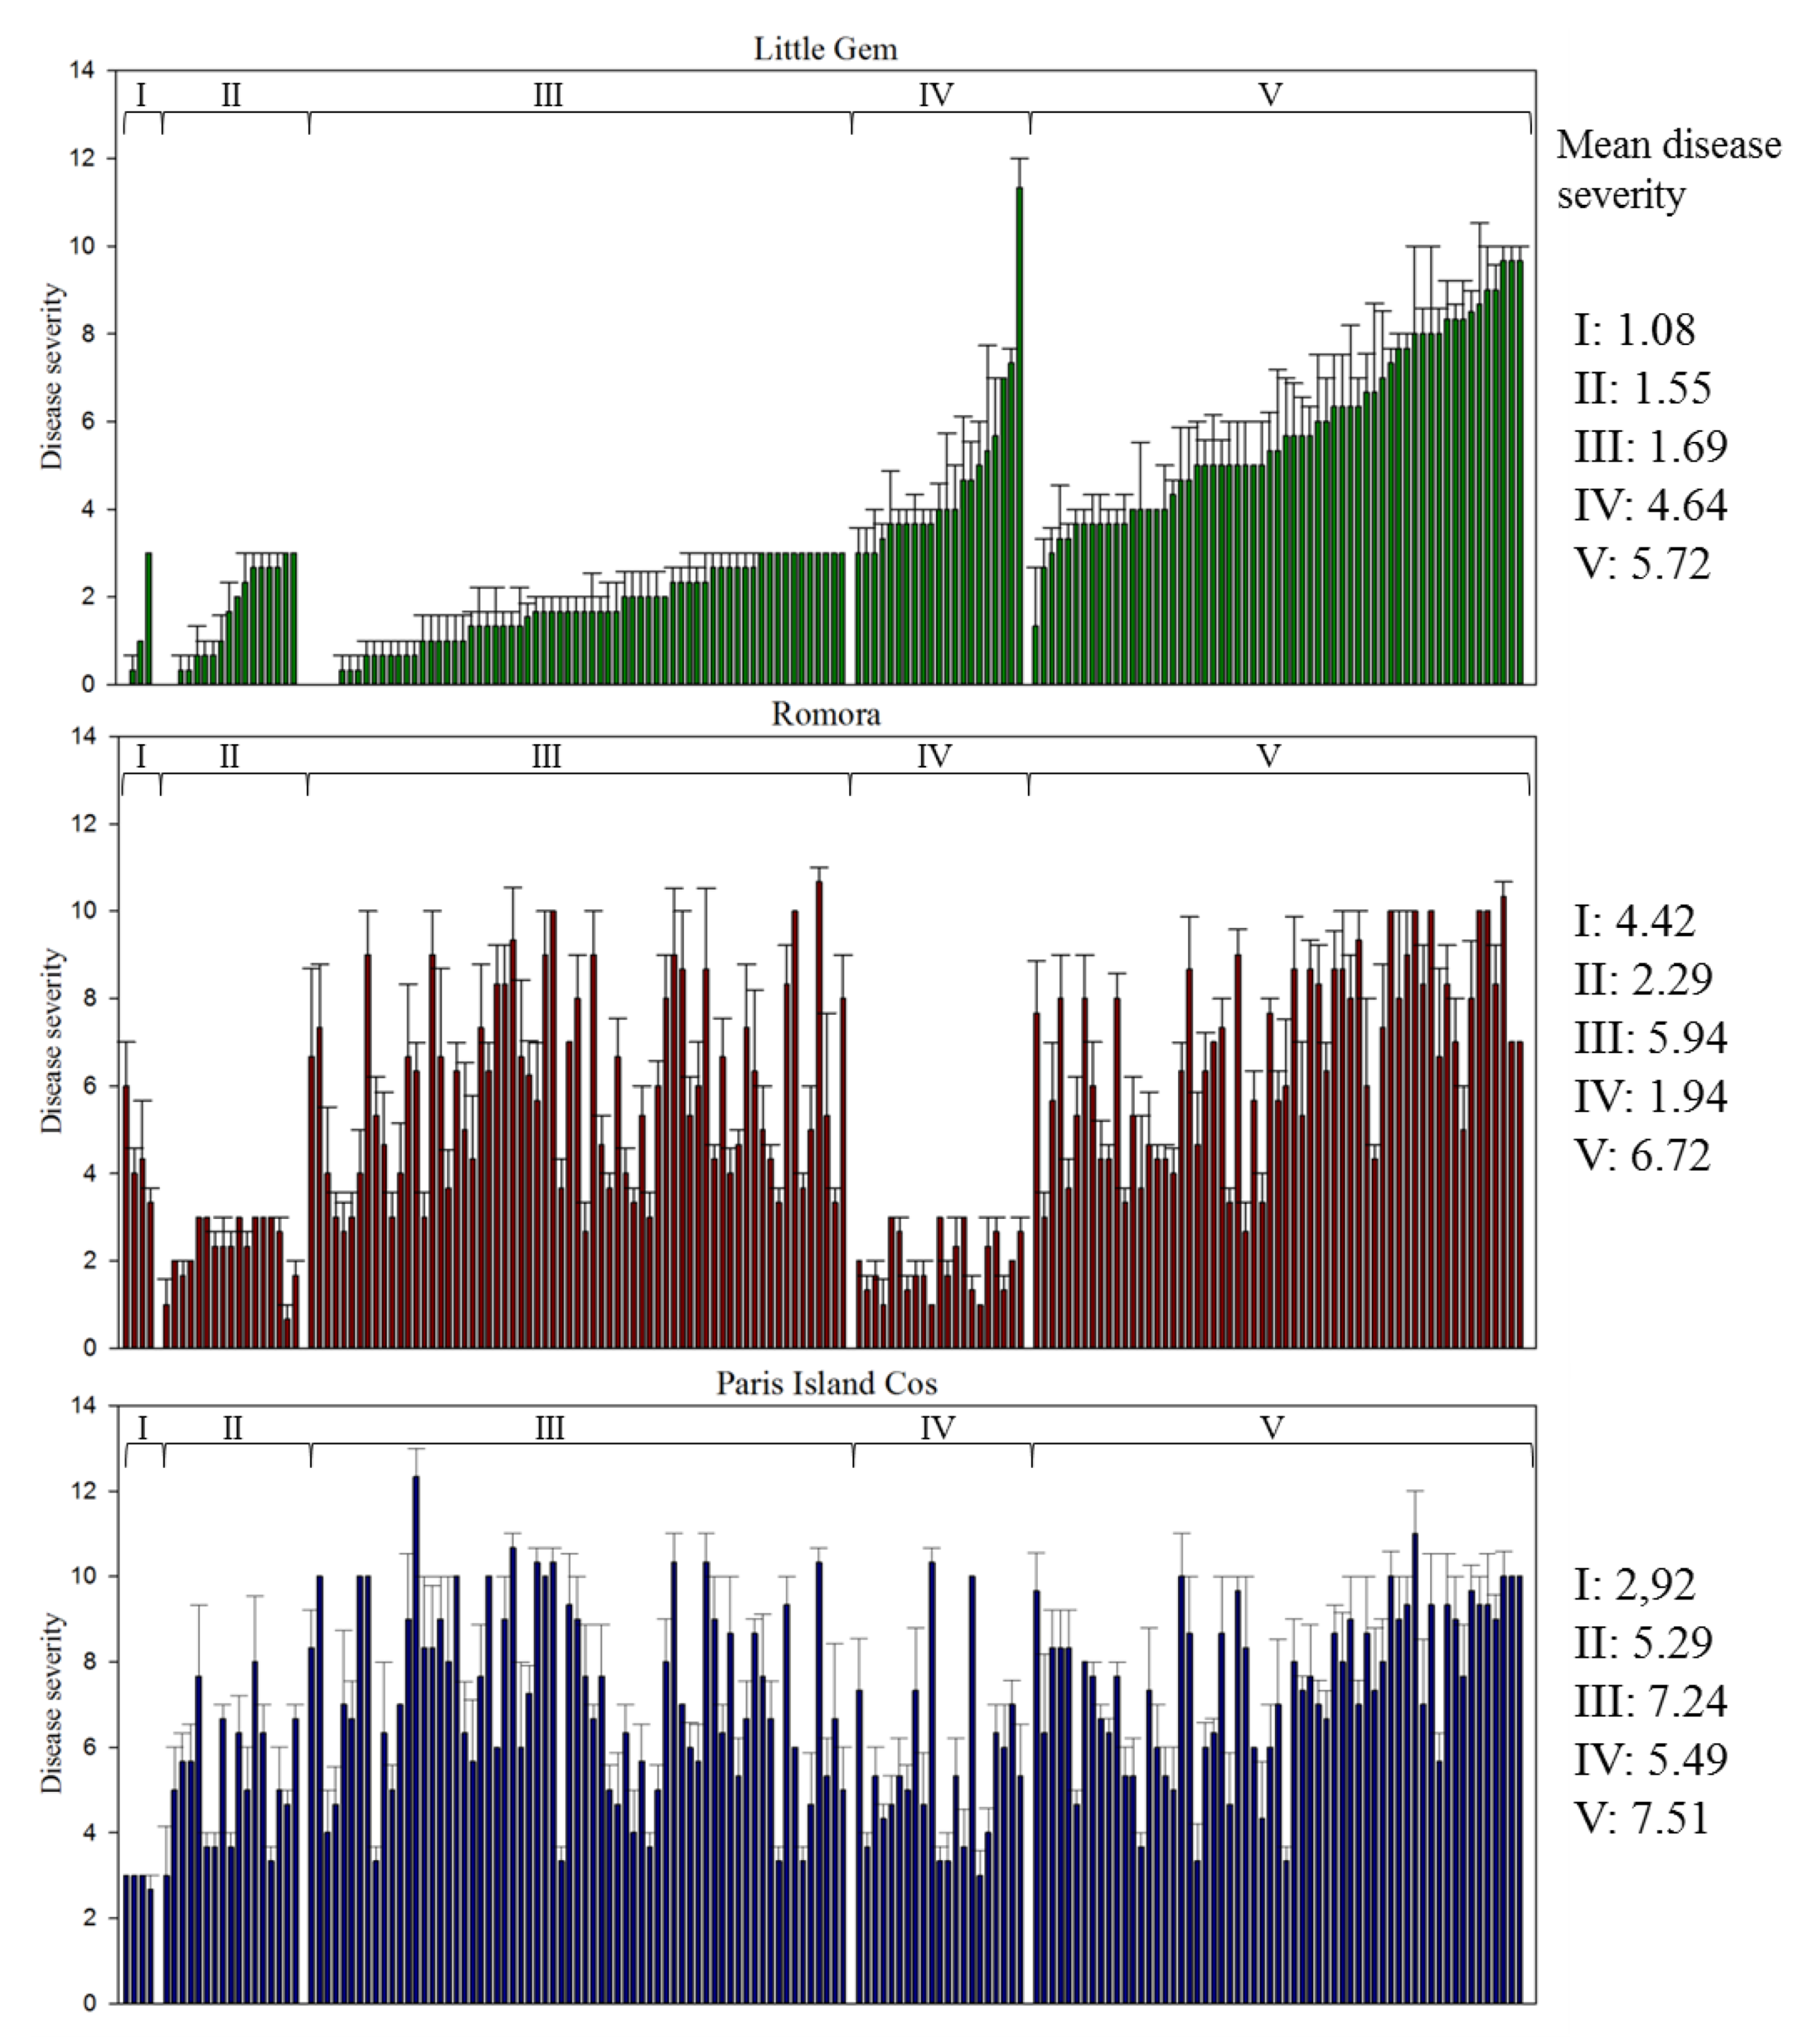
3.2. Pathogenicity Assay

Disease severity tests for 170 Xanthomonas hortorum pv. vitians isolates purified in 1996, 2014, 2015 and 2016 were evaluated on three lettuce cultivars previously classified as susceptible (Paris Island Cos), intermediate (Romora) and tolerant (Little Gem) [31,32] (D. Rekika, pers. comm.). These included 89 isolates from phylogroup A, 2 from B, 7 from C, 9 from D and 63 from E. Overall, we observed the most severe symptoms on Paris Island Cos and least on Little Gem, while symptoms on Romora were intermediate. Symptoms developed at least on one lettuce cultivar for all isolates eight to ten days after inoculation. All isolates caused HR on tobacco leaves, indicating that they belonged to plant pathogenic bacteria [45]. The average disease severity was determined for all isolates tested, and phylogroups were compared to each other. All phylogroups, except for phylogroup B (Figure 2), are more aggressive on Paris Island Cos than on the two other cultivars. While, on average, phylogroups A and C were more aggressive on cultivar Romora than on Little Gem, phylogroups B, D and E were more aggressive on cultivar Little Gem than on Romora, when comparing isolates to each other, we observed that within a phylogroup, their disease severity varied (Figure 2). Since there is only a weak (R2 = 0.3559) to very weak (R2 = 0.0797 and R2 = 0.0396) correlation between the aggressiveness of the isolates on the different cultivars, it is impossible to form groups on that criterion (Figure 3). On the other hand, an alternative classification method was developed based on the ability of each isolate to cause symptoms or not, on each lettuce cultivar, independently and five pathotypes of X. hortorum pv. vitians, named I to V, were determined. Pathotypes I could cause symptoms on Romora; II, on Paris Island; III, on both Paris Island and Romora; IV, on Little Gem and Paris Island and V, on all three lettuce cultivars tested (Figure 4). Pathotypes I, II, III, IV and V include 4, 17, 67, 21 and 60 isolates, respectively (Table 2).

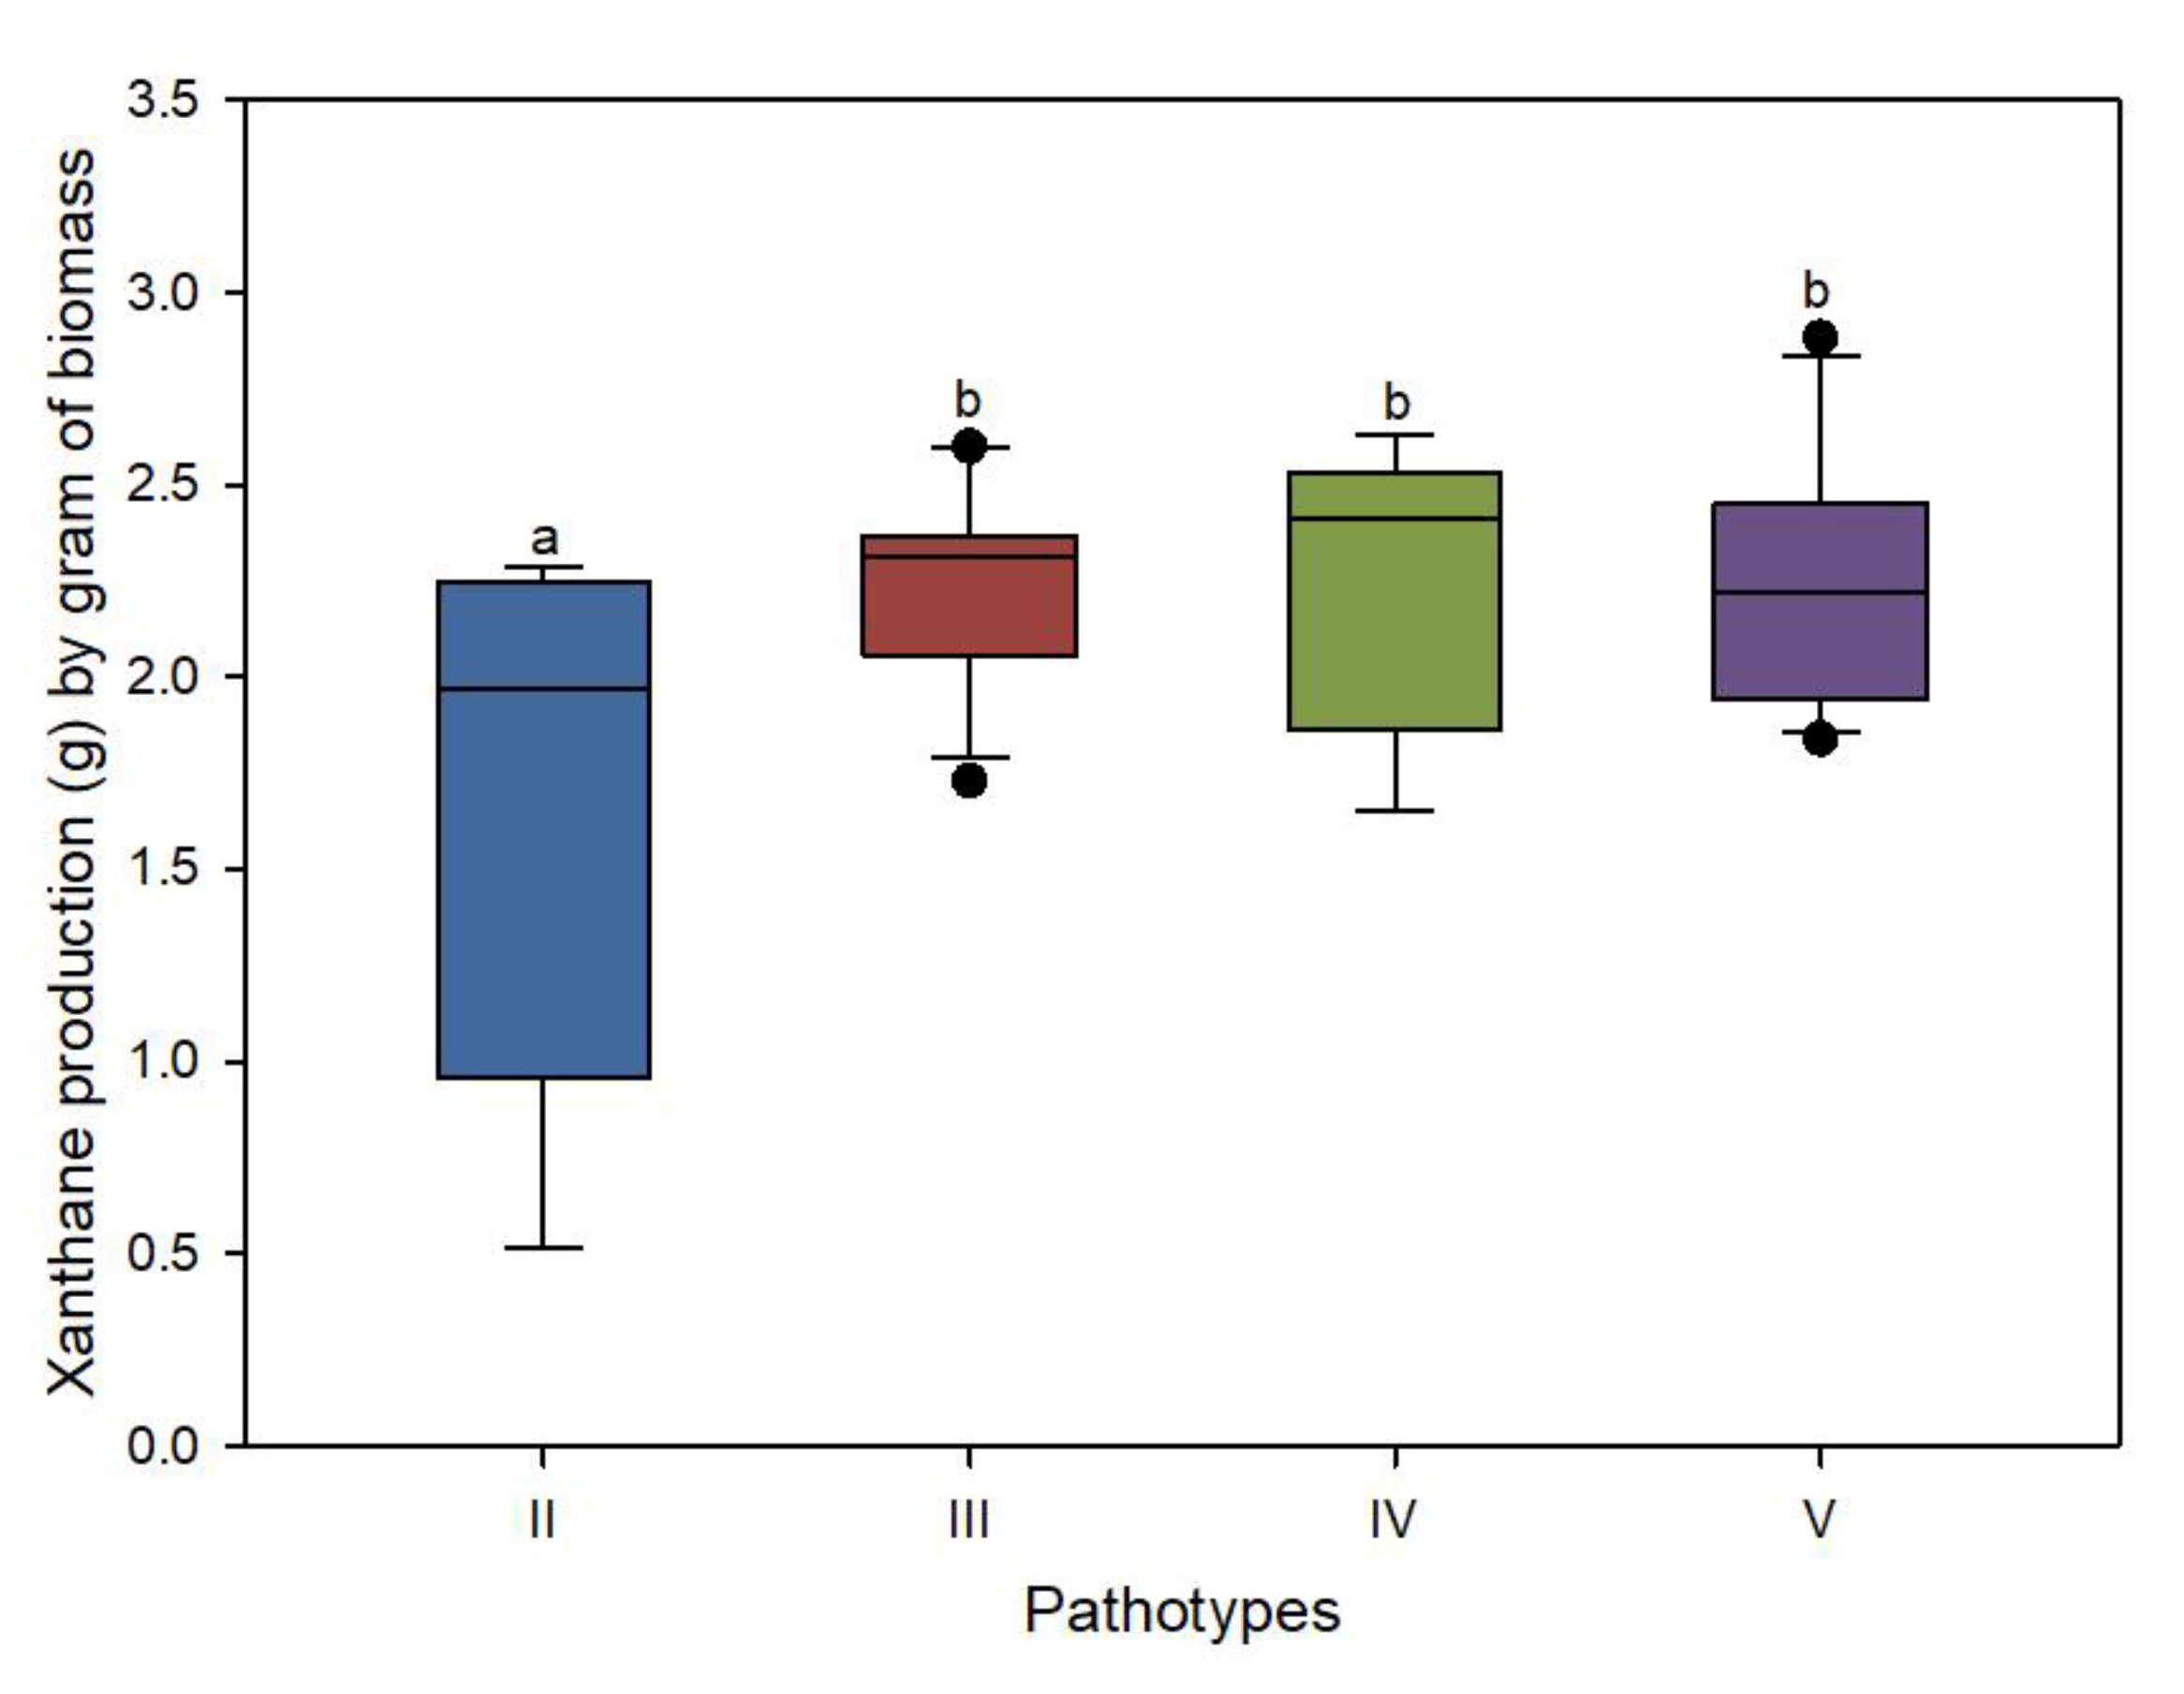
3.3. Xanthan Content Variation among Pathotypes

Xanthan was purified from forty-eight isolates belonging to pathotypes II to V. To the isolate level, the production rate ranged from 0.514 g to 2.882 g of xanthan per gram of biomass. When pathotypes were compared, pathotype II produced a significantly lower (p = 0.013) amount of xanthan per gram of biomass with an average production rate of 1.704 g compared to 2.229, 2.247 and 2.254 g for pathotypes III, IV and V, respectively (Figure 5).

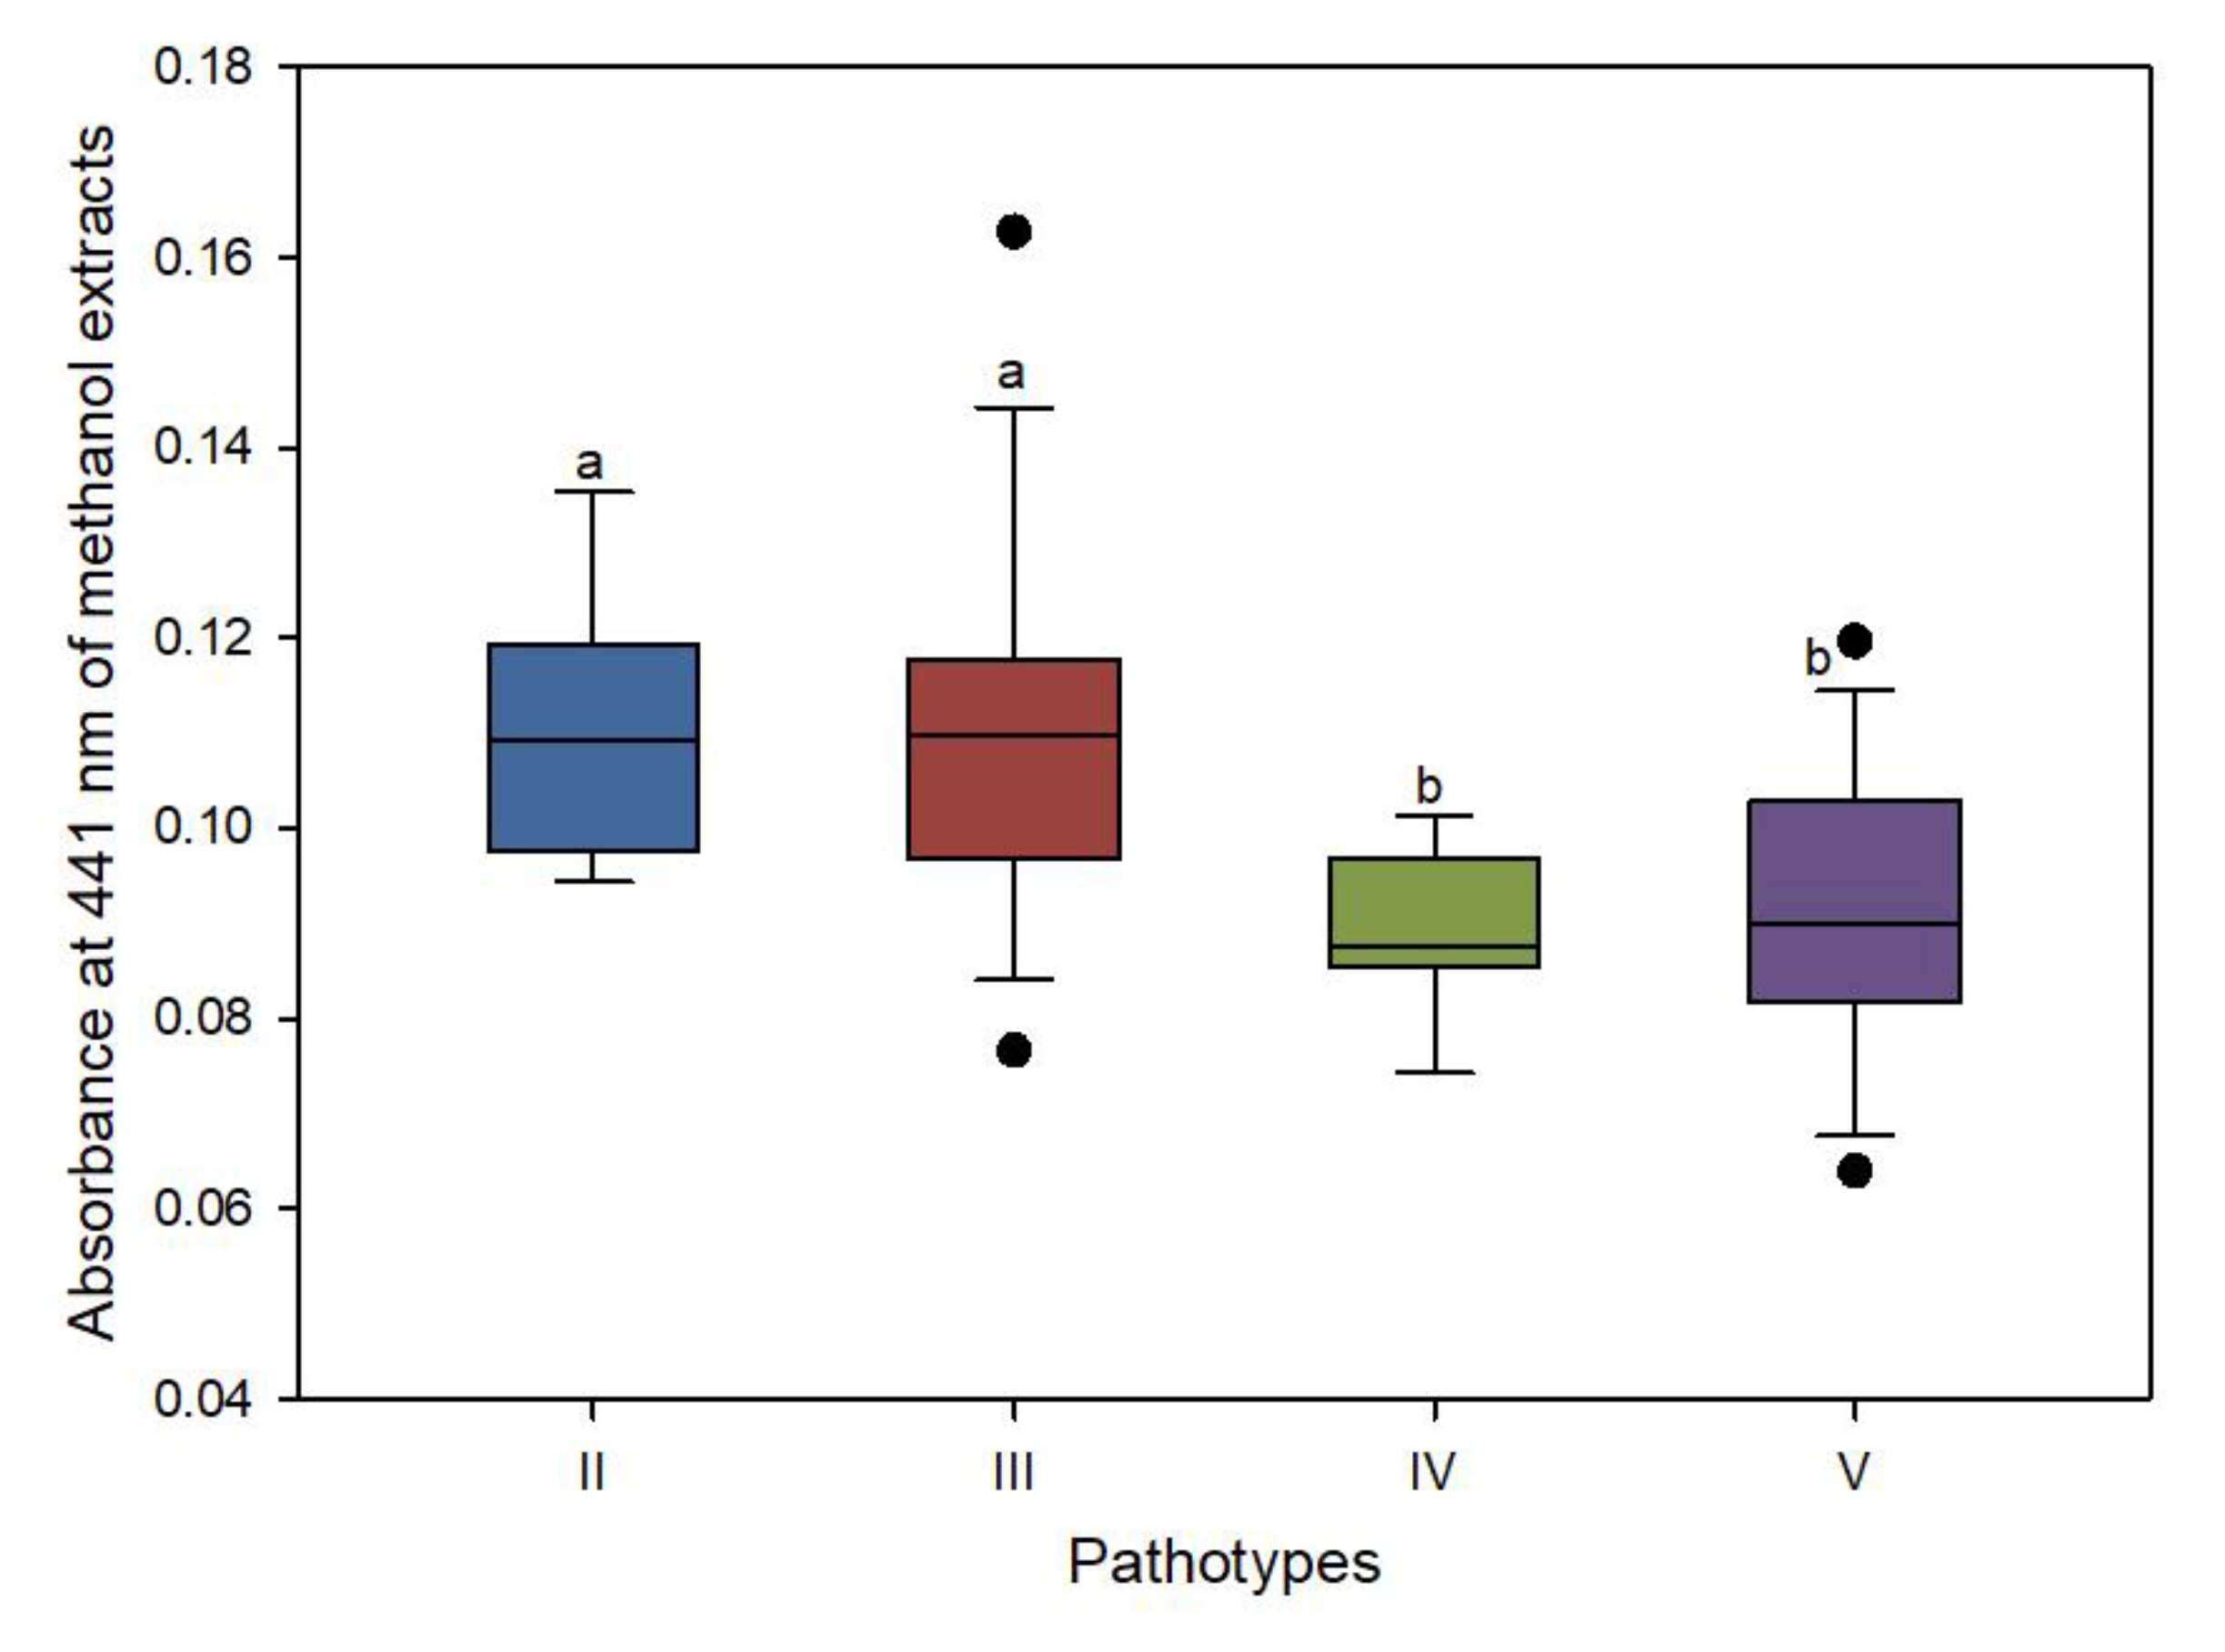
3.4. Xanthomonadin Content Variation among Pathotypes

The yield of xanthomonadin was quantified as the absorbance at 441 nm of the methanol extracts. The lowest average absorbance was measured at 0.064 for isolate ID060814G while the highest was measured at 0.136 for isolate ID170914A. Pathotypes IV and V produced a significantly lower amount of xanthomonadin with average absorbance of 0.092 and 0.089, respectively (Figure 6). Pathotypes II and III produced equal amounts of pigments, expressed by an average absorbance of 0.110.

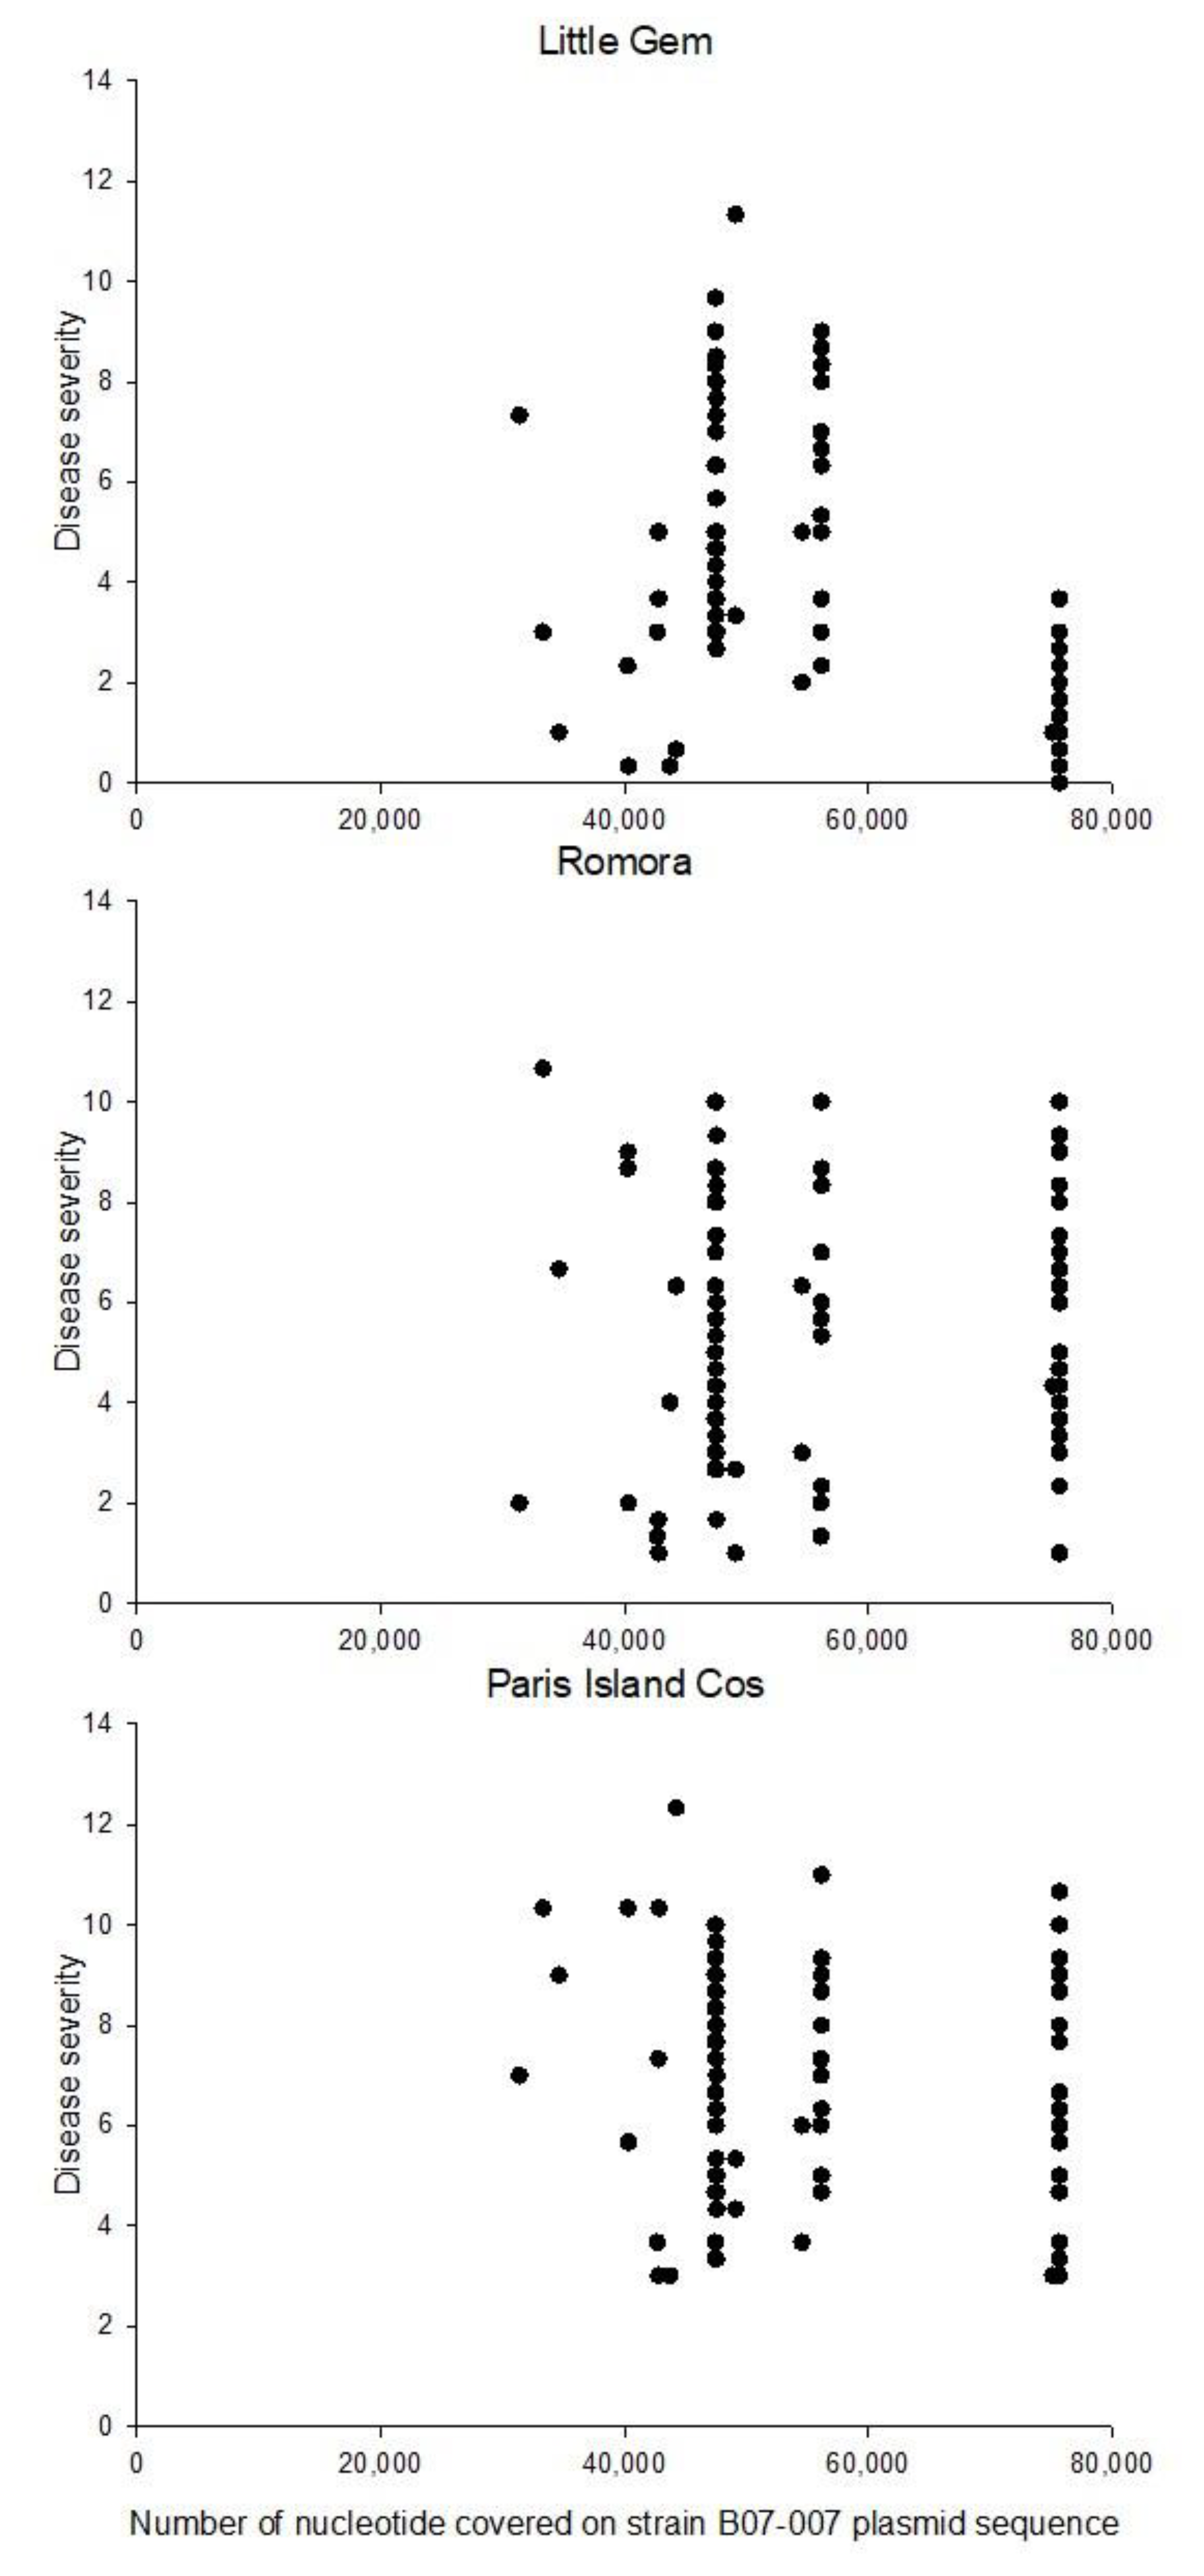
3.5. Genome Mapping, Contig De Novo Assembly & Genome Coverage Analysis

A total of over 18 million reads were obtained for the 95 isolates. DNA of only one isolate, ID060814K, did not sequence properly and was not included in subsequent analysis. Reads were first mapped against the chromosomal and plasmid genomes of the reference strain X. hortorum pv. vitians strain B07-007 to separate the unmapped reads, which were then used for the de novo assembly to investigate sequences absent from the reference genomes, thus corresponding to the pan genome of the species. All forward and reverse unmapped reads from all 95 isolates served as input for a single assembly. Using SPAdes, 694 contigs were generated. Contigs ranged from 128 to 120,795 bp (totalling 1,803,954 pb) and were later used as reference sequences, along with B07-007 data, for a second round of read mapping. After the second round of read mapping, we observed that the coverage of the chromosomal sequence of the reference B07-007 was not 100% for all of the sequenced isolates. Only one isolate had a coverage of 100%. The other isolates range from 88.77% to 99.98% coverage of the reference’s chromosomal sequence.
Twenty-eight of the 95 isolates sequenced have 100% coverage (75,648 bp) of the reference strain’s plasmidic sequence. After further analyses, we observed two major populations of isolates with a coverage of about 62.77% (47,422 to 47,540 bp, population A) and about 74.17% (56,094 to 56,122 bp, population B), for the first and the second population, respectively. The smallest plasmid sequence observed was 31,338 bp, corresponding to roughly 41% coverage of the reference’s plasmidic sequence. In addition, for each isolate, coverage of B07-007 plasmidic sequence and disease severity were compared. On the cultivar Little Gem, isolates with 100% coverage of the reference’s plasmidic sequence clustered together (Figure 7). All these isolates caused less severe symptoms when inoculated on lettuce leaves. For cultivar Romora and Paris Island Cos, a wide range of disease severity was observed for isolates of both populations A and B. When pathotypes were compared, isolates from pathotypes IV and V had a much lower average plasmidic sequence coverage than the other pathotypes and that isolates from pathotype III had close to 100% coverage of the B07-007 plasmidic sequence (Supplementary Table S1).

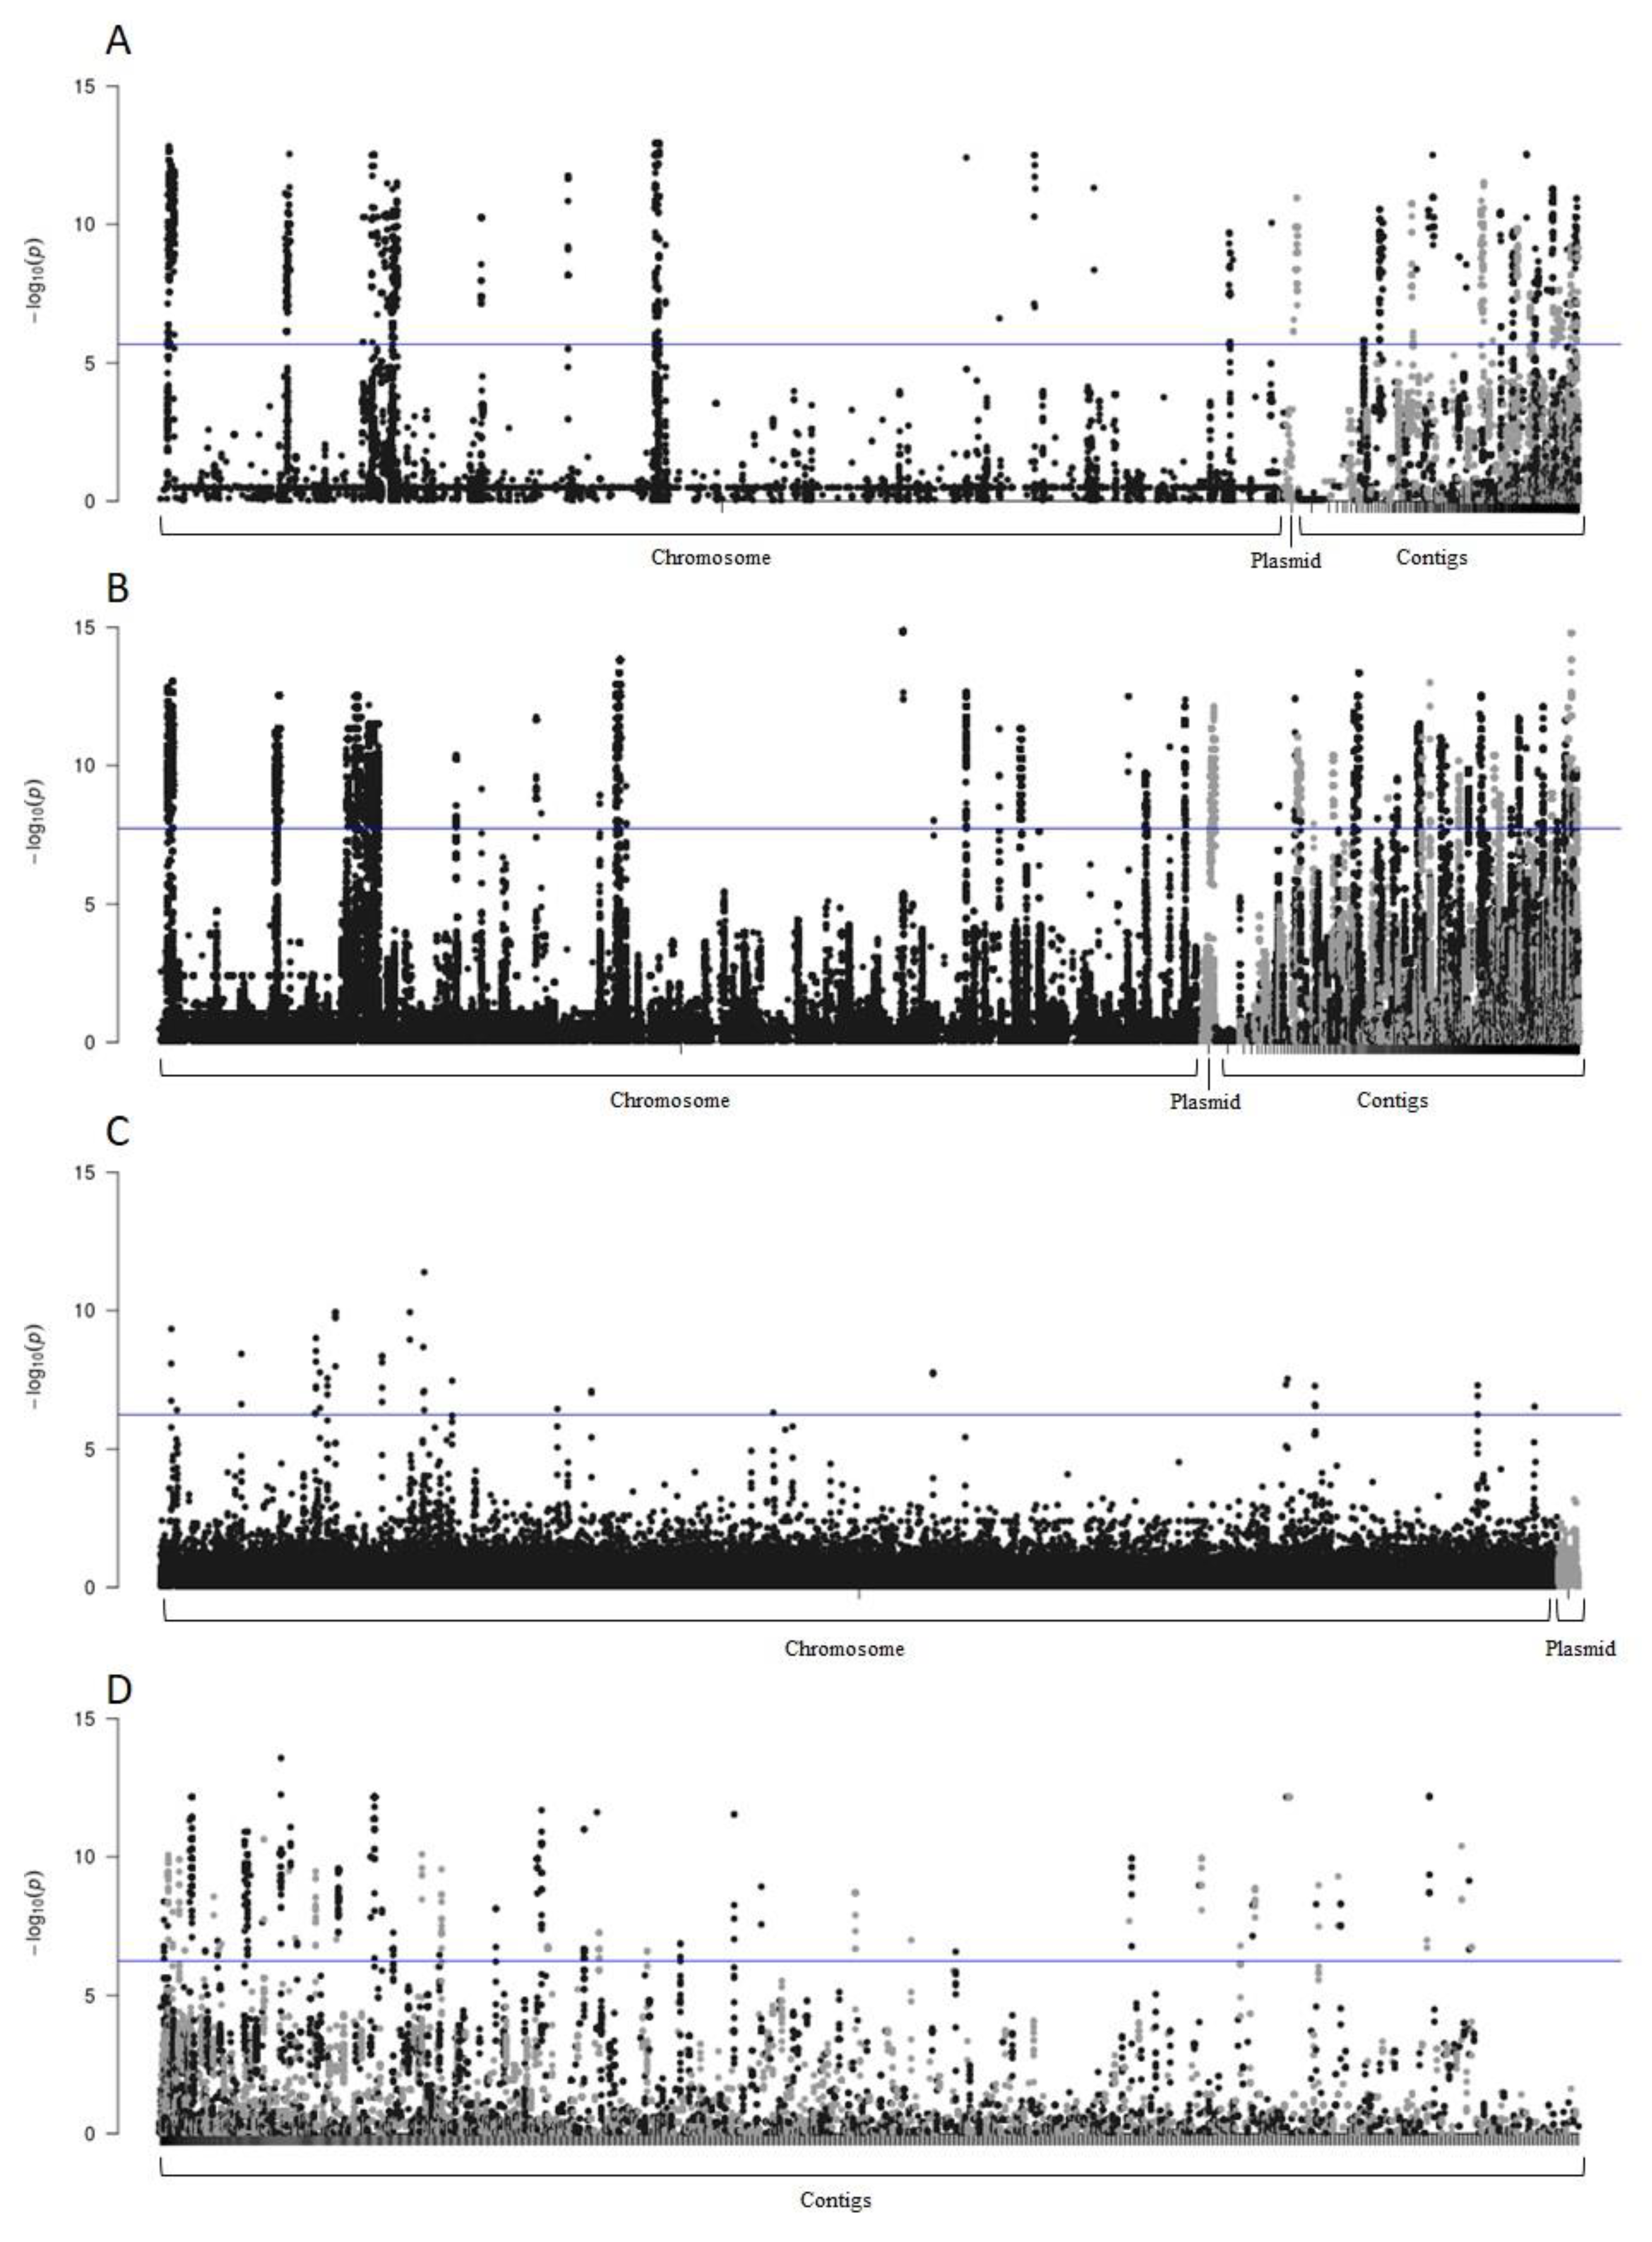
3.6. Genome-Wide Association Study (GWAS)

After the second read mapping and variant calling with Samtools, genomes were analyzed in different ways with PLINK software. Firstly, 23,119 SNPs were identified on both genomic and plasmidic sequences, as well as on de novo contigs after variant calling. From these SNPs, 4301 SNPs were found significantly associated with disease severity on the cultivar Little Gem, of which 135 are tri-allelic (where three different nucleotides can be observed at the same position within the population sequenced). No SNPs were found associated with the phenotypes for the two other cultivars. Significant SNPs are located mostly on the chromosome but were also located on the plasmid and on de novo contigs (Figure 8, Supplementary Table S3).
Secondly, across all reads mapped, 2,707,953 nucleotides were identified as zero coverage corresponding to gaps on chromosomal and plasmidic sequences and on de novo contigs. Of these nucleotides identified, 172,842 bp were significantly associated (Bonferroni corrected PLINK p-values) to disease severity on the cultivar Little Gem. Most of them were located on the chromosome.
Lastly, CNV regions were identified with CNV-Seq. On all sequences, 86,111 CNVs of 100 bp of length were identified, from which 863 were significantly associated with disease severity on the cultivar Little Gem. The majority of CNVs were located on de novo contigs. None were identified on the plasmid regions homologous to B07-007 plasmid (CP016879.1) (Figure 8).
For PLINK analyses, the significance levels were adjusted with the Bonferroni correction to 2.16 × 10⁻⁶, 1.84 × 10⁻⁸ and 5.8 × 10⁻⁷ for SNPs, nucleotides with coverage of zero and CNVs, respectively.

3.7. rhAmp® Genotyping for Detection of Pathogenic Isolates

We developed two rhAmp® genotyping assays to identify isolates associated with their capacity to cause bacterial leaf spot on the tolerant lettuce cultivar Little Gem. X. hortorum pv. vitians isolates tested for their pathogenicity on lettuce, but not sequenced on MiSeq, were used for these genotyping assays. The isolate ID060814K, not successfully sequenced on MiSeq, was included as well. Nearly 80% of isolates with an average disease severity score of 2.0, which corresponds to 1.2 on the scale used, or greater on cultivar Little Gem, were positive in the first genotyping assay using an SNP located at position 549 of the de novo contig 245, showing Ct values of 24.84 or less. Isolates with a Ct value of 31.48 and more were considered negative. On the other hand, nearly 75% of isolates with an average disease severity score of 2.0 or less were positive, with Cq values of 32.49 or less in the second genotyping assay using an SNP located at position 590,650 of the reference strain’s chromosome. A Cq value of 37.36 or more was considered negative (Table 3, Supplemental Figure S1). Phenotyped but non-sequenced isolates were used to validate the rhAmp® assays.

4. Discussion

Knowledge of the diversity of the species X. hortorum pv. vitians infecting lettuce is essential to select effective lettuce cultivars that tolerate most of the strains which might be encountered in the pathogen population. Sahin et al., (2003) identified two groups of X. hortorum pv. vitians strains based on disease reaction on different plant species, but their tests included only one lettuce cultivar with an unknown BLS resistance classification. Here, we identified five pathotypes of X. hortorum pv. vitians present in lettuce fields in the province of Quebec, Canada, based on their capacity to infect three cultivars, Paris Island Cos, Romora and Little Gem, the latter being tolerant to bacterial leaf spot. It has been previously demonstrated [46] that resistance to bacterial leaf spot in lettuce cultivars is conferred by the resistance gene Xar1. Bull et al. [32] and Wan et al. [47] observed moderate to high resistance to bacterial leaf spot when the cultivar Little Gem was artificially inoculated with X. hortorum pv. vitians isolates collected in California and Florida, respectively. Nevertheless, despite the presence of Xar1 in the cultivar Little Gem, our results showed that many isolates were able to cause symptoms on this cultivar.
Genetic diversity of our X. hortorum pv. vitians isolates was evaluated with four housekeeping genes as described by Young et al. [29]. The internal sequences of fyuA, gyrB, rpoD and dnaK were concatenated and phylo-tree constructed. The 694 isolates were clustered into five phylogroups. We attempted to correlate the phylogroups to pathotypes obtained through pathogenicity assays. However, no correlation was observed. Isolates in each phylogroup, except phylogroup B, which contains only two isolates, are scattered in different pathotype groups, thus indicating that housekeeping genes, such as tonB-dependent receptor (fyuA), DNA gyrase subunit B (gyrB), RNA polymerase sigma factor (rpoD) and chaperone protein dnaK (dnaK), are not linked to pathogenicity in X. hortorum pv. vitians.
The production of xanthan and xanthomonadins is characteristic for Xanthomonas members. We characterized some isolates collected from 2014 to 2017 and investigated if the yield of xanthan and xanthomonadin production would relate to specific pathotypes. Considering both compounds are involved in the infection process, we hypothesized that differential production levels of these products could be correlated to the pathogenicity of the pathotypes described in this study. Although xanthan plays an important role in inducing plant susceptibility by suppressing callose deposition [48], no significant correlation was established between the yield of in vitro produced of this polysaccharide and symptoms observed on the three lettuce cultivars inoculated. Even if pathotype II produced a significantly lower amount of xanthan than the other pathotypes, it could not be correlated to the absence of symptoms on either cultivar Little Gem or Romora because pathotypes III and IV were unable to cause symptoms on cultivar Little Gem and Romora, respectively, even though they had higher xanthan production. When the production of xanthomonadins was characterized, we made sure that each isolate tested had the same theoretical number of cells by counting CFU after dilution plating and by weighing cell pellets, making a comparison between isolates possible. Isolates from pathotypes II and III, which produced on average greater amounts of xanthomonadins, were unable to cause symptoms on the cultivar Little Gem. Moreover, isolates from pathotypes IV and V, which have a non-significantly different average production of xanthomonadins, do not have the same pathogenicity on cultivar Romora. Xanthomonadins are thought to protect xanthomonads from photo-oxidative stress [7], thus helping the survival of bacteria on plants and increasing the chances of infection leading to disease development. He et al. [7] also demonstrated that when xanthomonadin biosynthesis is impaired, a reduction of the virulence can be observed. However, in our study, we did not observe a reduction of aggressiveness for the pathotypes that produced significantly fewer quantities of xanthomonadins. Taken together, these observations indicate that in vitro production of either xanthan or xanthomonadins might not be the best method to characterize and identify pathotypes of X. hortorum pv. vitians. In planta secretion of this pigment could be investigated in subsequent studies.
We proceeded to a second evaluation of the genetic diversity by resequencing whole genomes of 95 X. hortorum pv. vitians isolates belonging to pathotypes I to V with Illumina sequencing technology. Variant calling performed after the second round of read mapping allowed us to identify many SNPs and CNVs (including zero-coverage variants) located on the B07-007 chromosome and plasmid or on contigs. Some of the de novo contigs behaved in a complementary fashion to genomic loci; the sequence corresponding to these de novo contigs being present only when their chromosomal counterpart was absent. It suggests that some loci are polymorphic, and they could possibly be associated with the aggressiveness of X. hortorum pv. vitians towards the tolerant cultivar Little Gem.
The non-uniform coverage of reference strain B07-007 plasmidic sequence observed after read mapping is intriguing because many pathogenicity-related genes are not present in some isolates. Gaps totalling approximately 47,500 bp (ranging from 47,422 to 47,540 bp) or approximately 56,100 bp (ranging from 56,094 to 56,122 bp) can be found in the plasmidic sequences of these isolates. While many isolates from these two sub-populations caused severe symptoms on all three lettuce cultivars inoculated, virB3, virB8 and virB10 genes from type IV secretion system were not systematically present on the plasmid, along with a type III and a type VI secretion system gene. It has been previously demonstrated that the capacity to kill Gram-negative bacteria was conferred to Xanthomonas citri by its type IV secretion system [49], thus conferring a fitness advantage over other bacterial communities present on the leaf surface. The fact that some isolates were able to cause BLS on the three lettuce cultivars despite the lack of pathogenicity genes may be because these genes located on the plasmid are facultative, as they are also located on the chromosome.
As mentioned before, de novo contigs obtained with SPAdes were not present in all isolates sequenced. Interestingly, only three isolates (ID060814AJ, ID100916B and ID260814AH) had the entire 120,795-bp de novo contig sequenced, corresponding to plasmidic DNA of Xanthomonas euvesicatoria and Xanthomonas campestris pv. vesicatoria when compared to the NCBI NT database using BLAST [50]. Canteros et al. [51] had already observed various sizes of plasmids for X. campestris pv. vesicatoria. Similarly, the plasmid size variation (compared to B07-007 plasmid) and the additional presence of a 120,795-bp plasmidic sequence obtained by de novo assembly represents major clues to the diversity of plasmids existing in X. hortorum pv. vitians.
The reference strain B07-007 used for mapping did not cause bacterial leaf spot on the tolerant lettuce cultivar Little Gem. Therefore, a variant calling step right after the first round of read mapping could have limited the analyses because genes related to pathogenicity on tolerant cultivars could be missed due to their absence on non-pathogenic isolates towards the tolerant cultivar Little Gem. Consequently, we decided to retrieve unmapped reads to compute a de novo assembly and then run a second round of read mapping with de novo contigs added to the reference sequences. This way, sequences of X. hortorum pv. vitians pan genome absent from the reference genome are not lost and could be included in the analyses. As it is not a flawless method, it would be interesting to use an isolate known to be able to cause the disease on the tolerant cultivar as a reference for read mapping. Perhaps different SNPs could be identified and associated with the phenotypes observed.
GWAS may be arduous to adapt to microbial variants (see Power et al. [52] for review). Lineage effects in population structure and linkage disequilibrium may affect microbial GWAS results [53]. In this study, we demonstrated that we had enough diversity to achieve bacterial GWAS. As we can see in Figure 8, significant SNPs are grouped in distinct regions that could correspond to linkage blocks in our population. These linkage blocks indicate that in our study, linkage disequilibrium might not be as strong as Earle et al. [53] suggest, because many regions showed a very low association between SNPs and phenotype.
The SNP selected at position 590,650 of the chromosome is located in an intergenic region, and the SNP at position 549 of contig 245 is located in a region coding for a hypothetical protein, based on a BLAST analysis with the NCBI NT database. Both polymorphisms are located in regions that are not present (not resequenced) in all isolates, and we hypothesized they could be linked to disease severity. The GWAS conducted with gaps as markers identified both regions containing the SNPs as significantly associated with disease severity. However, only nucleotides 247 to 1074 of contig 245 were identified as CNVs by CNV-seq. The lack of sensitivity of CNV-seq pinpointed by Brynildsrud et al. [54] may be the reason why no CNVs were detected around position 590,650 of sequenced isolates’ chromosome. As both regions were used to design rhAmp® genotyping assays, they will give a signal when the sequences are present and no signal when there is no copy of the sequence in the strain assayed, and as such, can be used to determine the state of the CNV.
No association was found between polymorphism and phenotypes for the two lettuce cultivars Paris Island Cos and Romora. This could be explained by several factors. First, more than one gene or loci are most probably involved in the pathogenicity process, and the size of the population studied may not be large enough to consider gene interactions. Secondly, the number of members of a gene family could be different from one isolate to another. Whole-genome assembly of all isolates, with PacBio reads, for example, might be needed to resolve gene duplication. Lastly, differences in gene expression, which have not been investigated in our study, could interfere with the number of effectors required to induce disease.
One objective of this study was to develop rhAmp® genotyping assays to detect every pathotype identified in this study, but SNPs, gaps and CNVs were only significantly associated to the cultivar Little Gem, thus making it impossible to discriminate each pathotype. Instead, the genotyping assays were developed to detect isolates able to cause disease on the tolerant cultivar Little Gem. As seen in Table 3, the detection of isolates causing bacterial leaf spot on this tolerant cultivar was possible in almost 80% of cases (59 cases out of 75 isolates tested, 2.0 for the symptoms cut off for both assays). It is possible that other factors, such as genes involved in the successful pathogenic interaction, were missed. As the phenotype measured is quantitative, it is likely that many genes are involved in the host-pathogen interaction. Zhang et al. [55] have studied a similar crop cultivar/pathovar system in rice and have found a complex system comprising of 47 bacterial loci associated with pathogenesis, a result similar to our findings. Although the genetic makeup of lettuce cultivars was not included in our analyses, we were able to identify at least 12 loci (Figure 8) either on the chromosome or the plasmid of X. hortorum pv. vitians, significantly associated with disease on the tolerant cultivar. Our SNP assays, however, represent the first usable tool for early prediction of the onset of bacterial leaf spot on lettuce, targeting loci with a major effect on phenotype.
The results in this study indicate that there are currently at least five pathotypes of Xanthomonas hortorum pv. vitians in lettuce fields in the province of Quebec, Canada, based on pathogenicity tests conducted in the greenhouse on lettuce cultivars Little Gem, Paris Island Cos and Romora. Of these pathotypes, three were able to cause bacterial leaf spot on the tolerant cultivar Little Gem, pointing out the importance of including these pathotypes in lettuce breeding programs. Bacterial GWAS was achieved with 95 isolates belonging to the five pathotypes, and over four thousand SNPs were significantly associated with disease severity on the tolerant cultivar Little Gem, allowing us to develop two genotyping assays to detect isolates of X. hortorum pv. vitians able to cause bacterial leaf spot on this cultivar. These genotyping assays could hypothetically be used to detect the pathogen in seed lots to prevent the introduction of the bacteria in lettuce fields.

5. Conclusions

Knowledge about the function of the genes involved in pathogenicity, as identified by the GWAS presented here, may help to understand host-pathogen interaction and, in turn, develop new phytosanitary products and mitigation strategies based on this information. This is the first time that molecular markers are associated with the level of pathogenicity of Xanthomonas hortorum pv vitians, the bacteria causing bacterial leaf spot of lettuce.

Supplementary Materials

The following are available online at https://www.mdpi.com/article/10.3390/agronomy11122386/s1, Supplementary Data S1 Sequence Qc.zip, Supplementary Data S2 de novo contigs sequences.docx, Supplementary Figure S1 Ratio of Ct values for SNP.docx, Supplementary Tables S1 and S2 Isolates and disease rating scale.docx, Supplementary Table S3 polymprphisms with p-values on cultivar Little Gem.xlsx.

Author Contributions

Investigation P.-O.H., M.L., V.T. and C.B.; Methodology P.-O.H., M.L., M.C. (Marie Ciotola), M.C. (Mélanie Cadieux) and D.X.; Formal analysis P.-O.H., M.L. and V.T.; Writing—original draft preparation P.-O.H.; Writing—review and editing P.-O.H., M.L., M.C. (Marie Ciotola) and D.X.; Supervision M.L. and V.T.; Project administration V.T.; Funding acquisition V.T. and C.B. All authors have read and agreed to the published version of the manuscript.

Funding

This research was funded by Agriculture and Agri-Food Canada (AAFC), project J-00271.

Institutional Review Board Statement

Nor applicable.

Informed Consent Statement

Not applicable.

Data Availability Statement

The data for this project are available under Genbank BioProject PRJNA777907.

Acknowledgments

We would like to thank Phytodata Inc. for providing symptomatic lettuce plants. We would also like to thank the Lettuce Foundation for providing funds for the study.

Conflicts of Interest

The authors declare no conflict of interest.

References

  1. Widmer, T.L.; Graham, J.H.; Mitchell, D.J. Histological comparison of fibrous root infection of disease-tolerant and susceptible citrus hosts by Phytophthora nicotianae and P. palmivora. Phytopathology 1998, 88, 389–395. [Google Scholar] [CrossRef] [PubMed] [Green Version]
  2. Mandadi, K.K.; Scholthof, K.B. Plant immune responses against viruses: How does a virus cause disease? Plant Cell 2013, 25, 1489–1505. [Google Scholar] [CrossRef] [PubMed] [Green Version]
  3. Von Bodman, S.B.; Bauer, W.D.; Coplin, D.L. Quorum sensing in plant-pathogenic bacteria. Annu. Rev. Phytopathol. 2003, 41, 455–482. [Google Scholar] [CrossRef] [PubMed]
  4. Buttner, D.; He, S.Y. Type iii protein secretion in plant pathogenic bacteria. Plant Physiol. 2009, 150, 1656–1664. [Google Scholar] [CrossRef] [Green Version]
  5. Giraldo, M.C.; Valent, B. Filamentous plant pathogen effectors in action. Nat. Rev. Microbiol. 2013, 11, 800–814. [Google Scholar] [CrossRef]
  6. Buttner, D.; Bonas, U. Regulation and secretion of Xanthomonas virulence factors. FEMS Microbiol. Rev. 2010, 34, 107–133. [Google Scholar] [CrossRef] [Green Version]
  7. He, Y.-W.; Wu, J.; Zhou, L.; Yang, F.; He, Y.Q.; Jiang, B.-L.; Bai, L.; Xu, Y.; Deng, Z.; Tang, J.-L.; et al. Xanthomonas campestris diffusible factor is 3-hydroxybenzoic acid and is associated with xanthomonadin biosynthesis, cell viability, antioxidant activity, and systemic invasion. Mol. Plant-Microbe Interact. 2011, 24, 948–957. [Google Scholar] [CrossRef] [Green Version]
  8. Denny, T.P. Involvment of bacterial polysaccharides in plant pathogenesis. Annu. Rev. Phytopathol. 1995, 33, 173–197. [Google Scholar] [CrossRef]
  9. Brown, N.A. Some bacterial diseases of lettuce. J. Agric. Res. 1918, 13, 367–388. [Google Scholar]
  10. Davis, R.M.; Subbarao, K.V.; Kurtz, E.A.; Raid, R.N. Compendium of Lettuce Diseases; APS Press: Madison, WI, USA, 1997. [Google Scholar]
  11. Bradbury, J.F. Guide to Plant Pathogenic Bacteria; CAB International Mycological Institute: Slough, UK, 1986. [Google Scholar]
  12. Allex, D.; Rat, B. Les bactérioses des salades: Un problème omniprésent. PHM Rev. Hortic. 1990, 310, 45–50. [Google Scholar]
  13. Wallis, F.M.; Joubert, J.J. Bacterial spot of lettuce in natal. Landbouwet. S. Afr. Agric. Sci. S. Afr. Phytophylactica 1972, 4, 137–138. [Google Scholar]
  14. Zoina, A.; Volpe, E. Epidemiological Aspects of Lettuce Bacterial Spot Induced by Xanthomonas campestris pv. vitians, Plant Pathogenic Bacteria (Les Colloques INRA); INRA: Versailles, France, 1992; p. 797. [Google Scholar]
  15. Sahin, F. First report of bacterial spot of lettuce caused by Xanthomonas campestris pv. vitians in Turkey. Plant Dis. 2000, 84, 490. [Google Scholar] [CrossRef] [PubMed]
  16. Pernezny, K.; Raid, R.N.; Stall, R.E.; Hodge, N.; Collins, J. An outbreak of bacterial spot of lettuce in Florida caused by Xanthomonas campestris pv. vitians. Plant Dis. 1995, 79, 359–360. [Google Scholar] [CrossRef]
  17. Daboin, C.; Tortolero, O.J.F.V. Bacterial leaf spot of lettuce in some fields of the Venezuelan Andes. Fitopatol. Venezol. 1993, 6, 8–10. [Google Scholar]
  18. Toussaint, V.; Morris, C.E.; Carisse, O. Identification, resistance to antibiotics and utilization of carbon sources by Xanthomonas campestris pv. vitians strains isolated from different lettuce-growing areas. In Proceedings of the 7th International Congress of Plant Pathology, Edinburgh, UK, 1–31 July 1998. [Google Scholar]
  19. Robinson, P.; Jones, J.; Pernezny, K. Bacterial leaf spot of lettuce: Relationship of temperature to infection and potential host range of Xanthomonas campestris pv. vitians. Plant Dis. 2006, 90, 465–470. [Google Scholar] [CrossRef] [PubMed] [Green Version]
  20. Barak, J.D.; Koike, S.T.; Gilbertson, R.L. Role of crop debris and weeds in the epidemiology of bacterial leaf spot of lettuce in california. Plant Dis. 2001, 85, 169–178. [Google Scholar] [CrossRef] [PubMed]
  21. Sahin, F.; Miller, S.A. Identification of the bacterial leaf spot pathogen of lettuce, Xanthomonas campestris pv. vitians, in Ohio, and assessment of cultivar resistance and seed treatment. Plant Dis. 1997, 81, 1443–1446. [Google Scholar]
  22. FAO. Faostat Database; Food and Agriculture Organisation of the United Nations: Rome, Italy, 2020. [Google Scholar]
  23. Statistics Canada. Area, Production and Farm Gate Value of Marketed Vegetables; Statistics Canada: Ottawa, ON, Canada, 2020. [Google Scholar]
  24. USDA. Vegetables 2019 Summary; National Agricultural Statistics Service: Washington, DC, USA, 2020.
  25. Ritchie, D.F.; Dittapongpitch, V. Copper-and streptomycin-resistant strains and host differentiated races of Xanthomonas campestris pv. vesicatoria in North Carolina. Plant Dis. 1991, 75, 733–736. [Google Scholar]
  26. Cooksey, D.A. Genetics of bactericide resistance in plant pathogenic bacteria. Annu. Rev. Phytopathol. 1990, 28, 201–219. [Google Scholar] [CrossRef]
  27. Lu, H.; Hu, J.; Kwon, S.J. Association analysis of bacterial leaf spot resistance and SNP markers derived from expressed sequence tags (ESTs) in lettuce (Lactuca sativa L.). Mol. Breed. 2014, 34, 997–1006. [Google Scholar] [CrossRef]
  28. Wilson, E.E.; Zeitoun, F.M.; Fredrickson, D.L. Bacterial phloem canker, a new disease of Persian walnut trees. Phytopathology 1967, 57, 618–621. [Google Scholar]
  29. Young, J.M.; Park, D.C.; Shearman, H.M.; Fargier, E. A multilocus sequence analysis of the genus Xanthomonas. Syst. Appl. Microbiol. 2008, 31, 366–377. [Google Scholar] [CrossRef]
  30. Vauterin, L.; Hoste, B.; Kersters, K.; Swings, J. Reclassification of Xanthomonas. Int. J. Syst. Evol. Micr. 1995, 45, 472–489. [Google Scholar] [CrossRef]
  31. Carisse, O.; Ouimet, A.; Toussaint, V.; Philion, V. Evaluation of the effect of seed treatments, bactericides, and cultivars on bacterial leaf spot of lettuce caused by Xanthomonas campestris pv. vitians. Plant Dis. 2000, 84, 295–299. [Google Scholar] [CrossRef] [Green Version]
  32. Bull, C.T.; Goldman, P.H.; Hayes, R.; Madden, L.V.; Koike, S.T.; Ryder, E. Genetic diversity of lettuce for resistance to bacterial leaf spot caused by Xanthomonas campestris pv. vitians. Plant Health Prog. 2007, 8, 11. [Google Scholar] [CrossRef] [Green Version]
  33. Steffens, T.; Vorholter, F.J.; Giampa, M.; Hublik, G.; Puhler, A.; Niehaus, K. The influence of a modified lipopolysaccharide o-antigen on the biosynthesis of xanthan in Xanthomonas campestris pv. campestris b100. BMC Microbiol. 2016, 16, 93. [Google Scholar] [CrossRef] [Green Version]
  34. Starr, M.; Stephens, W.L. Pigmentation and taxonomy of the genus Xanthomonas. J. Bacteriol. 1964, 87, 293–302. [Google Scholar] [CrossRef] [Green Version]
  35. Poplawsky, A.R.; Chun, W. Pigb determines a diffusible factor needed for extracellular polysaccharide slime and xanthomonadin production in Xanthomonas campestris pv. campestris. J. Bacteriol. 1997, 179, 439–444. [Google Scholar] [CrossRef] [PubMed] [Green Version]
  36. Bolger, A.M.; Lohse, M.; Usadel, B. Trimmomatic: A flexible trimmer for Illumina sequence data. Bioinformatics 2014, 30, 2114–2120. [Google Scholar] [CrossRef] [Green Version]
  37. Andrews, S. FastQC. A Quality Control Tool for High Throughput Sequence Data. 2010. Available online: http://www.bioinformatics.babraham.ac.uk/projects/fastqc/ (accessed on 28 March 2018).
  38. Ewels, P.; Magnusson, M.; Lundin, S.; Kaller, M. Multiqc: Summarize analysis results for multiple tools and samples in a single report. Bioinformatics 2016, 32, 3047–3048. [Google Scholar] [CrossRef] [Green Version]
  39. Li, H.; Durbin, R. Fast and accurate short read alignment with burrows-wheeler transform. Bioinformatics 2009, 25, 1754–1760. [Google Scholar] [CrossRef] [Green Version]
  40. Bankevich, A.; Nurk, S.; Antipov, D.; Gurevich, A.A.; Dvorkin, M.; Kulikov, A.S.; Lesin, V.M.; Nikolenko, S.I.; Pham, S.; Prjibelski, A.D.; et al. Spades: A new genome assembly algorithm and its applications to single-cell sequencing. J. Comput. Biol. 2012, 19, 455–477. [Google Scholar] [CrossRef] [Green Version]
  41. Li, H.; Handsaker, B.; Wysoker, A.; Fennell, T.; Ruan, J.; Homer, N.; Marth, G.; Abecasis, G.; Durbin, R.; Genome Project Data Processing, S. The Sequence Alignment/Map format and SAMtools. Bioinformatics 2009, 25, 2078–2079. [Google Scholar] [CrossRef] [Green Version]
  42. Li, H. A statistical framework for SNP calling, mutation discovery, association mapping and population genetical parameter estimation from sequencing data. Bioinformatics 2011, 27, 2987–2993. [Google Scholar] [CrossRef] [PubMed] [Green Version]
  43. Purcell, S.; Neale, B.; Todd-Brown, K.; Thomas, L.; Ferreira, M.A.; Bender, D.; Maller, J.; Sklar, P.; de Bakker, P.I.; Daly, M.J.; et al. Plink: A tool set for whole-genome association and population-based linkage analyses. Am. J. Hum. Genet. 2007, 81, 559–575. [Google Scholar] [CrossRef] [Green Version]
  44. Xie, C.; Tammi, M.T. CNV-seq, a new method to detect copy number variation using high-throughput sequencing. BMC Bioinform. 2009, 10, 80. [Google Scholar] [CrossRef] [PubMed] [Green Version]
  45. Schaad, N.W.; Jones, J.B.; Chun, W. Laboratory Guide for the Identification of Plant Pathogenic Bacteria, 3rd ed.; American Phytopathological Society: Saint Paul, MN, USA, 2001; p. 373. [Google Scholar]
  46. Hayes, R.J.; Trent, M.A.; Truco, M.J.; Antonise, R.; Michelmore, R.W.; Bull, C.T. The inheritance of resistance to bacterial leaf spot of lettuce caused by Xanthomonas campestris pv. vitians in three lettuce cultivars. Hortic. Res. 2014, 1, 14066. [Google Scholar] [CrossRef] [PubMed] [Green Version]
  47. Wang, Y.; Lu, H.; Raid, R.N.; Nuessly, G.D.; Faroutine, G. Diverse responses of lettuce cultivars and germplasm lines to infections of three isolates of Xanthomonas campestris pv. vitians. Hortscience 2015, 50, 650. [Google Scholar] [CrossRef] [Green Version]
  48. Yun, M.H.; Torres, P.S.; El Oirdi, M.; Rigano, L.A.; Gonzalez-Lamothe, R.; Marano, M.R.; Castagnaro, A.P.; Dankert, M.A.; Bouarab, K.; Vojnov, A.A. Xanthan induces plant susceptibility by suppressing callose deposition. Plant. Physiol. 2006, 141, 178–187. [Google Scholar] [CrossRef] [Green Version]
  49. Souza, D.P.; Oka, G.U.; Alvarez-Martinez, C.E.; Bisson-Filho, A.W.; Dunger, G.; Hobeika, L.; Cavalcante, N.S.; Alegria, M.C.; Barbosa, L.R.; Salinas, R.K.; et al. Bacterial killing via a type iv secretion system. Nat. Commun. 2015, 6, 6453. [Google Scholar] [CrossRef] [Green Version]
  50. Altschul, S.F.; Gish, W.; Miller, W.; Myers, E.W.; Lipman, D.J. Basic local alignment search tool. J. Mol. Biol. 1990, 215, 403–410. [Google Scholar] [CrossRef]
  51. Canteros, B.I.; Minsavage, G.V.; Jones, J.B.; Stall, R.E. Diversity of plasmids in Xanthomonas campestris pv. vesicatoria. Phytopathology 1995, 85, 1482–1486. [Google Scholar] [CrossRef]
  52. Power, R.A.; Parkhill, J.; de Oliveira, T. Microbial genome-wide association studies: Lessons from human GWAS. Nat. Rev. Genet. 2017, 18, 41–50. [Google Scholar] [CrossRef] [PubMed]
  53. Earle, S.G.; Wu, C.H.; Charlesworth, J.; Stoesser, N.; Gordon, N.C.; Walker, T.M.; Spencer, C.C.A.; Iqbal, Z.; Clifton, D.A.; Hopkins, K.L.; et al. Identifying lineage effects when controlling for population structure improves power in bacterial association studies. Nat. Microbiol. 2016, 1, 16041. [Google Scholar] [CrossRef] [PubMed] [Green Version]
  54. Brynildsrud, O.; Snipen, L.G.; Bohlin, J. CNOGpro: Detection and quantification of CNVs in prokaryotic whole-genome sequencing data. Bioinformatics 2015, 31, 1708–1715. [Google Scholar] [CrossRef] [Green Version]
  55. Zhang, F.; Hu, Z.; Wu, Z.; Lu, J.; Shi, Y.; Xu, J.; Wang, X.; Wang, J.; Zhang, F.; Wang, M.; et al. Reciprocal adaptation of rice and Xanthomonas oryzae pv. oryzae: Cross-species 2D GWAS reveals the underlying genetics. Plant Cell 2021, 33, 2538–2561. [Google Scholar] [PubMed]
Figure 1. Neighbour-joining tree of Xanthomonas hortorum pv. vitians isolates purified from 2014 to 2017 in Quebec, Canada, and 30 xanthomonads reference strains, based on multilocus sequence analyses. Bootstrap support values are shown at nodes and bar lengths are in a number of substitutions per site. Phylogroups A, B, C, D and E were composed of 427, 2, 21, 25 and 220 isolates of X. hortorum pv. vitians, respectively.
Agronomy 11 02386 g001
Figure 2. Disease severities of X. hortorum pv. vitians isolates tested on different lettuce cultivars. Little Gem (top panel), Romora (panel in the middle) and Paris Island Cos (bottom panel). Each group, based on multilocus sequence analyses, is shown (A to E). Isolates are sorted in ascending order of their symptom severity on cultivar Little Gem and the same order was kept for the other lettuce cultivars.
Agronomy 11 02386 g002
Figure 3. Correlation of disease severity caused by X. hortorum pv. vitians isolates on three lettuce cultivars. The absence of correlation is indicated by the low R2 values.
Agronomy 11 02386 g003
Figure 4. Disease severities of X. hortorum pv. vitians isolates reclassified in pathotypes by their ability to cause symptoms on each lettuce cultivars inoculated. Isolates in each pathotype are sorted in ascending order of their symptom severity on the cultivar Little Gem, and the same order was kept for the other lettuce cultivars.
Agronomy 11 02386 g004
Figure 5. Xanthan production of X. hortorum pv. vitians isolates expressed in grams of xanthan produced by grams of biomass. Fisher’s F-test reveals a significant difference in xanthan production (p = 0.013), as shown by the letters a and b on top of bars. Outlier values are shown as black dots, Values for isolates associated to pathotypes II, III, IV and V are labelled with colors blue, red, green and purple respectively.
Agronomy 11 02386 g005
Figure 6. Xanthomonadins production of X. hortorum pv. vitians isolates expressed by the absorbance at 441 nm of methanol extracts. Fisher’s F-test reveals a significant difference in xanthomonadins production (p = 0.002), as shown by the letters a and b on top of bars. Outlier values are shown as black dots, Values for isolates associated to pathotypes II, III, IV and V are labelled with colors blue, red, green and purple respectively.
Agronomy 11 02386 g006
Figure 7. Disease severity on different lettuce cultivars based on the approximate number of nucleotides covered on reference B07-007 strain plasmid sequence. Little Gem (top panel), Romora (middle panel) and Paris Island Cos (bottom panel). Far-right values are equivalent to the 75,648 bp B07-007 strain plasmid sequence. Each dot represents a single isolate sequenced and inoculated on lettuce leaves.
Agronomy 11 02386 g007
Figure 8. Manhattan Plot of diverse elements significantly associated with disease severity on the tolerant lettuce cultivar Little Gem. SNPs (A), gaps (zero-coverage nucleotides) (B) and CNVs identified during GWAS on chromosome and plasmid (C) or on de novo contigs (D). The line represents the significance level adjusted with the Bonferroni correction.
Agronomy 11 02386 g008
Table 1. Disease rating scale used to evaluate the severity of symptoms of bacterial leaf spot of lettuce.
Diameter of LesionsScoreOccurrence of LesionsScore
<2 mm1On one inoculated leaf0.1
2 mm ≤ lesions ≤ 5 mm2On less than half of inoculated leaves but on more than one0.2
5 mm ≤ lesions ≤ 9 mm3On more than half of inoculated leaves0.3
9 mm ≤ lesions ≤ 20 mm4
20 mm ≤ lesions ≤ 41 mm5
Table 2. Pathotype classification of X. hortorum pv. vitians isolates based on their pathogenicity on the three lettuce cultivars tested.
PathotypesNumber of IsolatesSymptoms Observed
Little GemParis Island CosRomora
I4+
II17+
III67++
IV21++
V60+++
(+) ability to cause symptoms; (−) ability to cause HR or absence of symptoms.
Table 3. Ct values of X. hortorum pv. vitians isolates tested with the rhAmp® genotyping assays developed.
IsolatesContig 245Genome 590,650Average Disease SeverityIsolatesContig 245Genome 590,650Average Disease Severity
CtCtLittle Gem CtCtLittle Gem
190716A21.0429.926.0240914AN31.4826.840.7
270716U21.23403.0170914I31.828.423.3
100816Q21.33405.0140916A31.8537.360.7
190716C21.430.535.3060814K32.129.650.7
100816U21.45409.7030914AG32.1232.182.7
030914AC21.6405.0170914Y32.4629.390.0
190716I21.69404.7240914F32.4727.961.3
170914S21.77404.0170914AJ32.5831.222.0
070815F21.83403.7060814AA32.830.782.7
100816C21.9404.0240914P32.8928.032.3
140916O21.96406.0100914A33.0929.52.0
030914A22.04404.0060814Z33.1630.491.3
240914A22.05408.0030914K33.3729.80.0
060814V22.05403.3030914T33.4730.760.7
260814AC22.07403.0030914O33.4929.831.3
170914AK22.12403.0040816B33.6931.61.7
030914W22.1339.975.3100914L33.7231.681.7
260814AF22.23405.7100914F33.9429.031.7
100914X22.23400.7170914A34.1329.962.7
030914E22.26404.0170914T34.3629.461.7
030914AD22.27405.0200814I34.3828.492.3
030914J22.28403.7170914Q34.6730.340.7
240914AK22.31403.0030915I36.0232.491.7
240914BC22.41403.0260814E36.7929.243.0
200814N22.42404.0190716K36.928.241.0
110815K22.46407.7030915A3739.091.7
160615A22.46401.7260814V37.0229.350.0
100914Q22.4731.212.7260814AR37.1428.550.3
110815S22.49403.7260814P38.0128.542.7
240914Q22.54404.0070815H38.1529.612.7
100914AG22.54400.3070815D38.3331.732.7
100914V22.55403.0110815AH38.8929.740.7
100816F22.59403.0110815AF39.0430.971.3
070815B22.6331.182.0110815Z4032.190.0
240914AT22.66404.0160615C4027.71.0
110815D22.87408.3290715K4038.742.7
110815AB23.67406.7
270716A24.5829.410.7
030914Y24.84402.7
Isolates on the left are considered positive for the rhAmp® Contig 245 assay, while isolates on the right are considered negative.
Publisher’s Note: MDPI stays neutral with regard to jurisdictional claims in published maps and institutional affiliations.

