Article

The Contribution of Microorganisms to Soil Organic Carbon Accumulation under Fertilization Varies among Aggregate Size Classes

1
Institute of Eco-Environmental Industrial Technology Research, Shanxi Agricultural University, Taiyuan 030031, China
2
Institute of Agricultural Resources and Regional Planning, Chinese Academy of Agricultural Sciences, Beijing 100081, China
3
TERRA Teaching and Research Centre, Gembloux Agro-Bio Tech, University of Liège, 5030 Gembloux, Belgium
4
Department of Biology, Utah State University, Logan, UT 84322, USA
*
Author to whom correspondence should be addressed.
Agronomy 2021, 11(11), 2126; https://doi.org/10.3390/agronomy11112126
Submission received: 14 September 2021 / Revised: 13 October 2021 / Accepted: 15 October 2021 / Published: 24 October 2021
(This article belongs to the Section Farming Sustainability)

Abstract

:
Long-term fertilization alters soil microbiological properties and then affects the soil organic carbon (SOC) pool. However, the interrelations of SOC with biological drivers and their relative importance are rarely analyzed quantitatively at aggregate scale. We investigated the contribution of soil microbial biomass, diversity, and enzyme activity to C pool in soil aggregate fractions (>5 mm, 2–5 mm, 1–2 mm, 0.25–1 mm, and <0.25 mm) at topsoil (0–15 cm) from a 27-year long-term fertilization regime. Compared to CK (no fertilization management), NP (inorganic fertilization alone) decreased all of the microbial groups’ biomass, while NPS and NPM (inorganic fertilization plus the incorporation of maize straw or composted cow manure) significantly reduced this negative effect of NP on microbial biomass and increased the microbial contribution to C pool. The results show that microbial variables were significantly correlated with SOC content in >0.25 mm aggregates rather than in <0.25 mm aggregates. Fungal variables (fungal, AM biomass, and F/B ratio) and enzyme activities (BXYL and LAP) in >0.25 mm aggregates explained 21% and 2% of C, respectively. Overall, organic matter addition could contribute to higher C storage by boosting fungal community and enzyme activity rather than by changing microbial community diversity in macro-aggregates.

1. Introduction

Terrestrial soils contain approximately three times the stock of carbon (C) of the atmosphere; hence, small changes in soil organic carbon (SOC) have a significant impact on climate change [1]. Among the numerous drivers that regulate the SOC pool, microorganisms are essential for SOC turnover [2]. Microorganisms have been reported to promote the formation of macro-aggregates to physically protect C, and their residues are also considered to constitute an important source of stable C. Simultaneously, microbe-driven soil C decomposition plays a critical role in C cycling [3]. It is reported that over half of the cumulative CO2-C emitted from soil was induced by microbial community [4]. In addition, soil organic matter could be synthesized or degraded by soil enzyme activity [5], which was linked to CO2 production [6]. As such, understanding the contribution of microorganissms and enzymes to the accumulation or consumption of SOC in soil is of utmost importance for regulating soil C and reducing the impact of CO2 on the climate system.
Despite the direct role of microbe-driven decomposition in soil C cycling, the contribution of microorganisms to C turnover is often overlooked in C cycle prediction [7]. Maintaining high richness and diversity of soil microorganisms is critical to mediate C cycling. However, there is less consistency in the research regarding soil microbiological properties, such as soil microbial diversity, microbial community, and enzyme activity. With the most abundance in soil systems [8], microorganisms (e.g., bacteria and fungi) have been reported to facilitate C cycling, through increasing metabolic actions and bonding organic particles together or stimulating root secretion of OM [2]. Some studies found that bacteria contribute to SOC storage more greatly than fungi in the rice and wheat system. Differently, arbuscular mycorrhizal (AM) fungi have been thought not to be very important in C decomposition [9]. Both microbial biomass C and diversity are suspected to play a crucial role in influencing the SOC pool [10,11]. Another result shows that microbial biomass had a significant influence on soil C cycling rather than its community composition under manure application [12]. Additionally, soil enzymes, produced by soil microorganisms, are reported to regulate the overall processing of SOC through degrading different molecules [13] or depolymerizing macromolecular substrates [14]. Some enzymes (e.g., β-Glucosidase and β-Xylosidase activities) show a strong relationship with SOC content and are generally reported to be good indicators of soil biological change [15,16]. It is remarkable that, even if the complexity of SOC-related mechanisms is widely recognized, most studies focused on a single factor, with fewer focused on multiple factors regulating SOC. Moreover, the potential mechanisms by which microbiological properties are linked to C regulation are ignored.
As the basic unit of soil, aggregate plays a key role in C cycling [17]. Containing more than 90% of sequestered SOC, aggregate can be divided into macro- (>0.25 mm) and micro- (<0.25 mm) aggregates [15,16]. Previous studies have shown that macro-aggregate (>0.25 mm) contains more SOC content than micro-aggregate (0.053–0.25 mm), the same as labile SOC [18]. As the basic element in soil structure, aggregate provides spatially heterogeneous microenvironments for soil microorganisms [15,16]. Large variance in environmental conditions in different sizes of aggregate, including water potential, oxygen concentration, and resource availability [19], could result in diverse biomass and community diversity for microorganisms [20,21,22] and affect their functions related to C turnover [23]. It was reported that soil spatial heterogeneity could stimulate biodiversity by limiting these specific or individualized microbial communities [21,22,24]. The distributions of microbial biomass and enzyme activity in aggregate fractions were reported to be primarily governed by the aggregate sizes [25], due to different availability of organic substances [26]. Furthermore, fungi were found to contribute to the C turnover more greatly and rapidly in macro-aggregates than in micro-aggregates [15,16]. There is extensive evidence that aggregate sizes affect microbial community composition and enzyme activity. However, to the best of our knowledge, few studies have investigated the mechanisms linking aggregate size and multiple microbial properties with SOC turnover.
Regarding food demands, the application of inorganic and organic fertilizers in agricultural systems is necessary to increase crop productivity in the world [27,28]. As two of the most common organic amendments in fields, crop straw and manure application could increase the unstable C contents (e.g., dissolved organic carbon (DOC) and readily oxidizable organic carbon (ROC) contents [29]) that are the main C sources for microorganisms. Several studies revealed that alterations in microbial activity could cause priming effects due to the addition of substrate, which might simulate the turnover of natural organic matter in soil [30]. These practices have exhibited high impacts on soil microorganisms’ community structure and diversity [31]. They have also affected enzyme activity through altering the habitat conditions for soil microorganisms. Some researchers also have reported that soil C cycling is stimulated by changing microbial biomass rather than its community composition under manure application [12]. During this process, soil enzyme activities influenced and were related to C cycling [5]. As the microhabitats for microorganisms, the aggregates are greatly changed in their physical conditions under fertilization [32]. For example, soil moisture within aggregate was directly altered by fertilizer application, which plays a key role in the survival of soil microorganisms [15,16]. The application of manure increased the microbial biomass in the form of phospholipid fatty acids (PLFA) in macro-aggregates, e.g., bacterial, fungal, and AM fungal biomass, while not significantly affecting biomass in micro-aggregates. Additionally, soil enzymes are reported to react quickly to changes in most soil managements [15]. Thus, the aggregate size plays a significant role in the relationships between microbial properties and C cycling. Hence, a better understanding of the influence of microbial properties on C cycling at aggregate scale under long-term fertilization regime is important, as it could aid in developing suitable management practices to better increase C accumulation, while simultaneously maintaining a healthier soil microbial environment.
The objective of this study was to investigate the effects of 27-year fertilizations (CK: no fertilization management; NP: inorganic fertilizers application alone; NPS: inorganic fertilization plus the incorporation of maize straw; NPM: inorganic fertilization plus the incorporation of composted cow manure) on soil microbial community and enzyme activity and their roles in influencing C at aggregate scale in the Loess Plateau of China. Here are three hypotheses: (1) Different fertilization managements can induce differences in the distribution of soil C and microorganism communities in aggregates; (2) the relationship between soil microorganisms and enzymes, along with their contributions to C accumulation, vary with aggregate size; (3) NPS and NPM could increase the contribution of microorganisms to C accumulation through influencing the population of microorganism community at aggregate scale.

2. Materials and Methods

2.1. Site Description and Soil Sampling

The study site is located in the Dryland Farming Experimental Station in Shanxi province (112–113 °E, 37–38 °N) in northern China and was initiated in 1993. The site is characterized by a continental monsoon climate, with an elevation of approximately 1100 m above sea level, annual rainfall of 520 mm, and average temperature of 7–8 °C. Spring maize is the main crop grown under the one-crop-per-year cropping system. Soils belong to a sandy clay loam cinnamon soil series, which is characterized as Calcaric-Fluvic Cambisol (ISS-CAS, 2003; IUSS, 2006). At the start of the project, soil pH was on average 7.9, and SOC content was 15.0 g kg−1.
The long-term experiment had a randomized block design with three replicates. Four treatments were chosen for this research, with three plots (each plot was 6 × 6 m) per treatment. The four treatments included in this study were as follows: no fertilization management (CK), inorganic fertilizers application alone (NP), inorganic fertilization plus the incorporation of 3000 kg ha−1 maize straw (NPS), and inorganic fertilization in combination with 1500 kg ha−1 composted cow manure (NPM). Each plot of the treatments NP, NPS, and NPM had nitrogen 105 kg ha−1 and phosphorus 105 kg ha−1 applied once a year, respectively, using urea (46% N) and calcium superphosphate (7% P) in a ratio of N to P of 1:0.44. The mean proportions of organic matter, total nitrogen, total phosphorus, and total potassium were 75%, 0.63%, 0.04%, and 0.72% in maize straw and 36%, 0.96%, 0.17%, and 0.74% in cattle manure, respectively. Maize straw, cattle manure, and inorganic fertilizers were broadcasted and incorporated into the soil with conventional tillage (plowing once each year at a depth of 20 cm) after harvesting in October. Seeding was done at the end of April without any tillage and harvesting in October, with weeding occurring twice during growth seasons every year. Table 1 shows the chemical and physical properties of the soil in these treatments in 2018.
Soil samples were obtained after harvesting (before fertilizer application) in October, 2018. For each treatment, five soil cores (10 × 10 cm in diameter) were collected randomly at a depth of 0–15 cm in each plot, pooled together, and thereafter were placed on ice bag and taken to laboratory immediately. The fresh soil was separated manually along the natural cracks of fracture to obtain aggregate sizes of <6 mm and remove stones, plant material, and visible soil fauna. In addition, undisturbed soil samples were taken by stainless steel rings (100 cm3 volume) for soil bulk density analysis.

2.2. Aggregate Fractionation

We chose to separate aggregates into five size classes through dry-sieving of fresh soil, because wet-sieving disrupts the in situ link between the aggregates obtained and their indigenous microbial inhabitants. The undisturbed fresh soil samples were isolated by dry-sieving of fresh soil (moisture content ca. 10%) on a series of four sieves and divided into five aggregate sizes [18]. Sieves were mechanically shaken (amplitude 1.5 mm) for 2 min to separate soil by the mesh sieves (5 mm, 2 mm, 1 mm and 0.25 mm) on Retsch AS200 Control (Retsch Technology, Düsseldorf, Germany). Then, the classified aggregates (20 groups of aggregate samples in total) were divided in half: one half was immediately stored at −80 °C for biochemical analysis, and the other half was kept at 4 °C for the analysis of organic carbon contents. All aggregates were tested in 3 replicates.
In addition, the proportions of different aggregates were obtained by placing another 200 g of the soil mentioned above on mounted nested sieves. After removing the visible impurities, 200 g samples (dried soil) were passed through a series of four sieves (5 mm, 2 mm, 1 mm, and 0.25 mm) and divided into five aggregate sizes, then weighed separately.

2.3. Determination of Soil Physical and Chemical Properties

Soil pH was analyzed using a pH meter (deionized water:soil, 2.5:1). Soil moisture was determined at 105 °C to ensure constant weight following the oven-drying method. Soil bulk density was calculated on an oven-dry basis by the core method. The SOC was estimated from dried soil with an element analyzer (C/N Flash EA 112 Series-Leco Truspec). Dissolved organic carbon (DOC) content was measured through detecting soil extracted solution made by distilled water (1:5 w/v) using a C analyzer (Multi N/C 3100, Analytic Jena, Germany). Readily oxidizable organic carbon (ROC) content was analyzed by KMnO4 oxidation. Briefly, after passing through 0.15 mm sieve, the air-dried soil (containing approximately 15–30 mg C) was added to 25 mL of 333 m mol L−1 KMnO4, then shook and centrifuged. The supernatants were diluted with deionized water (1:250) and detected by a UV spectrophotometer at 565 nm. Microbial biomass carbon (MBC) content was measured using the fumigation–incubation method [33]. In detail, four aliquots of freeze-dried soil samples (25 g each aliquot) were prepared, two aliquots being fumigated with ethanol-free CHCl3 for 24 h in the dark at room temperature, while the other two were kept untreated as control. Then, these samples were mixed into 100 mL of 0.5 mol L−1 K2SO4 solution, respectively, and shaken for 30 min at 200 r min−1. The supernatants were diluted with deionized water and then detected by a total organic C (TOC) analyzer.

2.4. Analysis of Enzyme Activity

In this study, activities of the four soil enzymes β-Glucosidase (BG), β-Xylosidase (BXYL), N-acetyl-glucosaminidase (NAG), and leucine aminopeptidase (LAP) were estimated following the method of previous studies [34,35]. 4-Methyllumbelliferyl (MUB) and 7-amino-4-methylcoumarin (AMC) were used as substrate to determine the activities of all enzymes (MUB for BG, BXYL, and NAG; AMC for LAP). Firstly, 1 g of fresh soil was mixed in 125 mL of NaHCO3 buffer (pH = 8) and stirred at 800 rpm for 2.5 min. Secondly, the slurry was transferred into 96-well microplate using an eight-channel pipet, and substrates were quickly added. Thirdly, all the microplates were incubated in a dark for 3 h at 25 °C. Finally, the fluorescence of the supernatants was detected using a multilabel fluorescence reader (Tecan Infinite F200/M200).

2.5. PLFA Extraction and Analysis

Phospholipid fatty acids (PLFA) were measured to calculate the soil microbial biomass and diversity. The method’s details were described in previous research [36]. In brief, aliquots of 3 g (freeze-dried) aggregate samples were extracted twice in 7.6 mL chloroform/methanol/citrate buffer (1:2:0.8 v/v/v) system. After that, phospholipids were separated from neutral lipids and glycolipids with silica acid columns (Supelco Inc., Bellefonte, PA, USA). After methylation of the polar lipids, the fatty acid methyl esters (FAME) were identified by Gas Chromatograph Agilent Series (GC 6890, Agilent Technologies, Wilmington, DE, USA) and calculated by MIDI microbial identification system (MIDI, Inc., Newark, DE, USA). Nonadecanoic acid (19:0) was used as an internal standard.
PLFA were assigned to general bacteria (16:0, 17:0, 18:0, 20:0), gram-negative bacteria (G−), gram-positive bacteria (G+), general fungi (18:2ω6c), arbuscular mycorrhizae (AM, 16:1ω5c) and actinomycetes (16:1ω5c). Cyclopropyl and monounsaturated fatty acids were indicators for G-bacteria, whereas iso- and anteiso-branched fatty acids were biomarkers for G+ bacteria.

2.6. Data Calculation and Statistical Analysis

The proportions of graded aggregates with different particle sizes were calculated as following Equation (1):
D r y - p i = W i × 100 % / 200
where Wi was the mass of i-th graded aggregates with different particle sizes, the constant 200 was the weight of all aggregates, and Dry-pi was the proportion of i-th graded aggregates in total soil. MBC concentration was obtained by calculating the difference in OC between fumigated and non-fumigated samples with 0.45 (the proportion of soil biomass C extracted by K2SO4 after chloroform fumigation) using Equation (2):
M B C = F u m i g a t e d U n f u m i g a t e d / 0.45
where Fumigated and Unfumigated were the OC extracted in K2SO4 from fumigated and non-fumigated soil samples per gram of soil, and 0.45 was the conversion factor and was used to the calculation of MBC [37]. Microbial community diversities were evaluated using Shannon–Wiener diversity index (H’), Simpson evenness index (D), and Margalef richness index (M). They were generally calculated as follow:
H = i = 1 s ( p i × l n p i )
D = 1 i = 1 s p i ^ 2
M = S 1 / l n N
where H′, D, and M were Shannon–Wiener diversity index, Simpson evenness index, and Margalef richness index, respectively; pi was the percentage of the peak area of i-th FAME to the total area in each sample; S was the total number of FAME in each sample; N was the amount of total microbial PLFA.
Statistically, all data were obtained by SAS 9.4 in Windows 10. Two-way analysis of ANOVA was used to examine fertilization treatment and aggregate size on all of the soil physicochemical and microbial indicators. We detected heterogeneity using Levene’s test before carrying out ANOVA, and the data for each variable met the heterogeneity of variance criteria. Correlations with p-value lower than 0.05, 0.01, and 0.001 were considered. Spearman correlation was computed between microbial parameters and SOC under each aggregate size and between soil physicochemical and microbial parameters in >0.25 mm and <0.25 mm aggregates. Additionally, principal component analysis (PCA) was performed to divide the microbial factors correlated with SOC into different groups in >0.25 mm aggregates using Vegan package in R 3.2.2 (R, R Core Team, R Foundation for Statistical Computing, Vienna, Austria), and variation partitioning analysis (VPA) was further applied to quantify how much variation in SOC was explained by fungal community, microbial diversity, and enzyme activity in the Vegan package of R 3.2.2.

3. Results

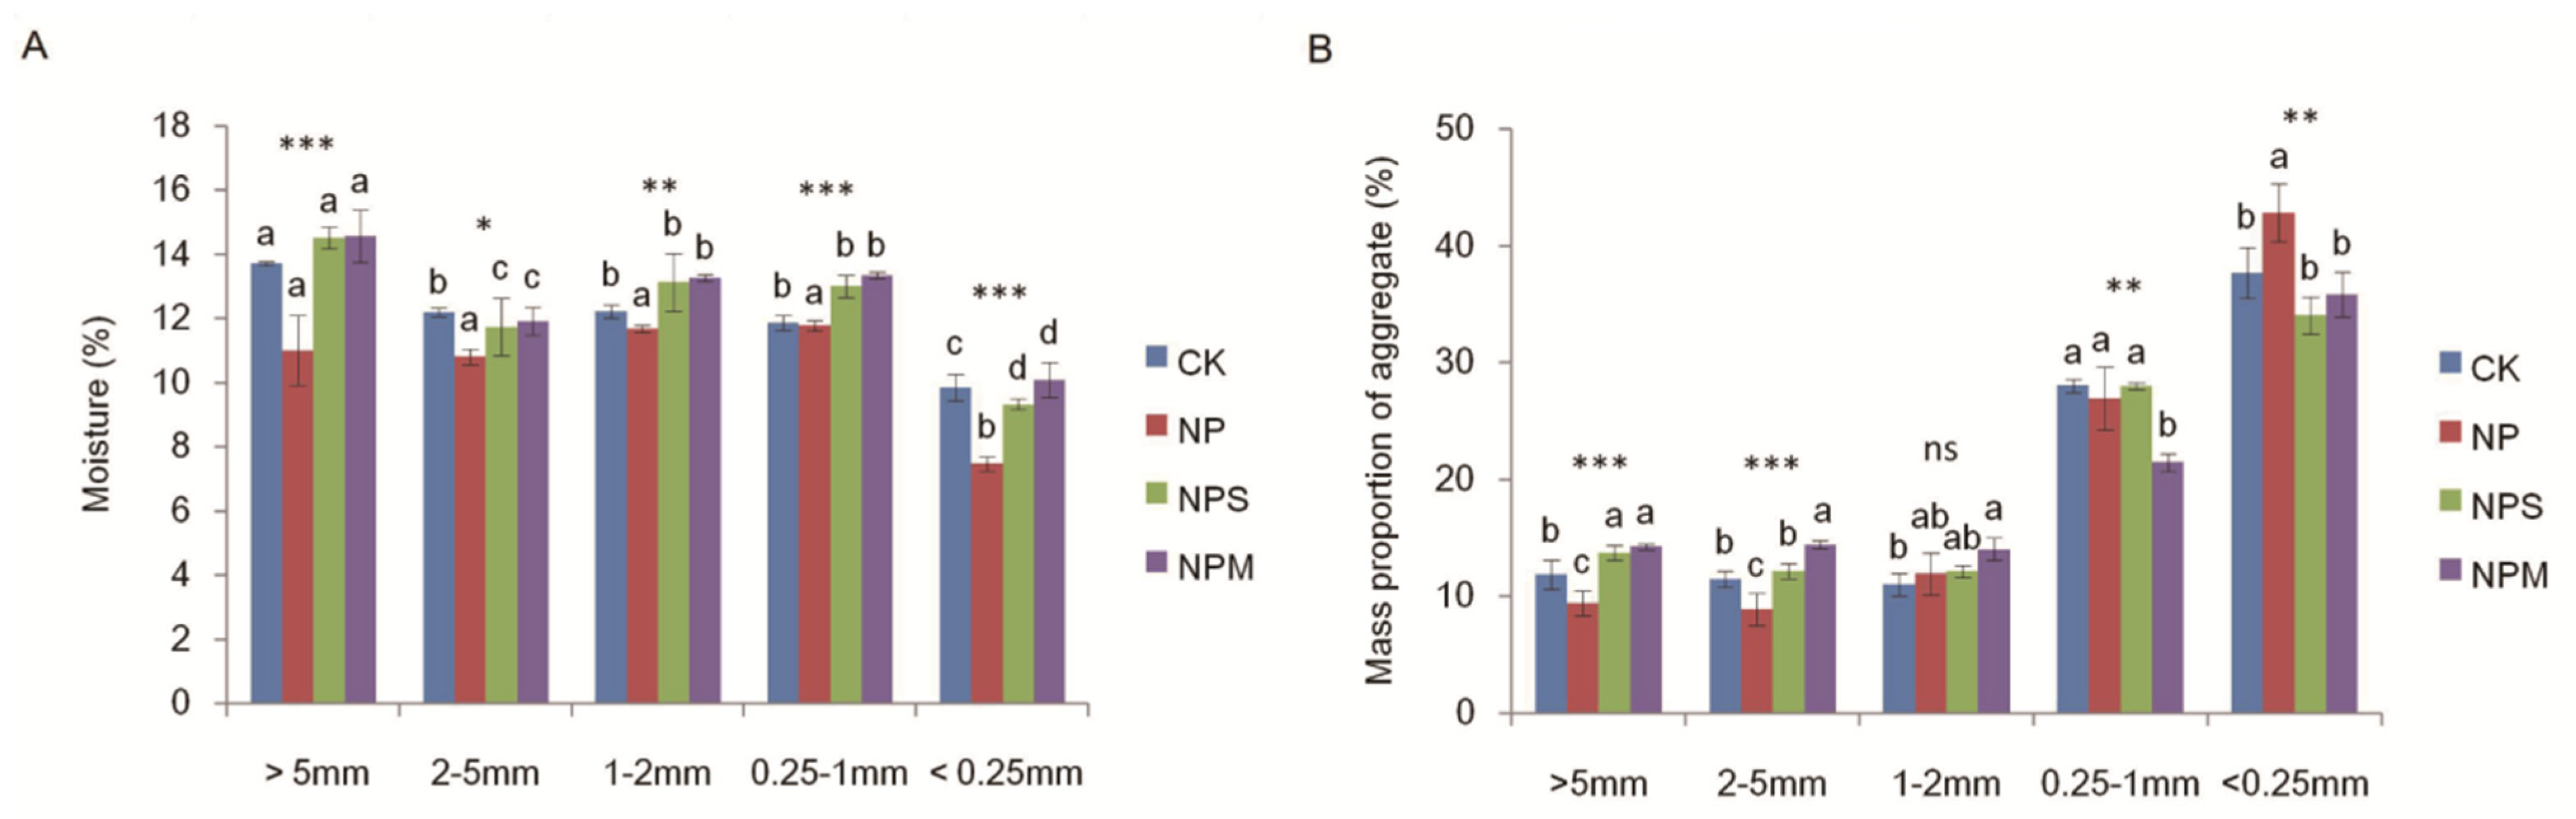
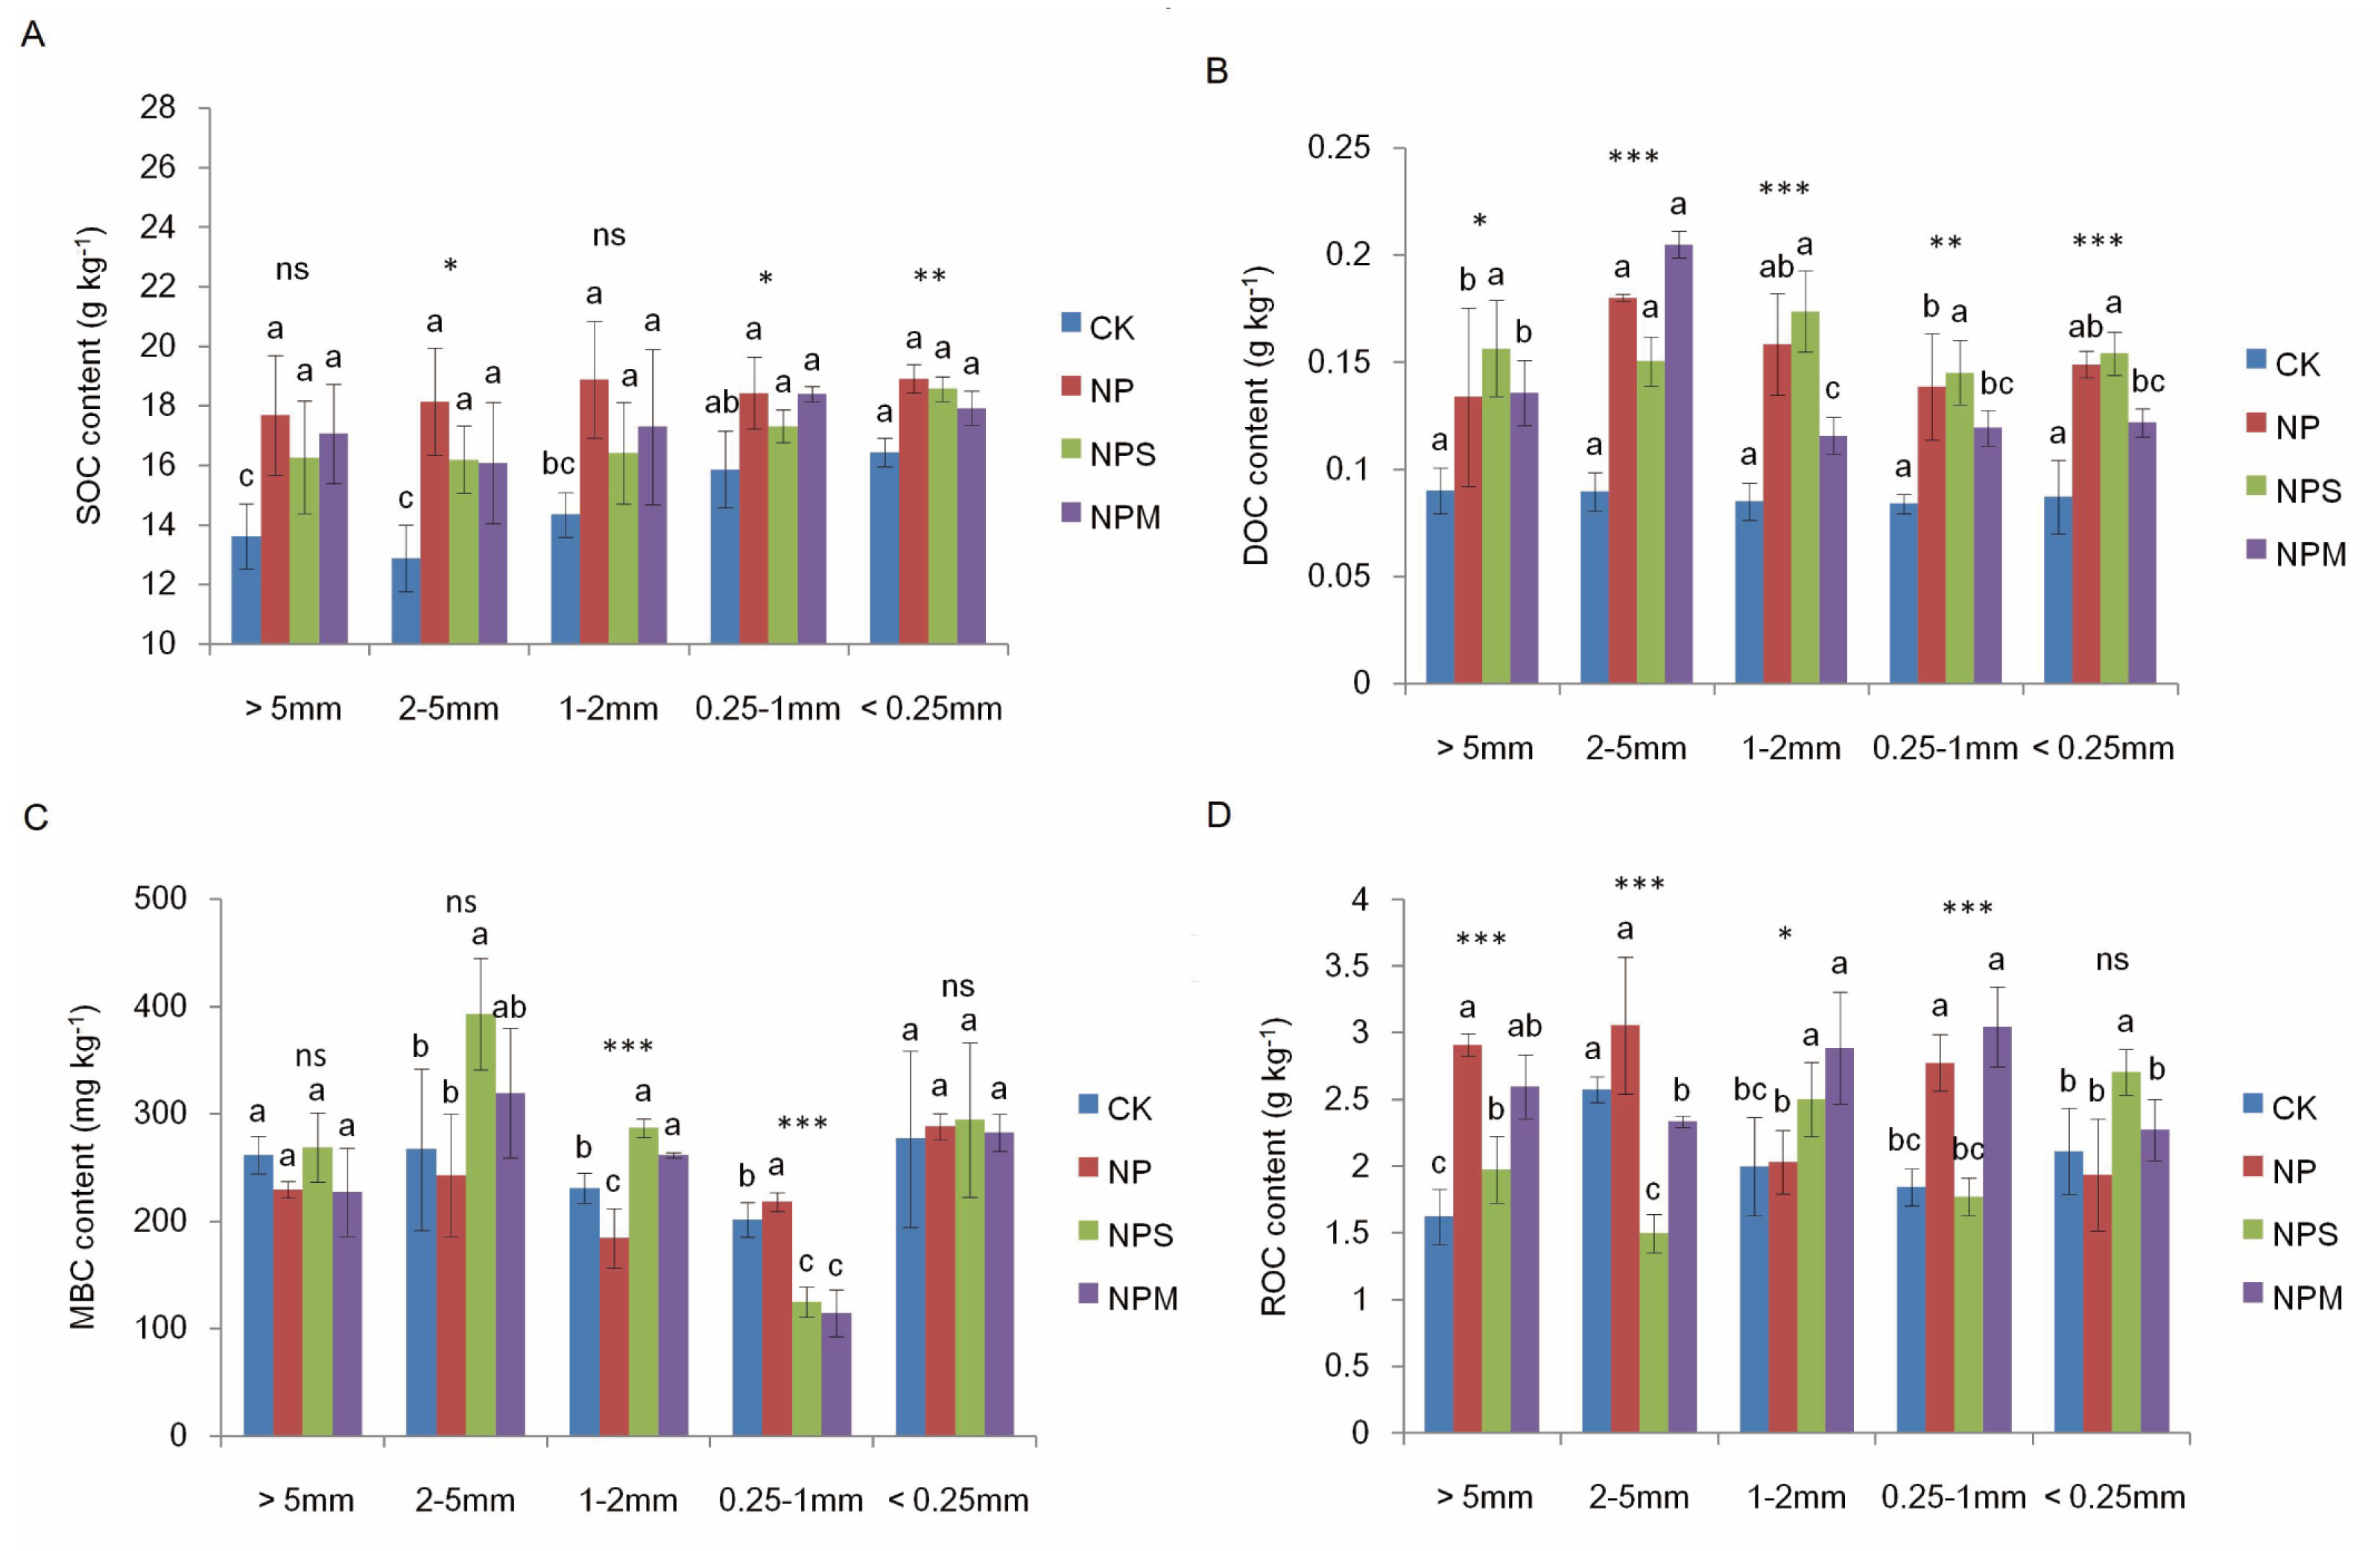
3.1. Soil Organic C and Moisturein Aggregate and Aggregate Proportions under Different Fertilizations

As seen in Table 2, SOC and DOC contents varied with fertilization and aggregate size, both of which were higher under NP, NPS, and NPM than under CK in almost all aggregates (p < 0.05; Figure 1A,B). In CK, SOC contents in macro-aggregates (>0.25 mm) were significant lower than in micro-aggregates (<0.25 mm). In NP, NPS, and NPM, there were no differences in SOC contents among all aggregates.MBC and ROC contents were significantly affected by fertilization and aggregate size, respectively (p < 0.001; Table 2). The four treatments had no significant differences in ROC and MBC contents (Figure 1C,D) in micro-aggregates (<0.25 mm), and a similar observation was also made concerning the ratio of MBC to SOC content (Figure 2).
Fertilization, aggregate size, and their interaction significantly affected the moisture in aggregate (p < 0.001; Table 2). The moisture was lower in NP than in CK in almost all aggregates (p < 0.05; Figure 3A). Compared to NP, NPS and NPM significantly increased moisture in all aggregates (p < 0.05). The moisture was higher in macro-aggregates (>0.25 mm) than in micro-aggregates (<0.25 mm) under the four treatments.
There was an extremely significant difference in aggregate mass proportions among aggregate sizes (p < 0.001; Table 2). Compared to CK, NP significantly (p < 0.05; Figure 3B) reduced the mass proportions of macro-aggregates (>2 mm) but increased the mass proportions of micro-aggregates (<0.25 mm), while the results under NPS and NPM are the opposite.

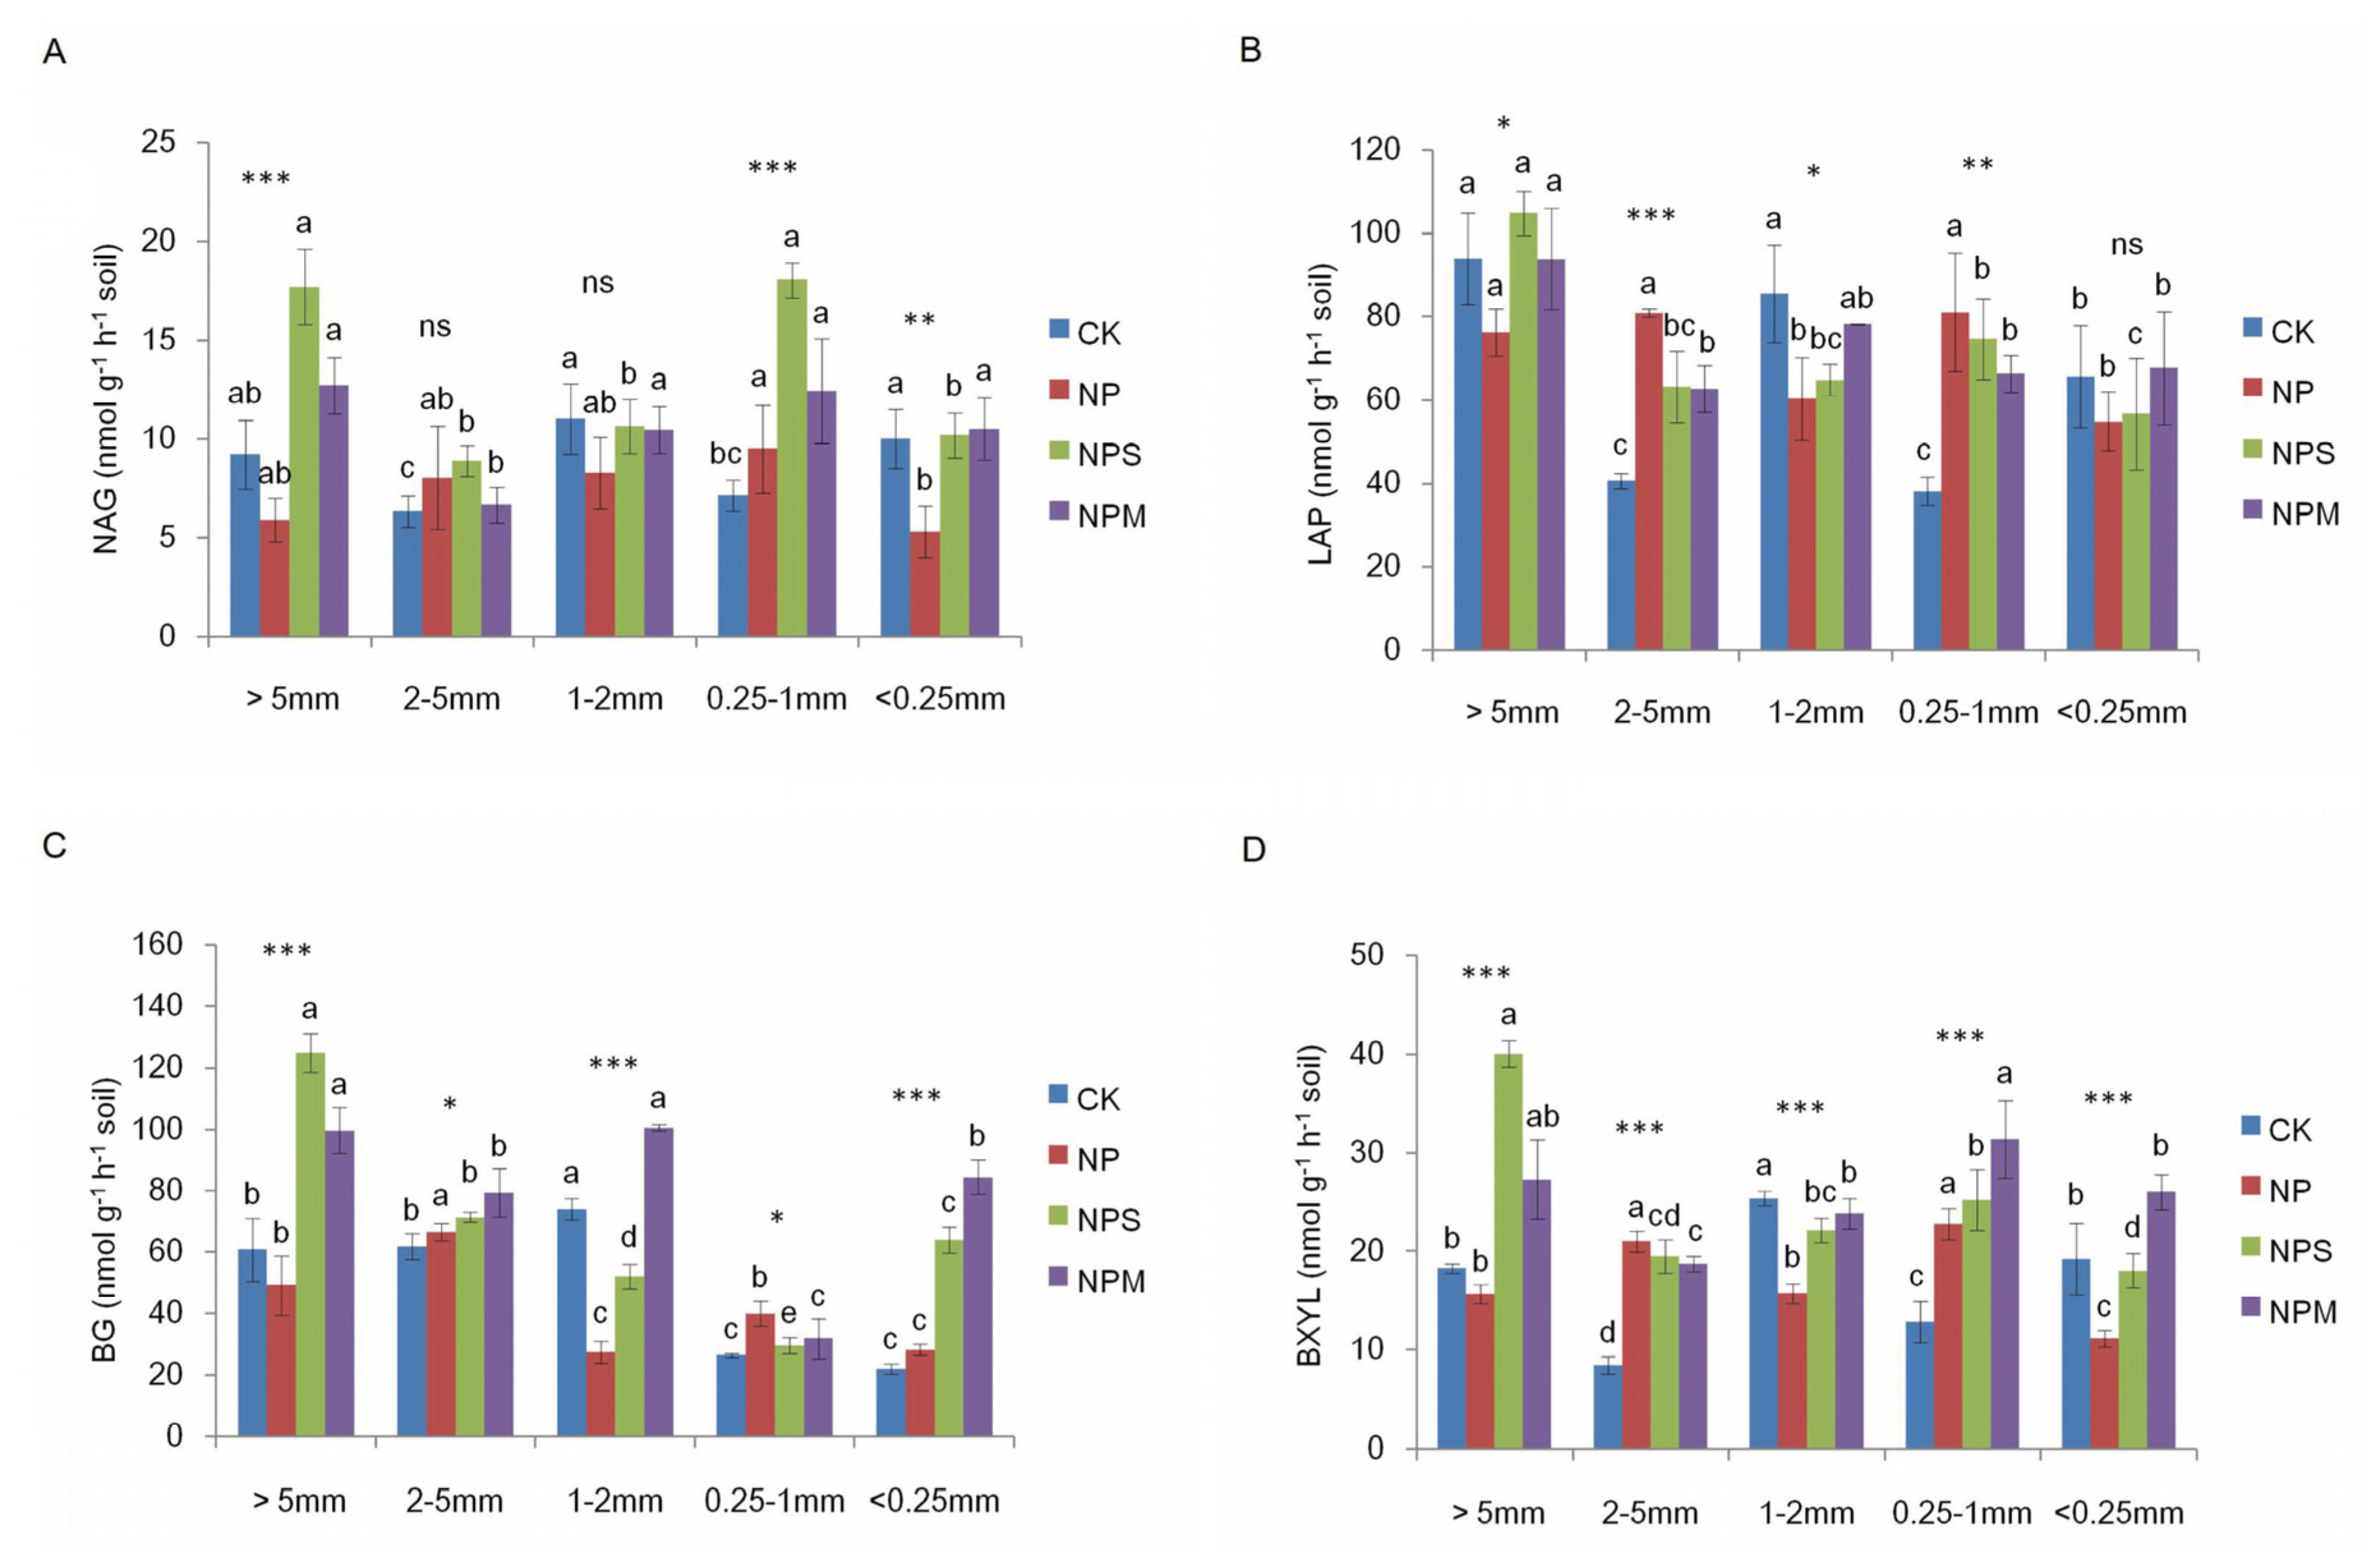
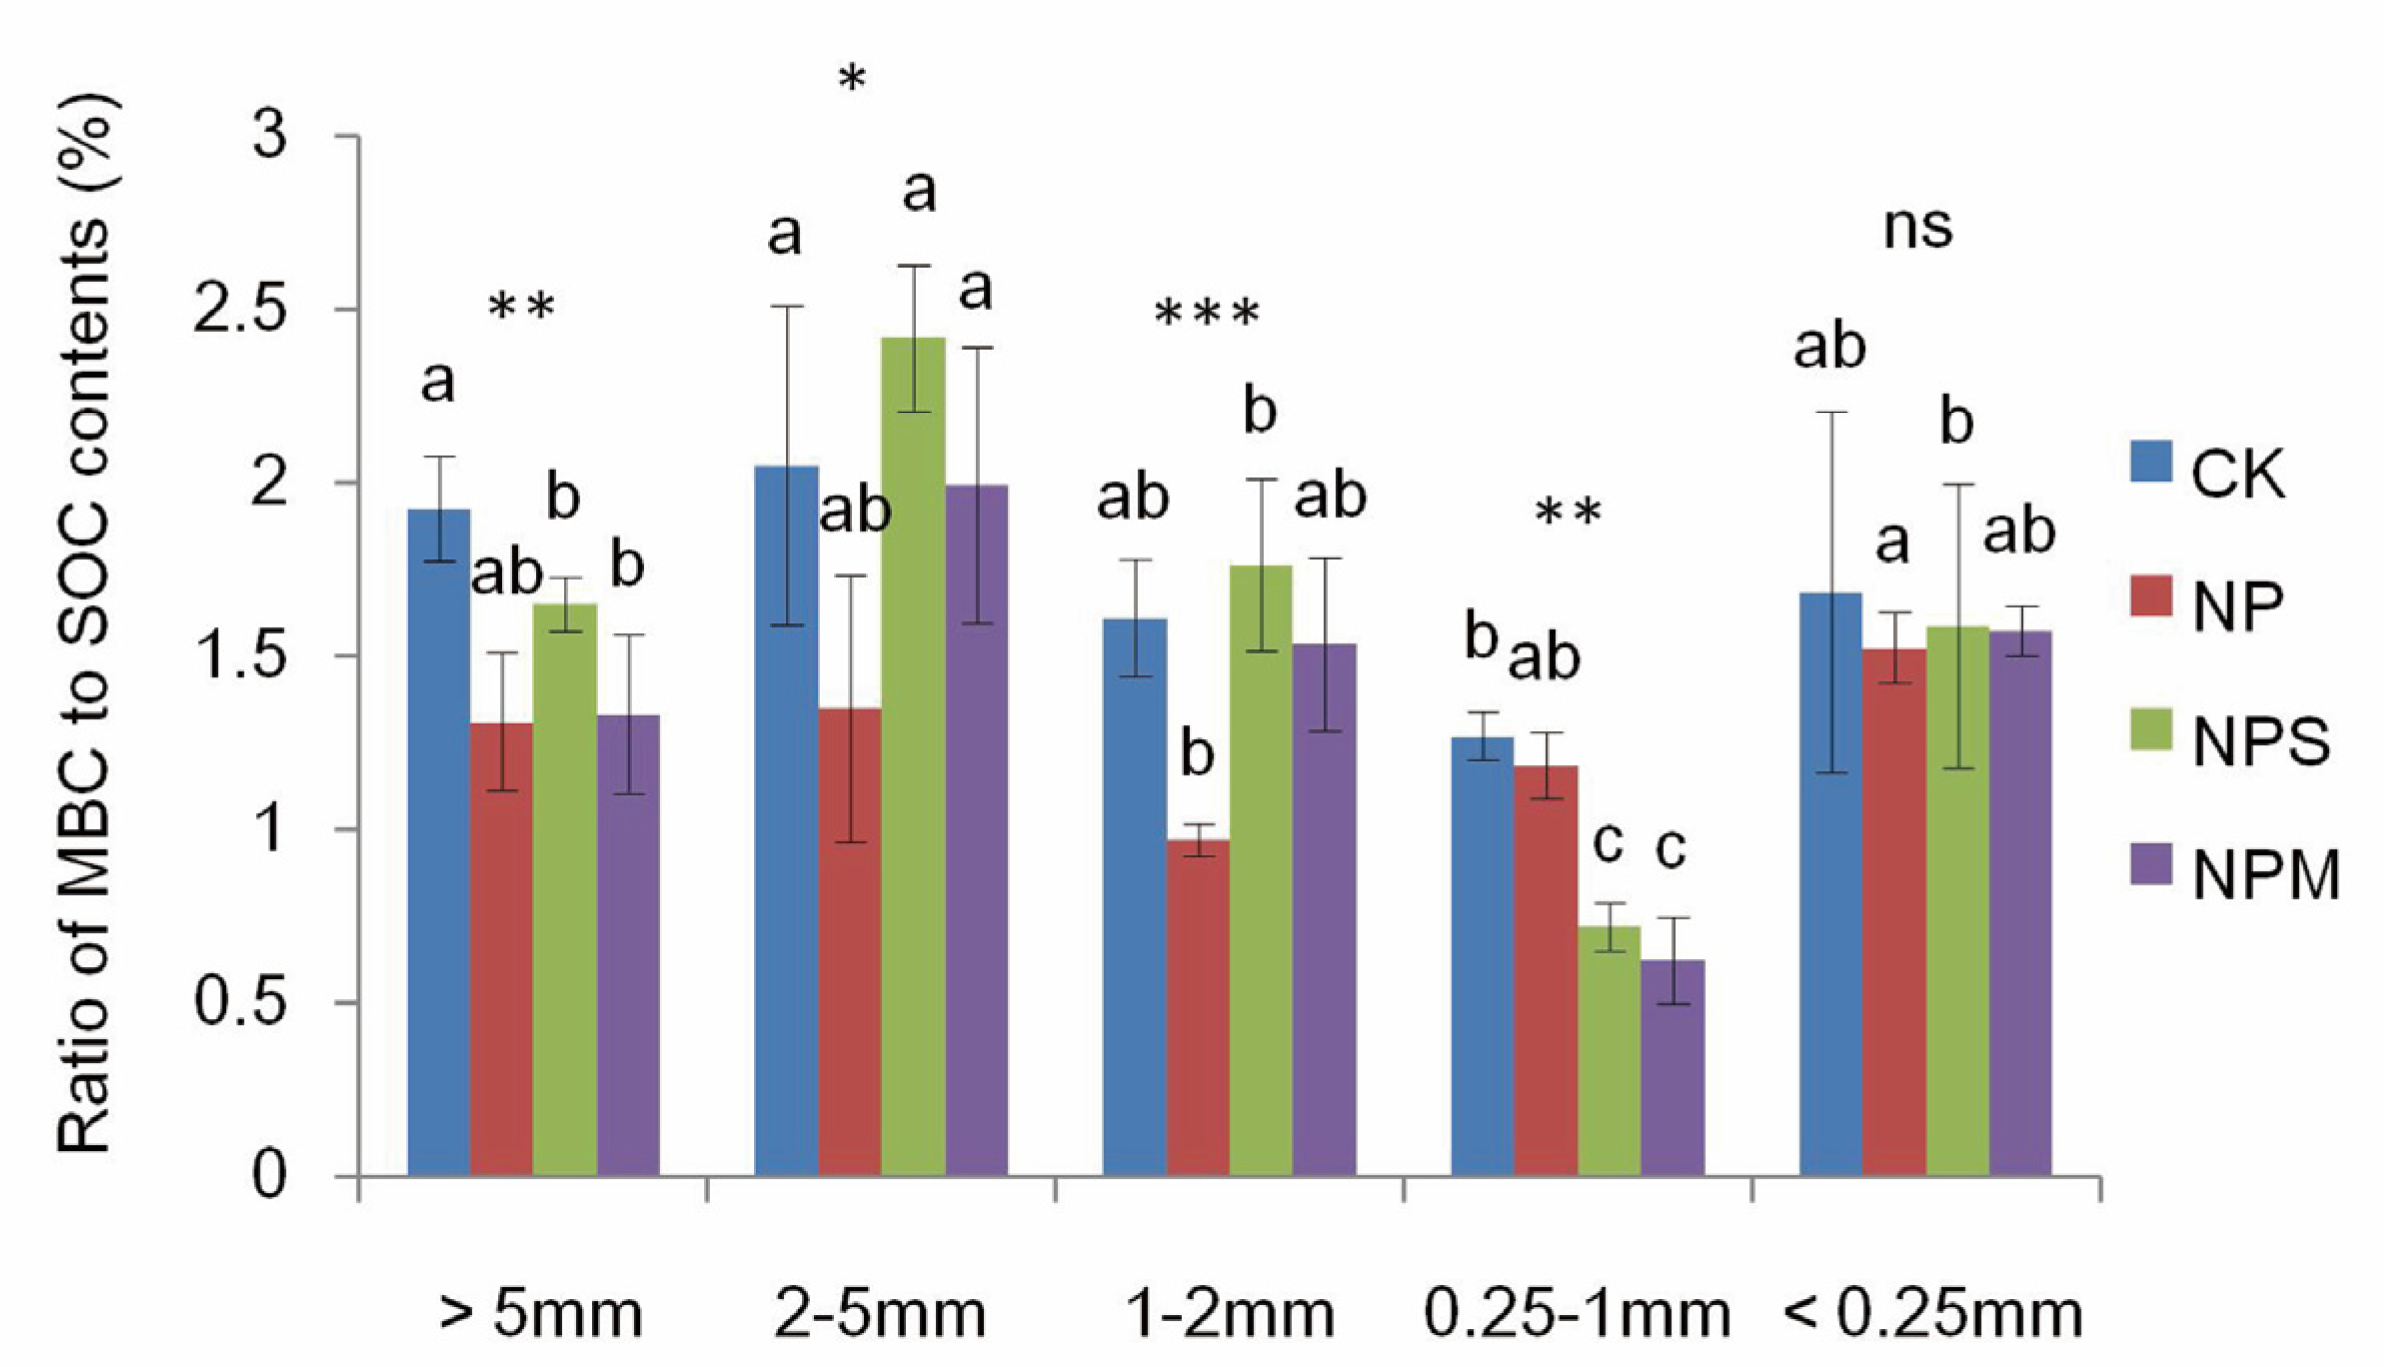
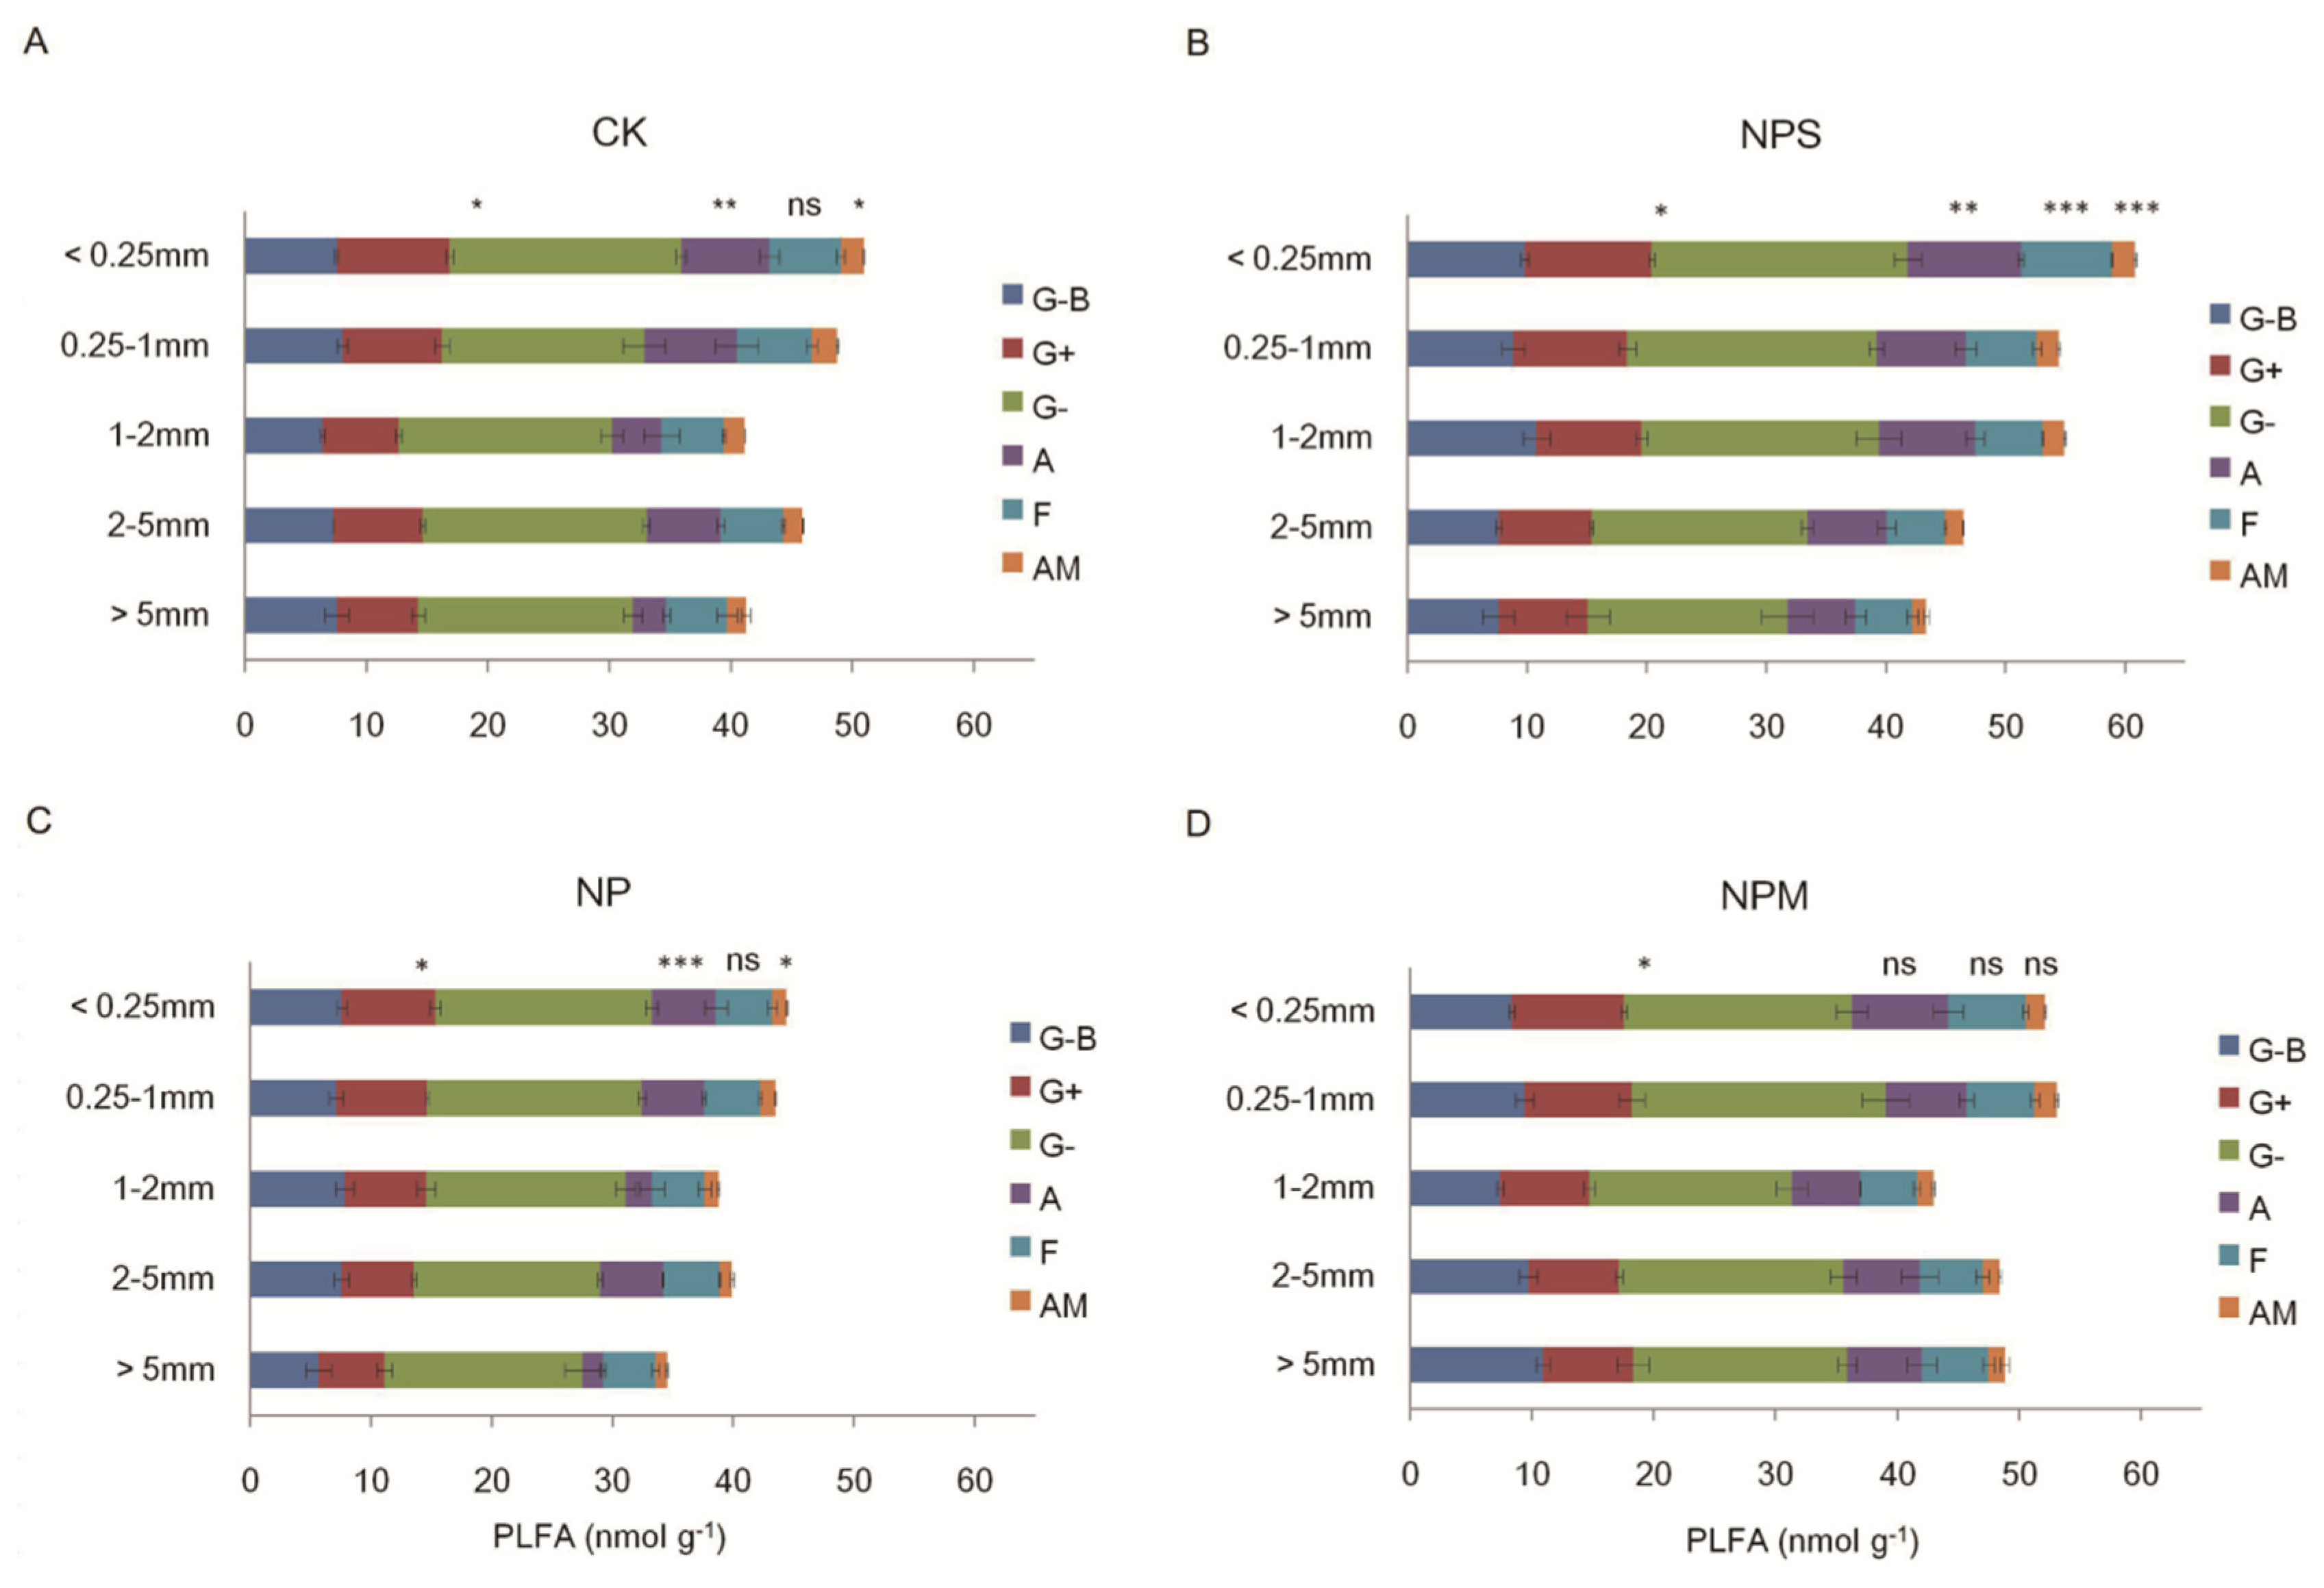
3.2. Soil Microbial Biomass and Diversity and Enzyme Activity

Soil microbial biomass was significantly impacted by fertilization and aggregate size (p < 0.01; Table 2). Compared to CK (Figure 4A), NP (Figure 4C) decreased all microbial indices, while NPS and NPM increased them (except fungi indices) in differently sized aggregates (Figure 4B,D). Increases in fungal biomass (including AM) and F/B ratio were observed only in micro-aggregates (<0.25 mm) under NPS and NPM relative to CK. In micro-aggregates (<0.25 mm), the bacterial and fungal biomass were higher under NPS treatment than under CK. Most of the microbial groups’ biomass increased with the decreasing of aggregate size under NPS and NP, while there was no significant difference in microbial biomass (except bacterial biomass) among any aggregates under NPM. Additionally, the ratio of fungi:bacteria (F/B) and G+: G− (G+/G−) is also affected by fertilization (Table 3), and there were no significant differences in the two ratios among all aggregate sizes under NPM. The biomass of different microbial groups was lower in macro-aggregates (>0.25 mm) than in micro-aggregates (<0.25 mm) under fertilization. The total PLFA was significantly associated with moisture in macro-aggregates (>0.25 mm).
As shown in Table 2, significant (p < 0.05) interactive effects between fertilization and aggregate size were observed in all indices of microbial diversity. The three indices were affected significantly by fertilization, especially in 0.25–1 mm and 2–5 mm aggregates (p < 0.05; Table 3), but not in micro-aggregates. Unlike CK and NP treatments, these three indices had no significant difference among variably sized aggregates under NPS and NPM. Based on Figure 5B, the microbial diversities of Shannon–Wiener (H′) and Simpson (D) were respectively correlated with bacteria (including G+ and G−) and actinomycetes in macro-aggregates (>0.25 mm).
All of the four soil enzymes’ activities varied with fertilization and aggregate size (p < 0.05; Table 2). In Figure 6, the four soil enzymes’ activities were higher under NPM and NPS than under CK in all macro-aggregates (except 1–2 mm). NP increased those activities only in 2–5 mm and 0.25–1 mm, while it decreased them in other aggregate sizes, compared to CK. There were no differences under LAP and NAG between NPS, NPM, and CK in micro-aggregates (<0.25 mm). The four soil enzymes’ activities were higher in >0.25 mm than in <0.25 mm aggregates under NP treatment. The activities of NAG, LAP, and BXYL were higher under NPS and NPM in >0.25 mm aggregates (except 2–5 mm) than in micro-aggregates (<0.25 mm). Soil enzyme activity was positively correlated with bacterial biomass and moisture in >0.25 mm aggregates (p < 0.05; Figure 5B).

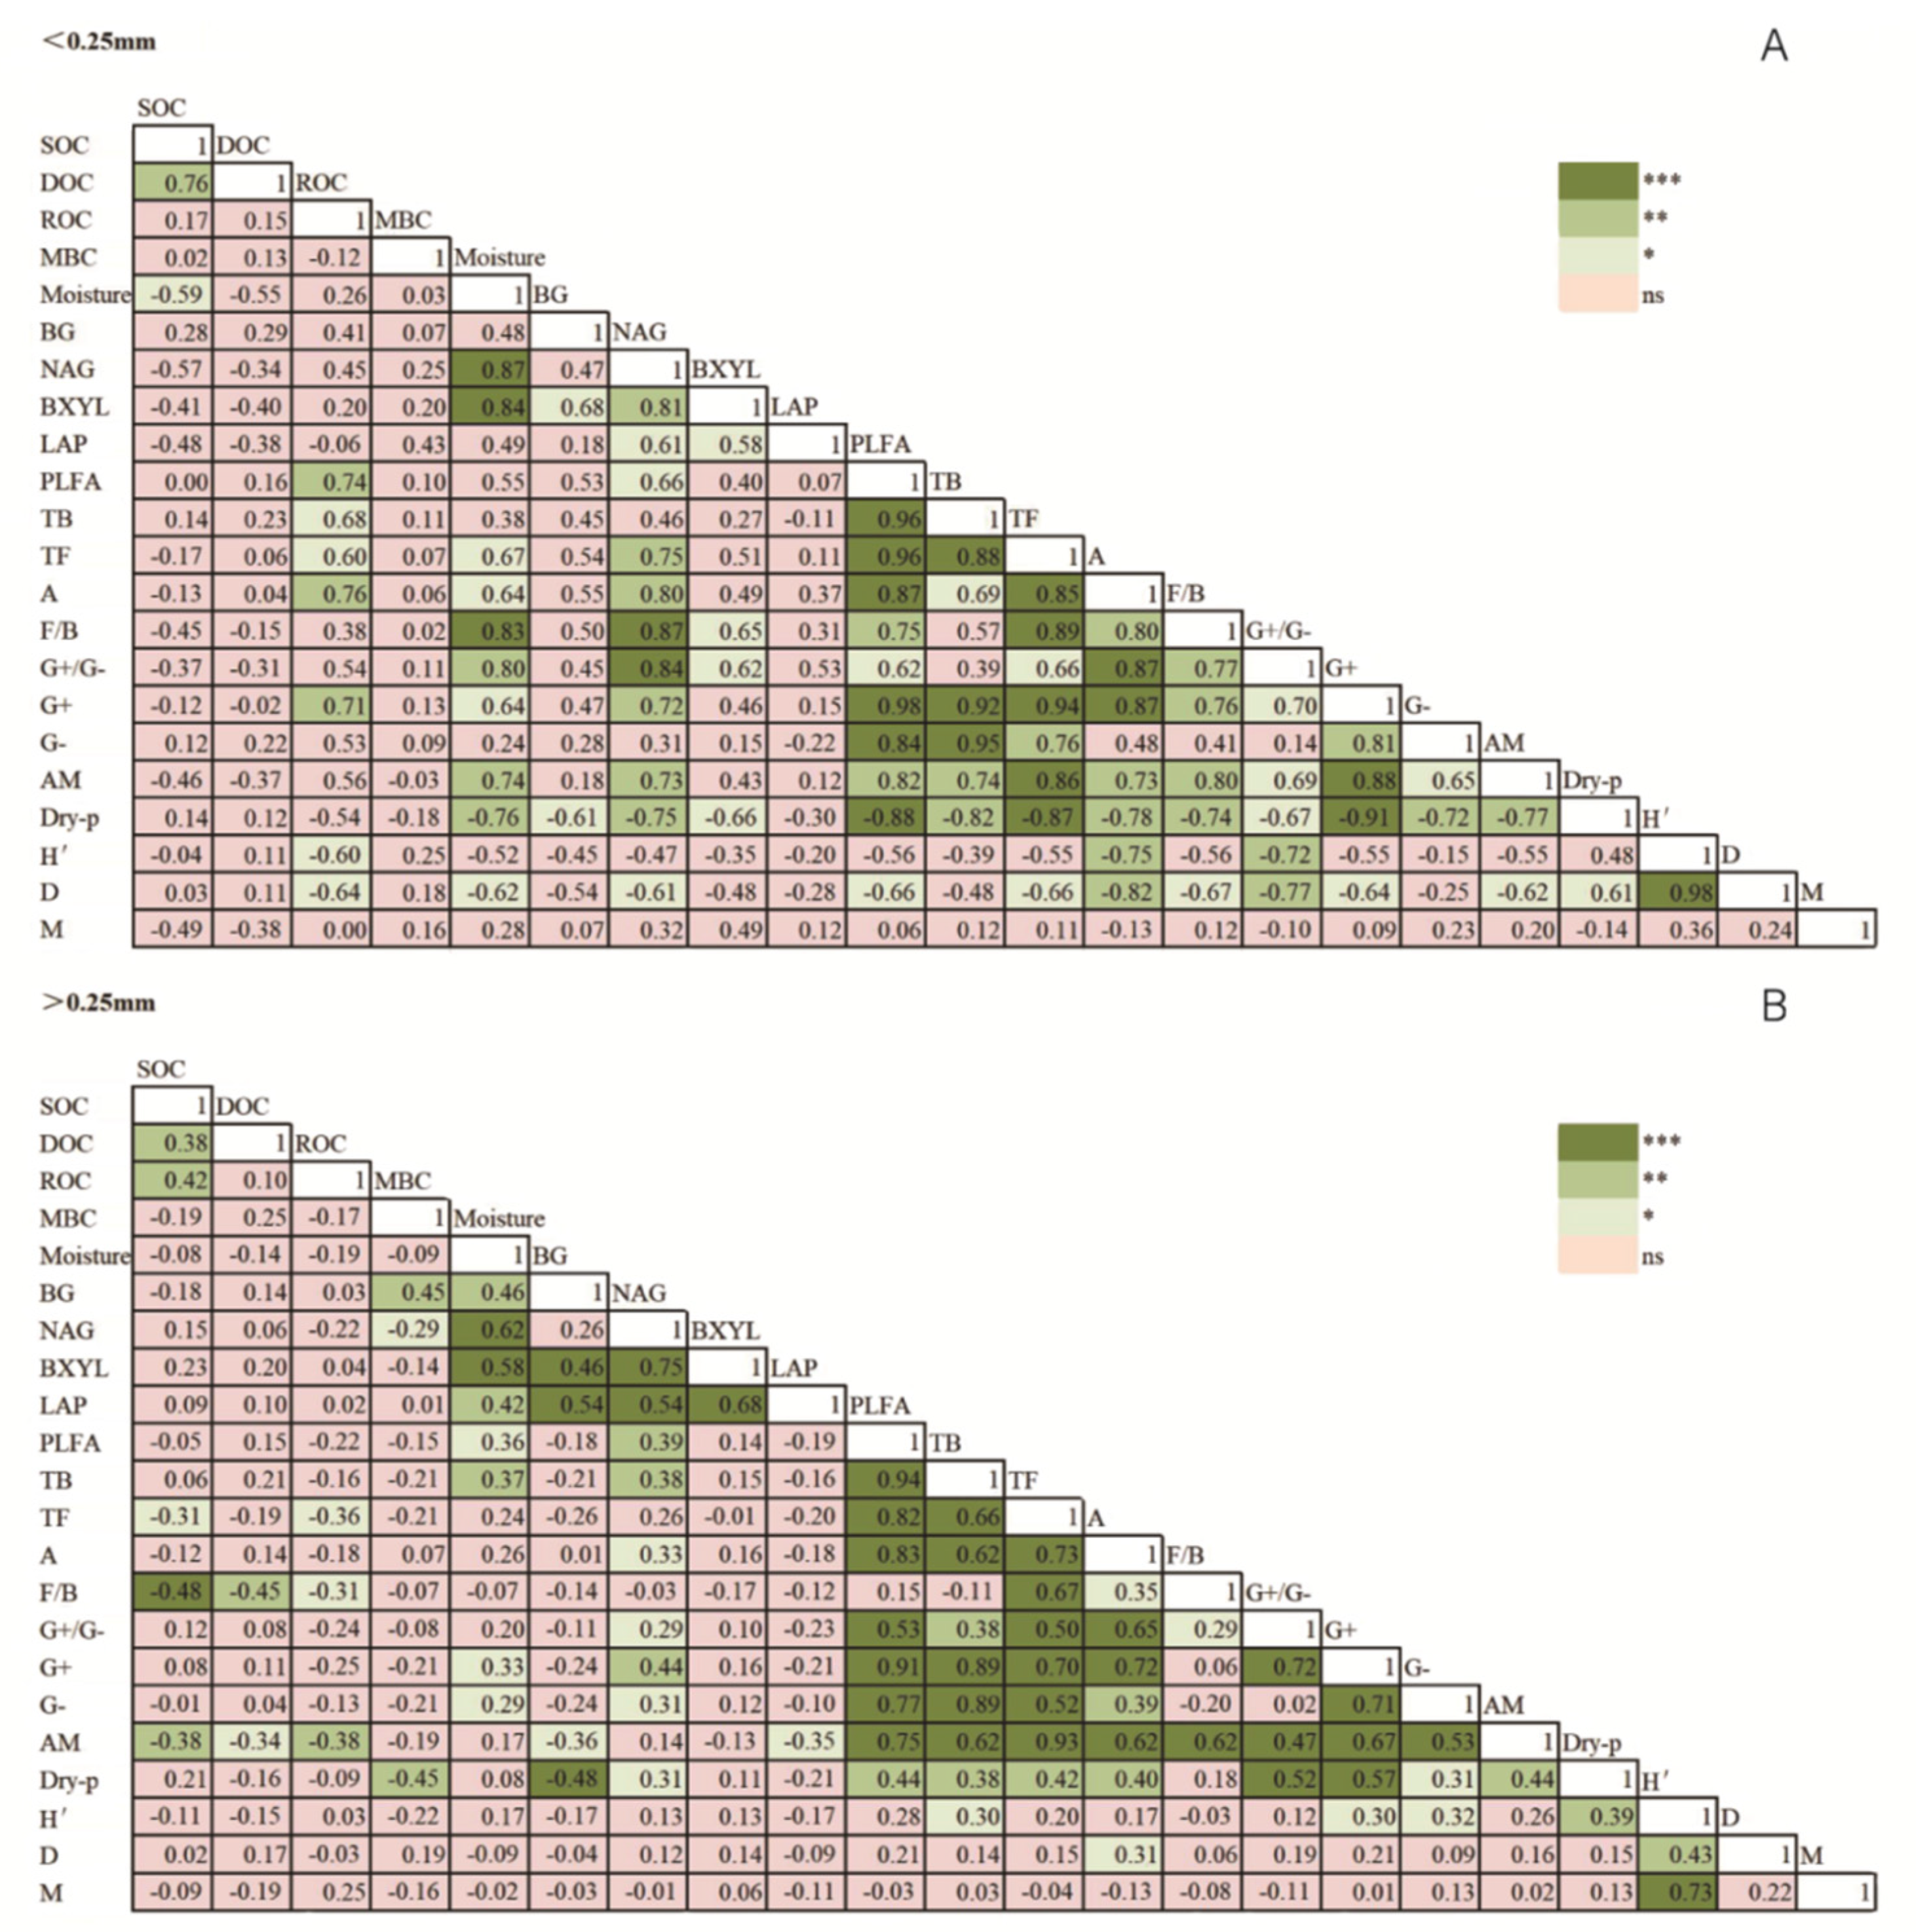
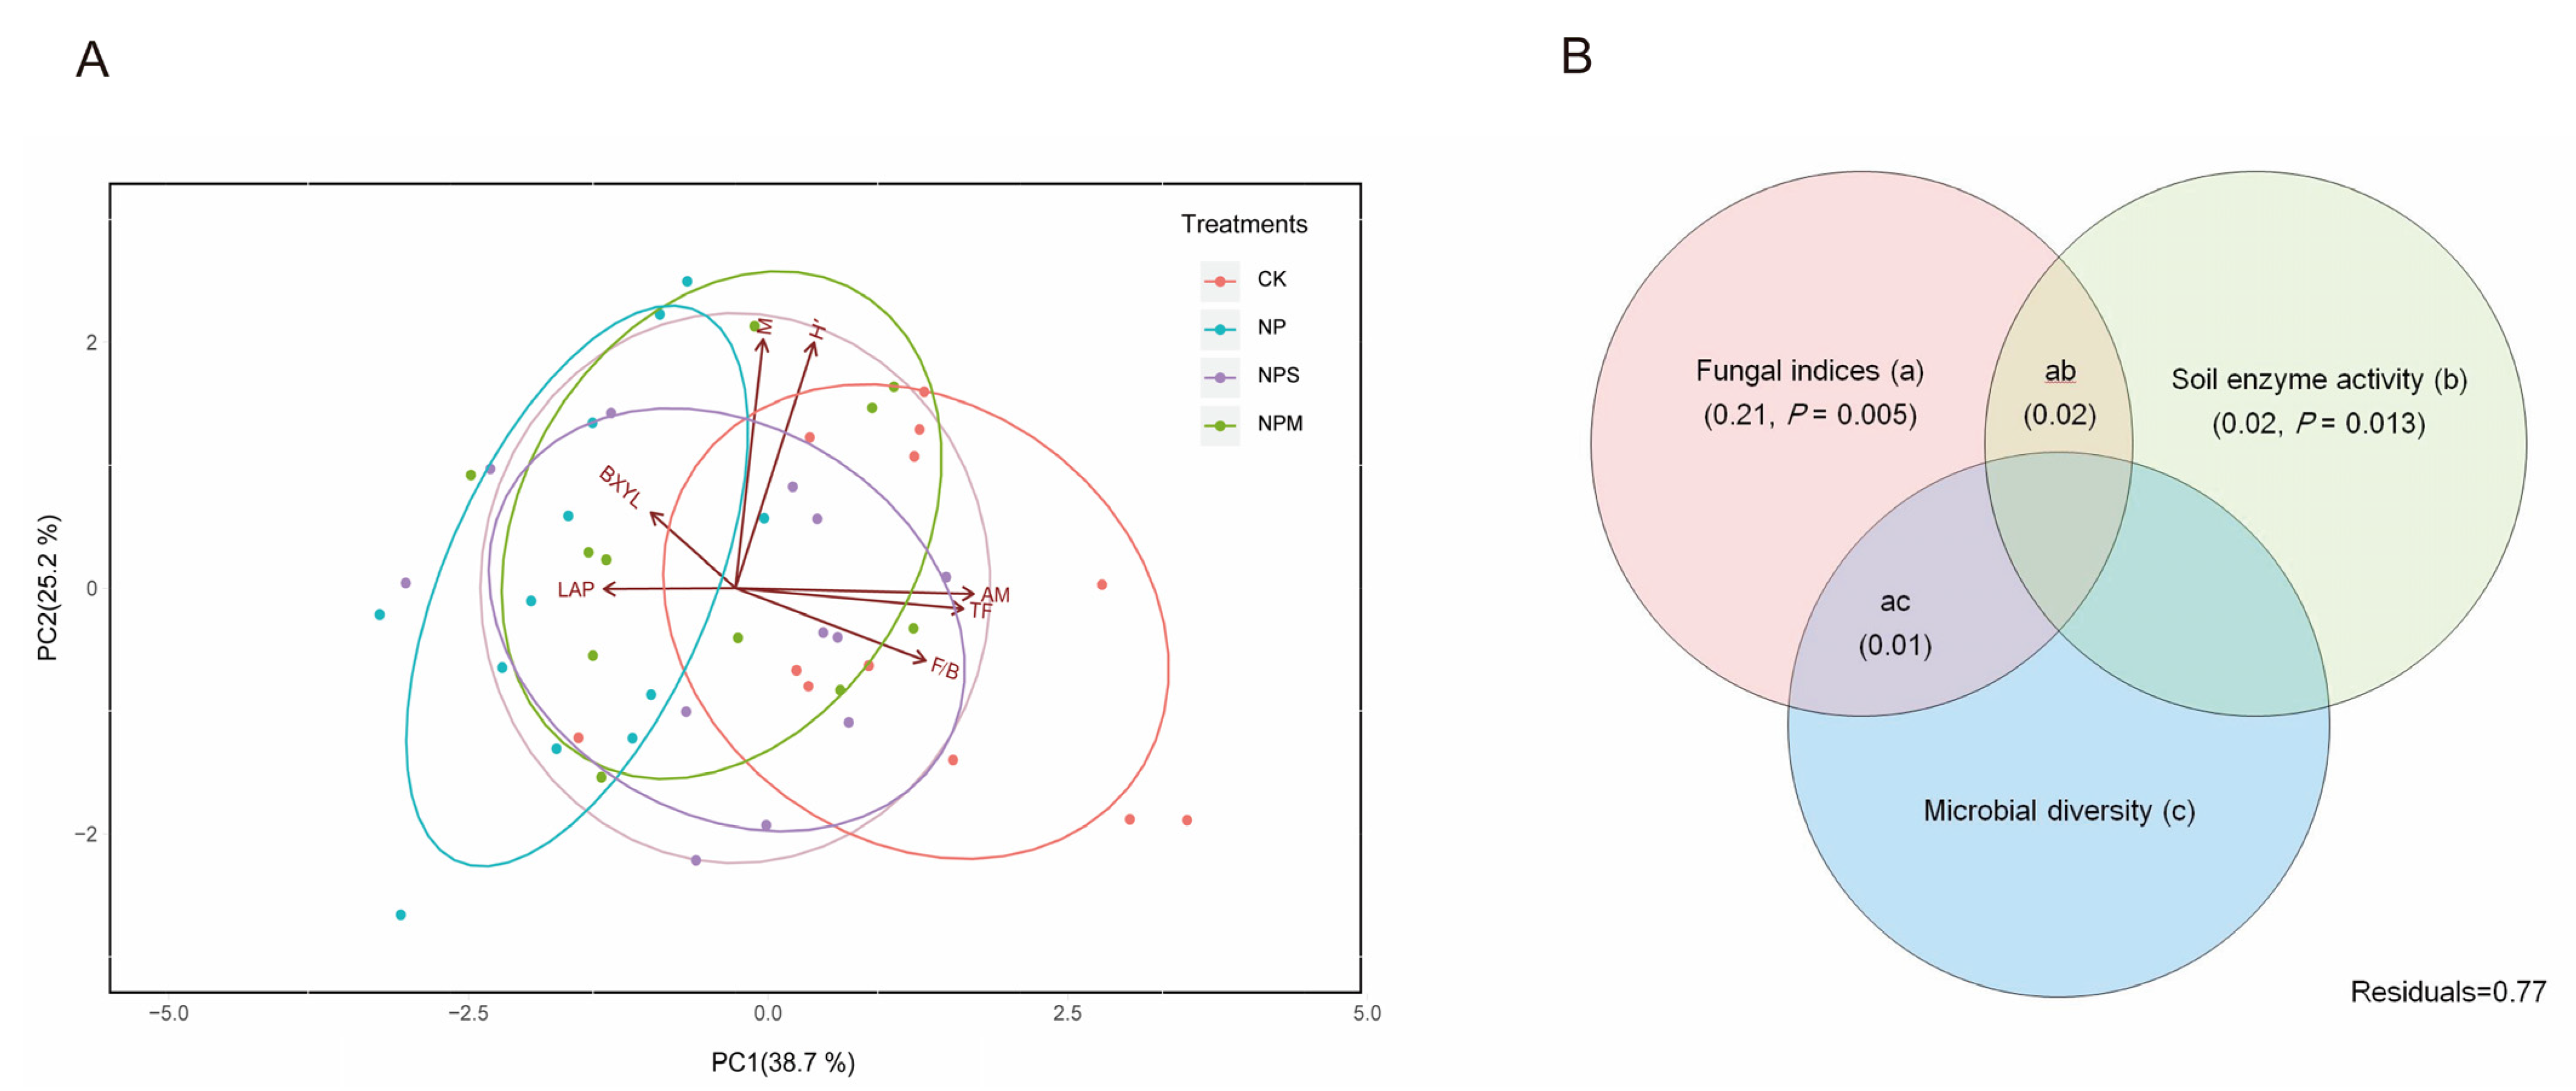
3.3. Contributions of Microbial Community and Soil Enzyme to SOC Content

The correlations between SOC content and indicators of microbial community and enzyme activity in differently sized aggregates showed that microbial and enzyme indicators, i.e., fungal and AM biomass, F/B ratio, BXYL, LAP, H’, and M, were significantly related to SOC content in >0.25 mm aggregates, while no significant correlation was found in <0.25 mm aggregates (Table 4). Soil microorganism and enzyme contributions to C storage under different fertilizations were analyzed by PCA and VPA, considering the differences in their compositions in >0.25 mm aggregates (Figure 7).
The PCA revealed that the predictors explained 63.9% of the variation in >0.25 mm aggregates, and all of these indicators were clearly divided into three groups by the first two principal components among all samples (Figure 7A). The Venn diagram (Figure 7B) revealed that the fraction of C storage variation explained by the fungal indices was 21% (fraction (a); p = 0.005). The soil enzyme component explained a lower proportion of variation in SOC content in >0.25 mm aggregates ((b) = 2%, p = 0.013). Meanwhile, the proportion explained by microbial diversity was far lower than that of fungal community and enzyme activity, and it was not displayed in Figure 7B due to a value of less than zero. Most of the SOC variation remained unexplained by the model variables (Residuals = 77%).

4. Discussion

Long-term inorganic and organic fertilization was considered to be one of main factors affecting soil microbial community, because they change the microenvironmental conditions and nutrients for microbial survival [38,39]. In this study, there was a remarkable reduction in the soil microbial biomass in all aggregates under NP compared to CK (Figure 4). Although inorganic fertilizer provided nutrients such as nitrogen and phosphorus, it reduced the moisture values in aggregate (Figure 3A), which affects the survival of microorganisms inside [40]. Microbial community is sensitive to the increasing of available nutrients under organic matter application [41]. In comparison with NP, the organic matter incorporation resulted in an increase in microbial biomass (i.e., PLFA, bacteria, and actinomycetes) in almost all of the aggregates, which vary with the aggregate size and organic matter type (Figure 4). This indicates that organic matter addition could alleviate this negative effect of NP on the microbial community, and the effect of fertilization on microbial biomass is associated with the soil aggregate size and nature of the organic matter. Notably, the amount of fungi was only higher under NPS and NPM than under CK in micro-aggregates, which indicates that fungi within macro-aggregate was more sensitive to environmental perturbation than in micro-aggregates, because of the vulnerability of microenvironment in macro-aggregate [42]. In particular, the amount of AM was slightly higher in NPS than in NPM, due to the high decomposition ability of AM in cellulose [43]. This can also explain why lower F/B was found in macro-aggregates (>0.25 mm) than in micro-aggregates (<0.25 mm) under the application of organic and inorganic fertilizers. Therefore, the results support that organic matter incorporation can build a more suitable environment for microbial survival.
Among the aggregate sizes, significant differences in microbial diversity were observed under NP and CK, while no difference was observed under NPS and NPM. Organic matter addition could promote higher bacterial richness or evenness among all fractions and enhance the microbial community resistance to disturbance relative to inorganic fertilization alone or no fertilization [44]. Based on these findings, the results suggest that the biomass and diversity of microbial community were changed with the application of fertilization, which was obviously (p < 0.05) associated with soil aggregate size [15,16]. Relative to CK, NPM and NPS increased soil enzyme activities in almost all macro-aggregate sizes (except for 1–2 mm), due to the increasing substrates for soil enzymes provided by the addition of OM and the increasing microbial population [45,46]. Soil enzyme activities were suggested to be suppressed by the inorganic fertilization [47]; however, they were favored in 2–5 mm and 0.25–1 mm aggregates under NP, in order to provide C or nitrogen nutrients for the survival of microorganisms [48]. In all of the aggregates, soil enzyme activities were correlated to the distribution of microbial community and moisture [49]. Therefore, our results indicate that the effects of fertilization regime on soil microbial community were associated with the balance between microbial nutrient requirements and secretion of enzymes, and they varied with soil aggregate size.
It is documented that microorganisms and enzymes affect C cycling. As Table 2 shows, almost all soil microbial community and enzyme indices were associated with aggregate size. Meanwhile, it is subsequently confirmed, as shown in Table 4, that soil microbial and enzyme indices were significantly related to SOC in >0.25 mm but not in <0.25 mm. This indicates that micro-aggregates could protect SOC from being decomposed by microorganisms [50], whereas macro-aggregates enhance SOC sequestration due to their greater stability by the adhesion of microorganisms and secretions [51].
As a primary elemental energy source for microorganism, ROC was positively correlated with microbial biomass in <0.25 mm aggregates (Figure 5A), i.e., bacteria, fungi, and actinomycetes. This indicates that the microbial activity may be limited by ROC, supported by the research that limited labile C is one of the main factors restricting the growth of soil heterotrophic microorganisms [52]. It indicates that microbial biomass C may have been saturated in micro-aggregates, supporting the findings that higher quality and protection of SOC in macro-aggregate are more conducive to the growth of microorganisms compared to micro-aggregate [53,54]. However, SOC content increased in micro-aggregates (<0.25 mm) under fertilizations, which indicates that other processes significantly contributed to C accumulation except microbial processes. For instance, the processes of chemical bonding to minerals or physical protection contribute to the mineral-associated organic C formation, which is one of the main components of organic C [55,56].
In >0.25 mm aggregates, the PCA analysis divided the indices that have a significant (p < 0.05) impact on SOC into three groups, and Venn models revealed that fungi-related factors were more important than microbial diversity and enzyme activities in affecting the SOC in macro-aggregates (Figure 7). This is largely due to the structural heterogeneity of the macro-aggregate and the strong viability of fungal community [57,58]. In particular, as the dominant mycorrhizal type, AM fungi were reported to alter the C storage through enhancing litter decomposition [59] or reducing the rhizosphere priming effect to increase C retention [15,16]. Microbial diversity had no significant (p > 0.05) relationship with SOC in macro-aggregates (>0.25 mm), the same trend as bacterial biomass (Figure 5B). Some research reported that bacterial diversity increased more greatly than fungi with higher pH values [60]; thus, bacterial community plays a key role in microbial diversity. This was in line with our result that the microbial diversity of H′ was correlated (p < 0.05) with the bacterial biomass in >0.25 mm aggregates. Inconsistent with our results, the abundance of bacteria was supported as contributing to the rapid decomposition of soil C [61]. Similarly, soil enzyme activities were significantly and positively correlated with bacterial and actinomycetic biomass, which supported that the diversity and composition of bacterial community could be partially reflected by the soil enzymes [62]. It also can explain why no significant contribution of enzyme activity to SOC was observed. The high unexplained residuals suggest that important aspects driving C dynamics were not included in this analysis, such as physical and chemical approaches. Our results confirm that microbial variables had greater impact on SOC in >0.25 mm macro-aggregates under different fertilizations, whereas no significant effect was found in <0.25 mm micro-aggregates. The total effect of fungi-related indicators’ contribution was higher than other microbial indices [63]. More in-depth studies are needed to detect fungal reaction and variation resulting from fertilization and should be incorporated in the main causes of microbial approach that affect C accumulation.
Soil C redistribution and microbial habitat condition were altered under manure and crop residues inputs. Previous studies confirmed that different fertilization managements might affect the soil biological processes, through changing the soil environment, the nutrients, and turnover of aggregate, which could directly or indirectly affect C storage [15,16]. This study shows that NP caused a significant reduction in the microbial biomass (Figure 4C), i.e., fungal and bacterial biomass, and led to a stronger decrease in C decomposition by microorganisms than NPS and NPM. The main reason may be that long-term inorganic fertilizer inhibited the growth of microorganisms through affecting the soil pH or moisture condition [64,65,66], which lead to the weakened microbial decomposition of C. It also might be one of the reasons for the higher ROC content in NP than in CK. The ratio of MBC/SOC and the mass proportions of macro-aggregates (>2 mm) were lower under NP than CK, whereas the total SOC content was higher, indicating that the contribution of microbial process and physical protection to C reduced under inorganic fertilization [50]. Therefore, other important aspects should contribute more greatly to C accumulation than microbial process under inorganic fertilization. For example, the chemical process of the interaction between C and soil minerals has been known as an important pathway of mechanisms of C sequestration [55]. Simultaneously, the combined application of organic matter significantly reduced the impact of inorganic fertilizers on the growth of microbial community, due to the improvement of water condition and agglomeration (Figure 3) and a large number of substrates available to microorganisms. For dryland agriculture, periodic rainfall causes soil to be in a long-term alternating state of dry and wet, causing periodic fluctuations in soil water contents. In this study, the application of organic matter alleviated the fluctuation of moisture and maintained it at a relatively high level, which is conducive to microbial activity [67,68]. This is consistent with the result that MBC content (Figure 1C) was higher under NPM and NPS than under NP in macro-aggregates (except 0.25–1 mm). The fungal biomass were positively (p < 0.05) related to macro-aggregates’ proportion (>0.25 mm), which promotes the physical protection of C sequestration [50]. However, both ROC and SOC contents have no significant differences between inorganic and organic fertilizations, which were negatively (p < 0.05) correlated with fungal biomass. This indicated that the C content was in dynamic equilibrium under the inorganic and organic fertilizations during the process of C sequestration and decomposition in macro-aggregate, in which fungi are key regulators [15,16]. A similar observation was that fungi were affected more greatly by fertilization in macro-aggregates than in micro-aggregates [15,16], with great ability to degrade complex C polymers [69]. The lower F/B under fertilization than no fertilization in macro-aggregates suggests that bacteria were more able to adapt to fertile environment. Both of actinomycetes and bacteria, including G+, G− and G+/G−, had no significant relation-ship with C among all treatments, which was supported by the study finding that low net accumulation of C was found in fertile soils that are dominated by bacterial community [61]. Therefore, this indicate that the effect of fertilization management on the contribution of fungal community to C is more pronounced in macro-aggregates, compared to other microbial community.

5. Conclusions

Microbiological properties play an important role in C reserves at aggregate scale under different fertilization regimes. We emphasized that the alteration of microorganism community (i.e., fungal and AM biomass and F/B ratio) and enzyme activities (BXYL and LAP), rather than microbial diversity, contributed greatly to C storage in macro-aggregates (>0.25 mm). However, the influence of microbial factors in C storage was not significant in micro-aggregates. Compared to inorganic fertilization, combined application of organic and inorganic fertilizer increased the microbial contribution to C storages. Our study indicated that the contribution of microbial processes to C accumulation depends not only on the aggregate size but also on the variety of the microbial properties and their interrelationships under different fertilization regimes. Future research is needed to reduce the negative impact of inorganic fertilizers on soil flora by using organic matter application while maximizing the soil C accumulation in agroecosystems.

Author Contributions

Conceptualization, X.W. and G.L.; software, A.A.A.; formal analysis, C.G. and D.J.; investigation, F.Z. and M.Z.; writing—original draft preparation, J.L. (Jinjing Lu) and S.L.; writing—review and editing, Q.Z. and A.D.; funding acquisition, J.L. (Jianhua Li). All authors have read and agreed to the published version of the manuscript.

Funding

This research was funded by National Natural Science Foundation of China (U1710255), Fundamental Research Funds for Central Nonprofit Scientific Institution (1610132019033), National Key Research and Development Program of China (2018YFE0112300 and 2018YFD0200408), Agricultural Science and Technology Innovation Research Program of Shanxi Academy of Agricultural Sciences (YCX2018DZYS02), and the Doctoral research initiation project of Shanxi Agricultural University(2021BQ48).

Institutional Review Board Statement

Not applicable.

Informed Consent Statement

Not applicable.

Data Availability Statement

All data are available in the paper.

Acknowledgments

We thank Shanxi Province Key Laboratory of Soil Environment and Nutrient resources.

Conflicts of Interest

The authors declare no conflict of interest.

References

  1. Wang, Y.; Yao, Z.; Zhan, Y.; Zheng, X.; Zhou, M.; Yan, G.; Wang, L.; Werner, C.; Butterbach-Bahl, K. Potential benefits of liming to acid soils on climate change mitigation and food security. Glob. Chang. Biol. 2021, 27, 2807–2821. [Google Scholar] [CrossRef] [PubMed]
  2. Kallenbach, C.M.; Frey, S.D.; Grandy, A.S. Direct evidence for microbial-derived soil organic matter formation and its ecophysiological controls. Nat. Commun. 2016, 7, 1–10. [Google Scholar] [CrossRef]
  3. Crowther, T.W.; Van den Hoogen, J.; Wan, J.; Mayes, M.A.; Keiser, A.D.; Mo, L.; Averill, C.; Maynard, D.S. The global soil community and its influence on biogeochemistry. Science 2019, 365, eaav0550. [Google Scholar] [CrossRef] [PubMed]
  4. Melillo, J.M.; Frey, S.D.; DeAngelis, K.M.; Werner, W.J.; Bernard, M.J.; Bowles, F.P.; Pold, G.; Knorr, M.A.; Grandy, A.S. Long-term pattern and magnitude of soil carbon feedback to the climate system in a warming world. Science 2017, 358, 101–105. [Google Scholar] [CrossRef] [PubMed] [Green Version]
  5. Fan, S.; Sun, H.; Yang, J.; Qin, J.; Shen, D.; Chen, Y. Variations in soil enzyme activities and microbial communities along an altitudinal gradient on the eastern Qinghai–Tibetan plateau. Forests 2021, 12, 681. [Google Scholar] [CrossRef]
  6. Merino, C.; Matus, F.; Kuzyakov, Y.; Dyckmans, J.; Stock, S.; Dippold, M.A. Contribution of the Fenton reaction and ligninolytic enzymes to soil organic matter mineralisation under anoxic conditions. Sci. Total Environ. 2021, 760, 143397. [Google Scholar] [CrossRef] [PubMed]
  7. Bond-Lamberty, B.; Bailey, V.L.; Chen, M.; Gough, C.M.; Vargas, R. Globally rising soil heterotrophic respiration over recent decades. Nature 2018, 560, 80–83. [Google Scholar] [CrossRef]
  8. Fierer, N. Embracing the unknown: Disentangling the complexities of the soil microbiome. Nat. Rev. Microbiol. 2017, 15, 579–590. [Google Scholar] [CrossRef] [PubMed]
  9. Juan-Ovejero, R.; Briones, M.J.I.; Öpik, M. Fungal diversity in peatlands and its contribution to carbon cycling. Appl. Soil Ecol. 2020, 146, 103393. [Google Scholar] [CrossRef]
  10. Baumann, K.; Dignac, M.F.; Rumpel, C.; Bardoux, G.; Sarr, A.; Steffens, M.; Maron, P.A. Soil microbial diversity affects soil organic matter decomposition in a silty grassland soil. Biogeochemistry 2013, 114, 201–212. [Google Scholar] [CrossRef]
  11. Zhang, S.; Li, Q.; Lü, Y.; Zhang, X.; Liang, W. Contributions of soil biota to C sequestration varied with aggregate fractions under different tillage systems. Soil Biol. Biochem. 2013, 62, 147–156. [Google Scholar] [CrossRef]
  12. Ma, Q.; Wen, Y.; Wang, D.; Sun, X.; Hill, P.W.; Macdonald, A.; Chadwick, D.R.; Wu, L.; Jones, D.L. Farmyard manure applications stimulate soil carbon and nitrogen cycling by boosting microbial biomass rather than changing its community composition. Soil Biol. Biochem. 2020, 144, 107760. [Google Scholar]
  13. Romaní, A.M.; Fischer, H.; Mille-Lindblom, C.; Tranvik, L.J. Interactions of bacteria and fungi on decomposing litter: Differential extracellular enzyme activities. Ecology 2006, 87, 2559–2569. [Google Scholar] [CrossRef] [Green Version]
  14. Duan, J.; Yuan, M.; Jian, S.; Gamage, L.; Parajuli, M.; Dzantor, K.E.; Hui, D.; Fay, P.A.; Li, J. Soil extracellular oxidases mediated nitrogen fertilization effects on soil organic carbon sequestration in bioenergy croplands. Glob. Chang. Biol. 2021, 13, 1303–1318. [Google Scholar] [CrossRef]
  15. Xu, C.Y.; Du, C.; Jian, J.S.; Hou, L.; Wang, Z.K.; Wang, Q.; Geng, Z.C. The interplay of labile organic carbon, enzyme activities and microbial communities of two forest soils across seasons. Sci. Rep. 2021, 11, 1–12. [Google Scholar]
  16. He, L.; Lu, S.; Wang, C.; Mu, J.; Zhang, Y.; Wang, X. Changes in soil organic carbon fractions and enzyme activities in response to tillage practices in the Loess Plateau of China. Soil Tillage Res. 2021, 209, 104940. [Google Scholar] [CrossRef]
  17. Somasundaram, J.; Reeves, S.; Wang, W.; Heenan, M.; Dalal, R. Impact of 47 years of no tillage and stubble retention on soil aggregation and carbon distribution in a vertisol. L. Degrad. Dev. 2017, 28, 1589–1602. [Google Scholar] [CrossRef]
  18. Elliott, E.T. Aggregate structure and carbon, nitrogen, and phosphorus in native and cultivated soils. Soil Sci. Soc. Am. J. 1986, 50, 627–633. [Google Scholar] [CrossRef]
  19. Young, I.M.; Ritz, K. Tillage, habitat space and function of soil microbes. Soil Tillage Res. 2000, 53, 201–213. [Google Scholar] [CrossRef]
  20. Briar, S.S.; Fonte, S.J.; Park, I.; Six, J.; Scow, K.; Ferris, H. The distribution of nematodes and soil microbial communities across soil aggregate fractions and farm management systems. Soil Biol. Biochem. 2011, 43, 905–914. [Google Scholar] [CrossRef]
  21. Larkin, A.A.; Martiny, A.C. Microdiversity shapes the traits, niche space, and biogeography of microbial taxa. Environ. Microbiol. Rep. 2017, 9, 55–70. [Google Scholar] [CrossRef]
  22. Wisz, M.S.; Pottier, J.; Kissling, W.D.; Pellissier, L.; Lenoir, J.; Damgaard, C.F.; Dormann, C.F.; Forchhammer, M.C.; Grytnes, J.; Guisan, A. The role of biotic interactions in shaping distributions and realised assemblages of species: Implications for species distribution modelling. Biol. Rev. 2013, 88, 15–30. [Google Scholar] [CrossRef] [PubMed] [Green Version]
  23. Dorodnikov, M.; Blagodatskaya, E.; Blagodatsky, S.; Marhan, S.; Fangmeier, A.; Kuzyakov, Y. Stimulation of microbial extracellular enzyme activities by elevated CO2 depends on soil aggregate size. Glob. Chang. Biol. 2009, 15, 1603–1614. [Google Scholar] [CrossRef]
  24. Griffiths, B.S.; Philippot, L. Insights into the resistance and resilience of the soil microbial community. FEMS Microbiol. Rev. 2013, 37, 112–129. [Google Scholar] [PubMed] [Green Version]
  25. Liang, Q.; Chen, H.; Gong, Y.; Yang, H.; Fan, M.; Kuzyakov, Y. Effects of 15 years of manure and mineral fertilizers on enzyme activities in particle-size fractions in a North China Plain soil. Eur. J. Soil Biol. 2014, 60, 112–119. [Google Scholar] [CrossRef]
  26. Liu, M.; Li, P.; Liu, M.; Wang, J.; Chang, Q. The trend of soil organic carbon fractions related to the successions of different vegetation types on the tableland of the Loess Plateau of China. J. Soils Sediments. 2021, 21, 203–214. [Google Scholar]
  27. Inselsbacher, E.; Umana, N.H.-N.; Stange, F.C.; Gorfer, M.; Schüller, E.; Ripka, K.; Zechmeister-Boltenstern, S.; Hood-Novotny, R.; Strauss, J.; Wanek, W. Short-term competition between crop plants and soil microbes for inorganic N fertilizer. Soil Biol. Biochem. 2010, 42, 360–372. [Google Scholar]
  28. Li, S.X.; Xiao, L. Distribution and management of drylands in the People’s Republic of China. Adv. Soil Sci. 1992, 147–302. [Google Scholar]
  29. Yu, Q.; Hu, X.; Ma, J.; Ye, J.; Sun, W.; Wang, Q.; Lin, H. Effects of long-term organic material applications on soil carbon and nitrogen fractions in paddy fields. Soil Tillage Res. 2020, 196, 104483. [Google Scholar] [CrossRef]
  30. Qiu, G.; Zhu, M.; Contin, M.; De Nobili, M.; Luo, Y.; Xu, J.; Brookes, P.C. Evaluating the triggering responsein soils, using 13C-glucose, and effects on dynamics of microbial biomass. Soil Biol. Biochem. 2020, 33, 107843. [Google Scholar] [CrossRef]
  31. Wang, Y.; Li, C.; Tu, C.; Hoyt, G.D.; DeForest, J.L.; Hu, S. Long-term no-tillage and organic input management enhanced the diversity and stability of soil microbial community. Sci. Total Environ. 2017, 609, 341–347. [Google Scholar] [CrossRef]
  32. Tripathi, R.; Nayak, A.K.; Bhattacharyya, P.; Shukla, A.K.; Shahid, M.; Raja, R.; Panda, B.B.; Mohanty, S.; Kumar, A.; Thilagam, V.K. Soil aggregation and distribution of carbon and nitrogen in different fractions after 41 years long-term fertilizer experiment in tropical rice–rice system. Geoderma 2014, 213, 280–286. [Google Scholar] [CrossRef]
  33. Brookes, P.C.; Landman, A.; Pruden, G.; Jenkinson, D.S. Chloroform fumigation and the release of soil nitrogen: A rapid direct extraction method to measure microbial biomass nitrogen in soil. Soil Biol. Biochem. 1985, 17, 837–842. [Google Scholar] [CrossRef]
  34. DeForest, J.L. The influence of time, storage temperature, and substrate age on potential soil enzyme activity in acidic forest soils using MUB-linked substrates and l-DOPA. Soil Biol. Biochem. 2009, 41, 1180–1186. [Google Scholar] [CrossRef]
  35. German, D.P.; Weintraub, M.N.; Grandy, A.S.; Lauber, C.L.; Rinkes, Z.L.; Allison, S.D. Optimization of hydrolytic and oxidative enzyme methods for ecosystem studies. Soil Biol. Biochem. 2011, 43, 1387–1397. [Google Scholar] [CrossRef]
  36. Bossio, D.A.; Scow, K.M.; Gunapala, N.; Department, K.J.G. Determinants of soil microbial communities: Effects of agricultural management, season, and soil type on phospholipid fatty acid profiles. Microb. Ecol. 1998, 36, 1–12. [Google Scholar] [CrossRef]
  37. Mo, F.; Zhang, Y.Y.; Liu, Y.; Liao, Y.C. Microbial carbon-use efficiency and straw-induced priming effect within soil aggregates are regulated by tillage history and balanced nutrient supply. Biol. Fertil. Soils. 2021, 57, 409–420. [Google Scholar] [CrossRef]
  38. Chakraborty, A.; Chakrabarti, K.; Chakraborty, A.; Ghosh, S. Effect of long-term fertilizers and manure application on microbial biomass and microbial activity of a tropical agricultural soil. Biol. Fertil. Soils. 2011, 47, 227–233. [Google Scholar] [CrossRef]
  39. Yang, Q.; Zheng, F.; Jia, X.; Liu, P.; Dong, S.; Zhang, J.; Zhao, B. The combined application of organic and inorganic fertilizers increases soil organic matter and improves soil microenvironment in wheat-maize field. J. Soils Sediments. 2020, 20, 2395–2404. [Google Scholar] [CrossRef]
  40. Manzoni, S.; Schimel, J.P.; Porporato, A. Responses of soil microbial communities to water stress: Results from a meta-analysis. Ecology 2012, 93, 930–938. [Google Scholar] [CrossRef] [PubMed]
  41. Lin, Y.; Ye, G.; Kuzyakov, Y.; Liu, D.; Fan, J.; Ding, W. Long-term manure application increases soil organic matter and aggregation, and alters microbial community structure and keystone taxa. Soil Biol. Biochem. 2019, 134, 187–196. [Google Scholar] [CrossRef]
  42. Trivedi, P.; Rochester, I.J.; Trivedi, C.; Van Nostrand, J.D.; Zhou, J.; Karunaratne, S.; Anderson, I.C.; Singh, B.K. Soil aggregate size mediates the impacts of cropping regimes on soil carbon and microbial communities. Soil Biol. Biochem. 2015, 91, 169–181. [Google Scholar] [CrossRef]
  43. Wei, L.; Vosátka, M.; Cai, B.; Ding, J.; Lu, C.; Xu, J.; Yan, W.; Li, Y.; Liu, C. The role of arbuscular mycorrhiza fungi in the decomposition of fresh residue and soil organic carbon: A Mini-Review. Soil Sci. Soc. Am. J. 2019, 83, 511–517. [Google Scholar] [CrossRef]
  44. Legrand, F.; Picot, A.; Cobo-Díaz, J.F.; Carof, M.; Chen, W.; Le Floch, G. Effect of tillage and static abiotic soil properties on microbial diversity. Appl. Soil Ecol. 2018, 132, 135–145. [Google Scholar] [CrossRef]
  45. Zhang, J.; Sayer, E.J.; Zhou, J.; Li, Y.; Li, Y.; Li, Z.; Wang, F. Long-term fertilization modifies the mineralization of soil organic matter in response to added substrate. Sci. Total Environ. 2021, 798, 149341. [Google Scholar] [CrossRef] [PubMed]
  46. Akhtar, K.; Wang, W.; Ren, G.; Khan, A.; Feng, Y.; Yang, G. Changes in soil enzymes, soil properties, and maize crop productivity under wheat straw mulching in Guanzhong, China. Soil Tillage Res. 2018, 182, 94–102. [Google Scholar] [CrossRef]
  47. Liu, E.; Yan, C.; Mei, X.; He, W.; Bing, S.H.; Ding, L.; Liu, Q.; Liu, S.; Fan, T. Long-term effect of chemical fertilizer, straw, and manure on soil chemical and biological properties in northwest China. Geoderma 2010, 158, 173–180. [Google Scholar] [CrossRef]
  48. Caldwell, B.A. Enzyme activities as a component of soil biodiversity: A review. Pedobiologia 2005, 49, 637–644. [Google Scholar] [CrossRef]
  49. Sardans, J.; Peñuelas, J. Drought decreases soil enzyme activity in a Mediterranean Quercus ilex L. forest. Soil Biol. Biochem. 2005, 37, 455–461. [Google Scholar] [CrossRef]
  50. Six, J.; Elliott, E.T.; Paustian, K. Soil macroaggregate turnover and microaggregate formation: A mechanism for C sequestration under no-tillage agriculture. Soil Biol. Biochem. 2000, 32, 2099–2103. [Google Scholar] [CrossRef]
  51. Hurisso, T.T.; Davis, J.G.; Brummer, J.E.; Stromberger, M.E.; Mikha, M.M.; Haddix, M.L.; Booher, M.R.; Paul, E.A. Rapid changes in microbial biomass and aggregate size distribution in response to changes in organic matter management in grass pasture. Geoderma 2013, 193–194, 68–75. [Google Scholar] [CrossRef]
  52. Demoling, F.; Figueroa, D.; Bååth, E. Comparison of factors limiting bacterial growth in different soils. Soil Biol. Biochem. 2007, 39, 2485–2495. [Google Scholar] [CrossRef]
  53. Gupta, V.V.S.R.; Germida, J.J. Soil aggregation: Influence on microbial biomass and implications for biological processes. Soil Biol. Biochem. 2015, 80, A3–A9. [Google Scholar] [CrossRef]
  54. Tisdall, J.M.; Oades, J. Organic matter and water-stable aggregates in soils. J. Soil Sci. 1982, 33, 141–163. [Google Scholar] [CrossRef]
  55. Cotrufo, M.F.; Ranalli, M.G.; Haddix, M.L.; Six, J.; Lugato, E. Soil carbon storage informed by particulate and mineral-associated organic matter. Nat. Geosci. 2019, 12, 989–994. [Google Scholar] [CrossRef]
  56. Kögel-Knabner, I.; Guggenberger, G.; Kleber, M.; Kandeler, E.; Kalbitz, K.; Scheu, S.; Eusterhues, K.; Leinweber, P. Organo-mineral associations in temperate soils: Integrating biology, mineralogy, and organic matter chemistry. J. Plant Nutr. Soil Sci. 2008, 171, 61–82. [Google Scholar] [CrossRef]
  57. Jasinska, E.; Wetzel, H.; Baumgartl, T.; Horn, R. Heterogeneity of physico-chemical properties in structured soils and its consequences. Pedosphere 2006, 16, 284–296. [Google Scholar] [CrossRef]
  58. Guggenberger, G.; Frey, S.D.; Six, J.; Paustian, K.; Elliott, E.T. Bacterial and fungal cell-wall residues in conventional and no-tillage agroecosystems. Soil Sci. Soc. Am. J. 1999, 63, 1188–1198. [Google Scholar] [CrossRef]
  59. Cheng, L.; Booker, F.L.; Tu, C.; Burkey, K.O.; Zhou, L.; Shew, H.D.; Rufty, T.W.; Hu, S. Arbuscular mycorrhizal fungi increase organic carbon decomposition under elevated CO2. Science 2012, 337, 1084–1087. [Google Scholar] [CrossRef]
  60. Shen, C.; Xiong, J.; Zhang, H.; Feng, Y.; Lin, X.; Li, X.; Liang, W.; Chu, H. Soil pH drives the spatial distribution of bacterial communities along elevation on Changbai Mountain. Soil Biol. Biochem. 2013, 57, 204–211. [Google Scholar] [CrossRef]
  61. Zhou, G.; Chang, D.; Gao, S.; Liang, T.; Liu, R.; Cao, W. Co-incorporating leguminous green manure and rice straw drives the synergistic release of carbon and nitrogen, increases hydrolase activities, and changes the composition of main microbial groups. Biol. Fertil. Soils. 2021, 57, 547–561. [Google Scholar] [CrossRef]
  62. Ren, Y.; Zhang, L.; Yang, K.; Li, Z.; Yin, R.; Tan, B.; Wang, L.; Liu, Y.; Li, H.; You, C.; et al. Short-term effects of snow cover manipulation on soil bacterial diversity and community composition. Sci. Total Environ. 2020, 741, 140454. [Google Scholar] [CrossRef] [PubMed]
  63. Baumert, V.L.; Vasilyeva, N.A.; Vladimirov, A.A.; Meier, I.C.; Kögel-Knabner, I.; Mueller, C.W. Root exudates induce soil macroaggregation facilitated by fungi in subsoil. Front. Environ. Sci. 2018, 6, 1–17. [Google Scholar]
  64. Shi, Y.; Li, Y.; Xiang, X.; Sun, R.; Yang, T.; He, D.; Zhang, K.; Ni, Y.; Zhu, Y.G.; Adams, J.M.; et al. Spatial scale affects the relative role of stochasticity versus determinism in soil bacterial communities in wheat fields across the North China Plain. Microbiome 2018, 6, 1–12. [Google Scholar]
  65. Shi, W.; Zhao, H.Y.; Chen, Y.; Wang, J.S.; Han, B.; Li, C.P.; Lu, J.Y.; Zhang, L.M. Organic manure rather than phosphorus fertilization primarily determined asymbiotic nitrogen fixation rate and the stability of diazotrophic community in an upland red soil. Agric. Ecosyst. Environ. 2021, 319, 107535. [Google Scholar]
  66. Cai, A.; Xu, M.; Wang, B.; Zhang, W.; Liang, G.; Hou, E.; Luo, Y. Manure acts as a better fertilizer for increasing crop yields than synthetic fertilizer does by improving soil fertility. Soil Tillage Res. 2019, 189, 168–175. [Google Scholar]
  67. Li, Y.; Chen, H.; Feng, H.; Dong, Q.; Wu, W.; Zou, Y.; Chau, H.W.; Siddique, K.H.M. Influence of straw incorporation on soil water utilization and summer maize productivity: A five-year field study on the Loess Plateau of China. Agric. Water Manag. 2020, 233, 106106. [Google Scholar]
  68. Mondini, C.; Contin, M.; Leita, L.; De Nobili, M. Response of microbial biomass to air-drying and rewetting in soils and compost. Geoderma 2002, 105, 111–124. [Google Scholar] [CrossRef]
  69. Thormann, M.N. Diversity and function of fungi in peatlands: A carbon cycling perspective. Can. J. Soil Sci. 2006, 86, 281–293. [Google Scholar] [CrossRef]
Figure 1. The distribution of SOC (A), DOC (B), MBC (C), ROC contents (D) in different aggregates under 4 fertilization managements (CK, NP, NPS, and NPM). SOC: soil organic carbon; DOC: dissolved organic carbon; MBC: microbial biomass carbon; ROC: readily oxidizable organic carbon. Vertical bars indicate the standard error of the mean (n = 3). Different lowercase letters indicate significant difference at p < 0.05 among the different aggregate sizes. The differences in C contents among the different fertilization managements are shown at *: p < 0.05, **: p < 0.01, ***: p < 0.001, and ns: not significant.
Agronomy 11 02126 g001
Figure 2. The ratio of MBC to SOC in different aggregates under 4 fertilization managements (CK, NP, NPS, and NPM). Different lowercase letters mean significant differences among aggregate size fractions (p < 0.05). The differences in the ratio of MBC to SOC among the different fertilization managements are shown at *: p < 0.05, **: p < 0.01, ***: p < 0.001, and ns: not significant.
Agronomy 11 02126 g002
Figure 3. The moisture (A) and mass proportion (B) of different aggregates under 4 fertilization managements (CK, NP, NPS, and NPM). Different lowercase letters mean significant differences among aggregate size fractions (p < 0.05). The differences in moisture and mass proportion among fertilization managements are shown at *: p < 0.05, **: p < 0.01, ***: p < 0.001, and ns: not significant.
Agronomy 11 02126 g003
Figure 4. Microbial biomass and the phospholipid acid biomarkers in differently sized aggregates under 4 fertilization managements: CK (A), NPS (B), NP (C), and NPM (D). G−B: general bacterial PLFA; G+: Gram-positive bacterial PLFA; G−: Gram−negative bacterial PLFA; A: actinomycetic PLFA; F: general fungal PLFA; AM: arbuscular mycorrhizal fungi. The differences in total bacteria (the sum of G−B, G+, and G−bacteria), actinomycetes, general fungi, and AM PLFA among the differently sized aggregates are shown at *: p < 0.05, **: p < 0.01, ***: p < 0.001, and ns: not significant.
Agronomy 11 02126 g004
Figure 5. Correlative coefficients between the properties of soil organic C, microbial indices, and enzyme activity in < 0.25 mm (A) and > 0.25 mm (B) aggregates, respectively. See Table 2 for abbreviations of some soil properties. *: p< 0.05, **: p< 0.01, ***: p < 0.001.
Agronomy 11 02126 g005
Figure 6. Histogram of N–acetyl–glucosaminidase (A), leucine aminopeptidase (B), β–glucosidase (C), and β–xylosidase (D) activities in aggregates in different treatments. NAG: N–acetyl–glucosaminidase; LAP: leucine aminopeptidase; BG: β–xylosidase; BXYL: β–xylosidase. Different lowercase letters mean significant differences among aggregate size fractions (p < 0.05). The differences in the four enzymes’ activities across fertilization managements are shown at *: p < 0.05, **: p < 0.01, ***: p < 0.001, and ns: not significant.
Agronomy 11 02126 g006
Figure 7. PCA analysis (A) of soil microbial properties and enzyme activity in macroaggregates (>0.25 mm) under 4 fertilization managements (CK, NP, NPS, and NPM). Variation-partitioning Venn diagram (B) of SOC accumulation variance partitioning among fungal indices (a), soil enzyme activity (b), and microbial diversity (c) predictor matrices in macroaggregates (>0.25 mm). Figure 7A,B were created using R version 3.2.2 (“R: A Language and Environment for Statistical Computing, R Core Team, R Foundation for Statistical Computing, Vienna, Austria (2016), https://www.R-project.org, accessed on 15 March 2019). Fungal indices, soil enzyme activity, and microbial diversity contained three, two, and two factors, respectively.
Agronomy 11 02126 g007
Table 1. Soil physical and chemical properties for CK, NP, NPS, and NPM treatments in 0−15 cm layer in 2018.
IndicesCKNPNPSNPM
pH7.807.837.797.77
Bulk density (g cm−3)1.281.301.231.20
SOC (g kg−1)12.3518.2617.6717.15
CK: the control treatment without fertilization management; NP: the treatment with only inorganic fertilizer; NPS: the treatment with inorganic fertilizer and maize straw addition; NPM: the treatment with inorganic fertilizer and cattle manure.
Table 2. Two-way ANOVA of fertilization treatment (T), aggregate size (A), and their interaction (T × A) on soil C, enzyme activity, microbial variables, and aggregate properties.
IndicesTreatment (T)
F P
Aggregate Size (A)
F P
T × A
F P
SOC19.1 ***4.81 **0.55
DOC57.15 ***8.01 ***4.33 ***
ROC14.82 ***0.357.6 ***
MBC2.0817.73 ***4.51 ***
BG35.32 ***5.54 **2.66 *
BXYL39.34 ***14.74 ***2.11 *
NAG12.23 ***17.37 ***1.61
LAP4.08 *54.97 ***3 **
Total PLFA35.05 ***17.59 ***3.00 **
Bacteria22.39 ***9.91 ***3.22 **
Fungi23.08 ***12.23 ***2.44 *
AM46.27 ***15.89 ***2.18 *
Actinomycetes21.84 ***12.38 ***1.72
G+20.73 ***22.59 ***0.99
G−8.16 ***5.17 **2.26 *
G+/G−5.87 **10.33 ***1.91
F/B10.46 ***1.691.56
H′0.956 ***3.48 **
D0.415.2 **2.11 *
M1.922.132.62 *
Moisture54.91 ***137.16 ***4.85 ***
Dry-p0879.68 ***14.77 ***
BG: soil enzyme activities of β−Glucosidase; BXYL: β−Xylosidase; NAG: N−acetyl−glucosaminidase; LAP: leucine aminopeptidase; AM: arbuscular mycorrhizal fungi; G+: Gram−positive bacteria; G−: Gram−negative bacteria; G+/G−: the ratio of G+ and G− bacterial PLFA; F/B: the ratio of fungal and bacterial PLFA; H′: Shannon–Wiener diversity index; D: Simpson evenness index; M: Margalef richness index; Dry-p: the proportions of aggregates using dry sieving method. *: p < 0.05; **: p < 0.01; ***: p < 0.001; ns: not significant.
Table 3. Microbial PLFA biomass and ratios of the phospholipid acid biomarkers and microbial diversity in differently sized aggregates.
Microbial IndicesSoil Fraction (mm)Fertilizer Managementp Value
CKNPNPSNPM
F/B>5 mm21.71 ± 2.19 Ab18.00 ± 5.07 Aa18.75 ± 0.52 Ab19.67 ± 2.80 Aans
2–5 mm20.42 ± 0.18 Ab19.72 ± 1.22 Aa19.22 ± 0.20 Ab18.59 ± 2.12 Aans
1–2 mm22.53 ± 0.75 Aab17.74 ± 2.29 Ba19.09 ± 1.48 Bb19.21 ± 1.02 Ba*
0.25–1 mm25.17 ± 1.22 Aa18.19 ± 0.46 Ba19.78 ± 0.61 Bb19.05 ± 0.99 Ba***
<0.25 mm21.68 ± 1.00 Ab17.69 ± 1.11 Ba22.86 ± 0.86 Aa22.03 ± 1.36 Aa**
p value*ns***ns
G+/G−>5 mm0.37 ± 0.22 ABb0.34 ± 0.04 Bb0.45 ± 0.03 Ab0.42 ± 0.06 ABans
2–5 mm0.40 ± 0.02 ABb0.39 ± 0.02 Bab0.43 ± 0.01 Ab0.40 ± 0.02 ABans
1–2 mm0.36 ± 0.03 Ab0.41 ± 0.05 Aa0.44 ± 0.02 Ab0.44 ± 0.05 Aans
0.25–1 mm0.50 ± 0.06 Aa0.42 ± 0.01 Aa0.46 ± 0.02 Ab0.42 ± 0.02 Aans
<0.25 mm0.49 ± 0.03 Aa0.44 ± 0.02 Ba0.50 ± 0.01 Aa0.50 ± 0.03 Aans
p value****ns
Microbial diversity
Shannon–Wiener (H′)>5 mm3.21 ± 0.09 ABb3.10 ± 0.07 Bc3.26 ± 0.05 Aa3.23 ± 0.08 ABbns
2–5 mm3.38 ± 0.03 Aa3.16 ± 0.04 Bc3.19 ± 0.13 Ba3.25 ± 0.03 ABab*
1–2 mm3.25 ± 0.07 Aab3.28 ± 0.05 Ab3.24 ± 0.05 Aa3.25 ± 0.12 Aabns
0.25–1 mm3.23 ± 0.06 Bb3.41 ± 0.02 Aa3.26 ± 0.10 Ba3.40 ± 0.05 Aa*
<0.25 mm3.32 ± 0.09 Aab3.38 ± 0.07 Aa3.26 ± 0.05 Aa3.29 ± 0.07 Aabns
p valuens***nsns
Simpson (D)> 5 mm0.94 ± 0.01 Aa0.93 ± 0.006 Bb0.95 ± 0.001 Aa0.94 ± 0.006 ABa*
2–5 mm0.95 ± 0.001 Aa0.96 ± 0.01 Aa0.96 ± 0.01 Aa0.95 ± 0.005 Aans
1–2 mm0.95 ± 0.005 Aa0.94 ± 0.006 Aa0.95 ± 0.004 Aa0.94 ± 0.01 Aans
0.25–1 mm0.94 ± 0.004 Ca0.95 ± 0.001 Aa0.95 ± 0.005 BCa0.95 ± 0.001 ABa*
<0.25 mm0.95 ± 0.006 ABa0.95 ± 0.004 Aa0.94 ± 0.002 Ba0.95 ± 0.005 Bans
p valuens**nsns
Margalef (M)>5 mm10.79 ± 0.48 Ab11.25 ± 1.57 Ab12.04 ± 0.83 Aa11.83 ± 0.80 Aans
2–5 mm13.59 ± 0.05 Aa10.94 ± 0.43 Bb11.12 ± 1.66 Ba11.17 ± 0.92 Ba*
1–2 mm11.93 ± 1.26 Aab12.03 ± 0.70 Aab10.73 ± 0.52 Aa12.13 ± 2.07 Aans
0.25–1 mm11.17 ± 1.29 Bb13.34 ± 0.96 Aa10.85 ± 1.42 Ba13.45 ± 0.83 Aa*
<0.25 mm12.89 ± 0.63 Aa12.13 ± 0.22 Aab12.33 ± 0.46 Aa12.82 ± 0.90 Aans
p value*nsnsns
B/F: the ratio of total bacterial and fungal PLFA; G+/G−: the ratio of G+ and G− bacterial PLFA. Capital and lowercase letters indicate significant difference among fertilization and aggregate size, respectively, at p < 0.05. ***: p< 0.001; **: p< 0.01; *: p< 0.05; ns: not significant.
Table 4. Correlative coefficients between SOC and soil biological properties for CK, NP, NPS, and NPM in differently sized aggregates.
Index>5 mm2–5 mm1–2 mm0.25–1 mm<0.25 mm
Total PLFA−0.14−0.44−0.220.010.003
Actinomycetes−0.17−0.21−0.3−0.23−0.13
Bacteria0.02−0.41−0.050.220.14
Fungi−0.53−0.43−0.64 *−0.48−0.17
AM−0.67 *−0.64 *−0.68 *−0.56−0.46
F/B−0.76 **−0.07−0.73 **−0.66 *−0.45
G+/G−−0.170.040.33−0.32−0.37
H′−0.27−0.75**−0.270.61 *−0.04
D−0.430.47−0.440.560.03
M0.06−0.74 **−0.140.50−0.49
BG0.120.17−0.280.560.28
NAG−0.030.54−0.370.26−0.57
BXYL0.050.83 ***−0.63 *0.65 *−0.41
LAP−0.510.8 **−0.320.66 *−0.48
Note: See Table 2 for abbreviations of some soil biological properties. *: p < 0.05. **: p < 0.01. ***: p < 0.001.
Publisher’s Note: MDPI stays neutral with regard to jurisdictional claims in published maps and institutional affiliations.

