Article

Measuring On-Farm Phosphorus Fertiliser Use—Lessons Learned from Surveying Data of Five Regions in Northern Germany

1
Crop Health Group, Faculty of Agricultural and Environmental Sciences, University of Rostock, D-18059 Rostock, Germany
2
Institute for Food and Resource Economics, University of Bonn, D-53115 Bonn, Germany
*
Author to whom correspondence should be addressed.
Agronomy 2021, 11(11), 2123; https://doi.org/10.3390/agronomy11112123
Submission received: 27 August 2021 / Revised: 15 October 2021 / Accepted: 18 October 2021 / Published: 22 October 2021

Abstract

:
Phosphorus (P) is essential for agriculture; however, local P surpluses can have adverse environmental effects, such as eutrophication. Optimal P fertiliser use, therefore, means balancing these effects. Although P fluxes from soil to plants are key research areas, little is known about on-farm use of P fertilisers. As, typically, not all fields or crops are treated with P annually, the transferability of measurements for other nutrients, such as nitrogen, appears limited. This study aims to close this knowledge gap. On-farm P use was described using the farm records of 50 farms in five regions of northern Germany for the period of 2010 to 2018. All sources for P fertilisation were taken into account as either P mineral, P organic or P total. Two indicators for on-farm P use were suggested: frequency, which gives the percentage of the treated area, and amount, which gives the quantity used per ha of the treated area. The frequency for P total ranged from 55.9% to 93.1% of the total farm area being fertilised. Amounts between 24.8 and 41.6 kg ha−1 P total were applied on the treated area of the farm. The results supported the separation of the quantity and frequency in on-farm P use. No decrease in P use was found during the period investigated. Using mixed models, the results further show that explanatory variables, including the farm characteristics and crop choice, explain the substantial variations in P use. It is recommended for the example of Germany to establish an official digital database for P fertilisers that can be updated professionally and is mandatory for all documentation on P use.

1. Introduction

As an essential nutrient for plants, phosphorus (P) is an important ingredient in fertilisers [1,2]. Farmers use P fertilisers in various forms. Typically, P fertilisers stem from inorganic mineral or organic sources. Mineral P fertiliser consists of raw phosphate, which is made available to plants by treatment with acids [3]. Organic P fertilisers predominantly originate from animal husbandry. Most of the P in organic fertilisers is already present in mineral form; however, some of it only becomes available through complex transformation processes in soils [4]. In the interest of a circular economy, the use of fertilisers made from recovered P has recently become a subject of growing interest [5].
While P availability often limits plant growth and biomass production in natural and semi-natural areas [6,7], in landscapes used for agriculture in developed countries, P is also found to pollute surface waters [8,9]. The main pathway of P losses is surface runoff through erosion and the discharge of P through preferential flow during storm events [10]. In water bodies, P can lead to eutrophication, which is associated with the growth of toxic algae, loss of biodiversity and poor water quality [11]. These trends have focused attention on identifying the sources of P surpluses in agriculture from an environmental perspective.
From an agricultural production perspective, the trait that P is mainly immobile in the soil favours the application of multi-annual fertiliser budgets on arable land, also known as stock fertilisation [12]. In this concept, the farmer only fertilises with P once in several years. Fertilising the soil stock has long been considered a reasonable strategy with respect to medium-term P availability for crops [12] and is, therefore, widely adopted and recommended by advisory services in many regions, such as the EU [13]. However, such fertilisation approaches have been questioned in view of the possible adverse environmental effects of a higher P content in soils [14].
Arable farmers’ typical concept is to use P fertiliser to supply the soil with the nutrient for up-take by the plants demand. That is, such fertilisation concepts include aspects of nutrient supply and demand in nutrient budgets or balances [15]. However, sound knowledge about P fertiliser use on farms, including documentation and measurement of true P fertiliser use, is a prerequisite for budgeting the supply and demand of P. Yet, the main sources of information about P uptake typically stem from field experiments.
Long-term field experiments have the advantage of depleting soil P stocks in the untreated control, which would otherwise mask P use effects in the treatments [16,17]. We, however, argue that on-farm supply of P fertiliser is more variable than field experiments suggest. Thus far, only little is known about patterns of P use on farms [18]. This study aims at closing this gap with two objectives.
Based on the knowledge about the multi-annual stock fertilisation, we hypothesised that the overall average amount of P applied per ha is not satisfactory to indicate on-farm use. Therefore, the first objective concerns how on-farm P use can be described to indicate P fertiliser use intensity appropriately. Indicators should be suitable for describing and comparing actions as simply as possible [19]. At the EU level, for instance, agri-environmental schemes targeting at mitigating adverse environmental effects from agricultural intensification, have been discussed to be ineffective; however, at the same time, data limitations concerning large-scale information about farms’ true fertiliser use have been acknowledged [20].
Therefore, suitable indicators should help to induce and control required changes. Regardless of whether a change is compulsory or voluntarily, it must link the practical action and the desired effects. The relevance of these actions for the effects must be scientifically evident, but not necessarily measurable in real-life data. Agri-environmental indicators are particularly widespread [21]. One example of their use is to calculate a nutrient balance using nutrient inputs and outputs [22], for example to monitor fertiliser policies. These indicators are in contrast to use indicators, which do not capture productivity or environment-related effects [19,23].
Heated societal debates about tightening the application ceilings for P use in regions with strong environmental governance and highly regulated fertilisation, such as Europe and Germany, the study region here, induced pressure on farmers to use less (P) fertiliser [24,25,26]. In our study region and period, the legal fertilisation framework, e.g., the German Fertiliser Ordinance, has been revised to respond to new findings, with a considerable revision implemented in 2017 [27,28,29]. Although this framework concentrates to reduce nutrient balances, in view of the debate, we hypothesised lower on-farm P fertiliser use over time; however, in particular, in the years prior to the implementation of the German Fertiliser Ordinance in 2017. Therefore, the second objective of this study concerns investigation of time trends in on-farm P use in light of regulatory changes.
To explore the two objectives, we collected extensive P usage data based on farmers’ records in five regions in northern Germany covering different natural and structural conditions. This region represents a regional spread under the same fertilisation regulation. In each region, ten farms with complete documentation from 2010 until 2018 were surveyed. Two distinct measures were proposed, yielding two independent indicators to describe on-farm P use, and to analyse temporal trends. We identified the required steps to implement a process to describe on-farm P use and explored it over time. This investigation documented and offered understanding of the challenges in describing on-farm P use.
On-farm data acquisition requires that farmers share their data. Nevertheless, both consolidating the data from different farms and checking the credibility is time and resource consuming. Therefore, we have made use of this experience to provide recommended improvements for the case of Germany and for global applications.

2. Materials and Methods
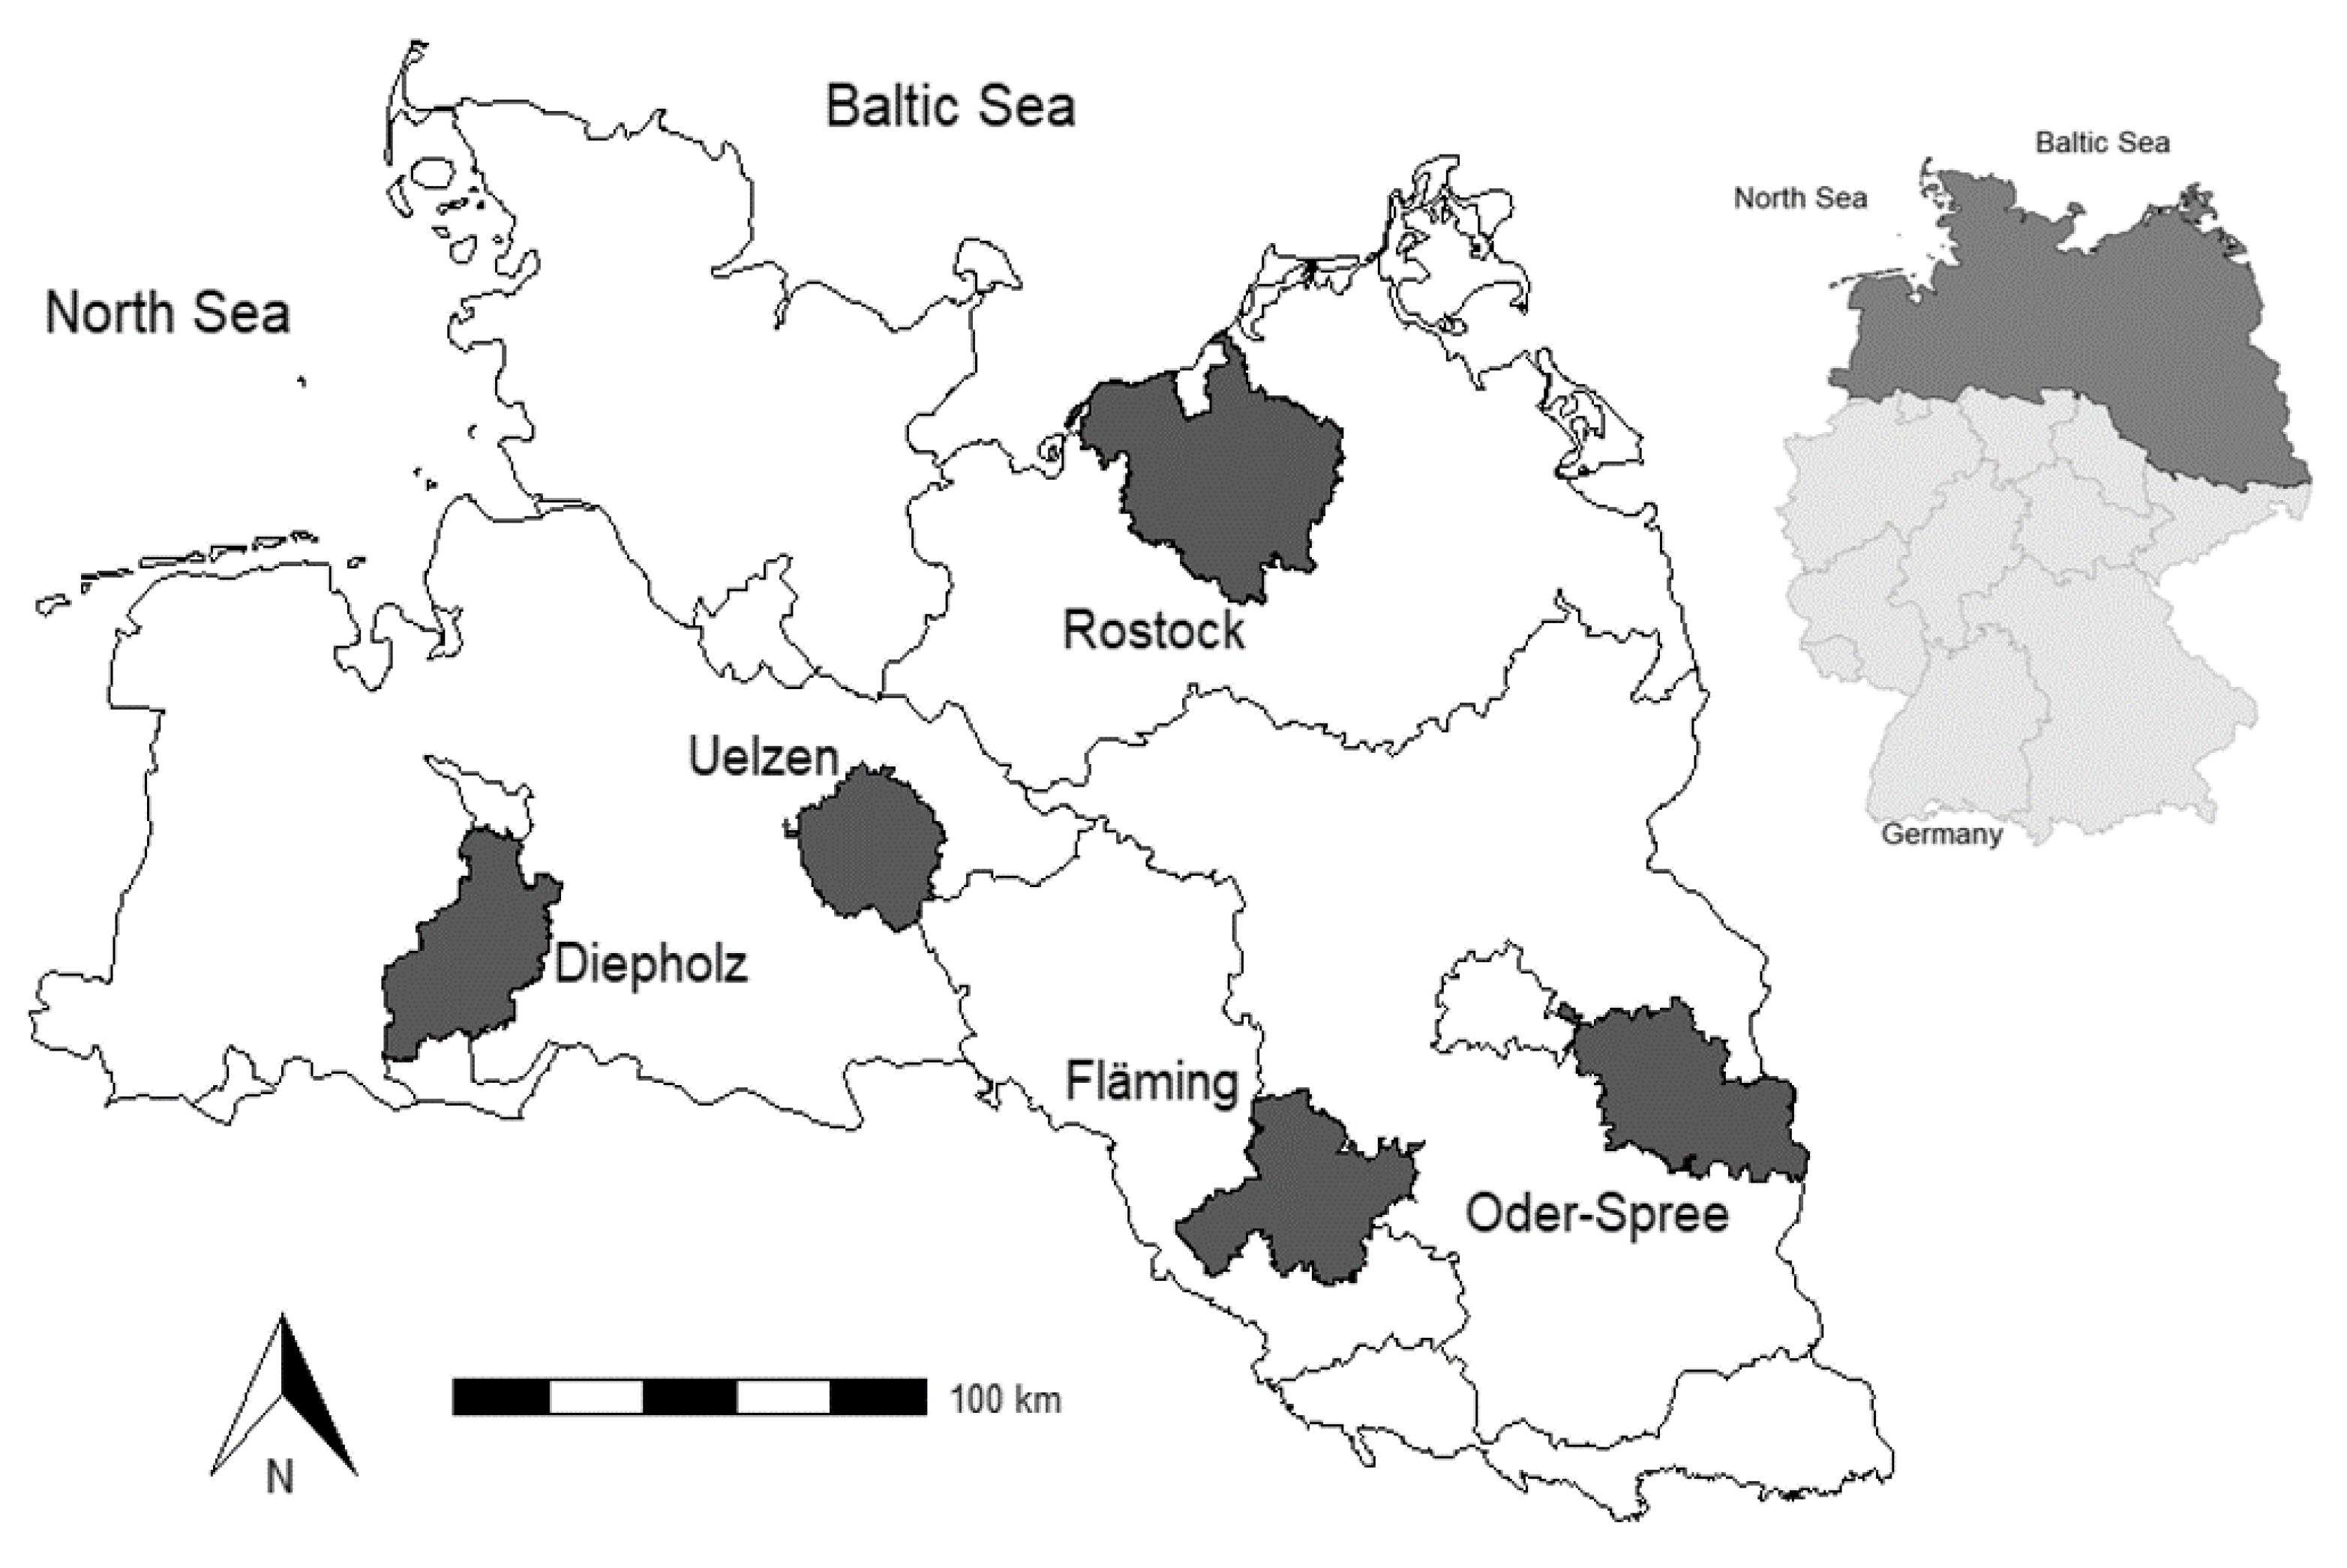
2.1. Study Regions

Farm records were obtained from five regions in northern Germany: Diepholz and Uelzen are located in the west of the region, Rostock is in the north near the Baltic Sea, and Fläming and Oder-Spree are in the east of the region (Figure 1). In Diepholz and Uelzen, farms operate less land (an average farm size of about 228 ha and 144 ha, respectively) and are mainly organized as family farms. Rostock, Fläming and Oder-Spree are located in eastern Germany, which has a history of land collectivisation and large-scale farming [30,31], and the farms are still comparatively large (average farm sizes of about 857, 2069 and 1879 ha, respectively; see Table 1). The regions are roughly located on a west-to-east transect with decreasing precipitation as the climate becomes more continental (Table 1).

2.2. Data Collection

Ten farmers in each region who volunteered to take part in the study were surveyed, producing a total of 50 farms. Contacts to farmers were made through regional agricultural authorities in previous projects [34]. Additional farms were acquired from regional public farm registers. Acquired farms were personally visited at least one time to collect data on a farm and field scale. Direct contact with all farms was held via phoning and mailing, and, if necessary, the farm was visited again. At farm scale, information such as the farms’ legal form, size and livestock units was surveyed. At field scale, the farms’ field-specific records were collected, including the name of the field, cultivation year, size and crop grown.
Regarding P use, the date, fertiliser name, amount, unit and treated area of the field were surveyed. Documenting all field treatments in the period 2009 to 2018 was mandatory for our study, although it was not officially required from the authorities. Methods of documenting field activities ranged from handwritten notes to spreadsheets and digital field management systems. This study only considered arable land and excluded the farms’ grassland, fallow and flower strips. Forage production on arable land was included as part of the crop rotation. The field-wise farm records documented activities, but not necessarily other inputs, such as the soil nutrient content and outputs, like the yield quantities and qualities. These are required for nutrient budgeting in a complete farm-gate or field-based fertilisation balance.

2.3. Fertiliser Specification

In the study, P use in terms of organic and mineral fertiliser was recorded separately. Taken together, this provided the total P. For branded mineral fertilisers, the manufacturer’s data on the nutrient content was used wherever possible. Where local traders mixed individual fertilisers for farmers from different standard compounds, and if the records contained no further information, the nutrient contents, but not the chemical compounds, were recorded.
The nutrient content of organic fertilisers should be available based on standardised regular analyses of total-P by farms. However, analyses were not always performed in every year. Therefore, in the majority of cases, an average nutrient content was calculated for each farm on the basis of the available analyses for each organic fertiliser. The farm specific average value for each organic fertiliser was then deployed for the whole period. This means that, behind each organic fertiliser application, there is one or the average of several farm-specific analyses to determine the P nutrient content. For 489 measurements, the standard values from publicly available databases were applied [35,36]. Table 2 shows the main fertilisers used and their range of nutrient contents across all farms.

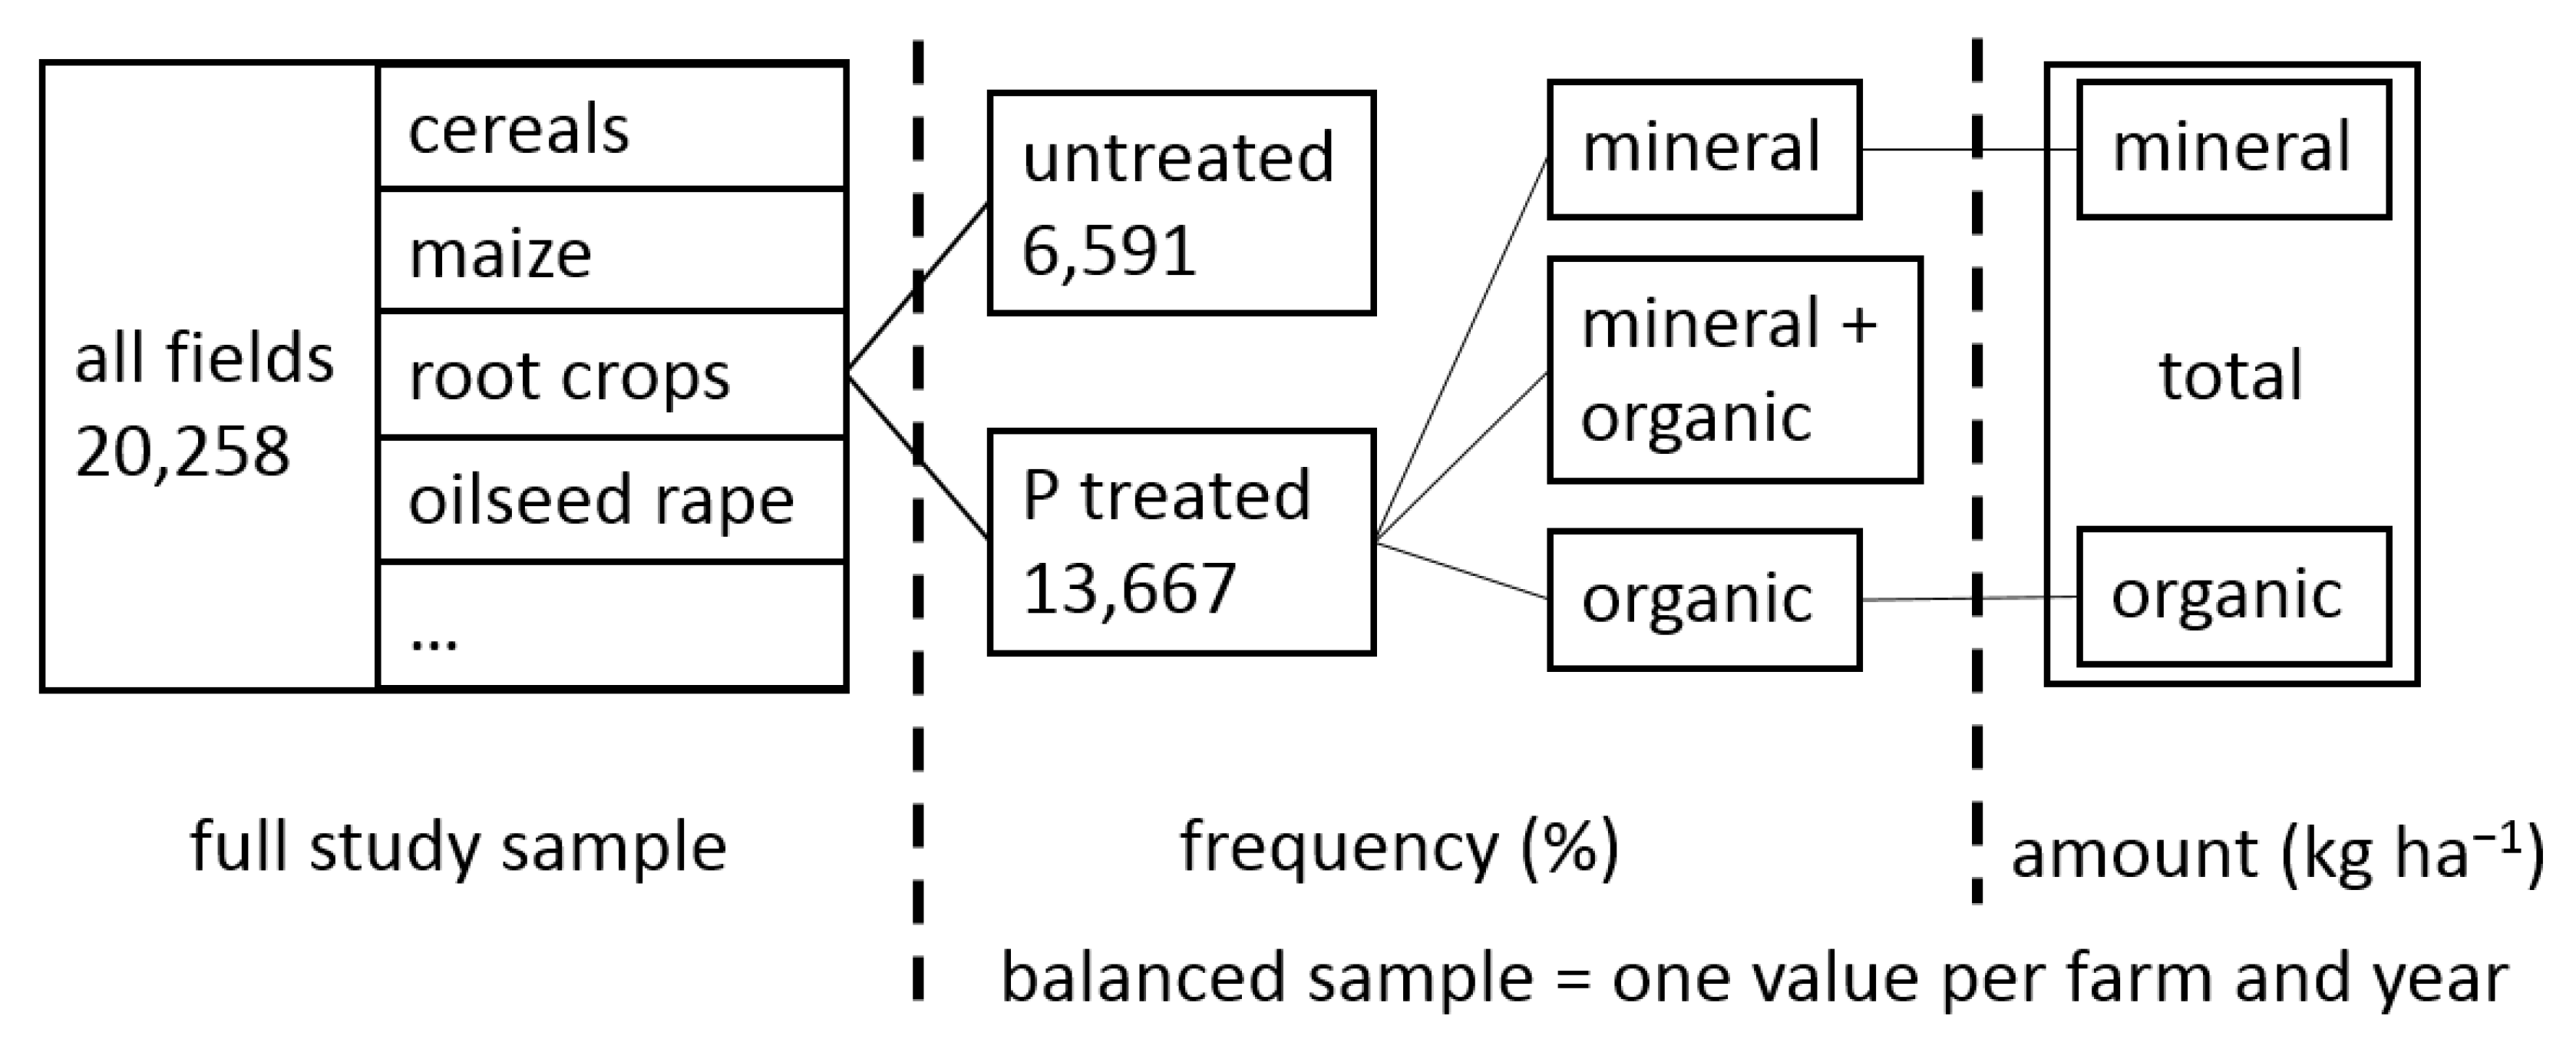
2.4. Data Processing

The full study sample comprised 20,258 fields. Fields are counted in every year of cropping. Two indicators were used to describe P use. Since not all fields are treated with P every year, the frequency use indicator described the percentage of the treated area and included the full area of each farm. To calculate the farm-specific mean P amount, only the treated fields were considered, i.e., 24,072 P fertiliser applications.
The P amount use indicator per field f , P f am , was calculated as follows: First, the applied fertiliser F f per field was multiplied by the specific P nutrient content N . To take partial area-specific fertilisation on some fields into account and to allow the precise consideration of the treated area, it was necessary to weight the result. Therefore, the field area treated A f trea was divided by the total field area A f tot and the result then multiplied with the calculated P amount in kg ha−1 (see formula 1). Mineral and organic P fertiliser amounts were recorded separately, with the values summed to give the total amount (Figure 2).
P f am = ( F f × N ) ×   A f trea A f tot
The P amount indicator P ly am per farm l and year y in kg ha−1 was calculated as follows: Field size varied within each sampled farm; to ensure small and large fields correct proportional influence on P ly am , the individual area-specific weighted P amounts per field P f am from Formula (1) had to be re-weighted. Therefore, the P amount per field P fi am was multiplied with the total field area A fi tot of the same field i and divided by the total treated area A ly trea of the farm l in the year y. The sum of all the P amounts weighted by their field area in relation to the total treated area of the farm resulted in the weighted P amount for one farm in one year P ly am (see Formula (2)).
P ly am = i = 1 , , n n   P fi am × A fi tot A ly trea
Each farm contributed a maximum of one weighted value per year and nine values for the whole period studied. This process resulted in a balanced study sample, in which the standard deviations of the amount and frequency indicators could be reduced. If the balanced study sample size was smaller than 90 in one region or less than 10 in one year in one region, a farm did not use any P in a year. With the two use indicators of frequency and amount, all 50 farms could be characterised without the influence of different farm sizes.
If non-normal distributed values were indicated, based on the Shapiro–Wilk test, differences in use frequency and P amount used between regions and years were then tested using the Kruskal–Wallis test (null hypothesis: there is no difference between groups). If values were normally distributed, the Tukey test was performed (null hypothesis: there is no difference between groups). All tests were part of the R-package “agricolae” [37].

2.5. Analysis of Variance

The question of whether P use decreased over time, was investigated by using mixed models and the factor year. Mixed models have the advantage to reveal the contribution of explanatory variables on the variance of the two target variables, i.e., the indicator frequency and amount.
Therefore, the first linear mixed model (see Formula (3)) was specified with nested random effects to explain variance components for P use frequency P ijk fre in the balanced study sample:
P ijk fre   = μ + L ji + R j + Y k + ε ijk
Where symbol μ denotes the mean use frequency of farm L ji in region R j and year Y k . Random effects are allowed by farm L ji , region R j and year Y k . Farm L ji is nested in region j . The nesting takes into account that variance between farms in one region may behave differently than between farms in different regions. Symbol ε ijk denotes the error term.
To explain the variance of the P amount used per field, P ijkmnop am , the second linear mixed-effect model (see Formula (4)) with nested random effects was specified for treated fields in the full study sample using the unweighted P amount:
P ijkmnop am = μ + F noi + F mnj + C ok + C m + L on + R o + Y p + ε ijkmnop
Therein, symbol μ is the mean amount used for the whole dataset. Random effects are field F , crop C , farm L , region R and year Y . Lower case letters indicate that the field F noi is nested in farm n and region o . Field F mnj is nested in crop m and farm n . The crop C ok   and the farm L on are nested in the region o . The symbol ε ijkmnop denotes the error term.
A Chi2 test of variance components tested the statistical significance of the random effects in both models. The null hypothesis is H0: σ2 = 0. Analyses were carried out with R-package ‘lmerTest’ [38].

3. Results

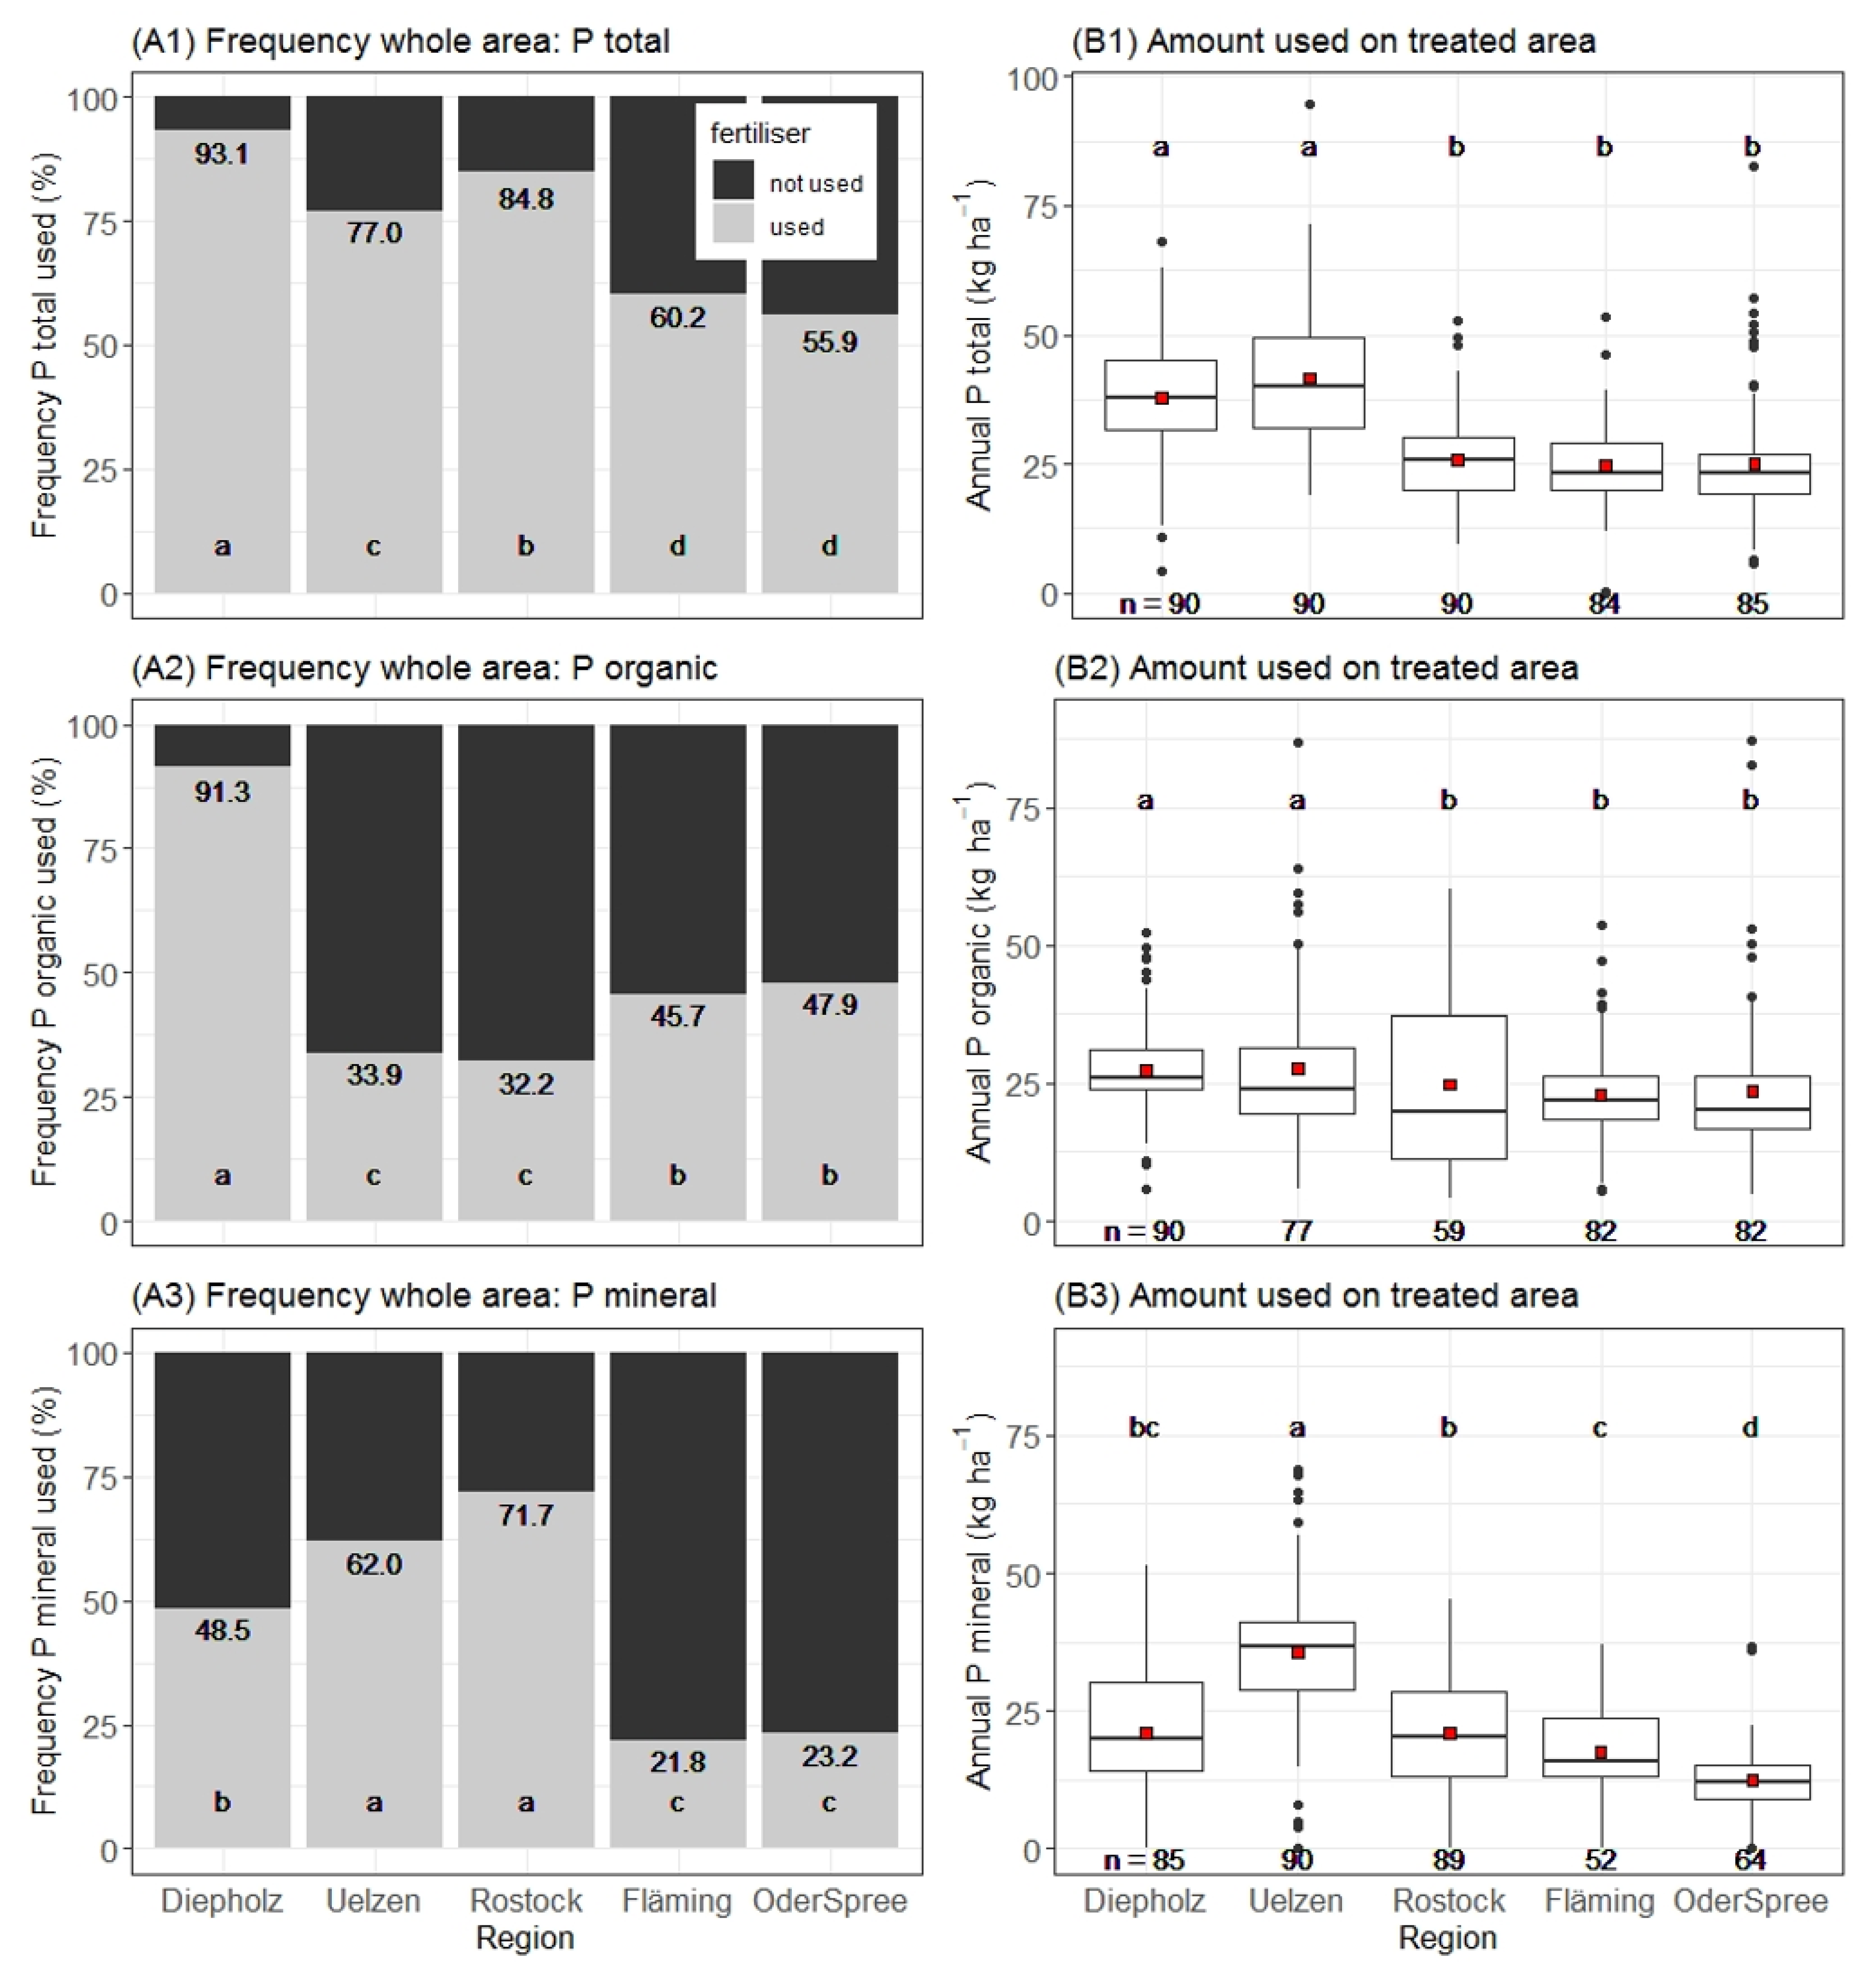
3.1. Two Indicators: Frequency and Amount of P Used

The analysis of P fertiliser use in the five regions revealed significant differences (Figure 3). Overall, the indicator frequency showed that the majority of the studied area was treated with some P. The use frequency for total P was statistically significant, decreasing from the highest value in Diepholz, to Rostock and Uelzen, while Fläming and Oder-Spree both had a statistically significant lower level (Figure 3(A1)).
The total P amount used on the treated fields was statistically significantly higher in Diepholz and Uelzen than in Rostock, Fläming and Oder-Spree (Figure 3(B1)). As the relative amounts per ha are referred to the treated area of the farm, to interpret the results, note that frequency is related to the entire area of the farm. The P amount fertilised organic and mineral refers to different treated areas of the farm, which means that mineral and organic P amounts cannot be added directly to get the total P amount. Tests were performed in accordance with Section 2.4.
With regard to P applied only with organic fertiliser, Diepholz had the highest frequency at 91.3% (Figure 3(A2)). The eastern regions of Fläming and Oder-Spree treated approximately half of the area, and Uelzen and Rostock only a third (Figure 3(A2)).
The indicator amount was statistically significantly higher in the west (Figure 3(B2)). It is noteworthy that 31 values were zero from Rostock, indicating that some farms had not used organic P fertilisers for several years (Figure 3(B2)).
The frequency of P used with mineral fertiliser was highest in Uelzen and Rostock, in contrast to the frequency shown with organic fertilisers. The eastern regions of Fläming and Oder-Spree had the lowest frequency at just over 20% (Figure 3(A3)).
Farmers in the region Uelzen used the greatest amount of P on the treated fields. In the region Fläming in 38 and in Oder-Spree in 26 cases, farms did not use any mineral P fertilisers in one year during the investigated period (Figure 3(B3)).

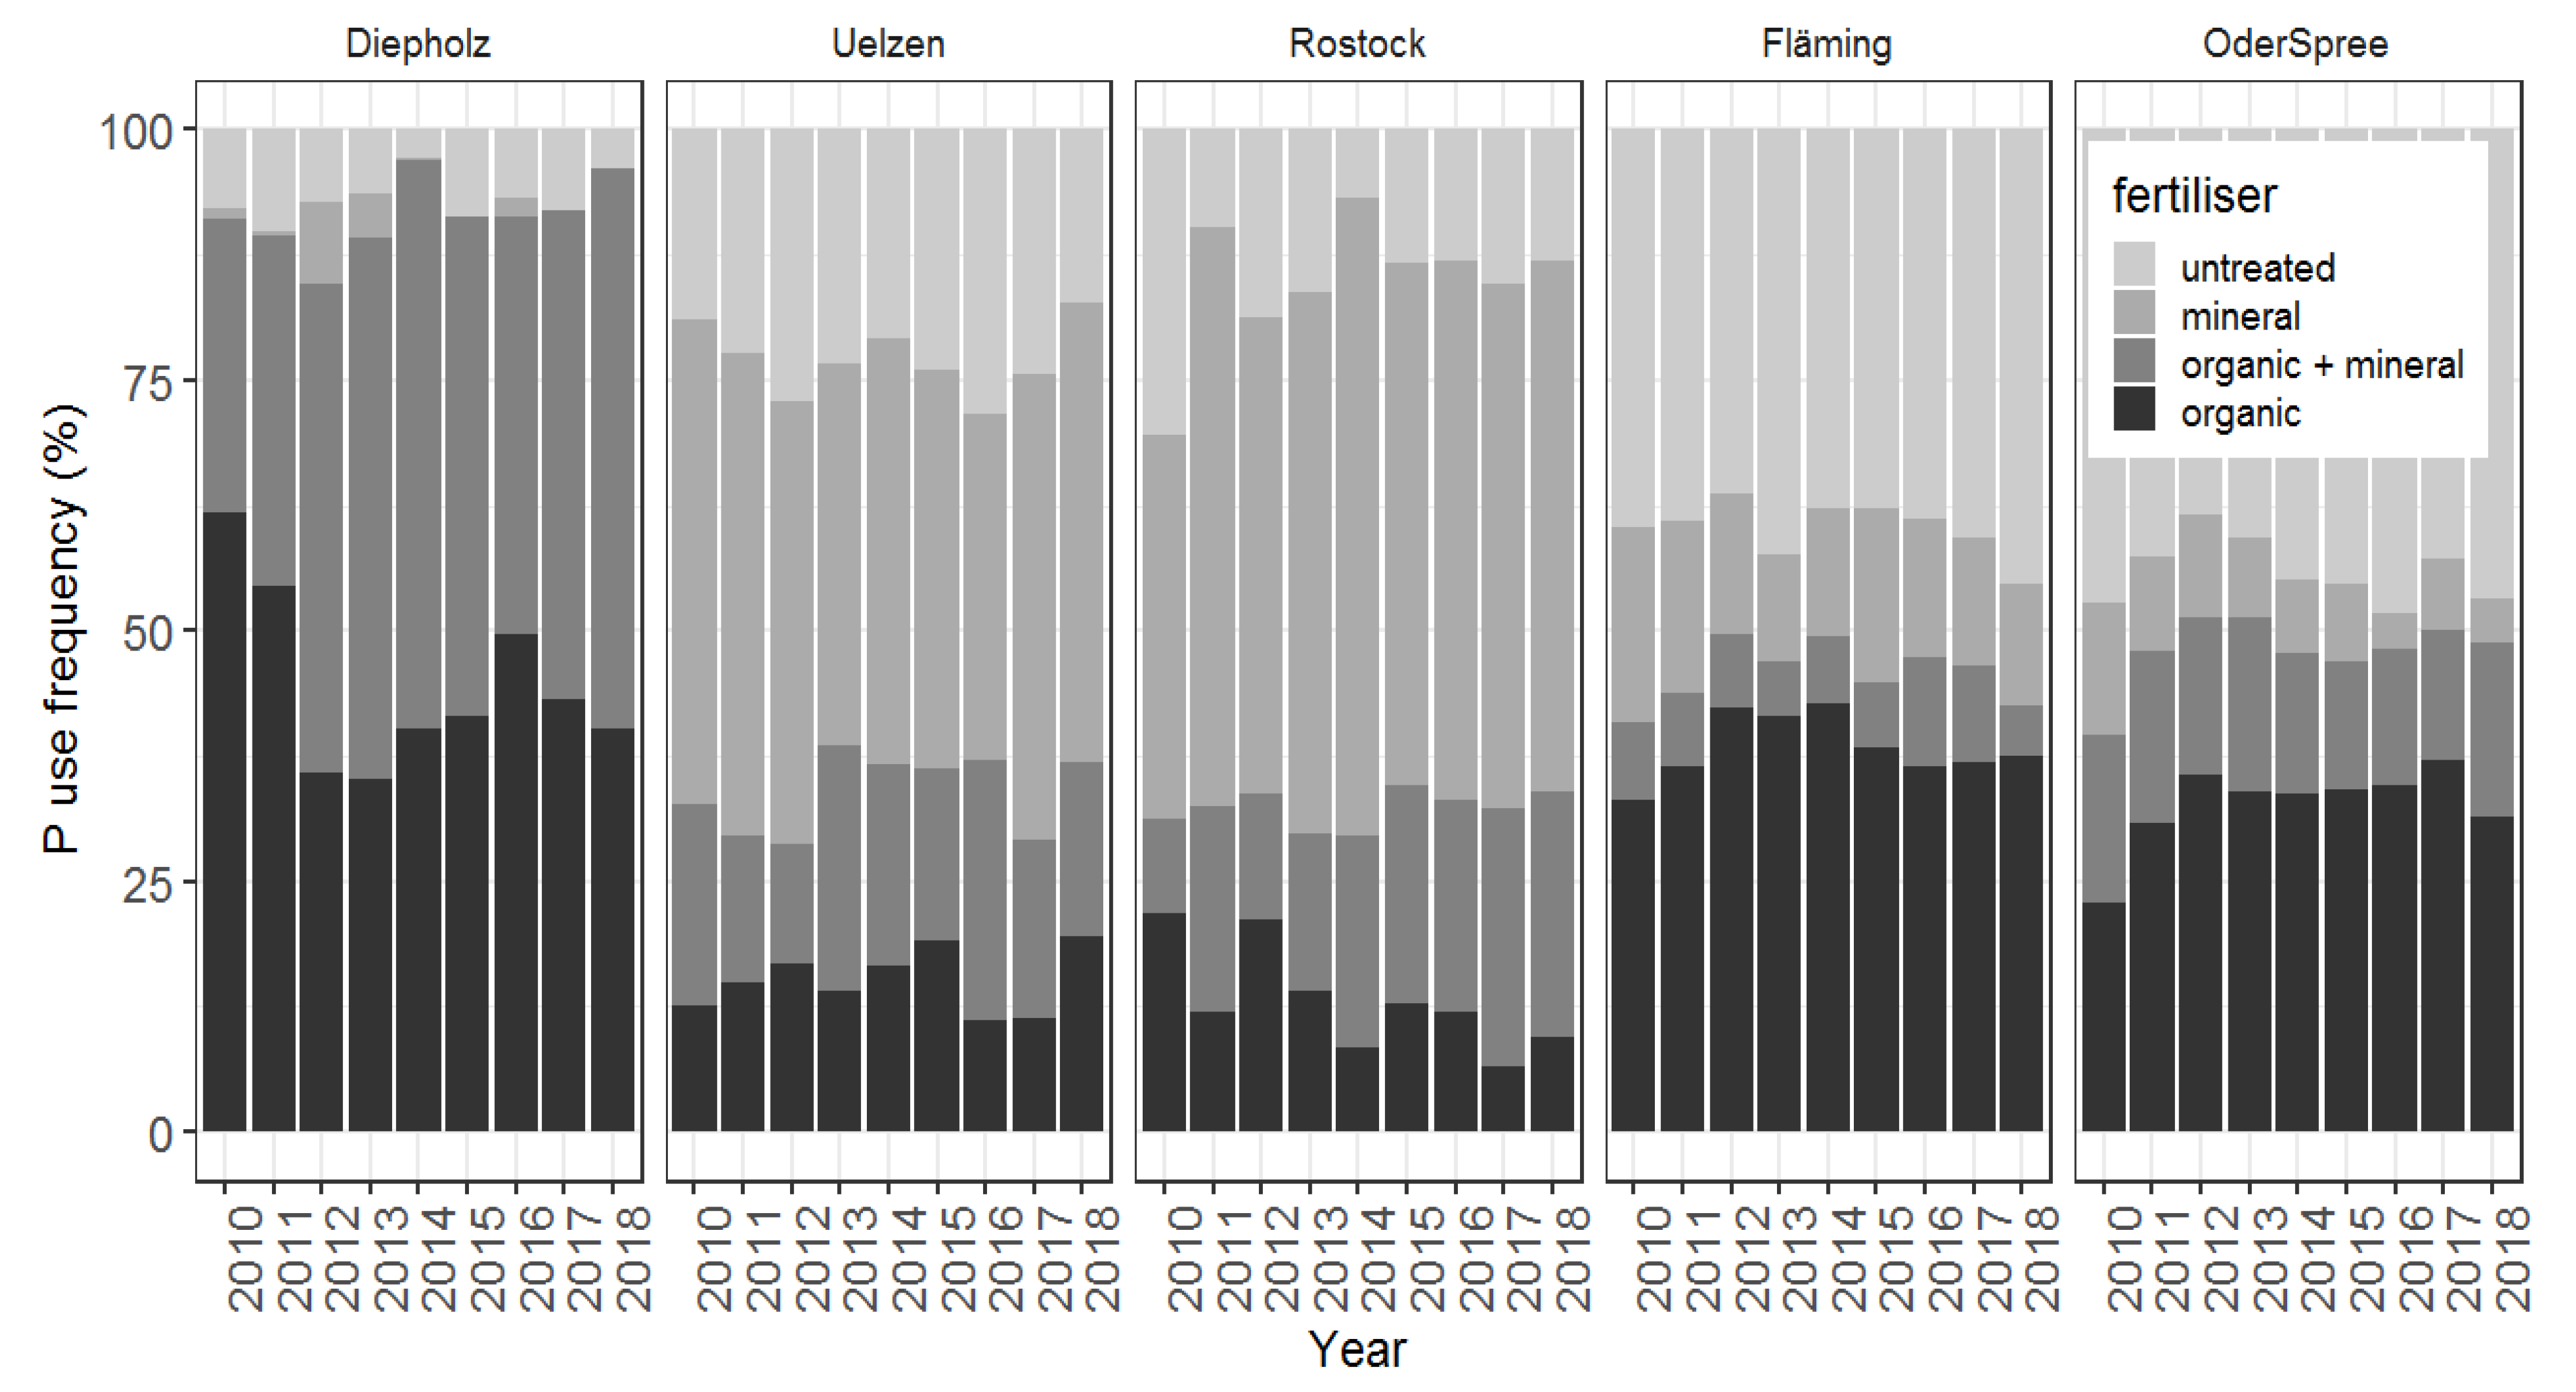
3.2. Temporal Trends in Frequency of P Fertiliser Use

To achieve the second objective, first, the calculated P use indicators were plotted over the period studied (2010–2018) (Figure 4). The differences in the composition of the P source between the regions were pronounced and were maintained throughout the period. Despite some fluctuations, the P treatment patterns were uniform for the analysed period. For Diepholz, Uelzen and Oder-Spree, the frequency of untreated fields remained at the same level. In Rostock, the trend of the frequency for untreated fields decreased, while it increased in Fläming.
Second, referring to the linear mixed model (see formula 3) to explain the variance, the P use frequency results for P total, P organic and P mineral, suggest no statistically significant impact for the factor year (Table 3). The factor farm explained half of the variance for total and organic applied P and 41.5% for mineral P, all statistically significant. The factor region was the second major influence, explaining up to 39.7% of the variance.

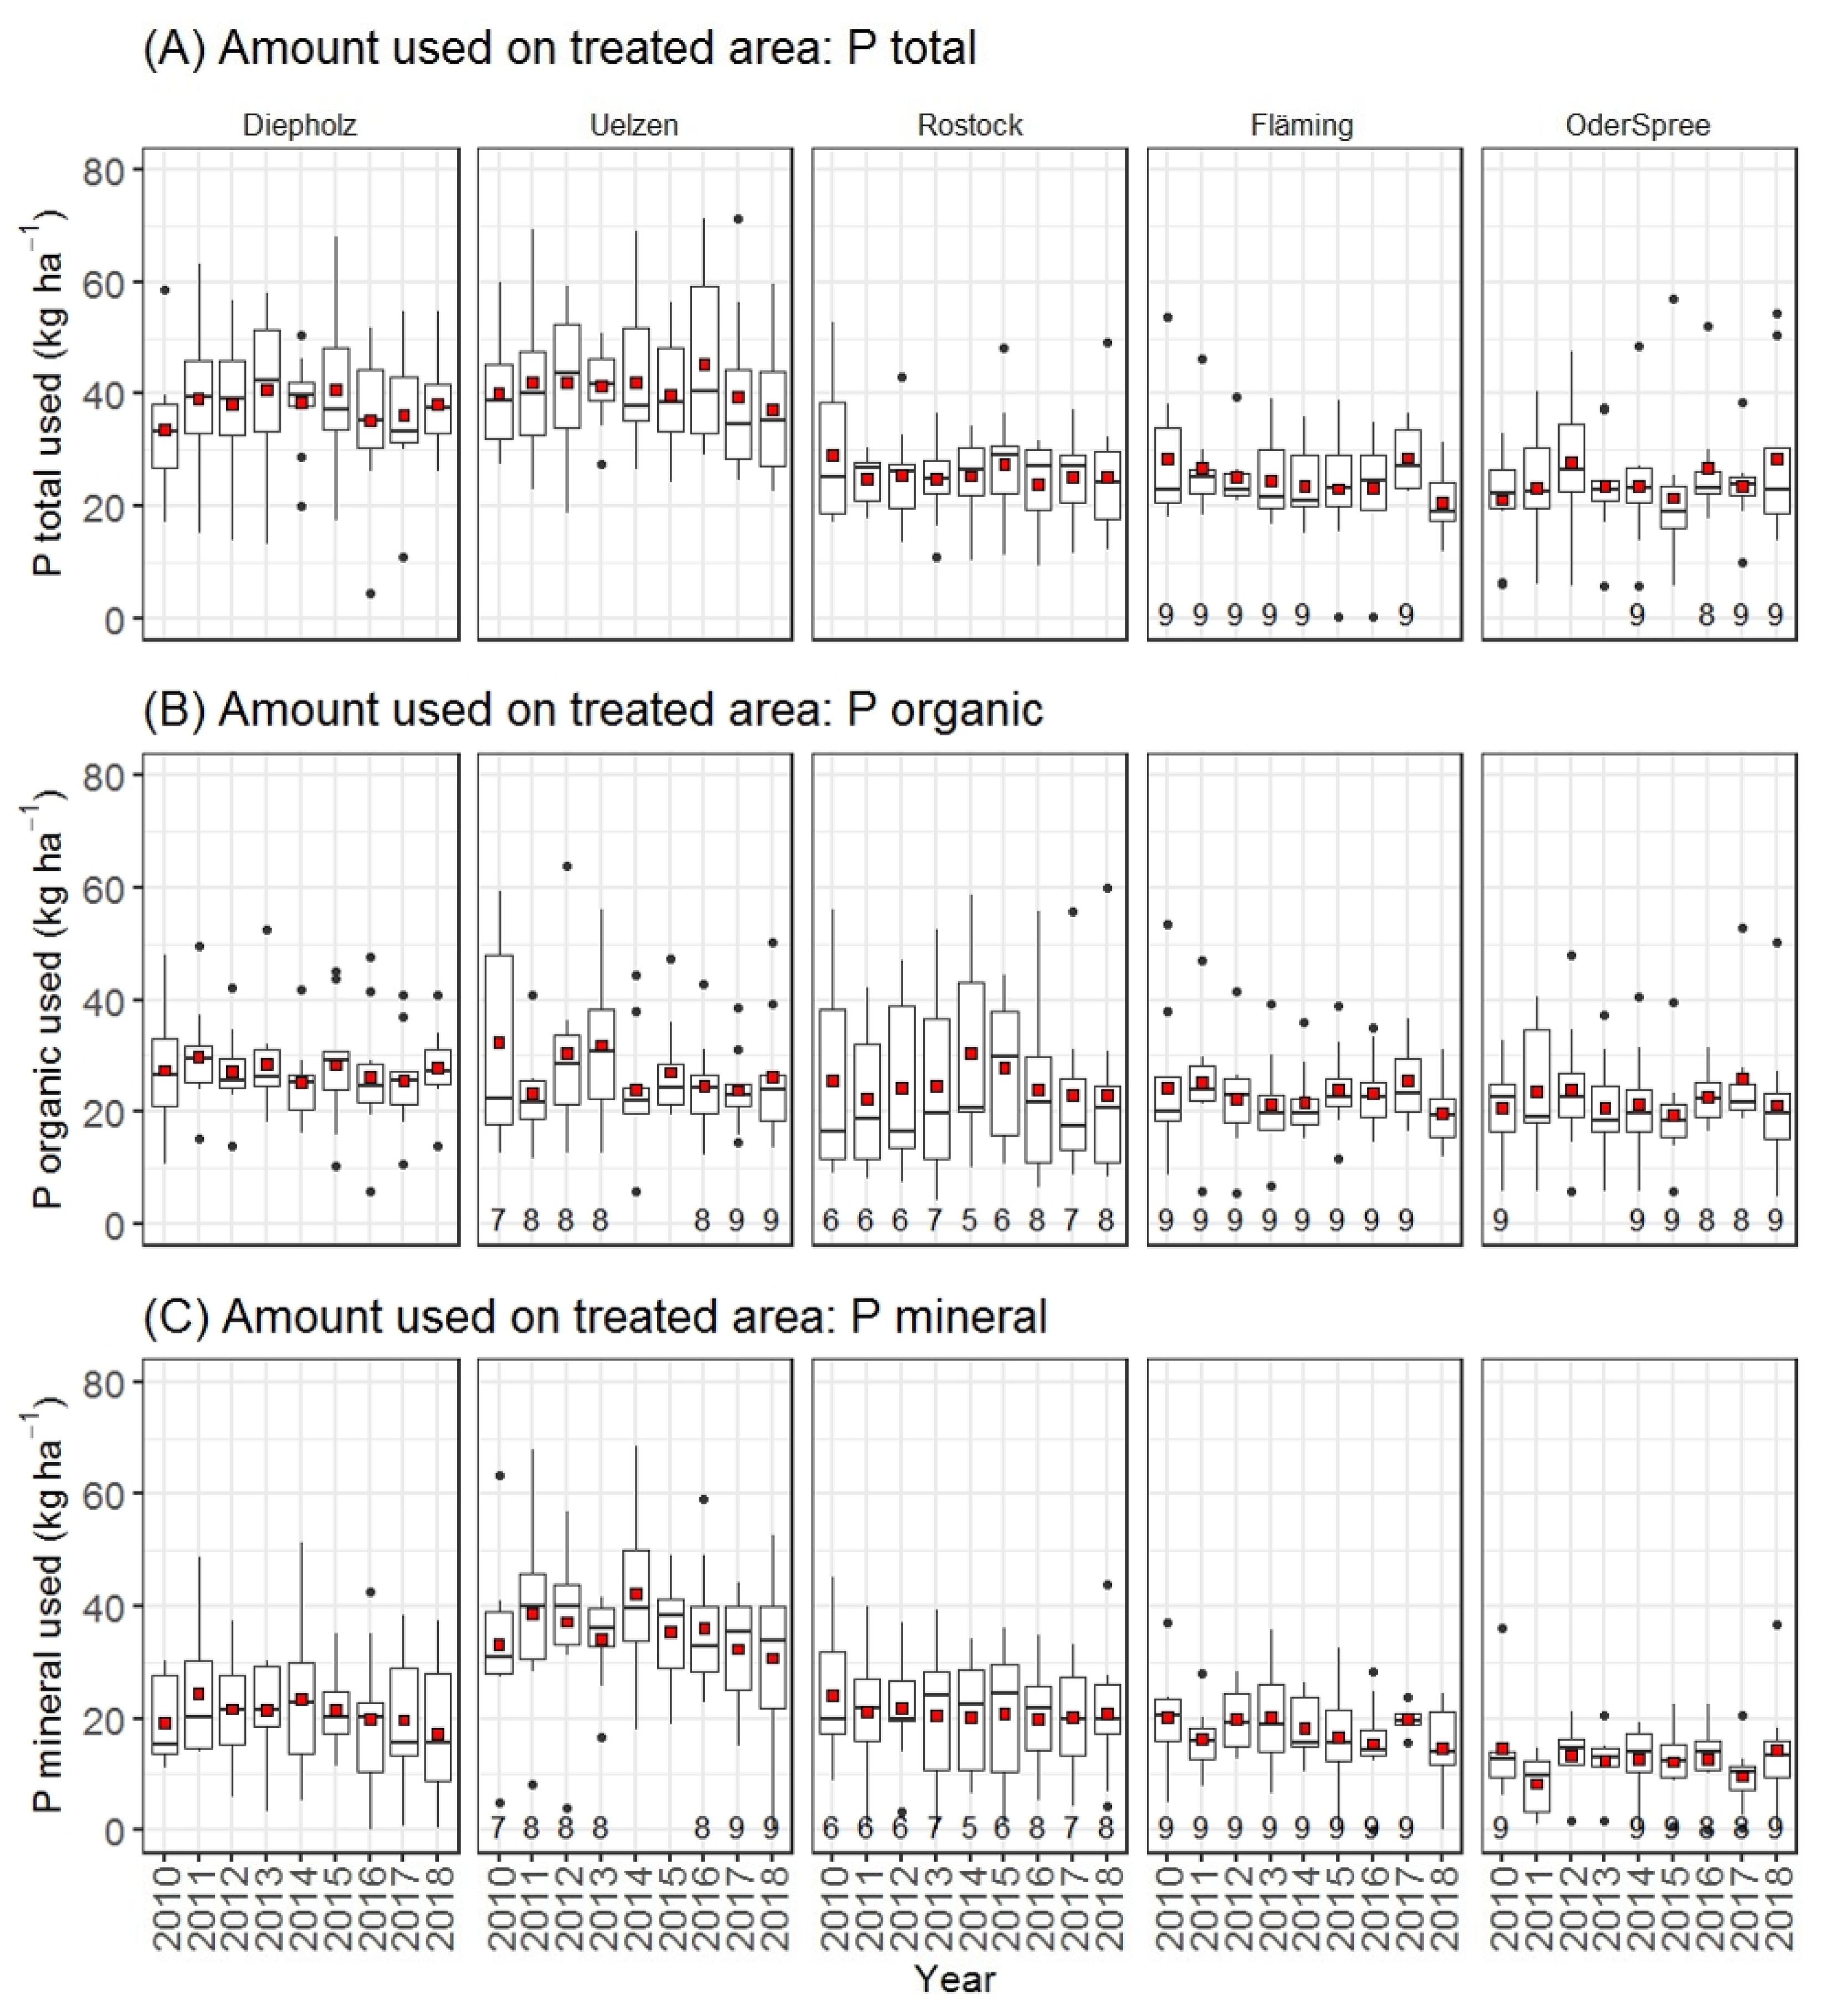
3.3. Temporal Trends in the Amount of P Fertiliser Use

For the P amount used on the treated fields, plots showed no trend over the years. Indicators for Uelzen and Rostock showed a wider distribution of values, except for the total P in Rostock. No statistically significant differences between years were found based on the tests described in Section 2.4, except for the P total in Fläming, where in 2018 (20.7 kg ha−1) statistically significant less P was used than in 2011 (26.9 kg ha−1) or 2017 (28.6 kg ha−1) (Figure 5).
Referring to the linear mixed model (see formula 4), the results suggest that between 55.9% and 79.1% of the variance of the P amount used can be explained (Table 4). The year was a statistically significant factor but explained very little of the variance. The factor crop and its nested forms accounted for most of the variance in the P total and mineral. It was a statistically significant factor for all fertilisers except for applied P organic. For the latter, the main factor was the farm. The field did not affect the amount used. The region accounted for 8.4% of the variance for mineral fertilisers.

4. Discussion

4.1. Data Aquistion

This study used on-farm data from a unique dataset to explore the P fertiliser input. On-farm data provide a realistic picture of when and how farmers use P fertilisers as the data mirror the full variability in these applications. Exploring methods to survey and evaluate the real P use on farms forms a prerequisite to monitor farms’ application of P. This is especially relevant for regions with regulation and control policies but also for farm benchmarking purposes and potential environmental risk assessment [39]. Policy measures that target the mitigation of environmental harm from intense P fertiliser use require sufficient data for assessing their effectiveness and to improve measures. From a global perspective, agricultural P use has been receiving considerable attention given the limited resource and disparities in soil-P stocks [40].
Hence, better descriptions of on-farm P use patterns is a reasonable scientific goal. While knowing how P fertilisers are used on farms appears a trivial question at first glance, we realised to the best of our knowledge that quantitative data were hardly available and that little was known about on-farm P fertiliser use. With the exception of Yunju et al. [18], who conducted household studies on P fertilisation in China, we found no sources in the international scientific literature. While we may have missed applied data collections, provided in national languages, for the case of Germany, this type of data was not published in the sampling period.
Therefore, this self-collected data set is unique—this restricts direct comparisons with similar datasets. Nevertheless, the collected data were not intended to deliver a representative picture of the on-farm P fertiliser use in Germany. The regions were chosen based on a former stakeholder-oriented research project [32], and the farms were not randomly acquired. However, the five regions accounted for medium-scale regional diversity in production conditions in Northern Germany (Table 1) under the same fertiliser governance. For pesticide use, the intensity differed between the regions decreasing from west to east [34].
Volunteer participation of farms probably produced a selectivity bias, as we expect that farmers with entire recordkeeping and an interest in accurate fertilisation were more likely to participate. Our mandatory demand for detailed field recordkeeping in the surveyed time, excluded farms from the survey due to a lack of data records in all years. This lack of data exists for more farms going back prior to the study period (2010–2018). New documentation requirements for fertilisation on farms in Germany and some other European countries could improve finding farms with sufficient data quality in the future and, thus, mitigate such bias [41,42].
Consequently, we collected a sample of 50 farms over a time of nine years with a regional spread but with unknown selectivity bias. However, we believe that it is unlikely that the bias leads to an overestimation of on-farm P fertiliser use [43,44]. Moreover, the variability in the results reveals that the sampled farms have fertilised anything but uniformly (Figure 3, Table 3 and Table 4).

4.2. Insight into On-Farm P Fertiliser Use from the Two Indicators

Two indicators appeared to be essential for analysing farm P use. Phosphorus is not necessarily used on all fields on the farm every year. Thus, the indicators frequency, describing how often fields are treated with P fertilisers, and amount, capturing the quantity of P applied to the treated area, were used to describe on-farm P use appropriately (Figure 3). These were use indicators and did not capture productivity or environment-related effects [19,23]. If farmers want or are required to change the P fertiliser supply, they can modify it in two ways: by treating more/fewer fields or using more/less fertiliser.
Yet in both situations, fertilising with P less often or in smaller amounts, mitigation of adverse environmental effects can be achieved [45,46]. While productivity, crop quality and soil-P testing requirements have been the base of traditional P use recommendations, a recent analysis of P fertilisation experiments in Central Europe showed no positive yield effect of P use in arable production except for soils that are heavily depleted in soil-P. These authors conclude that national P fertiliser recommendations are set too high for optimal yield [47,48] and, therefore, should be redefined.
Differences between the indicators were apparent in the regional evaluations (Figure 3). The patterns of frequency deviated from those of amount. The two types of indicators are always relevant if farmers can apply a certain agronomic practice either more or less often or in different amounts. An example is the use of the herbicide active ingredient glyphosate [31]. For nutrients, such as nitrogen, that need to be given every year, the indicator amount is sufficient for comparing farms, fields or years. For irregular P use due to multi-year fertilisation, an adequate description of on-farm data requires the additional indicator frequency.
Investigation of this indicator, however, requires on-farm data, such as the data collected in this study. Field experiments in which P is used every year except for the control plots, such as the data analysed by Buczko et al. [49], can reflect effects on the amount, but not on the frequency of P fertiliser use on farms. The two indicators can apply to setting methodological standards to assess on-farm P fertiliser use, comparing P fertiliser use of farms and providing a simple traceability scheme for the on-farm distribution of fertilisers.
The two values indicate P fertiliser use patterns in a way straightforward to achieve and understand. A high frequency of treated fields together with a low annual amount indicates a fertiliser use that should feed the plant rather than the soil stock. High frequencies together with high amounts indicates a high farm internal supply with P that must be distributed to the fields. Low frequencies combined with high amounts indicates a consequent multi-annual stock fertilisation. The same counts for low frequencies and low amounts with a higher risk to deplete the soil in the years without fertiliser applications. The complex system of P mobilisation in the soil and uptake by crops certainly amplify the agronomic consequences of these four combinations. However, all four will achieve to replace the crop-P offtake.

4.3. Temporal Changes Were Negligible

The mixed model analyses revealed a statistically significant but small influence of the year on the variation of the P amount used (Table 4). However, these were small annual fluctuations. Nevertheless, no temporal trend was identified for either indicator in the period studied (Figure 4 and Figure 5). Thus, the hypothesis that on-farm P use declined during the nine-year study period was rejected based on the data set. Despite the heated debate about adverse environmental effects related to P use and the ensuing pressure increasingly placed on farms, the sampled farms did not seem to respond to this during the period studied.
Until 2017, hence, during most of the sampling period, a societal debate took place to reduce fertiliser input and environmental pollution. In 2017, German legislation was ratified [29] setting limits for budgeted P surpluses in a farm wide balance. In a six-year sliding average 8.73 kg P ha−1 a−1 surplus is allowed. From 2023, the allowed limit will be halved [50]. Since then the legislation was updated, approved and finally came into force in 2020 [27].
Farms in the eastern regions Fläming and Oder-Spree fertilise less P than in the other studied regions (Figure 3). Due to a lower precipitation, the maximum yield levels are lower in these regions (Table 1). The observed stable pattern of P fertiliser use over time in the sample did not differ between regions, although the frequencies of organic and mineral P fertilisers used differed. Lower frequencies of organic P go along with higher frequencies for fields treated solely with mineral P in the regions Uelzen and Rostock (Figure 4).
One possible explanation is that organic P fertilisers are less available to the farms analysed. In Uelzen, animal husbandry is generally less frequent (Table 1) and in Rostock, organic P fertilisers are distributed over more area on large farms. Therefore, mineral P fertilisers are especially used for the cultivation of P-sensitive crops, such as sugar beet and oilseed rape. While organic P sources are often internally supplied on-farm, farms must buy mineral P sources. Stable amounts applied on fields fertilised with mineral P means that farmers did also not opt for reducing this external P source (Figure 5).
The stable temporal pattern of P fertiliser use in the presented data can be interpreted in four ways: changes were (i) not perceived as necessary by farms, (ii) not possible, (iii) consciously avoided or (iv) intended by farms but not implemented yet.
(i) Farms participated voluntarily in this survey, and it is possible that they already practise more advanced fertilisation techniques than average farms. If the resulting fertiliser use was traditionally moderate, no visible adaptions in fertiliser use could be perceived as necessary to meet the new regulations.
(ii) In the short term, reductions in P fertiliser use are not possible if organic P fertilisers are the main source of P fertilisation, and no additional land area other than the previously available land can be used. Organic fertiliser in both frequency and amount mostly depends on the farm rather than on any other explanatory variable. Reductions of farm-specific P sources requires reducing livestock, distributing the organics to other farms or extracting P from manure [51]. The same applies to residuals from biogas plants. These changes remain challenging for most farms in Germany and other EU countries.
(iii) Reductions were consciously avoided. The risk of future on-farm P deficiencies caused by an expected tightening of legislation could discourage advanced reduction in fertilisation.
(iv) Intended changes of the P fertilisation regime sometimes can only be implemented over a longer perspective. For instance, acquiring additional land for a better distribution of organic fertilisers can mean purchasing land, which might not be short-term available or due to existing lease contracts, this might be delayed. The observed “business as usual” seems, thus, a reasonable result but also a reasonable farm strategy in view of anticipated tighter regulations. Expected continuous or even increasing future P needs due to climate change, associated risks and necessary costly adaptations in arable production can be additional reasons for conservative strategies [52].
While temporal trends were negligible, the factors “farm” and “crop” contribute to explain variability in P fertiliser use (Table 3 and Table 4). “Farm” being most relevant for frequency and amount of P organic means that the farm animal husbandry is most important for organic P fertilisation and, thus, for the whole farm. The region is the second important factor for the frequency of P organic sources, but the region only contributes to explain variance for amount if considered together with the farm. The factor “crop” explains a large part of the variation in the amount applied as P mineral. The practice of multi-year stock fertilisation, hence, applying fertilisers only once for several years, is likely amplified by the crops cultivated.
In the concept of multi-annual stock fertilisation, farmers receive advice to apply fertilisers prior to the more P-sensitive or economically important crops and maintain the others from the resulting P stock in the soil [53]. Hence, the large effect of the crop for amount was expectable as it occurred. Disentangling the crop and year effect in the mixed model, however, revealed no clear effect of the years and led us to reject our second hypothesis of lower on-farm P fertiliser use over time.
In summary, we cannot find a temporal decline of P fertiliser use for our study’s farm sample. The lack of any baseline average on P fertiliser use hinders comparisons. Regarding the sampling conditions (Section 4.1), we argue that it is, however, unlikely that the average P fertiliser use on farms across Germany is lower and decreased considerably during the investigated period.

4.4. Implications for Improving the Acquisition of Data on P Fertiliser Use

Data acquisition for this study revealed that on-farm documentation is crucial for any implementation of fertiliser stewardship—irrespective of whether it is voluntary or mandatory. Digital on-farm documentation would allow us to collect more data records; yet, this also implies larger efforts for data management. Regardless of the type of documentation, ranging from fully digitalised to entirely hand-written field records, ambiguities, gaps and implausibility in the recorded information challenged data analysis. Dealing with these issues was time-consuming but achievable.
What was unexpected were the difficulties in clearly identifying the fertiliser type and nutrient content of the documented fertilisers used over this nine-year period. The broad range of P content in the fertilisers used on the study farms is illustrated in Table 2.
Phosphorus fertilisers relying on mineral or organic sources present various challenges in documentation. Suppliers commonly trade mineral P fertilisers. A uniform product name and content declaration of these traded fertilisers would simplify the documentation. Moreover, this would make it easier and more transparent for farmers to maintain an overview of all available fertilisers. Therefore, it is highly recommended that a comprehensive digital national fertiliser database is established listing all fertilisers with their trade names and nutrient contents. As well as saving a considerable amount of time, this is the only way to guarantee reproducible use on all farms and in all approaches.
For other xenobiotics in farming to be documented on farms, e.g., pesticides or veterinary medicines, farmers access official public databases following a registration procedure. Although calls are not being made to have a fully administrated registration process for fertilisers, steps to ensure more reliable data documentation that is reproducible by other farms are urgently needed. Accurate documentation is fundamental for innovation through data-driven, more efficient management [54]. In Germany, some federal states provide digital documents with fertiliser lists [35]. It is recommended that these be replaced by an official nationwide digital database that is professionally updated and mandatory for all documentation on P fertilisers.
Many farms produce organic fertilisers themselves. The nutrient content of organic fertilisers varies to large extent (Table 2). If traded, organic P fertilisers in Germany must be analysed for their nutrient content. However, most organic P fertilisers circulate on the farm; thus, no trade is involved. Analysis of the nutrient content was not mandatory for every organic fertiliser used in the study period to 2018 [27]. However, all farms analysed their organic fertilisers from time to time. The averages of these values were taken for the calculations in all years. Another approach is to refer to standard values for the nutrient content of on-farm organic P fertilisers given in commonly used information [35,36].
Based on the present data, the differences between these standards and the individual farm values suggest that the latter are closer to reality. To overcome remaining uncertainties, more nutrient analyses of organic on-farm P fertilisers should be performed. These analyses should follow a standard procedure to ensure comparable sampling and handling by certified laboratories. In the total sample of 50 farms, a great variety of special organic P fertilisers was found to be used infrequently and in small quantities. With respect to these minor uses, standard values seem essential. Therefore, it is recommended that standard values for organic P fertilisers be included in the national digital database and quantity thresholds implemented for compulsory case-specific nutrient analyses. Countries, such as Denmark, Sweden, Finland and the Netherlands, already have standard values for organic fertilisers [42].
Comprehensive on-farm fertiliser use documentation forms the base for sustainable, environment-friendly and sound nutrient management by farmers. Moreover, accurate on-farm fertiliser use information forms a prerequisite for data collection to capture the actual farm use of fertilisers for monitoring and policy impact evaluation purposes. Such data are necessary as they capture how farms behave within regulatory boundaries and how they react to market, climatic and other production risks. In dimensions, including climate change mitigation, policy evaluations and improvements also urgently require these data [55].

5. Conclusions

The unique on-farm data collected in this study show that P fertilisers are not applied regularly every year on every farm field. Therefore, fertiliser use must be described with the indicator amount and, as a second indicator, frequency, in order to identify differences.
No reduction in P use was observed on the studied farms during the period from 2010 to 2018. While discussing some possible reasons for this missing trend, new legislation to reduce nutrient use only came into force at the end of the period studied and may take longer to have an effect.
Addressing the governance of P use seems desirable to avoid adverse environmental effects from P and other nutrient surpluses. Effective P-use governance, however, requires a meaningful picture about on-farm P uses from different fertilisers, and this is especially relevant for policy impact evaluation purposes.
Therefore, farmers should be assisted by officials in their recordkeeping about fertiliser use to obtain the most realistic data that are comparable between farms and across regions. Moreover, countries with varied regional production conditions, as in Germany, should carefully consider the methods they choose for collecting P use data. The two presented indicators amount and frequency can be applied to set methodological standards to assess on-farm P fertiliser use.

Author Contributions

Conceptualization, S.H. and B.G.; Data curation, P.W. and S.A.; Formal analysis, P.W. and S.A.; Funding acquisition, S.H. and B.G.; Supervision, S.H. and B.G.; Validation, P.W. and S.A.; Visualization, P.W.; Writing—original draft, P.W.; Writing—review & editing, S.H. and B.G. All authors have read and agreed to the published version of the manuscript.

Funding

The research was undertaken as part of the InnoSoilPhos project (http://www.innosoilphos.de/default.aspx (accessed on 27 August 2021)), funded by the German Federal Ministry of Education and Research (BMBF) as part of the BonaRes program (No. 031A558).

Data Availability Statement

Data sharing not applicable.

Acknowledgments

We acknowledge financial support from the German Research Foundation (DFG) and the University of Rostock within the funding programme Open Access Publishing. The authors would like to thank the farmers who voluntarily and without payment gave their time and on-farm records for the scientific evaluation. Thanks are also due to the student assistants who digitised handwritten records. Paul Winklhofer is a member of the Leibniz Science Campus Phosphorus Research Rostock.

Conflicts of Interest

The authors declare no conflict of interest. The funders had no role in the design of the study; in the collection, analyses, or interpretation of data; in the writing of the manuscript, or in the decision to publish the results.

Appendix A

Table A1. Indicator frequency displayed in Figure 3 ± standard deviation (sd) of P used on the whole area: P total, organic and mineral P used. Indicator amount ± standard deviation of P used on the treated area only. All values are given per region (Diepholz, Uelzen, Rostock, Fläming and Oder-Spree) for the study period 2010–2018.
Frequency (%)Amount (kg ha−1)
RegionArea (ha)P totalsdP OrganicsdP MineralsdP TotalsdP OrganicsdP Mineralsd
Diepholz10,672.893.113.191.315.548.524.337.811.727.48.921.010.6
Uelzen16,156.277.019.233.923.962.026.741.613.527.713.735.612.8
Rostock107,181.984.822.932.237.171.729.925.78.624.816.121.110.7
Fläming143,141.260.229.245.725.221.830.424.88.223.18.717.78.1
Oder-Spree98,604.755.928.147.927.323.224.025.012.623.713.812.37.3

Appendix B

Table A2. Indicator frequency displayed in Figure 4 for untreated, mineral-only, organic (Org) and mineral (Min) and organic-only treatment ± standard deviation (sd). Different letters in a column represent significant differences between the years within a region (Kruskal–Wallis p < 0.05). Diepholz min+org and Diepholz only organic were distributed normally and tested with the Tukey test (p < 0.05). Indicator amount used on the treated area ± standard deviation (kg ha−1) is also displayed. DH: Diepholz, UE: Uelzen, RO: Rostock, FL: Fläming and OS: Oder-Spree. Area: total area (ha). Each farm contributes one value every year for frequency; for amount in some years some farms did not use P at all and, therefore, contributed no value.
RegionYearAreaUntreatedsdsMin + OrgsdsMin + Org
Mean
sdOnly OrgsdsOnly Org MeansdOnly MinsdsOnly Min Meansd
(ha)(%) (%) (kg ha−1)(%) (kg ha−1)(%) (kg ha−1)
DH20101019.17.912.5a29.518.3a48.718.761.723.3a25.29.91.03.0ab28.1NA
DH20111189.810.115.7a34.925.2a58.421.854.421.6a28.06.70.61.5ab46.020.1
DH20121166.47.312.1a48.818.7a51.717.935.723.6a25.17.88.214.6a16.414.4
DH20131120.96.411.1a54.022.6a51.911.835.328.0a27.312.04.312.8ab8.910.8
DH20141210.82.96.5a56.725.2a56.621.840.223.1a20.45.20.20.6ab11.3NA
DH20151230.88.719.4a49.920.5a54.917.641.417.1a24.710.00.00.0ab11.3NA
DH20161222.76.912.5a41.730.2a58.517.049.725.1a22.510.31.75.3ab5.47.2
DH20171249.98.018.2a48.922.2a50.520.143.118.2a19.64.60.00.0b13.4NA
DH20181262.53.98.8a55.920.7a50.111.040.224.4a22.27.00.00.0b11.9NA
UE20101708.919.116.3a20.229.6a69.921.112.519.8a21.43.148.331.4a31.116.0
UE20111730.122.315.7a14.613.3a69.837.614.922.2a19.64.348.232.2a43.111.1
UE20121766.927.218.4a11.911.1a70.019.016.820.6a33.016.544.124.9a35.415.0
UE20131756.523.320.9a24.623.8a59.521.414.017.9a28.019.438.126.5a37.712.1
UE20141826.120.818.7a20.111.9a67.123.616.625.0a27.38.642.524.8a46.222.8
UE20151827.924.017.8a17.311.7a65.018.019.021.9a24.612.939.727.0a33.39.0
UE20161822.628.428.2a26.020.4a59.117.111.016.8a29.822.634.628.3a33.017.3
UE20171806.824.424.6a17.813.7a58.826.211.315.6a25.37.846.430.8a31.78.2
UE20181910.417.313.3a17.516.0a54.032.819.423.6a31.813.145.828.8a30.614.0
RO201012,098.230.532.0a9.39.2a47.820.421.835.1a33.521.038.435.3a22.69.0
RO201111,957.79.721.9a20.422.8a40.511.112.026.1a28.625.357.939.6a20.09.3
RO201212,281.918.724.5a12.516.9a47.99.021.236.6a27.721.447.535.2a20.19.8
RO201311,934.116.323.5a15.720.6a40.017.514.026.2a22.916.953.936.1a18.412.9
RO201411,830.66.811.7a21.227.7a44.418.68.321.6a28.320.863.636.3a20.110.3
RO201511,853.813.222.0a21.823.1a46.120.712.827.0a28.711.652.234.0a19.212.8
RO201611,809.913.121.7a21.120.0a43.419.311.925.2a37.727.354.035.1a17.98.3
RO201711,612.415.423.1a25.830.5a39.918.46.59.7a28.919.452.434.1a21.68.3
RO201811,803.313.122.2a24.626.3a42.221.99.419.6a23.922.352.934.7a22.211.5
FL201013,692.739.734.5a7.811.6a33.49.633.128.5a25.913.519.425.0a20.911.0
FL201115,304.639.232.4a7.210.1a37.513.736.530.9a28.08.717.123.5a16.85.2
FL201215,999.636.332.8a7.211.7a38.910.942.432.0a23.88.514.222.4a17.89.0
FL201316,113.142.529.2a5.49.0a39.913.741.530.3a23.47.410.622.3a20.512.2
FL201416,237.837.930.6a6.610.2a38.39.542.729.3a22.07.312.821.1a18.57.5
FL201516,507.737.827.4a6.59.8a46.07.938.328.0a24.08.617.422.9a15.110.7
FL201616,697.138.929.9a10.911.4a38.53.536.530.2a22.78.313.721.7a14.38.7
FL201716,586.240.727.9a9.511.8a48.816.236.929.6a24.59.212.921.2a20.05.2
FL201816,002.445.329.4a5.18.6a37.411.137.527.3a19.06.012.122.8a13.59.3
OS20109541.247.123.5a16.721.8a35.117.922.816.0a17.79.913.317.4a14.510.5
OS201111,222.742.630.6a17.118.0a26.815.230.820.0a25.614.29.513.6a7.96.1
OS201211,178.638.530.9a15.517.3a43.728.135.719.0a28.726.110.315.6a12.17.1
OS201311,050.440.729.8a17.518.9a33.517.133.919.4a24.622.57.912.3a13.05.5
OS201411,193.144.932.1a14.016.2a52.018.633.720.2a15.87.77.510.7a8.55.2
OS201511,228.245.328.8a12.616.3a37.715.634.232.6a17.16.97.910.1a9.55.7
OS201611,091.448.331.7a13.718.2a37.611.334.431.5a18.96.43.58.8a7.36.3
OS201711,077.742.828.9a13.015.6a34.416.337.031.3a19.98.37.114.8a6.45.3
OS201811,021.446.826.5a17.316.3a34.512.731.525.2a18.014.14.58.6a9.46.5

Appendix C

Table A3. Indicator frequency displayed in Figure 5 for untreated, total, mineral and organic treatment ± standard deviation (%). Indicator amount used on treated area ± standard deviation (kg ha−1) is also displayed. DH: Diepholz, UE: Uelzen, RO: Rostock, FL: Fläming and OS: Oder-Spree. Area: total area (ha). Each farm contributes one value every year for frequency; for amount in some years some farms did not use P at all and, therefore, contributed no value.
RegionYearArea (ha)Untreated
(%)
sdTotal (%)sdTotal Mean (kg ha−1)sdOrganic (%)sdOrganic Mean (kg ha−1)sdMineral (%)sdMineral Mean (kg ha−1)sd
DH20101019.17.912.592.112.533.711.591.214.527.410.230.518.819.28.0
DH20111189.810.115.789.915.739.013.089.315.630.09.135.525.524.311.8
DH20121166.47.312.192.712.138.212.184.517.727.17.557.024.721.79.5
DH20131120.96.411.193.611.140.813.489.319.128.59.658.324.021.48.6
DH20141210.82.96.597.16.538.48.696.96.525.37.156.925.023.613.6
DH20151230.88.719.491.319.440.714.091.319.428.410.849.920.521.67.2
DH20161222.76.912.593.112.535.113.891.417.026.311.643.428.019.813.0
DH20171249.98.018.292.018.236.112.492.018.225.78.648.922.219.712.1
DH20181262.53.98.896.18.838.18.196.18.827.97.155.920.717.312.5
UE20101708.919.116.380.916.340.210.532.633.732.319.668.527.333.114.6
UE20111730.122.315.777.715.742.114.229.526.431.323.962.826.338.815.8
UE20121766.927.218.472.818.441.913.328.723.630.415.756.023.537.314.0
UE20131756.523.320.976.720.941.46.938.627.331.914.862.729.134.27.8
UE20141826.120.818.779.218.747.421.136.722.924.010.562.626.742.315.7
UE20151827.924.017.876.017.839.910.136.320.727.18.657.024.335.49.2
UE20161822.628.428.271.628.245.216.437.027.224.79.260.627.036.211.2
UE20171806.824.424.675.624.639.515.029.216.523.87.464.332.032.410.3
UE20181910.417.313.382.713.337.312.436.920.426.111.763.332.230.814.9
RO201012,098.230.532.069.532.029.112.231.139.025.619.847.735.324.211.9
RO201111,957.79.721.990.321.924.94.432.439.822.313.978.330.221.210.9
RO201212,281.918.724.581.324.525.58.233.740.124.417.360.134.421.99.9
RO201311,934.116.323.583.723.524.87.429.839.024.719.169.729.820.513.8
RO201411,830.66.811.793.211.725.37.829.639.430.519.984.821.920.310.4
RO201511,853.813.222.086.822.027.510.534.539.827.814.174.029.021.012.5
RO201611,809.913.121.786.921.723.98.133.037.123.916.775.028.819.89.4
RO201711,612.415.423.184.623.125.27.732.237.722.916.278.223.920.19.7
RO201811,803.313.122.286.922.225.211.034.037.823.116.777.526.820.911.1
FL201013,692.739.734.560.334.528.611.640.927.324.413.627.232.720.310.6
FL201115,304.639.232.460.832.426.98.043.726.725.310.724.332.316.36.6
FL201215,999.636.332.863.732.825.15.749.629.122.49.721.432.620.06.4
FL201316,113.142.529.257.529.224.57.346.926.521.49.116.031.020.211.2
FL201416,237.837.930.662.130.623.56.549.325.821.76.819.331.218.36.6
FL201516,507.737.827.462.227.423.110.544.824.724.17.923.932.216.511.0
FL201616,697.138.929.961.129.923.39.947.427.423.37.024.630.515.58.5
FL201716,586.240.727.959.327.928.65.746.424.925.67.322.430.919.83.0
FL201816,002.445.329.454.729.420.76.142.623.819.75.717.230.914.68.9
OS20109541.247.123.552.923.521.18.839.519.920.88.230.132.514.69.9
OS201111,222.742.630.657.430.623.310.947.926.023.611.526.628.88.45.8
OS201211,178.638.530.961.530.927.711.751.226.830.423.025.928.513.36.1
OS201311,050.440.729.859.329.829.520.851.426.826.921.625.327.612.46.2
OS201411,193.144.932.155.132.123.511.647.728.921.39.921.520.612.66.6
OS201511,228.245.328.854.728.821.414.146.831.619.49.120.520.712.26.4
OS201611,091.448.331.751.731.726.810.848.229.922.74.917.322.912.87.5
OS201711,077.742.828.957.228.923.57.450.034.525.911.320.221.09.76.2
OS201811,021.446.826.553.226.528.314.548.728.521.212.721.816.114.410.6

References

  1. Cordell, D.; Drangert, J.-O.; White, S. The story of phosphorus: Global food security and food for thought. Glob. Environ. Chang. 2009, 19, 292–305. [Google Scholar] [CrossRef]
  2. Filippelli, G.M. The Global Phosphorus Cycle: Past, Present, and Future. Elements 2008, 4, 89–95. [Google Scholar] [CrossRef]
  3. Kpomblekou, A.K.; Tabatabai, M.A. Effect of organic acids on release of phosphorus from phosphate rocks1. Soil Sci. 1994, 158, 442–453. [Google Scholar] [CrossRef]
  4. van Dijk, K.C.; Lesschen, J.P.; Oenema, O. Phosphorus flows and balances of the European Union Member States. Sci. Total. Environ. 2016, 542, 1078–1093. [Google Scholar] [CrossRef] [PubMed]
  5. Huygens, D.; Saveyn, H.G.M. Agronomic efficiency of selected phosphorus fertilisers derived from secondary raw materials for European agriculture. A meta-analysis. Agron. Sustain. Dev. 2018, 38, 52. [Google Scholar] [CrossRef] [Green Version]
  6. Cleveland, C.C.; Townsend, A.R.; Taylor, P.; Alvarez-Clare, S.; Bustamante, M.; Chuyong, G.; Dobrowski, S.; Grierson, P.; Harms, K.E.; Houlton, B.; et al. Relationships among net primary productivity, nutrients and climate in tropical rain forest: A pan-tropical analysis. Ecol. Lett. 2011, 14, 939–947. [Google Scholar] [CrossRef]
  7. Reed, S.C.; Seastedt, T.; Mann, C.M.; Suding, K.N.; Townsend, A.R.; Cherwin, K.L. Phosphorus fertilization stimulates nitrogen fixation and increases inorganic nitrogen concentrations in a restored prairie. Appl. Soil Ecol. 2007, 36, 238–242. [Google Scholar] [CrossRef]
  8. Delgado, A.; Scalenghe, R. Aspects of phosphorus transfer from soils in Europe. J. Plant Nutr. Soil Sci. 2008, 171, 552–575. [Google Scholar] [CrossRef]
  9. Ulén, B.; Bechmann, M.; Fölster, J.; Jarvie, H.; Tunney, H. Agriculture as a phosphorus source for eutrophication in the north-west European countries, Norway, Sweden, United Kingdom and Ireland: A review. Soil Use Manag. 2007, 23, 5–15. [Google Scholar] [CrossRef]
  10. Zimmer, D.; Kahle, P.; Baum, C. Loss of soil phosphorus by tile drains during storm events. Agric. Water Manag. 2016, 167, 21–28. [Google Scholar] [CrossRef]
  11. Carpenter, S.R. Eutrophication of aquatic ecosystems: Bistability and soil phosphorus. Proc. Natl. Acad. Sci. USA 2005, 102, 10002–10005. [Google Scholar] [CrossRef] [Green Version]
  12. Mallarino, A.P. Long term phosphorus studies and how they effect recommendation philosophies. In Proceedings of the North Central Extension-Industry Soil Fertility Conference, Des Moines, IA, USA, 25 November 2009; pp. 14–15. [Google Scholar]
  13. Jordan-Meille, L.; Rubaek, G.H.; Ehlert, P.A.I.; Genot, V.; Hofman, G.; Goulding, K.; Recknagel, J.; Provolo, G.; Barraclough, P. An overview of fertilizer-P recommendations in Europe: Soil testing, calibration and fertilizer recommendations. Soil Use Manag. 2012, 28, 419–435. [Google Scholar] [CrossRef]
  14. Withers, P.J.A.; Sylvester-Bradley, R.; Jones, D.L.; Healey, J.R.; Talboys, P.J. Feed the Crop Not the Soil: Rethinking Phosphorus Management in the Food Chain. Environ. Sci. Technol. 2014, 48, 6523–6530. [Google Scholar] [CrossRef] [Green Version]
  15. Kupiec, J.M. Comparison of the phosphorus balance results based on ‘field surface’ and ‘farm gate’ methodology in large-scale farms. Pol. J. Agron. 2015, 22, 18–24. [Google Scholar]
  16. Gransee, A.; Merbach, W. Phosphorus dynamics in a long-term P fertilization trial on Luvic Phaeozem at Halle. J. Plant Nutr. Soil Sci. 2000, 163, 353–357. [Google Scholar] [CrossRef]
  17. Zicker, T.; von Tucher, S.; Kavka, M.; Eichler-Löbermann, B. Soil test phosphorus as affected by phosphorus budgets in two long-term field experiments in Germany. Field Crop. Res. 2018, 218, 158–170. [Google Scholar] [CrossRef]
  18. Yunju, L.; Kahrl, F.; Jianjun, P.; Roland-Holst, D.; Yufang, S.; Wilkes, A.; Jianchu, X. Fertilizer use patterns in Yunnan Province, China: Implications for agricultural and environmental policy. Agric. Syst. 2012, 110, 78–89. [Google Scholar] [CrossRef]
  19. Linster, M. OECD work on environmental indicators. In Measuring what matters. In Proceedings of the INECE-OECD Workshop on Environmental Compliance and Enforcement Indicators, OECD Headquarters, Paris, France, 3–4 November 2003; pp. 167–174. [Google Scholar]
  20. Yoder, L.; Ward, A.S.; Dalrymple, K.; Spak, S.; Lave, R. An analysis of conservation practice adoption studies in agricultural human-natural systems. J. Environ. Manag. 2019, 236, 490–498. [Google Scholar] [CrossRef] [PubMed]
  21. Gaudino, S.; Goia, I.; Borreani, G.; Tabacco, E.; Sacco, D. Cropping system intensification grading using an agro-environmental indicator set in northern Italy. Ecol. Indic. 2014, 40, 76–89. [Google Scholar] [CrossRef]
  22. Piccoli, I.; Sartori, F.; Polese, R.; Borin, M.; Berti, A. Can Long-Term Experiments Predict Real Field N and P Balance and System Sustainability? Results from Maize, Winter Wheat, and Soybean Trials Using Mineral and Organic Fertilisers. Agronomy 2021, 11, 1472. [Google Scholar] [CrossRef]
  23. Heink, U.; Kowarik, I. What are indicators? On the definition of indicators in ecology and environmental planning. Ecol. Indic. 2010, 10, 584–593. [Google Scholar] [CrossRef]
  24. Taube, F.; Schütte, J.; Kluß, C. Auswirkungen der Berücksichtigung von Gärresten auf den Anfall organischer Dünger in einer novellierten Düngeverordnung-dargestellt am Beispiel Schleswig-Holstein. Ber. Über Landwirtsch. Z. Für Agrarpolit. Landwirtsch. 2013, 219, 21. [Google Scholar] [CrossRef]
  25. Ekardt, F.; Holzapfel, N.; Ulrich, A.E.; Schnug, E.; Haneklaus, S. Legal perspectives on regulating phosphorus fertilization. Landbauforschung 2011, 61, 83–92. [Google Scholar]
  26. Schröder, J.; Smit, A.; Cordell, D.; Rosemarin, A. Improved phosphorus use efficiency in agriculture: A key requirement for its sustainable use. Chemosphere 2011, 84, 822–831. [Google Scholar] [CrossRef]
  27. Klages, S.; Schultheiß, U. Düngeverordnung 2020; Bundesanstalt für Landwirtschaft und Ernährung: Bonn, Germany, 2020; 76p. [Google Scholar]
  28. Wiesler, F.; Appel, T.; Dittert, K.; Ebertseder, T.; Müller, T.; Nätscher, L.; Olfs, H.-W.; Rex, M.; Schweitzer, K.; Steffens, D.; et al. VDLUFA-Standpunkt: Phosphordüngung nach Bodenuntersuchung und Pflanzenbedarf; Verband Deutscher Landwirtschaftlicher Untersuchungs- und Forschungsanstalten: Speyer, Germany, 2018; 11p. [Google Scholar]
  29. DüV. Verordnung über die Anwendung von Düngemitteln, Bodenhilfsstoffen, Kultursubstraten und Pflanzenhilfsmitteln nach den Grundsätzen der guten fachlichen Praxis beim Düngen (Düngeverordnung-DüV). BGBl. I S, 26 May 2017; 1305, Erratum in BGBl. I S., 28 April 2020; p. 846. [Google Scholar]
  30. Wolz, A.; Kopsidis, M.; Reinsberg, K. The Transformation of Agricultural Production Cooperatives in East Germany and Their Future. J. Rural. Coop. 2009, 37, 5–19. [Google Scholar] [CrossRef]
  31. Andert, S.; Bürger, J.; Mutz, J.-E.; Gerowitt, B. Patterns of pre-crop glyphosate use and in-crop selective herbicide intensities in Northern Germany. Eur. J. Agron. 2018, 97, 20–27. [Google Scholar] [CrossRef]
  32. Spellmann, H. Nachhaltiges Landmanagement im Norddeutschen Tiefland; Göttingen University Press: Göttingen, Germany, 2017; ISBN 978-3-86395-342-3. [Google Scholar]
  33. Trimpler, K.; Stockfisch, N.; Märländer, B. Efficiency in sugar beet cultivation related to field history. Eur. J. Agron. 2017, 91, 1–9. [Google Scholar] [CrossRef]
  34. Andert, S.; Bürger, J.; Gerowitt, B. On-farm pesticide use in four Northern German regions as influenced by farm and production conditions. Crop. Prot. 2015, 75, 1–10. [Google Scholar] [CrossRef]
  35. LfL. Basisdaten. 2019. Available online: https://www.lfl.bayern.de/basisdaten (accessed on 11 January 2021).
  36. Nährstoffgehalte in Organischen Düngern. 2021. Available online: https://www.lwk-niedersachsen.de/index.cfm/portal/duengebehoerde/nav/2280/article/32460.html (accessed on 11 January 2021).
  37. de Steel, R.G.; Torrie, J.H. Principles and Procedures of Statistics: A Biometrical Approach; McGraw-Hill: New York, NY, USA, 1986. [Google Scholar]
  38. Kuznetsova, A.; Brockhoff, P.B.; Christensen, R.H.B. lmerTest Package: Tests in Linear Mixed Effects Models. J. Stat. Softw. 2017, 82, 1–26. [Google Scholar] [CrossRef] [Green Version]
  39. Buckley, C.; Wall, D.P.; Moran, B.; Murphy, P.N.C. Developing the EU Farm Accountancy Data Network to derive indicators around the sustainable use of nitrogen and phosphorus at farm level. Nutr. Cycl. Agroecosystems 2015, 102, 319–333. [Google Scholar] [CrossRef] [Green Version]
  40. Leinweber, P.; Bathmann, U.; Buczko, U.; Douhaire, C.; Eichler-Löbermann, B.; Frossard, E.; Ekardt, F.; Jarvie, H.; Krämer, I.; Kabbe, C.; et al. Handling the phosphorus paradox in agriculture and natural ecosystems: Scarcity, necessity, and burden of P. Ambio 2017, 47, 3–19. [Google Scholar] [CrossRef] [PubMed] [Green Version]
  41. Hermann, L.; Hermann, R. Report on regulations governing AD and NRR in EU member states. Syst. Circ. Solut. Biowaste 2018, 15, 124. [Google Scholar]
  42. Amery, F.; Schoumans, O.F. Agricultural phosphorus legislation in Europe; Institute for Agricultural and Fisheries Research: Merelbeke, Belgium, 2014; ISBN 9789040303531. [Google Scholar]
  43. Luschei, E.C.; Hammond, C.M.; Boerboom, C.M.; Nowak, P.J. Convenience Sample of On-Farm Research Cooperators Representative of Wisconsin Farmers. Weed Technol. 2009, 23, 300–307. [Google Scholar] [CrossRef]
  44. Andert, S.; Mutz, J.-E.; Wiese, A.; de Mol, F.; Steinmann, H.-H.; Gerowitt, B. Farmers’ statements are reliable—Comparing two different data sources about glyphosate use in Germany. Crop. Prot. 2019, 124, 104876. [Google Scholar] [CrossRef]
  45. Hart, M.R.; Quin, B.F.; Nguyen, M.L. Phosphorus Runoff from Agricultural Land and Direct Fertilizer Effects: A Review. J. Environ. Qual. 2004, 33, 1954–1972. [Google Scholar] [CrossRef]
  46. Jiménez, J.G.; Daly, K.; Roberts, W.; Healy, M. Split phosphorus fertiliser applications as a strategy to reduce incidental phosphorus losses in surface runoff. J. Environ. Manag. 2019, 242, 114–120. [Google Scholar] [CrossRef] [PubMed]
  47. Buczko, U.; Van Laak, M.; Eichler-Löbermann, B.; Gans, W.; Merbach, I.; Panten, K.; Peiter, E.; Reitz, T.; Spiegel, H.; Von Tucher, S. Re-evaluation of the yield response to phosphorus fertilization based on meta-analyses of long-term field experiments. Ambio 2017, 47, 50–61. [Google Scholar] [CrossRef] [PubMed] [Green Version]
  48. Rutkowska, A.; Skowron, P. Productive and Environmental Consequences of Sixteen Years of Unbalanced Fertilization with Nitrogen and Phosphorus—Trials in Poland with Oilseed Rape, Wheat, Maize and Barley. Agronomy 2020, 10, 1747. [Google Scholar] [CrossRef]
  49. Buczko, U.; Steinfurth, K.; Van Laak, M. Meta-analysis of the yield response to phosphorus fertilization based on long-term field experiments. J. Agric. For. 2019, 65, 7–14. [Google Scholar] [CrossRef]
  50. Kuhn, T. The Revision of the German Fertiliser Ordinance in 2017, Discussion Paper; Institute for Food and Resource Economics, University Bonn: Bonn, Germany, 2017; 26p, Available online: http://www.ilr.uni-bonn.de/agpo/publ/dispap/download/dispap17_02.pdf (accessed on 20 October 2021).
  51. Szogi, A.A.; Takata, V.H.; Shumaker, P.D. Chemical Extraction of Phosphorus from Dairy Manure and Utilization of Recovered Manure Solids. Agronomy 2020, 10, 1725. [Google Scholar] [CrossRef]
  52. Ginbo, T.; Di Corato, L.; Hoffmann, R. Investing in climate change adaptation and mitigation: A methodological review of real-options studies. Ambio 2020, 50, 229–241. [Google Scholar] [CrossRef] [PubMed]
  53. Landwirtschaftskammer Niedersachsen, Empfehlungen Grunddüngung. 2020. Available online: https://www.google.com/url?sa=t&rct=j&q=&esrc=s&source=web&cd=&cad=rja&uact=8&ved=2ahUKEwj-gpvFydvzAhW8SvEDHbTwC60QFnoECAgQAQ&url=https%3A%2F%2Fwww.lwk-niedersachsen.de%2Fdownload.cfm%2Ffile%2F22858.html&usg=AOvVaw2gZcs7RiWeB7naGeNL2PQ- (accessed on 20 October 2021).
  54. Saiz-Rubio, V.; Rovira-Más, F. From Smart Farming towards Agriculture 5.0: A Review on Crop Data Management. Agronomy 2020, 10, 207. [Google Scholar] [CrossRef] [Green Version]
  55. Börner, J.; Baylis, K.; Corbera, E.; Ezzine-De-Blas, D.; Honey-Rosés, J.; Persson, U.M.; Wunder, S. The Effectiveness of Payments for Environmental Services. World Dev. 2017, 96, 359–374. [Google Scholar] [CrossRef]
Figure 1. Locations of the five regions of Diepholz, Uelzen, Rostock, Fläming and Oder-Spree in northern Germany.
Agronomy 11 02123 g001
Figure 2. Structure and terminology of P use data analysed in this study.
Agronomy 11 02123 g002
Figure 3. (A) Indicator frequency of P used on the whole area: (A1) P total, (A2) organic and (A3) mineral P used. (B) Indicator amount of P used on the treated area only. N < 90 indicates that in some years some farms did not use P. All values are given per region (Diepholz, Uelzen, Rostock, Fläming and Oder-Spree) for the study period 2010–2018. The red square shows the mean. Different letters display a statistically significant difference between the regions (Kruskal–Wallis p < 0.05). Numbers are given in Appendix A (Table A1).
Agronomy 11 02123 g003
Figure 4. Indicator frequency of P fertiliser used on the whole area displayed for untreated, mineral only, organic and mineral, and organic only treatment per region (Diepholz, Uelzen, Rostock, Fläming and Oder-Spree). Each farm contributes one value per year per treatment group to the total of the region (see Section 2.4). Numbers are given in Appendix B (Table A2).
Agronomy 11 02123 g004
Figure 5. Amount of P used only on treated fields from 2010 until 2018 in the regions of Diepholz, Uelzen, Rostock, Fläming and Oder-Spree. (A) The P total, (B) P organic and (C) P mineral. Each farm contributes one value every year. N is displayed if <10 and means that some farms did not apply P in some years. The red square marks the mean value. Numbers are given in Appendix C (Table A3).
Agronomy 11 02123 g005
Table 1. Characteristics of the study regions of Diepholz, Uelzen, Rostock, Fläming and Oder-Spree. Average soil and climate parameters (1981–2010). The soil index (‘Ackerzahl’ in German) takes into account the soil quality and other site conditions relevant for cropping. Values range from for example 18 (very poor arable site) to 120 (highest value).
AttributesDiepholzUelzenRostockFlämingOder-Spree
Size of region (km2)19881454342121632243
Total number of farms2419823827227323
Average farm size (ha)22814485720691879
Average field size (ha)341298
Mean soil index (0–120)4531423436
Farms with livestock (%)5326513928
Annual total precipitation (mm)699733618554571
Annual mean temperature (°C)9.89.29.29.89.6
Maximum yield winter wheat (t ha−1)8.28.18.56.55.0
Adapted from Refs. [31,32,33].
Table 2. The main organic and mineral phosphorus (P) fertilisers used. n = number of applications in the full study sample. Range of dry matter content (%) and total-P content (kg) in the fertiliser groups. The fermentation residues are the products of anaerobic digestion.
Fertiliser GroupUnitnRange of Dry Matter Content (%)Range of Total-P
Content (kg) per Unit
Fermentation residue solidkg30416.3–82.00.0011–0.0056
Fermentation residue liquidm334561.7–13.00.1431–1.3092
Slurry-pigm318591.0–16.00.2444–1.7456
Slurry-cattlem334321.7–13.00.1484–1.2132
Manure-poultrykg108525.9–63.30.0025–0.0131
Manure-other animalskg168416.3–54.60.0004–0.0042
Sewage sludgekg17721.0–35.30.0010–0.0076
Compostkg14822.2–69.00.0010–0.0050
Mineral fertilisers solidkg7813 0.0009–0.2269
Mineral fertilisers liquidl3197 0.0206–0.2618
Table 3. Explained variance (%) of the explanatory variables (farm, year and region) for the frequency at which P is used. The nested factor given in brackets means the farms are nested in the region. Analysis performed with a balanced study sample (n = 450). Totals above 100 are due to rounding errors. Significance Chi2 test: ** p < 0.01 and *** p < 0.001.
Explained Variance (%)
YearRegionFarm (Region)Residual
P total0.0 26.4**54.1***19.6
P organic0.0 39.7***51.0***9.3
P mineral0.0 36.5***41.5***21.9
Table 4. Explained variance (%) of the explanatory variables (field, farm, year, crop and region) for the P amount used. Totals above 100 are due to rounding errors. n: fields considered for analysis. Significance codes: ** p < 0.01 and *** p < 0.001.
Explained Variance (%)
nField
(Farm, Region)
Field
(Crop, Farm)
Crop
(Region)
CropFarm
(Region)
RegionYearResidual
P total13,6670.0 7.3***13.8***27.0***8.8***2.5 0.3***40.4
P organic94070.0 4.5***14.8***4.4 31.7***0.0 0.6***44.1
P mineral77090.0 2.1***6.9***54.0***7.6***8.4**0.1***20.9
Publisher’s Note: MDPI stays neutral with regard to jurisdictional claims in published maps and institutional affiliations.

