Article

Impact of Methanol and Glycine Betaine on Yield and Quality of Fodder Beet Genotypes (Beta vulgaris subsp. vulgaris)

1
Department of Agronomy, College of Agriculture, Shahr-e-Qods Branch, Islamic Azad University, Tehran 37515374, Iran
2
Department of Agronomy, College of Agriculture, Karaj Branch, Islamic Azad University, Karaj 34418156, Iran
3
Sugar Beet Seed Institute (SBSI), Karaj 34418156, Iran
*
Author to whom correspondence should be addressed.
Agronomy 2021, 11(11), 2122; https://doi.org/10.3390/agronomy11112122
Submission received: 22 August 2021 / Revised: 25 September 2021 / Accepted: 28 September 2021 / Published: 22 October 2021

Abstract

:
Two field experiments were carried out during 2018–2019 at the Hamedan and Qom sites, which are different ecological locations of Iran. Hamedan was selected as a temperate climate and Qom as semi-arid to study some of the morphological and physiological traits of fodder beet in various climatic conditions. The experimental map was designed as a split–split-plot in the form of a randomized complete block with three replications. The main plots were assigned three levels of methanol (i.e., control, 15, and 30% by volume). The sub-plots were restricted to two glycine betaine (GB) concentrations (i.e., control and four grams per liter of methanol consumed, and the sub-sub-plots consisted of six different genotypes of fodder beet). The results showed that root length, root and foliage yield/ha, as well as sugar content increased with the incremental level of methanol and/or GB concentration. Foliar application of methanol and GB also significantly changed the qualitative parameters including sodium content, catalase value, crude protein percentage, and dry matter digestibility. It should be noted that two sites differed in most of the investigated traits, so that Hamedan treatment had a more active role on fodder beet growth, yield, and quality compared with Qom. Meanwhile, there was a significant difference between fodder beet genotypes. Generally, spraying fodder beet with 15%by volume methanol or GB with concentration of four grams per liter of methanol is the recommended treatment for raising forage yield under the ecological circumstances of this research.

1. Introduction

Today, the world is full of tensions and the scope of these challenges has spread to plant life. Plant reaction in adverse environments such as heat, drought, cold, toxic metals, and nutrient deficiency are important [1,2]. Most parts of the world are exposed to drought, and water scarcity is the most important problem, leading to reduced crop yields. Every year, a large amount of forage and animal feed is applied to the country, which requires the payment of significant foreign currency. The world price of animal feed is growing and the massive volume of imports will weaken the country’s agricultural economy. Additionally, the limitation of suitable water and soil resources for fodder crop cultivation has caused the study of new methods to provide forage plants needed by the country. Decreased rainfall and low water resources have led traditional agricultural systems to apply modern farming programs. Therefore, cultivating a high-yield plant adapted to various climatic conditions is now widespread. Fodder beet is an example of crops that have the necessary characteristics for expansion in different climates [3]. Features such as good crop production, easy planting, good food for livestock, and resistance to environmental drought [4] as well as good economic performance. In the current critical condition, it can be an acceptable option in the crop rotation of different regions [5]. Resistance to environmental stresses such as drought tolerance is one of the positive points for sugar beet, which is determined by many genes stored in the genomes of wild relatives [4]. It is worthwhile selecting suitable forage beet cultivars based on forage quality, morphological traits, environmental conditions, diseases and pests of the region, planting season, and purpose of forage use [6].
Plant yield will be completely dependent on the process of photosynthesis and production of organic matter, but abiotic stresses such as drought stress could expressively reduce plant development, photosynthetic pigments, and photosynthetic quantum yield. Nevertheless, better results may be observe in some of the genotypes [7]. Recently, foliar spraying of elements and unique compounds with investigated concentrations can be considered as an effective way for plant growth and development and increase their tolerance to abiotic stresses by regulating biosynthesis genes [8]. Additionally, fungi and growth stimulants are completely useful, not only as natural bio fertilizers on biomass, yield, and seed nutritive quality of crops, but also because of their role on drought stress inhibition [9]. An integral part of the growth process is carbon dioxide, which ultimately provides the basis for the growth, expansion, and production of plant products by fixing carbon. One way to enhance the concentration of carbon dioxide and even reduce the destructive effects of drought stress on plants is to use alcoholic compounds such as methanol. To achieve a better result, amino acids such as glycine betaine are also necessary and important. Generally, methanol is one of the simplest compounds produced by plants [10]. Methanol causes CO2 production of leaves and accelerates photosynthetic activity and can therefore be used as a carbon source [11]. Methanol also participates in the control of plant growth by affecting the intercellular transport of macromolecules [12] and particularly raises the carbon stabilization process in C3 plants. Methanol can not only be oxidized to formaldehyde and CO2, but also synthesized as serine and methionine amino acids and carbohydrates in various C3 plant tissues. Methanol-treated plants can increase net photosynthesis and ultimately improve their total yield [13]. Some parts of the CO2 would be removed from the photosynthesis process and carbon fixation cycle when plants are forced to increase their light respiration, so the yield and crop production would decline. Methanol, as a rich source of carbon, will compensate for some of the carbon losses by incrementing the concentration of CO2 and better photosynthetic efficiency. Another function of methanol is accelerating the production of sugar and amino acids in plants accompanied by CO2. With increasing CO2, the total dry matter and sucrose content would increase [14]. Other researchers have reported increased root yield and sugar yield after methanol foliar application [15]. Methanol is made by pectin demethylation in the cell wall [13,16,17]. Methanol, especially in stress conditions and high light respiration, can compensate some of the carbon losses that are stabilized by photosynthesis and will lead to increased net photosynthesis and dry matter production in C3 crops [18]. Under improper environmental conditions, free radicals are produced. Free oxygen radicals react with most of the cell compounds and may damage membrane and other macro molecules such as photosynthetic pigments, proteins, nucleic acids, and lipids [19]. Therefore, its amount should be controlled in the cell. An antioxidant system of plants contains either enzymatic complexes such as superoxide dismutase, catalase, glutathione peroxidase, ascorbate peroxidase, and glutathione reductase, or non-enzymatic compounds such as ascorbate acid, glutathione, carotenoids, and tocopherols. Usually, the values of free radicles keep the cells’ oxygen in a balanced level [20]. Today, some researchers [21,22] believe that enhancement of the anti-oxidant content can increase the plants’ tolerance against environmental stresses [23]. Studies have shown that [24] oxidant responses depend on the sensitivity and resistance of varieties. As hydrogen peroxide has an oxidative effect on plants, it is harmful and may be removed by the activity of the catalase enzyme. These enzymes preserve cells against hydrogen peroxide effects and have an important role in the enhancement of resistance to oxidative stresses under natural conditions [25]. An antioxidant system includes multi enzymes such as super oxide dismutase, catalase, and guaiacol peroxidase. The produced super oxide radicals are transformed to hydrogen peroxide by the function of super oxide dismutase and the activities of ascorbate peroxidase, catalase, guaiacol peroxidase, and glutathione peroxide prevent the accumulation of hydrogen peroxide. Therefore, the balance between the production of free radicals and their elimination guarantees system survival [26]. These enzymes contribute to some required biological processes for growth, development and preservation [27], and to preserve living creatures against oxide damages [28]. Catalase is one of the most important enzymes that plays an essential role in cell peroxide analysis under environmental stresses. The catalase enzyme exists in cell organs such as mitochondria, peroxisome, and glyoxysome [29]. Enhancement of the chlorophyll amount can be attributed to methanol oxidation in bushes that have a lack of water because bushes encounter oxidative stress under water lacking conditions. In these circumstances, methanol is oxidized easily by the enzyme catalase, accompanied with the leaf extract [30]. Methanol accelerates the production of sugar and amino acids so that the consumption of methanol on the aerial parts of cotton increases dry matter production, net photosynthesis of leaf, grain yield, and decreases leaf temperature. Additionally, methanol reduces the water requirement of cotton and improves water use efficiency [31]. Better growth rate after methanol foliar application is due to more CO2 concentration in the leaves. Methanol is known as a direct source for serine amino acid synthesis [12] and could reduce the amount of carbon losses through the light respiration cycle.
Symbiotic bacteria called methylotrophic bacteria live on the leaves of most plants [32]. These bacteria increase the growth of different parts of plants by making the hormones cytokinin and auxin. Methanol foliar application increases the population of these bacteria. Some studies have shown that the aging process of oat (Avena sativa) and clove gillyflower (Dianthus caryophillus) leaves is delayed by alcohol [33], which is probably due to the prevention of ethylene action in the leaf tissues of these plants.
(ACC) 1-Amino cyclopropane 1-carboxylic acid is considered as a stimulus factor of ethylene production [34], but methanol prevents the production of ethylene by interfering with the formation of this substance. When the aging process of the leaves is delayed, the leaf surfaces become more durable, so the result is an increase in photosynthesis and carbon fixation and ultimately better plant yield [35,36]. Studies on tomato, bean, canola, and sugar beet showed that plants sprayed with 30% methanol produced 12 to 13% more than the control. Additionally, in plants such as cotton, peanuts, and soybeans, methanol foliar application increased yield [37], but in potatoes, autumn wheat, and corn, methanol did not had much effect on yield [38]. Methanol foliar application increased root yield and sugar percentage in sugar beet [39] and this operation also had a positive effect on grain protein and shoot yield in mung bean. Based on research [40], foliar application had a significant effect on chlorophyll content, relative water content, and soybean yield [41]. Different levels of methanol have increased the yield compared to the control. Exceptionally, the highest level of methanol (35% by volume) showed a decreased trend due to toxicity because of high amounts of methanol. When C3 plants are not exposed to light after consuming methanol, they show signs of poisoning. The best way is to use glycine [35].
In addition to the osmotic protection role, glycine not only has an effective role in stress resistance, but this substance is also involved in other physiological effects affecting the response to plant stress [42]. Quaternary ammonium compounds such as glycine betaine (GB) are among the osmotic protectors that accumulate in plant cells during drought stress. Glycine accumulated in chloroplasts plays a special role in both the protection of the thylakoid membrane and the photosynthetic efficiency maintenance.
GB stabilizes cellular structures and functional proteins and so can protect the integrity of cell membranes against stress [43]. Additionally, the cells’ osmotic regulation, preservation of organelles (mitochondria, chloroplasts), and increasing water use efficiency in plants under water deficit are all important roles of glycine [44]. GB is absorbed by plant tissues immediately upon receipt and is easily transported to the roots, meristems, and total expanding leaves [45]. Because it is metabolically inactive, it therefore remains in plant tissue for several weeks [42]. GB is easily absorbed by leaf and root tissues [43] when used as a foliar spray. Then, it is transported to the active and growing parts of the plant by xylem and phloem [46]. The use of GB increases the plants’ tolerance to abiotic stresses [47]. In addition, the accumulation of GB improved the yield potentials in non-stress conditions.
Generally, growth and expansion of shoots and roots as well as better plant yield, all indicate improved photosynthesis by methanol and glycine foliar application. This experiment was performed to investigate the effect of foliar methanol and glycine application on yield and other characteristics of various fodder beet genotypes in different ecological conditions.

2. Materials and Methods

2.1. Plant Materials

Generally, there are different types of Beta vulgaris that are used to provide forage, sugar extraction, or in the food industry [48]. Sugar beet, fodder beet, table beet, mangel wurzel, and Swiss chard are considered to be the Beta vulgaris complex [3]. Six different genotypes of fodder beet including (Brunium, Kyros, Jamon) and three new genotypes (SBSI050, SBSI051, SBSI052) were used in this research to study the reaction of these genotypes in different climatic coordinates.

2.2. Experimental Design

In order to evaluate the effects of methanol and glycine on fodder beet quality and yield, dual experiments were conducted during 2018–2019 growth season. The experimental map was considered as a factorial split plot in the form of a randomized complete block design with three replications at these sites. In this monitoring, the first factor was methanol with three levels of foliar application (control, 15, and 30% by volume of methanol), the second factor was GB with two levels (control and four grams per liter of methanol consumed), and the third factor was six fodder beet genotypes (SBSI050, SBSI051, SBSI052, Brunium, Jamon, and Kyros). Methanol and glycine factors were located in the main plots and genotypes in sub-plots. Respectively, the distances between the main and sub-plots were 150 and 50 cm.

2.3. Plant Culture

Research was started in different climatic conditions of Iran such as the Hamedan and Qom ecological locations. Hamedan (34°79 N, 48°51 E, 1850 M) is located in a temperate climate in the west with average rainfall totals in a range of 280–310 mm in the growing season and Qom (34°64 N, 50°87 E, 928 M) is located in a semi-arid climate in the central part with almost 80–100 mm rain. Primary ground operations including plowing and disking are performed in the fall and secondary operations in the spring. Additionally, soil samples of each region at a depth of 0–30 and 30–60 cm were mixed separately and the composite samples were sent to the laboratory for testing. Based on soil tests in each area, the amount of fertilizer used was determined (Table 1).
Seeds were planted in early May after a fall period. The planting density was approximately 10 Pl/m with rows 60 cm apart. Plots in each replication were 7.5 m in width and 5 m in length. The experimental field received 150 kg P2O5/h, two thirds of which was applied during deep plough in autumn, while the rest was applied in spring prior to disk harrowing. Nitrogen fertilizer at a rate of 150 kg N/h was applied in the form of urea, the first half of which was during harrowing in spring and the remaining half before hoeing when the plants reached the six leaf stage. The sugar beet was established with a furrow irrigation system. Weeds were controlled by hand weeding when necessary. Plant spacing on the planting lines was 20 cm with a density of 100,000 plants per hectare. Methanol and GB solutions were sprayed on foliage parts of sugar beet three times with two week intervals. The first foliar application was applied about 90 days after planting (10–12 leaf stage). About 25 °C on average, these treatments were applied on 17 July, 1 August, and 15 August between 16:00 pm and 20:00 pm during a moderate evening temperature of bright sunny days. Through methanol spraying, all shoot parts of the plant were covered. Foliar spraying continued until the solution dropped flowed from the leaves. A back engine sprayer with a capacity of 12 L was used for the spray and the sprinkler was held 40 cm above the plants. Plants were harvested in both locations on 6 November.

2.4. Sample Collection and Analysis

Quantitative and qualitative traits evaluated in this study included root yield, shoot dry matter yield, total yield, root length, percentage of crude protein, catalase, and sodium content and root dry matter digestibility. After the plants were harvested by pulling the beet manually, ten plants from each plot were randomly selected and their total forage weighted. Furthermore, ten bushes were randomly measured with a ruler to record root length. Then, all of the selected beets were topped by cutting the crown at the base of the leaves. In the next step, roots and shoots were weighted and measured. All samples were generalized to the whole field and converted to estimate the root and foliage yields in t/ha. To calculate the dry matter yield of the root, the root paste was placed in the oven for 72 h. The two-step pepsin-cellulase method was used to determine the digestibility of root dry matter [49]. For qualitative analysis, each paste sample was placed in −20 °C and after thawing, 26 g of paste from each sample with 177 cc of So Stat was mixed for three minutes. After transferring the mixture to a funnel, a limpid syrup was obtained. In the obtained syrup, sugar content was measured by the polarimetry method by a sacchary meter device and sodium, potassium, and nitrogen were measured by a betalizer device. In fact, Na+ amounts were measured by the flame photometer method and by comparing the lithium-wide emission spectrum [50]. To measure the activity of the catalase enzyme, the Paglia and Valentine method [51], along with the method of Lowry and Rosebrough were used [52].
The measurements performed in the experiments were as follows:
  • Root yield; Total yield (t/ha)
  • Root DM yield; Shoot DM yield; Total DM yield (t/ha)
  • Root length (cm)
  • Root DM digestibility; Root crude protein (%)
  • Sodium (Na+) content in roots (mg/100 g sugar)
  • Catalase (CAT) content (u/mg pr)

2.5. Statistical Methods

Data were checked before statistical analysis. The results of root and shoot, sugar purity percentage, element and enzyme values were subjected to analysis of variance (ANOVA). The SAS 9.4 software package (SAS Institute Inc, 100 SAS Campus Drive Cary, NC, USA) was used to analyze all of the data. Finally, Duncan’s multiple range method was used to compare the means at the 5% probability level.

3. Results and Discussion
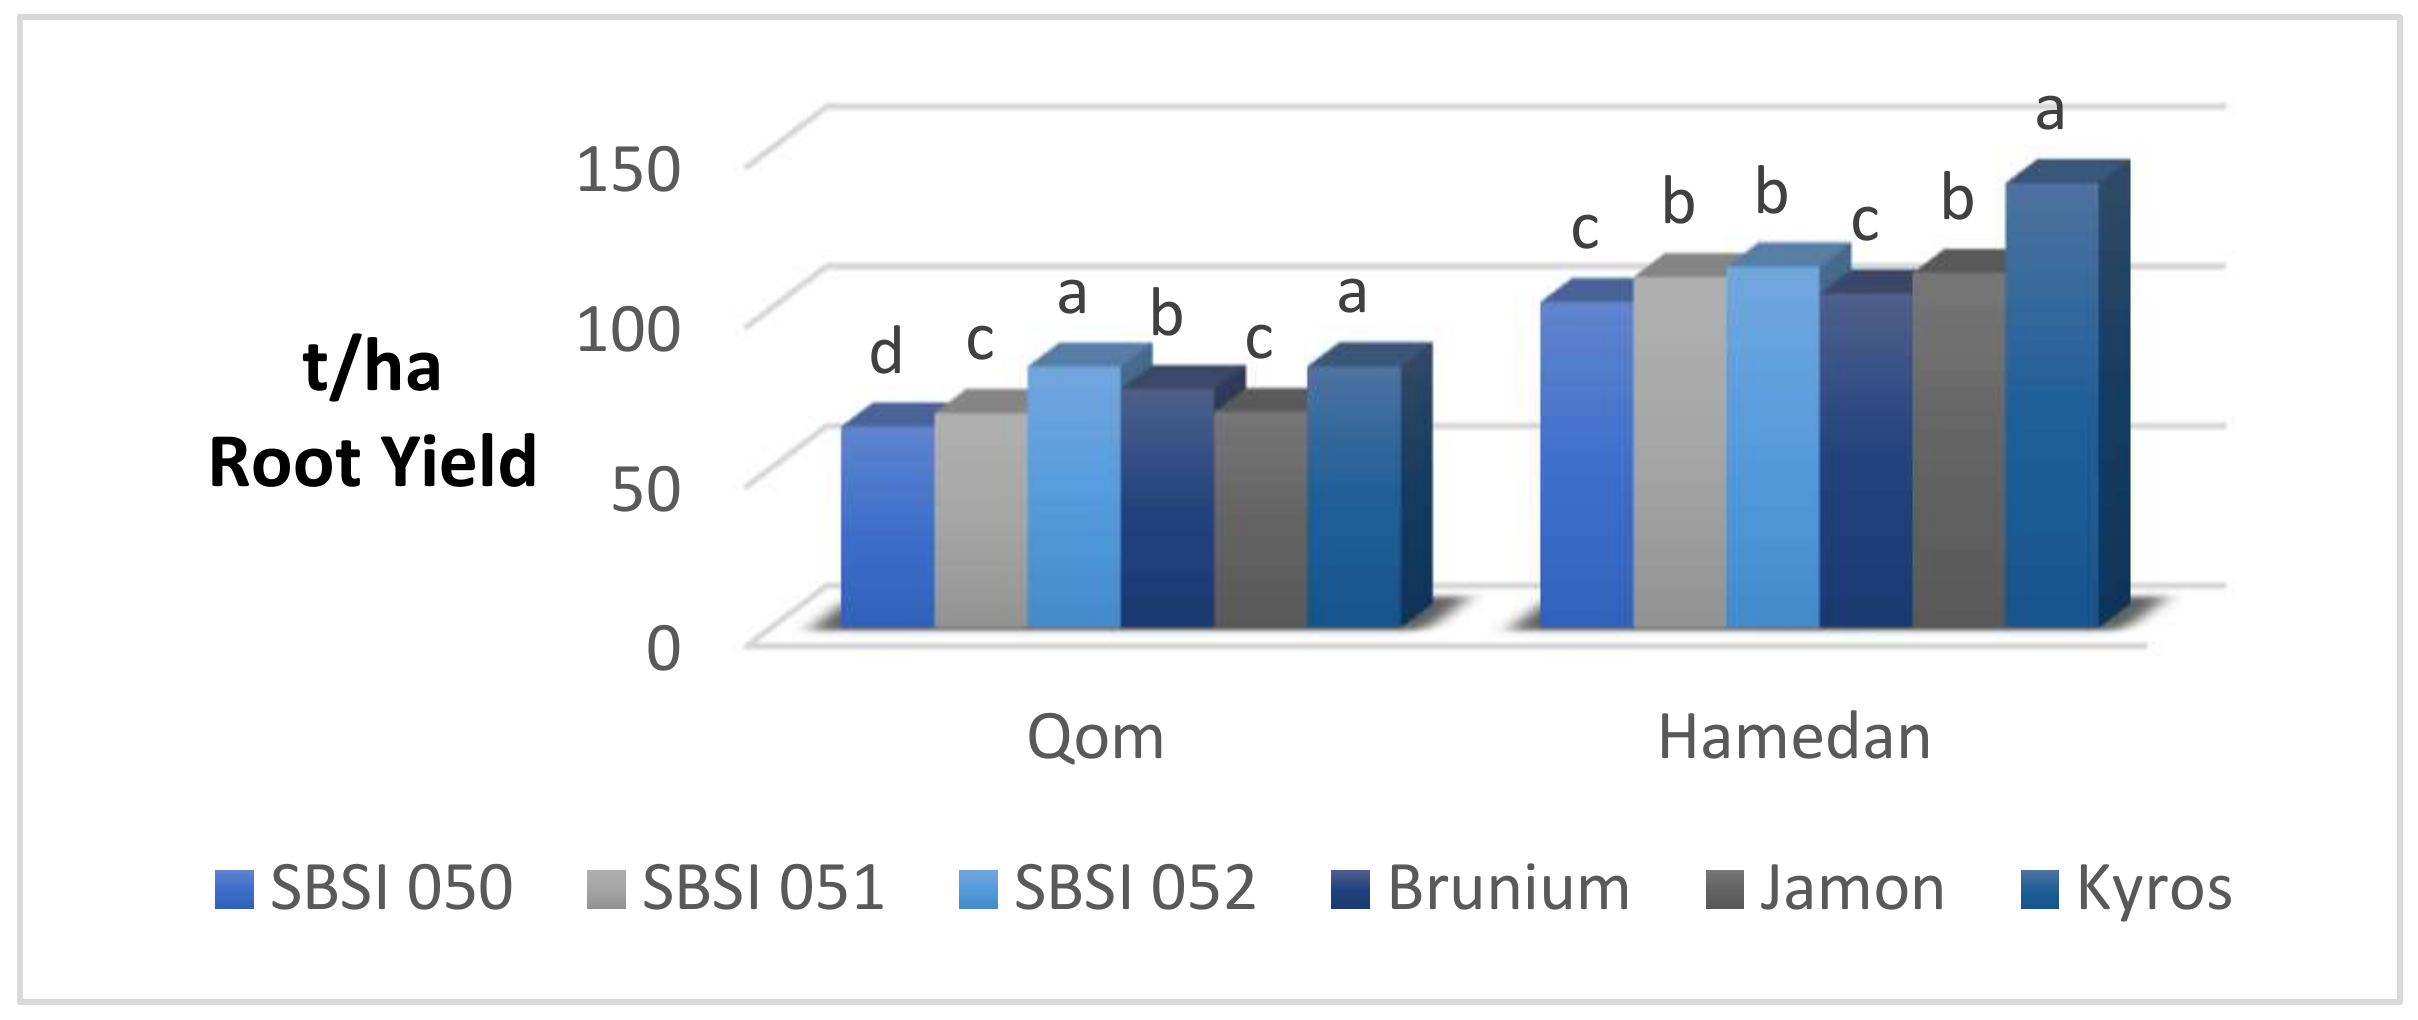
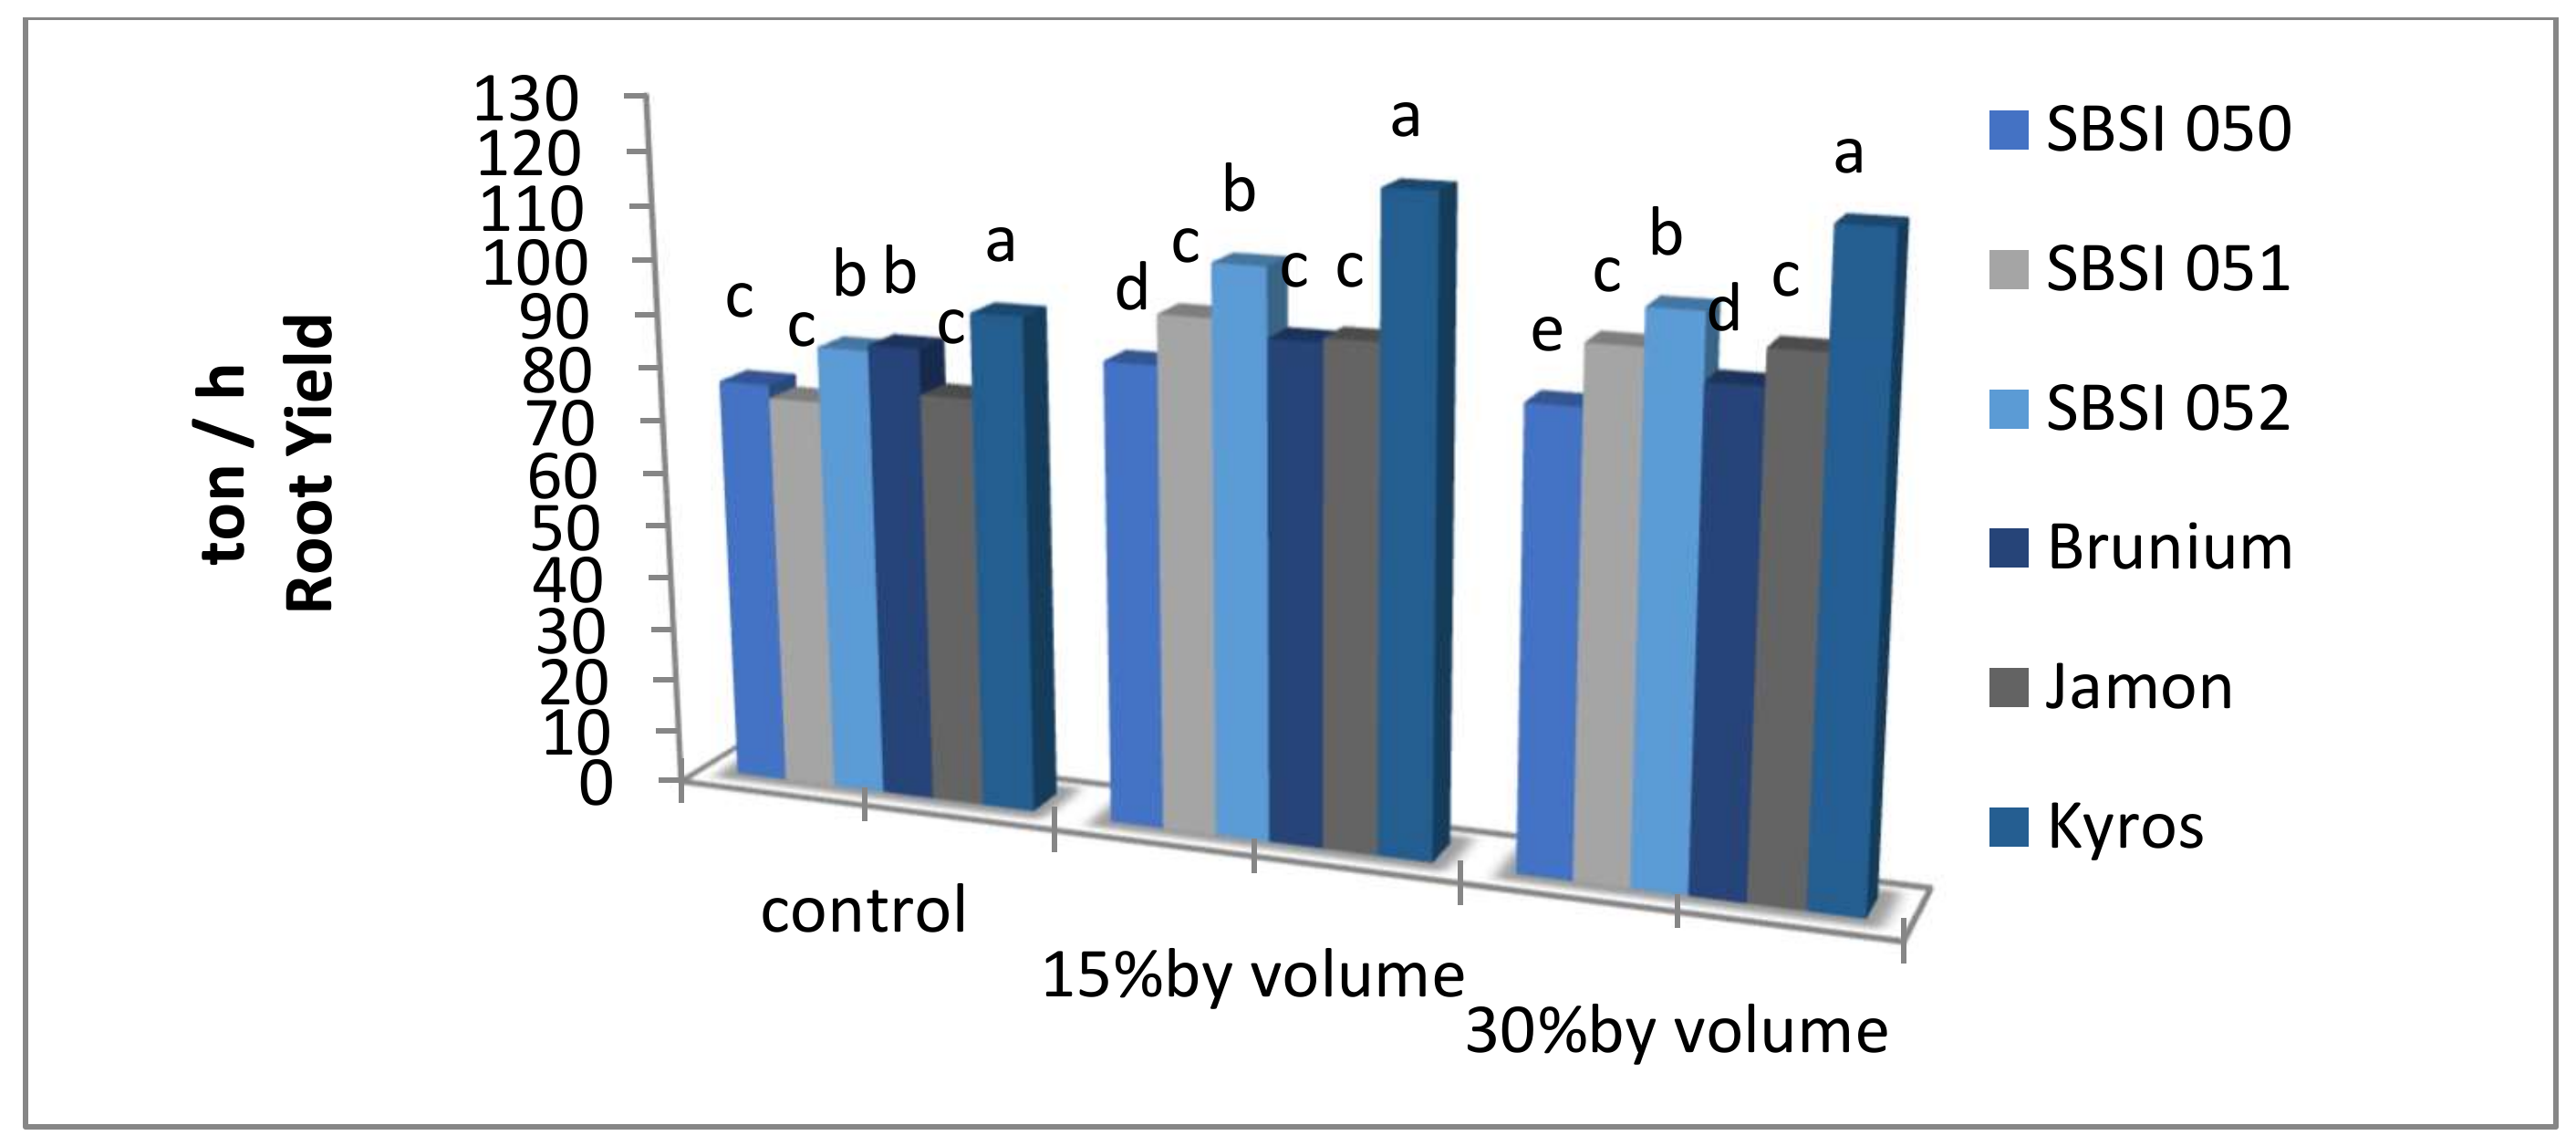
3.1. Root Yield

The results listed in Table 2 and Table 3 show that both locations had different root yields. Root yield in the Hamadan region of 113.30 t/ha was more than Qom with an average of 72.71 t/ha. Based on the results of the analysis of variance of the data, the effect of methanol spraying on root yield (p < 0.01) was significantly different.
Increasing the concentration of methanol from 0 to 15 and 30% (v/v), raised the root yield/ha with a record of 98.76 and 98.41 t/h compared with the control, respectively. Additionally, the data collected in Table 2 and Table 3 revealed that glycine application enhanced the rate of root yield so that four grams of glycine per liter of methanol consumption exhibited 99.62 t/ha compared to the control of 86.40 t/ha, and the difference between GB levels was significant. There was a significant difference between the different fodder beet genotypes in this experiment, so Kyros with 110.54 t/ha had the highest value of root yield and the best performance (Table 2 and Table 3). The interaction between location and genotype on root yield was significant. Kyros and SBSI052 in Qom showed higher root yield, but in Hamedan, the highest values of the above-mentioned trait was reported by Kyros (Figure 1). Additionally, according to the analysis of variance of the data, the interaction of methanol and genotype on root yield was significant and again, Kyros exhibited the best root performance. In contrast, SBSI050, SBSI051, and Jamon had lower root yield presentation and were statistically located in the equivalent group. This was clear in both concentrations of methanol, where the lowest root yield was dedicated to the SBSI050 genotype (Figure 2). As a matter of fact, methanol increase in the plant tissues regulated the metabolic rate of their activities and played an effective role on the metabolic pathways and carbon conversion efficiency [35,53,54]. Carbon content enhancing led to better photosynthesis process, more CO2 assimilation, optimum DM product, and biomass increase. Meanwhile, it was difficult to interpret the results of the effect of methanol on the growth and yield of crops because the plant reactions to methanol levels depended on multiple experimental variables such as foliar application time, methanol absorbed value, plant morphology, and methanol accumulation in the plant tissues [55].
Therefore, in a nutshell it can be noted that plant growth rate raised after methanol foliar application was due to dual factors such as the CO2 increase in leaves as a direct source for the serine amino acid synthesis, and the replacement of carbon lost in light respiration processes [16,18]. Thus, plants treated with methanol can increase their pure photosynthesis and improve their yield [13].

3.2. Root Dry Matter Yield

The results of the analysis of variance (Table 2) revealed that the simple effects of experimental locations, methanol, glycine, and genotypes as well as the interaction of methanol in the genotype on root dry matter yield were significant (p < 0.01). Regarding the mean comparison of treatments, Hamedan recorded the best root DM yield (19.86 t/ha) compared to Qom (13.07 t/ha). Methanol spraying of 15 and 30% (v/v) concentrations produced 17.45 and 17.34 t/ha root DM yield, respectively, and surpassed the non-methanol c treatment with 14.60 t/ha. GB foliar application (Table 3) exhibited better performance on root dry matter yield (17.51 t/ha) than the control (15.42 t/ha). There were significant differences between genotypes (p < 0.01). Mean comparison of treatments showed that Kyros and SBSI052 exceeded other treatments with 18.47 and 17.80 t/ha, respectively, and statistically stood in a similar group. Jamon with 13.80 t/ha was in the lowest level (Table 3). The excess in methanol amount resulted in an increase in root DM yield. As shown in Figure 3, the interaction between methanol and genotype on root DM performance was significantly different (p < 0.01). In the control level without methanol, the SBSI050, SBSI052, Brunium, and Kyros genotypes were statistically collected in the common group and had better presentations. Regarding this trait, as the concentrations of methanol increased to 15% and 30% (v/v), the Kyros cultivar exceeded other treatments with the best root DM yield ranking (Figure 3). The biosynthesis of sucrose in leaves is mediated by a particular enzyme called fructose-1,6-bisphosphatase (FBPase). Methanol, through its hydrophobicity, bonds to this enzyme with other proteins attached to the thylakoid membrane and produces a stronger enzyme with great ability to lead to a carbon fixation cycle with more intensity. The result is the maximum carbon stabilization, optimum growth, and higher dry matter yield [56]. After several foliars have been applied, this property is strengthened and the yield of the plant becomes more desirable [57]. Methanol, after entering the plant, first converts to formaldehyde and finally to CO2, which affected the assimilation of carbon. Increasing the content of CO2 also increased the crop growth rate (CGR), raised yield and accumulated carbohydrates, and totally guaranteed plant growth and development [55]. Methanol also participated in the control of plant growth by affecting the intercellular transport of macromolecules [12] and especially raised the carbon stabilization process in C3 plants. In addition, methanol accelerated the production of sugar and amino acids accompanied by CO2. This process increased photosynthesis and increased dry matter production [31]. Glycine accumulated in chloroplasts plays a special role in both the protection of the thylakoid membrane and the photosynthetic efficiency maintenance. GB stabilized the cellular structures and functional proteins and protected the integrity of cell membranes against stress, especially in Qom [43]. Data showed the effectiveness of methanol and glycine, even in the unfavorable area of Qom. Obviously, genotypes had different behaviors due to their specific genes, but their condition improved after foliar application [8]. There was a significant difference between various concentrations of methanol and their effects on some of the studied characteristics of sugar beet genotypes such as root/shoot yield [39].
However, methanol foliar spraying importance was due to its role as a light-respiration inhibitor, which enhanced growth and yield components. Root DM yield had a significant difference between fodder beet genotypes [58].

3.3. Shoot Dry Matter Yield
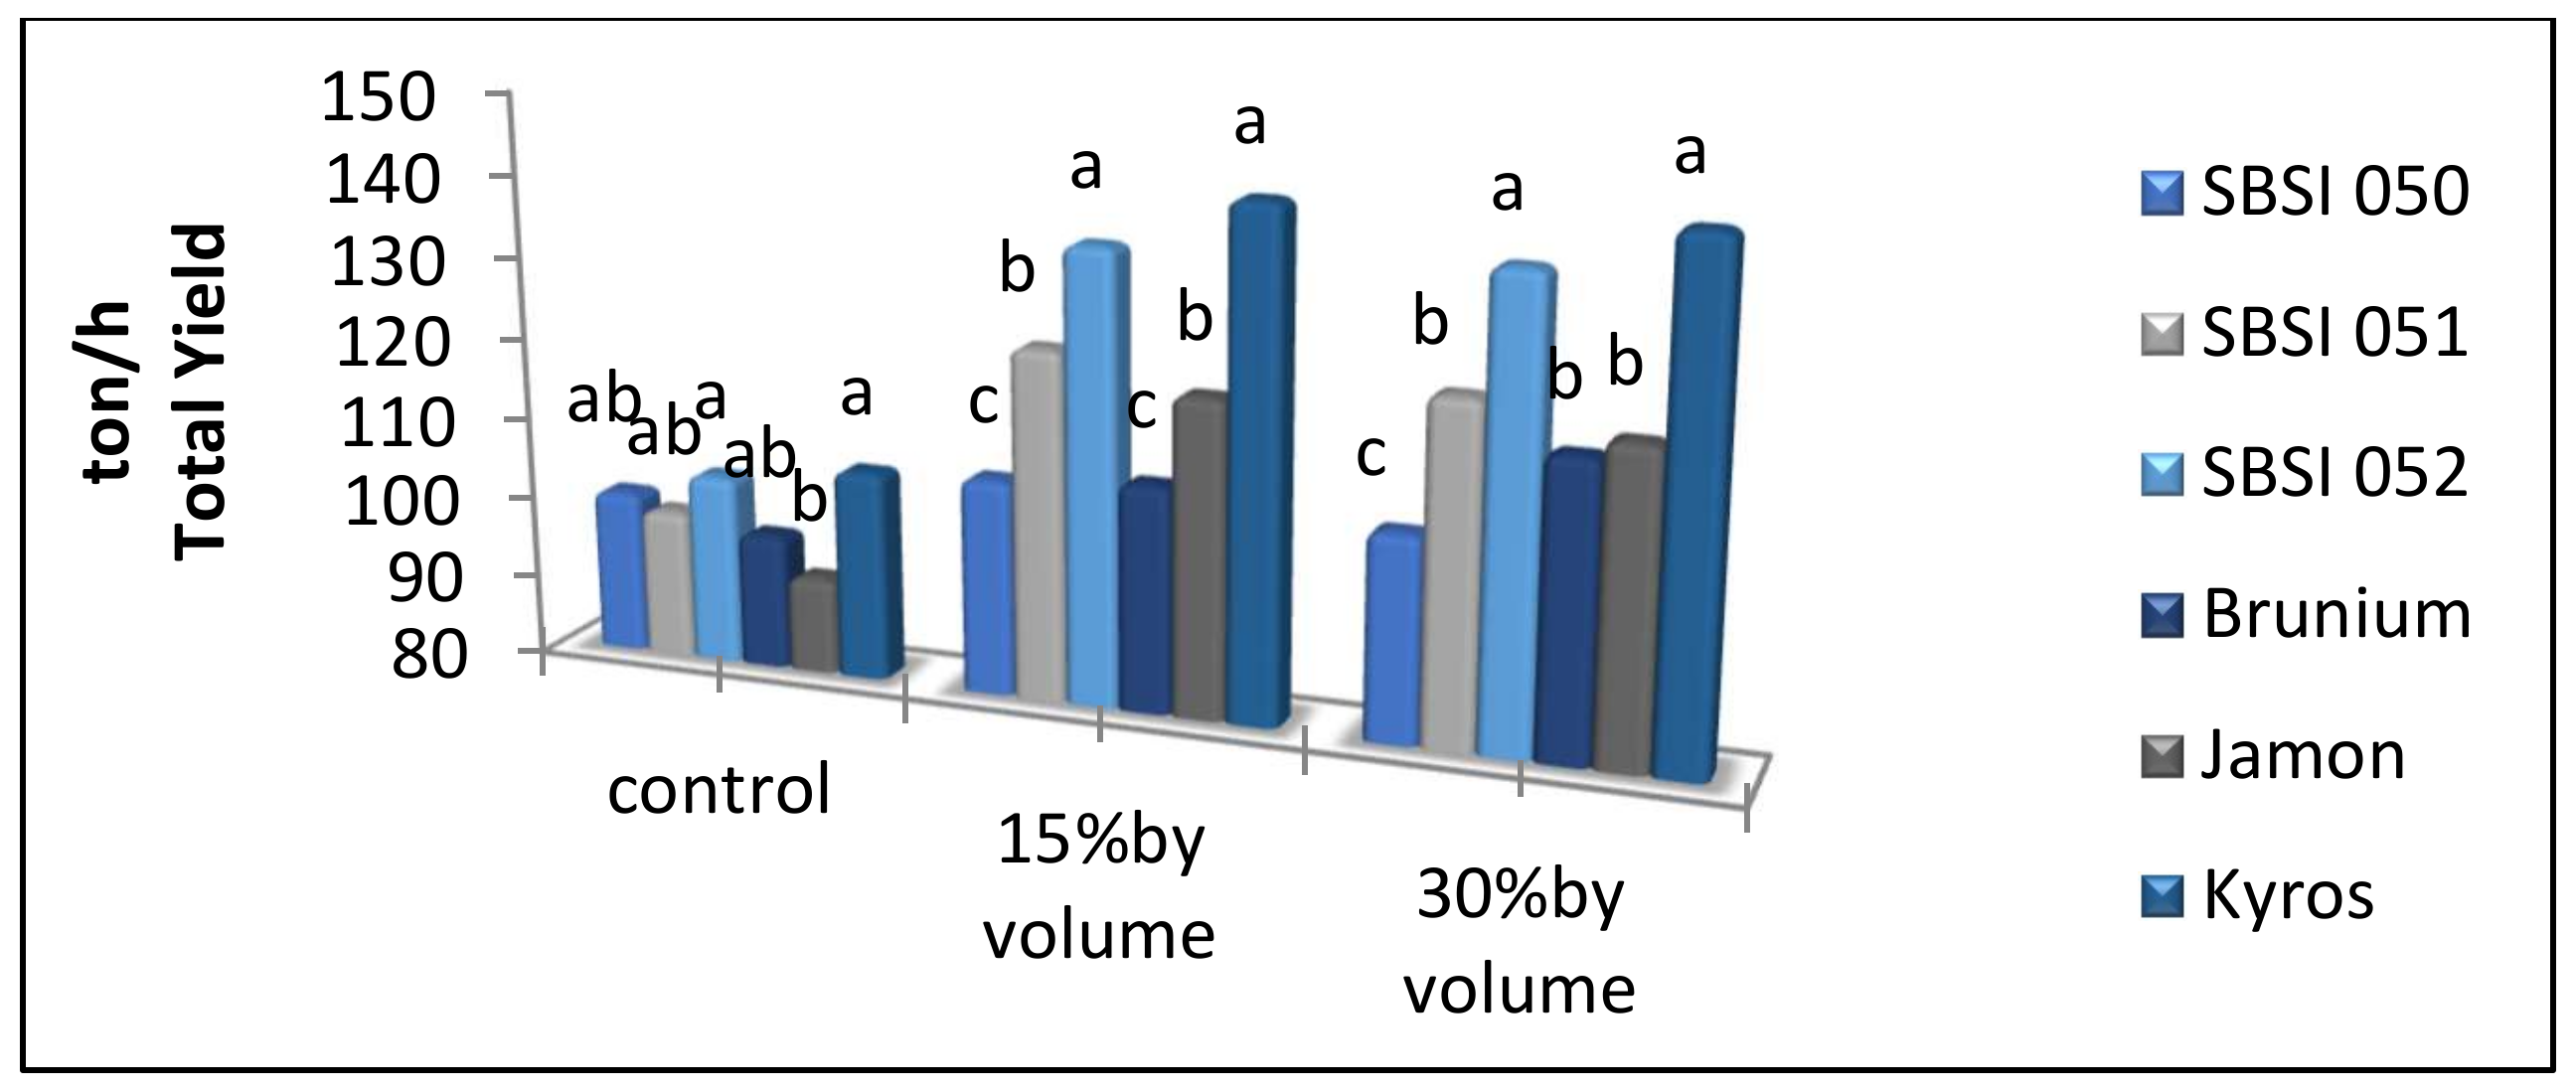
Foliar application of methanol and GB in both of the experimental locations had a significant effect on shoot dry matter yield (Table 2). The highest shoot dry matter yield was Hamedan with 4.57 t/ha and the lowest was Qom with 3.72 t/ha (Table 3). Analysis of data variance and means comparison attributed to significant differences between levels of methanol on shoot dry matter yield (p < 0.01). The higher shoot DM yield were obtained at 15 and 30% (v/v) of methanol with 4.46 and 4.60 t/ha, respectively. Studies also showed that glycine increased shoot DM yield (p < 0.05). Spraying 4 gr/l glycine solution enhanced shoot DM yield to 4.48 t/ha compared with the GB-free control treatment with a record of 3.82 t/ha. Additionally, a significant difference was observed between fodder beet genotypes in term of shoot DM yield (p < 0.05). As genotypes showed different phonological growth and production potential to devote more energy to leaf production and vice versa. The effect of methanol and genotypes on shoot DM yield was different (p < 0.05). The highest values of the above-mentioned trait were recorded with SBSI050 and SBSI051 genotypes, which were statistically located in a similar group. Brunium, Jamon, and Kirosh genotypes had a lower shoot DM yield. However, at 15% (v/v) of methanol, genotypes had different behaviors, so SBSI052 ranked at the top, but SBSI050 and Brunium were classified in the lower similar statistical group. Finally, at 30% (v/v) of methanol, genotypes were completely different and no significant differences were detected for shoot DM yield (Figure 4).
The positive effect of methanol foliar application on C3 plant growth seemed to be due to both the action of methanol as an inhibitor of light respiration and the role of methanol as a direct source of carbon, which obtained optimum photosynthesis. Methanol caused a delayed senescence in leaves and influenced ethylene production, which led to increasing photosynthesis activity [59]. Methanol enhanced net photosynthesis, thus improved the yield. Methanol reduced the plants’ photorespiration [13], and oxidized to produce serine. The doubling of serine content led to two-fold the sucrose produced, which increased the raised shoot and root yield [60]. Methanol increased the osmotic pressure and raised the sugar content and cell inflammation in the leaves. The role of methylotrophic bacteria has also been very important in increasing the leaf area index by making auxin and cytokinin, which have caused the growth and expansion of all parts of the plant [61,62]. Methanol and glycine together, especially in a hot location such as Qom, increased the plant turpentine pressure and prevented leaf wilting in high light and heat conditions. Methanol has also been effective as a carbon source for growth and expansion of the roots [13,16]. Furthermore, methanol enhanced the leaf area index and turgidity [63]. However, a significant difference between various fodder beet cultivars in terms of shoot DM yield and total DM yield has been reported [64].

3.4. Total Yield

The described data results exhibited a significant difference between the simple effects of all studied factors (p < 0.01). Thus, Hamedan with 137.64 t/ha total yield had better presentation than Qom, with a total yield of 92.11 t/ha. Data presented in Table 2 illustrated that methanol treatments positively affected the total yield (p < 0.01). With different levels of methanol, spraying at 30% (v/v) with 123.11 t/ha surpassed spraying with 15% (v/v) with 122.19 t/ha total yield, and when compared to the control treatment, which was ranked lower, with 99.33 t/ha. The best range of this trait after 4 g/L GB spraying was reported with 123.61 t/ha performance compared with the control of 106.14 t/ha. There was a significant difference between the evaluated genotypes (p < 0.01). The maximum total yields were obtained by the Kyros and SBSI052 genotypes with 129.81 and 125.06 t/ha, respectively. The minimum was observed by SBSI050 with 103.91 t/ha (Table 3). The interaction effect between location and genotype in the total yield was significant (p < 0.01). It was appropriate that the best genotype for each location be selected [58]. SO, Kyros, and SBSI052, which were classified in one group statistically, had better total yield in the Qom region, but in Hamedan, treatment only on Kyros had the highest total yield and SBSI050 and Brunium were lower than the other treatments. Additionally, the interaction effect of methanol and genotype and the analysis of variance for total yield (p < 0.01) are recorded in Figure 5.
Studies have reported that the use of methanol in water-deficient treated crops could increase their biomass [35,36,65].

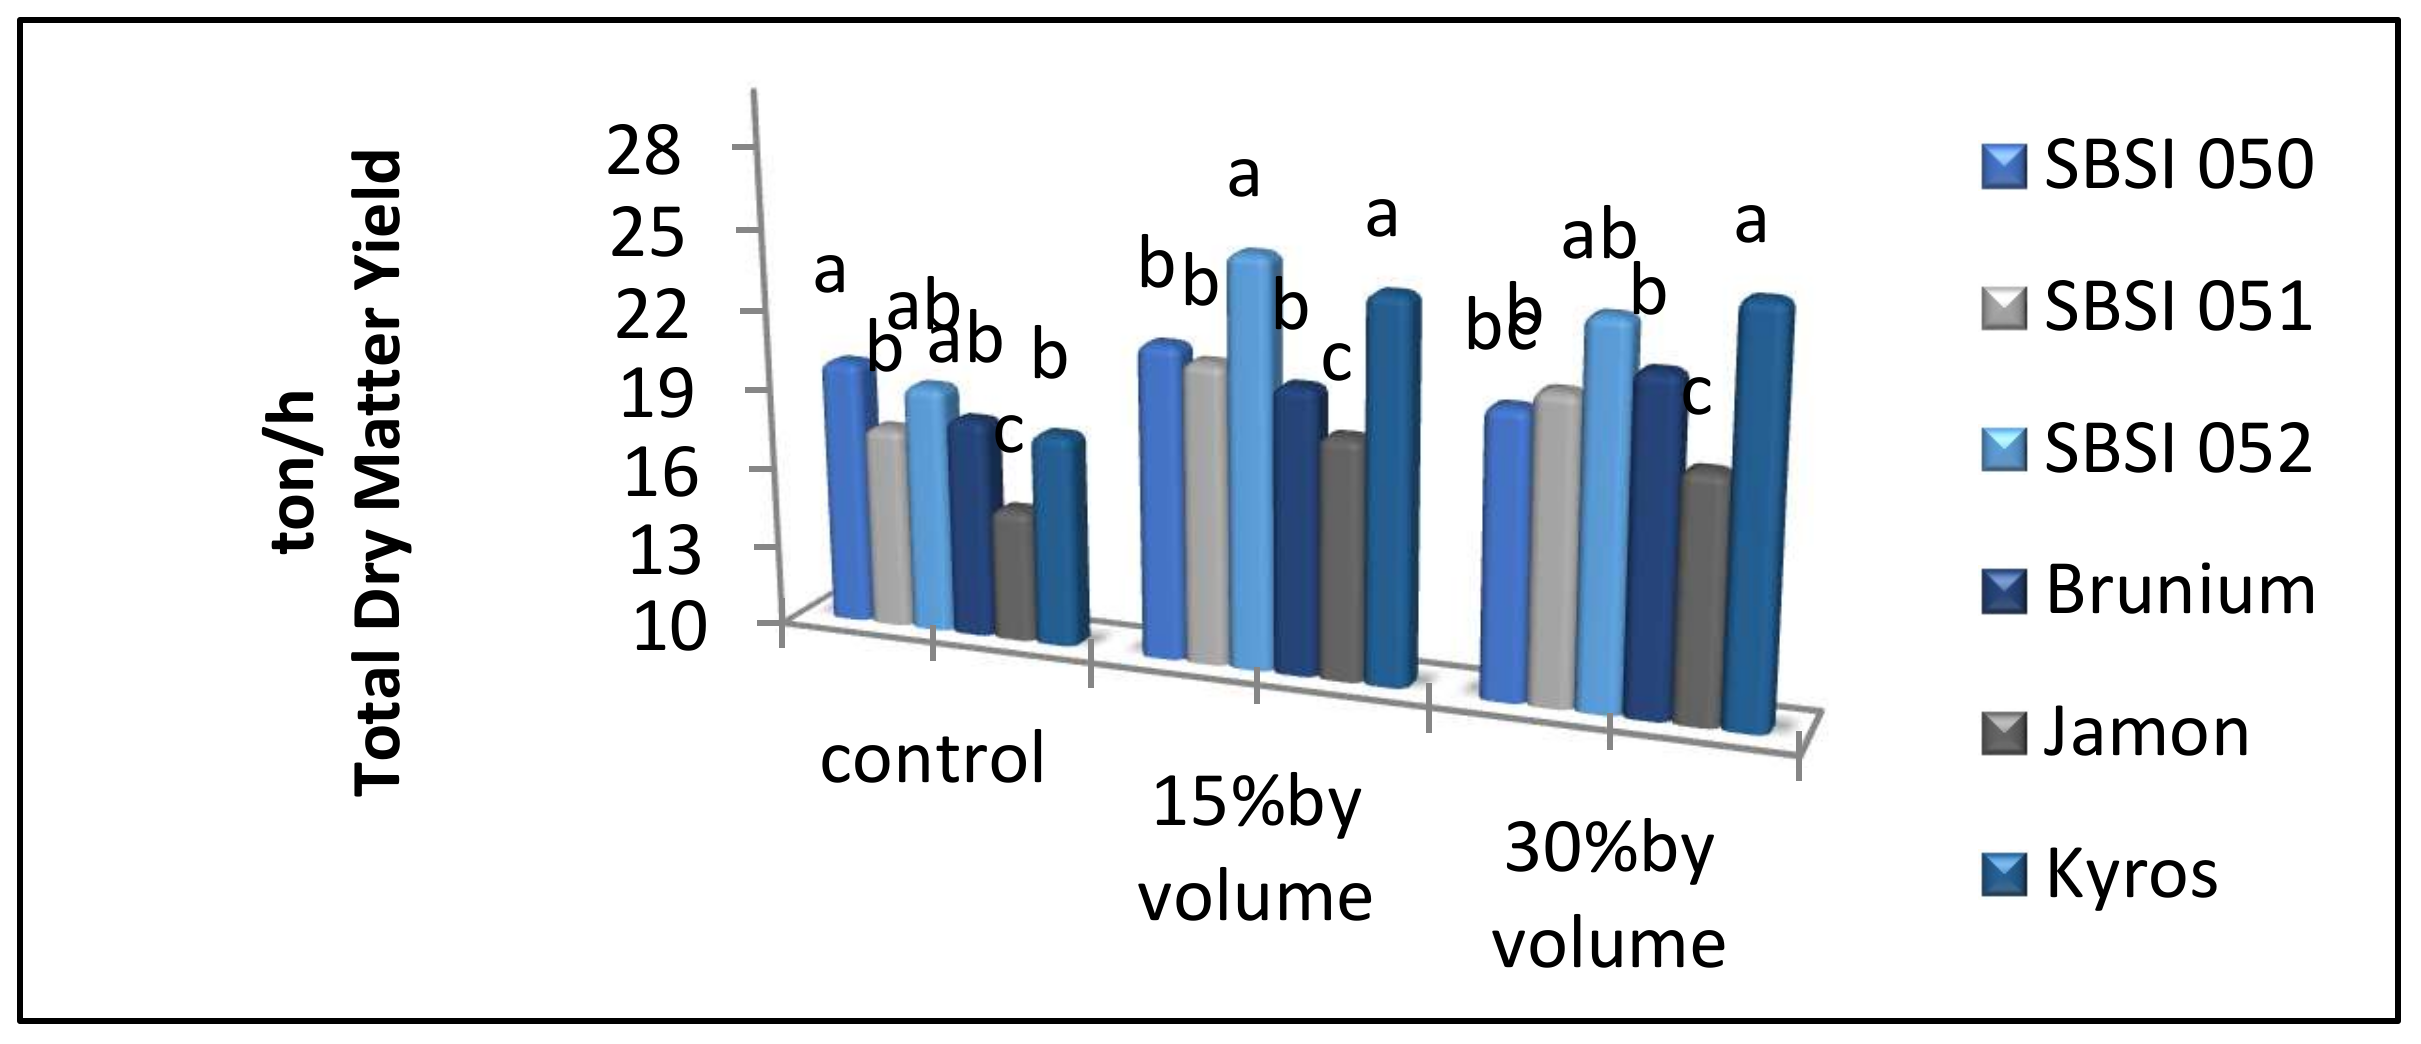
3.5. Total Dry Matter Yield

According to the table of data from the compound analysis (Table 2), the main effects of region, methanol, GB, and genotype had a significant different on the total dry matter yield. Thus, in the Hamedan region, this rank was 24.44 t/ha compared to Qom with 16.80 t/ha. Additionally, 15 and 30% by volume methanol stood in a similar statistical group and produced 21.92 and 21.95 t/ha, respectively. Their ranks were higher than the control treatment, which recorded 17.99 t/ha. Results showed that 22.00 t/ha total DM yield was achieved after using 4 g/L of GB. This range in the control non-GB was 19.24 t/ha. Based on the observations, the Kyros and SBSI 052 genotypes had a higher yield ranking by 22.31 and 22.80 t/ha total DM yield, respectively. Jamon had the lowest production with 17.60 t/ha. Genotypes in each region showed different reactions in terms of total DM performance. The interaction of location in genotype, which was the same as methanol in genotype, was significant for this trait (Table 2). In this regard, according to the diagram, in the control treatment without methanol, the SBSI050 genotype had the highest total DM yield and Jamon had the lowest, but at the level of 15% (v/v) methanol, SBSI052 and Kyros were better. Similarly, in the 30% (v/v) treatment, Kyros recorded the best value (Figure 6). In a similar experience, grain yield, grain weight, and number of pods in soybean plants treated with methanol were significantly increased compared to the control treatment. In that study, it was found that 25% by volume of methanol foliar application had the greatest effect on the growth and increase in soybean yield [66].
Methanol had a smaller molecule compared to CO2, which could be easily used by C3 plants to increase photosynthesis [66,67]. In the early 1990s, it was reported that the use of methanol solutions on aerial parts of crops increased yield, accelerated ripening, reduced the effect of drought stress, and decreased their water requirement. Meanwhile, it was again reported that the effects of methanol on plants were clearly seen when plants were exposed to conditions such as drought stress, high air temperatures, or high sunlight [13]. When C3 plants are not exposed to light after consuming methanol, they show signs of methanol poisoning. Therefore, according to prior researches, it is recommended that glycine is used to prevent damage [35]. Scientists [68] have examined different fodder beet cultivars in the Islamshahr region, Iran, and reported a significant difference between fodder beet cultivars in total DM yield. According to their research, it was appropriate to select cultivars depending on the purpose of their consumption.

3.6. Root Dry Matter Digestibility Percentage

In contrast to previous results, there was no significant difference between different levels of methanol and glycine in root DM digestibility percentage, but genotypes were the exception based on this trait (Table 4). Previously, different reports have been published [68], but it is clear that their outcome is contradicted by this experiment.

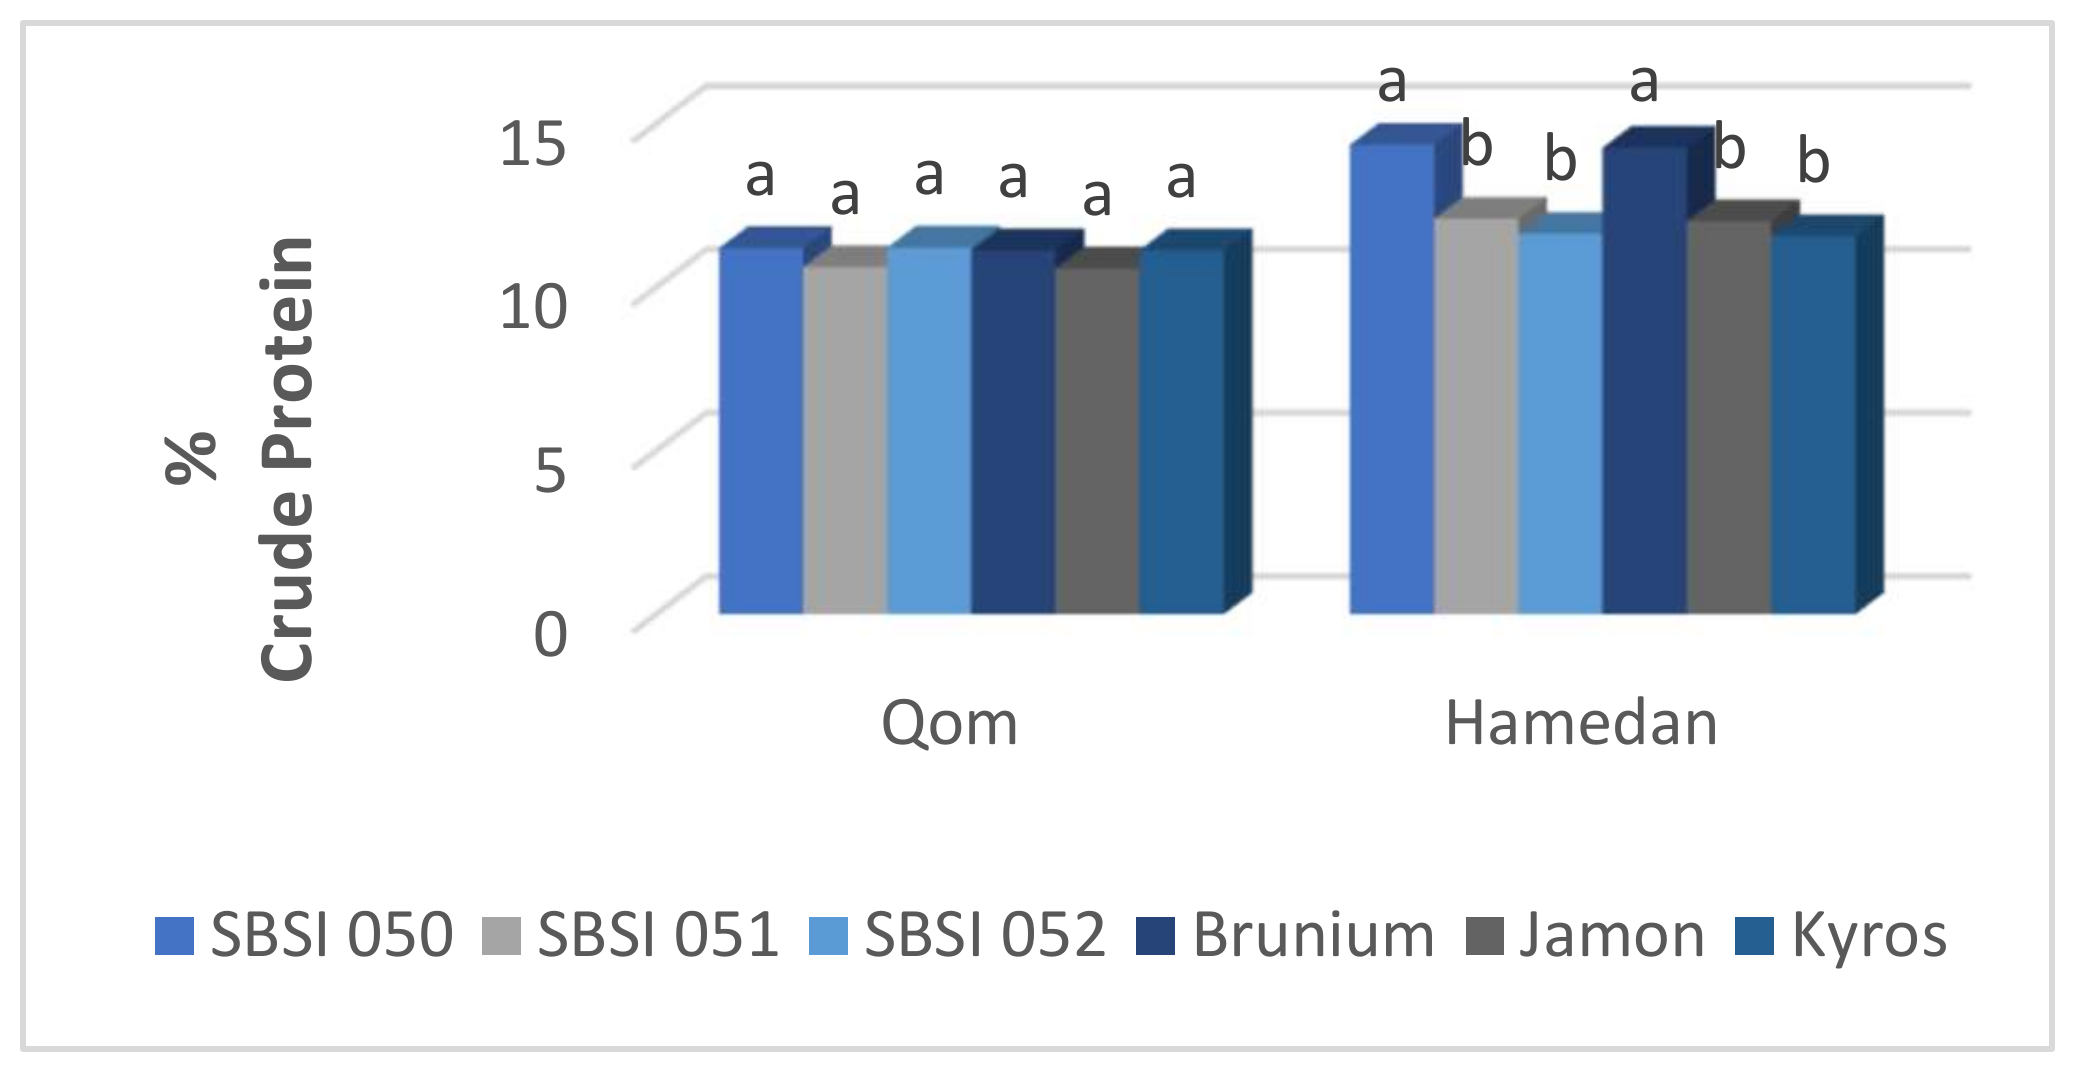
3.7. Root Crude Protein Percentage
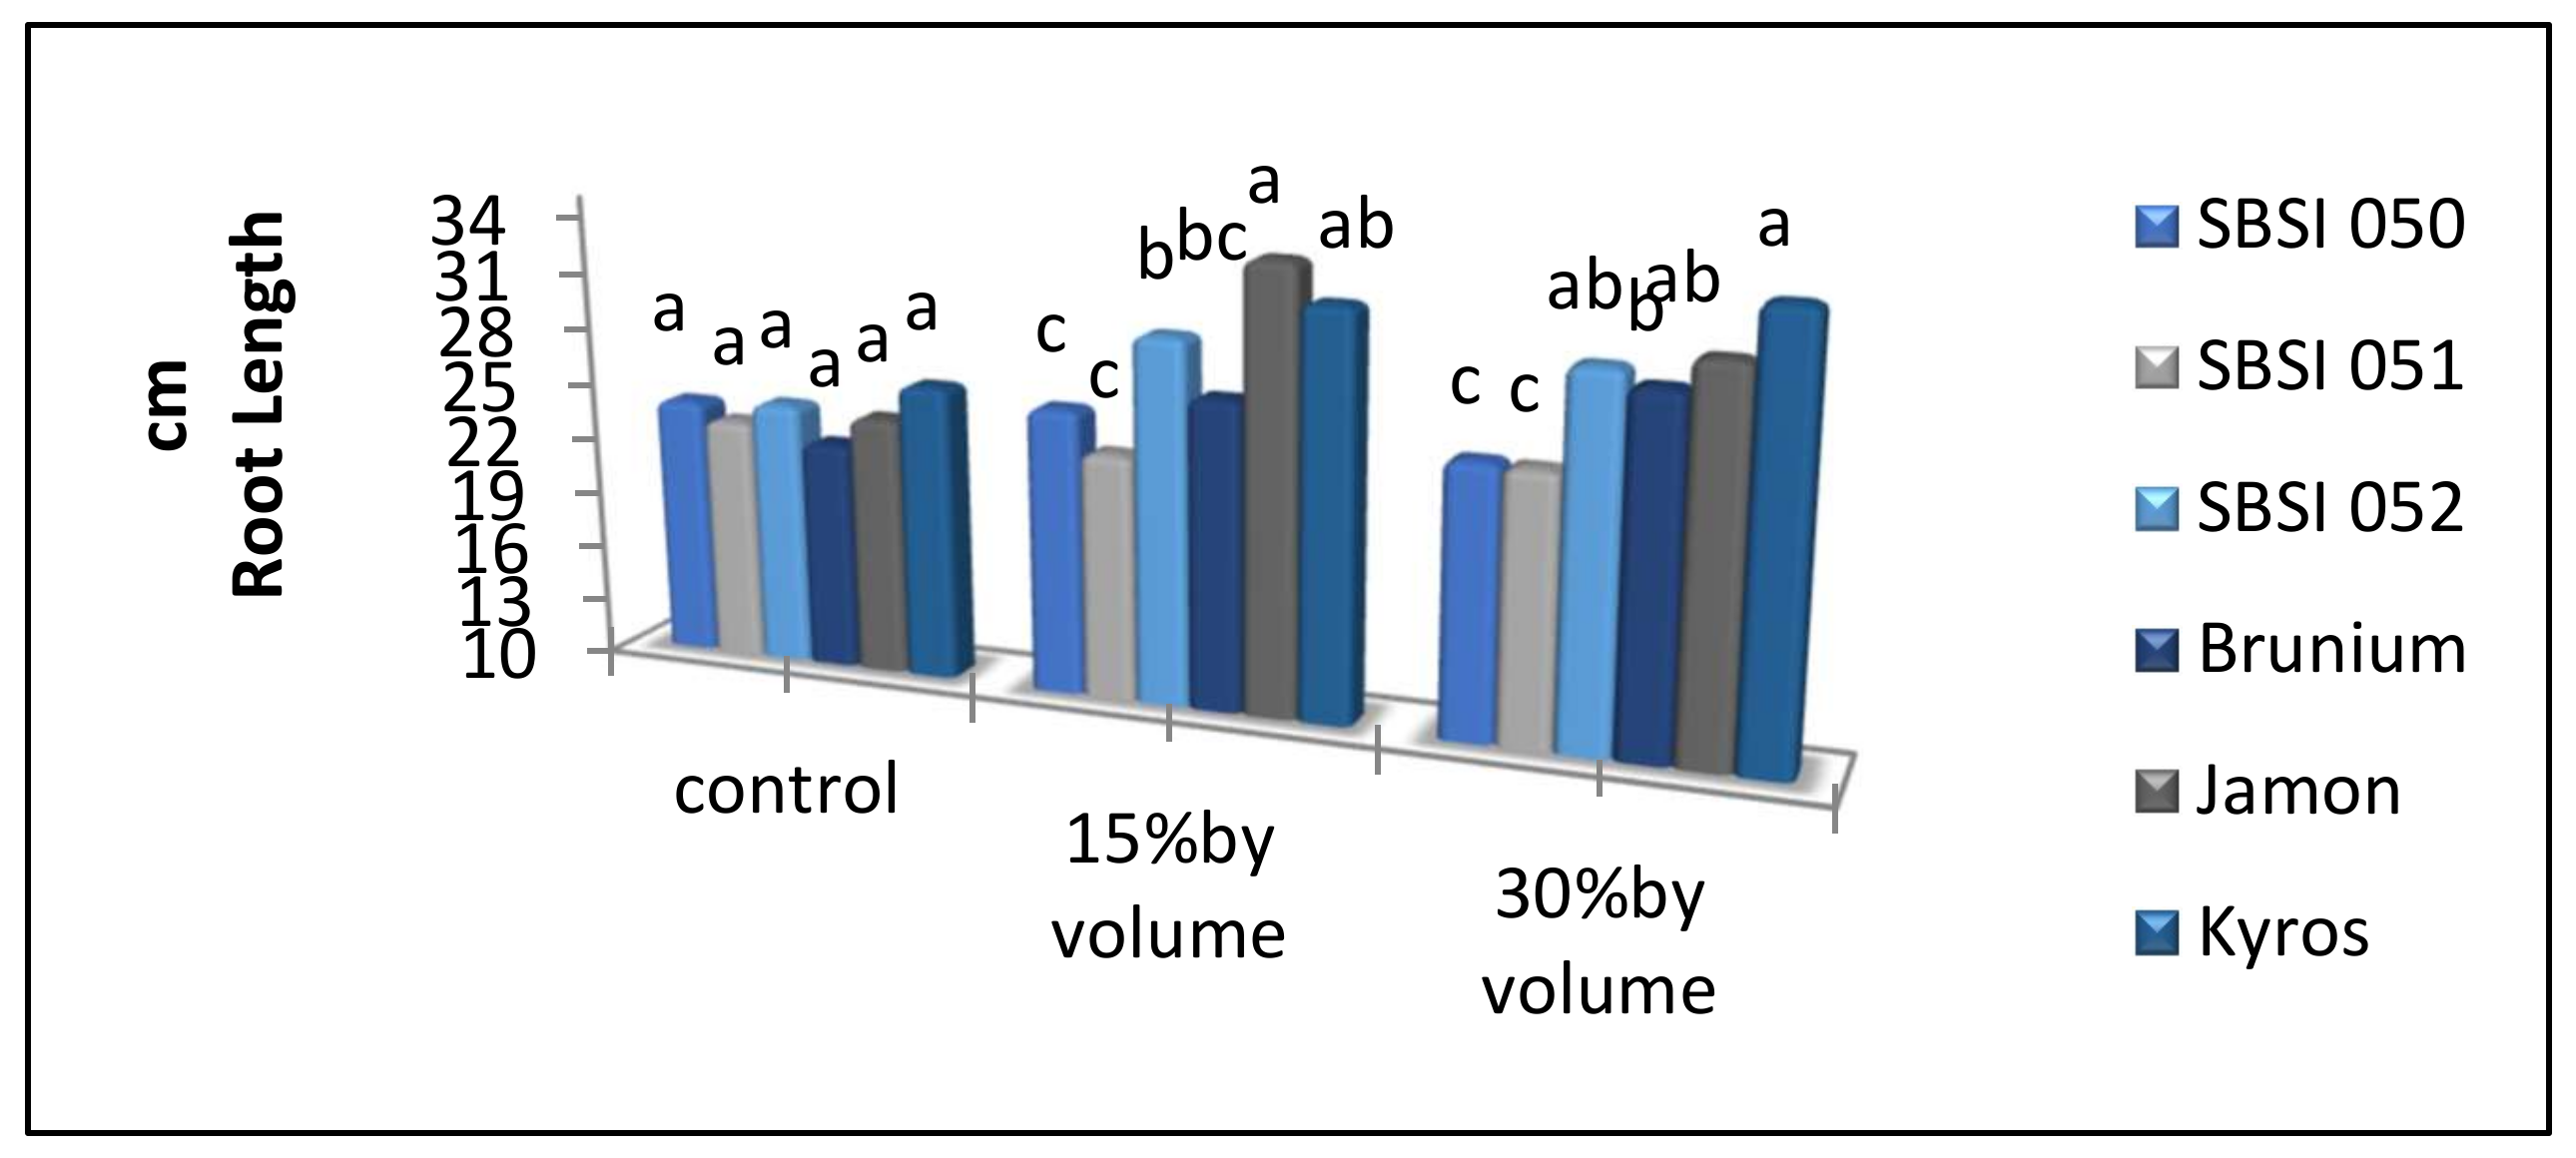
This trait was affected by location and genotype, based on the analysis (p < 0.05), but there was no difference between various levels of methanol and glycine (Table 4). Hamedan remained at the highest level (12.66%) and Qom was the second ranked treatment with 10.98% (Table 5). Normally, yield trend should show the opposite and in contrast to the crude protein, according to various theories. Therefore, it was expected that a lower percentage of crude protein was recorded by Hamedan compared to the Qom region. It was clear that the obtained results were different with previous theories. Mean comparison between the evaluated genotypes showed that the best record belonged to SBSI050 and Brunium with 12.78% and 12.70% of root crude protein, respectively. Therefore, they ranked statistically in a similar group. According to the analysis of variance table of data (4, 5), the interaction effect of location and genotype on percentage of root crude protein was significant. As can be seen in the relevant diagram (Figure 7), no significant difference between genotypes was observed in Qom, but SBSI050 and Brunium, which were classified in an equal group, ranked at the top. Researchers [68] have reported that there was no significant difference between the evaluated genotypes in root crude protein percentage. As a matter of fact, their results differed with the present results. Recently, six forage beet cultivars were examined in seven areas during two cropping years, and the results were similar to the present study.

3.8. Root Length

Analysis of variance for evaluated root length as described in Table 4 and Table 5 showed that it was significantly affected by the experimental locations (p < 0.01). The root length in the Hamedan treatment was 29.81 cm, where the roots grew longer than Qom with 23.71 cm. Additionally, different levels of methanol and GB and the genotypes were significantly effective (p < 0.01). It could be stated that application of the higher concentration of methanol and GB increased this trait and consequently produced the highest values. Applying 15 and 30% by volume of methanol caused a significant increase in root length with 28.17 and 28.29 cm, respectively. Non-methanol control treatment with a record of 23.81 cm was the lowest treatment. An average of 28.12 cm root length was recorded by 4 g of GB spraying compared to the control with 25.40 cm. By referring to the relevant tables (Table 4 and Table 5), variance analysis as well as its mean comparison was evident. Based on the evidence, the interaction effect of region in genotype on root length was significant. Similarly, Jamon and Kyros in the Qom and Hamedan regions ranked in the highest levels and were classified in the same group. The interaction of methanol and genotype was also significant. This was clear in both concentrations of 15 and 30 (v/v) methanol, where the best root length was allocated to Kyros and Jamon (Figure 8).

3.9. Sodium Content

The results of the compound analysis (Table 4) showed that the amount of sodium was affected by the main effect of location, methanol, GB, genotype, and interaction effect of location ⨯ methanol as well as the interaction between location ⨯ methanol ⨯ GB (p < 0.01). The interaction effect of methanol ⨯ GB, location ⨯ GB, and methanol ⨯ genotype was significant at the 5% level. As shown in Table 5, the highest amount of sodium was observed in the Hamedan treatment (15.68 mg/100 g.sugar), and the lowest amount was seen in Qom (5.23 mg/100 g.sugar). Methanol by 15% (v/v) concentration caused more Na production (14.39), but the lowest amount was recorded in the non-consumption of methanol (11.74). In the 4 g GB sample, Na was highest (13.95), but in the GB control, its value was the lowest. Extraction of sugar from the root depends on non-sugar materials, specifically nitrogen (N), sodium (Na), and potassium (K) compounds [69]. From a technological point of view, the amount of consumed N had a notable effect on the accumulation of Na and K impurities, and could be the main factor for reducing sugar percentage and increasing root water content [70]. GB, by regulating the ratio of sodium/potassium, is involved in the plant’s tolerance to salt. Sodium accumulation was significantly increased in the root and aerial parts due to environmental stresses [71], and GB use increased the4 sodium content by increasing the potassium accumulation. As pointed out, the effect of genotype on sodium was also significant (p < 0.01). The highest amount of sodium was recorded in SBSI052 (14.72 mg/100 g.sugar) and the lowest amount was recorded in Jamon (10.92). The interaction between factors and the amount of sodium was significant (Table 4). Hamedan with 15% methanol concentration and 4 g GB treatment was ranked first compared with the non-methanol and GB in the Qom treatment on Na content ranking. Based on these results, some genotypes have more ability and genetic potential in the accumulation of sugar and also have lower amount of harmful elements.

3.10. Catalase Activity

Studies have shown that oxidant response depends on the sensitivity and resistance of varieties [24]. As hydrogen peroxide has oxidative effects on plants, it is harmful and is removed by the activity of the catalase enzyme. These enzymes preserve cells against the effects of hydrogen peroxide and have an important role in enhancing resistance to oxidative stress under natural conditions [25]. Enhancement in the chlorophyll amount could relate to methanol oxidation in bushes with a lack of water because bushes encounter oxidative stress under a water lacking condition. In such circumstances, methanol is oxidized to formaldehyde by the leaf extract and this work is done by the catalase enzyme [30]. The results of compound analysis, which are shown in Table 4, indicate that the main effect of location, methanol, GB, and genotype as well as the interaction effects of methanol ⨯ GB, location ⨯ methanol, and location ⨯ methanol had a significant effect on the content and activity of the catalase (CAT) enzyme (p < 0.01) (Figure 9). The highest activity of catalase enzyme was observed in Qom treatment (2.25 u/mg.pr) and the lowest activity was recorded in Hamedan (1.58 u/mg.pr), (Table 5). Drought stress in Qom increased CAT activity [72]. The different activities of antioxidant enzymes in different genotypes has been related to different genetic behaviors to tolerate drought stress conditions.
The highest activity of the catalase enzyme was seen in 15% (v/v) methanol (2.02), and the lowest was recorded in non-methanol application (1.72). CAT should increase about 10 times more in crops treated with the drought stress condition [73]. CAT protected cells against hydrogen peroxide and played an important role in resistance to oxidative stress. Methanol, through the absorption of iron, which is a prosthetic group of hemoproteins such as catalase, peroxidase, and superoxide dismutase, is involved in the destruction of active oxygen species in plants [19,74]. The effect of GB foliar application on CAT was significant (p < 0.01) (Table 4). The highest catalase activity was obtained in 4 g GB treatment (2.04 u/mg.pr), and the lowest was recorded in the control (Table 5). The results [75] described that CAT activities in well-watered plants were not influenced by the GB exogenous application, in contrast to the water-stressed plants. Regarding genotypes, SBSI052 had the best performance of CAT (2.10 u/mg.pr), and Jamon was last with 1.69 recorded. Researchers [76] have stated that the activity of CAT increased in drought-tolerant cultivars of maize. Additionally, scientists [77] showed that the drought stress adaptation ability depended on the maintenance of increases in the capability to detoxify superoxide radicals by antioxidant enzymes. Interaction between total factors and catalase was significant (p < 0.05) (Table 4). The highest activity of CAT was recorded in Qom with 15% (v/v) methanol and 4 g GB and the lowest activity was seen in Hamedan with non-consumption of methanol and GB (Table 6).
Plants treated with GB showed greater CAT activity and exhibited better performance in levels of photosystem II (PSII) action compared with the control plants. This result suggests that GB might enhance the induction of antioxidant mechanisms in abiotic stress conditions. For more information, mean comparison of the interaction effect of location ⨯ genotype on catalase content is presented in Figure 9. It is clear that the semi-arid climatic condition of Qom and both the daily evaporation from the surface layers of the soil and hot regional winds as well as the unfavorable climate of this location, compared to the temperate weather of Hamedan, often causes plants to experience thermal stress. Its response to compensate for this problem is greater activity of the catalase enzyme to neutralize the effect of stress.

3.11. Sugar Content

The effect of location on sugar content was significant at the 1% probability level (Table 4). The sugar content observed in Hamedan was 791.74 (mg/g.DM), and 595.27 (mg/g.DM) was recorded in Qom (Table 5). Several factors such as cultivar, environment, and agricultural operations affect the quality of sugar beet [78]. Lack of water and high temperature during the growth period have different effects on root quality and might decrease the amount of amino acids, nitrogen compounds, and sugar levels. The percentage of sugar depends on the substitution of non-sucrose compounds with sucrose during root growth and is affected by water and nutrients. Sucrose storage is limited by the increasing level of osmolyte [79]. Studies [14] have shown that the percentage of sugar decreased is due to heat stress. The effect of methanol foliar application on sugar content was significant at the 1% probability level (Table 4). The highest sugar content after methanol spraying was 750.26 mg/g.DM, which was observed in the 30% by volume treatment and the lowest sugar amount was recorded in the non-methanol application treatment (Table 5). Increasing photosynthesis by foliar application with methanol can increase the amount of soluble sugar in the leaves [65]. Methanol increased the yield of beans [80]. Sugar in leaf improves through methanol metabolism, which increases cellular turgor and crop growth rate in treated plants. The effect of glycine betaine foliar application concentration on sugar content was significant at the 1% probability level (Table 4). The highest sugar content was observed in glycine betaine treatment application, and the lowest was reported in the control treatment (Table 5). The application of glycine betaine in two corn cultivars in the vegetative growth stage increased the amount of sugar, protein, and fiber in both corn cultivars under drought stress and irrigation [81]. Greater amounts of soluble sugar and proline are actually some of the responses of plants to drought stress to reduce osmotic potential [82]. Glycine betaine-treated plants can increase NAT and CGR [13]. The foliar application of amino acids increases the efficiency of carbon conversion. Therefore, an increase in the percentage of sugar in glycine betaine treatments can be attributed to the increase in the hormone auxin and the increase in sucrose transfer from the leaves to roots. The effect of genotypes on sugar content was significant at the 1% probability level (Table 4). The highest sugar was observed in the treatment of SBSI052 and the lowest was in Jamon (Table 5). Interaction between the factors and sugar content was significant at the 5% probability level (Table 4). The highest sugar amount (938.78 mg/g.DM) was recorded in Hamedan with 1 the 5% methanol concentration and 4 grams concentration of glycine betaine treatment, and the lowest (459.38 mg/g.DM) was in Qom with non-methanol and glycine betaine application treatment (Table 4).

4. Supplementary Discussions

It has been recognized that carbon is one of the most essential nutritional factors that drives the photosynthesis process, growth rate, and development of plants. The aim of this study was to use methanol to target and accelerate the process of carbon transfer to organs effective in increasing plant yield components. Some enzymes such as rubisco have played a key role in this process. A total of 90% of the dry matter of the plant is due to the assimilation of CO2 during the process of photosynthesis. Immediately after methanol and GB foliar application, the activity of methylotrophic symbiotic bacteria begins. These bacteria consume methyl alcohol and donate cytokinin and auxin to the leaves. Along with this increase, not only does the ethylene activity decrease, but the root and shoot system also quickly completes the vegetative phase. Therefore, shorter periods of environmental stresses are experienced. Methanol disrupts the stimulant function of ethylene production (ACC), and prevents the activity of ethylene in the plant. Therefore, the durability of the leaf area increases, which results the increase in photosynthesis duration. A better CO2 fixation process has been undertaken where and total yield was increased. The population of these bacteria also increased with the next spraying, so yield components are interconnected. Obviously, the decrease or increase in shoot yield is related to root yield, and both of them act in relation to dry matter yield. This means that the plant has a complex but unified system in which the separation of its components does not seem logical. Plants must be equipped with a system of resistance to abiotic stresses, which requires better performance of the enzyme Rubisco in order to overcome the light respiration that is generated in terms of stresses such as heat. Alcohol molecules are much smaller and volatile in the presence of CO2. Methyl alcohol, with its methyl agent, is absorbed through the leaf cuticle and metabolized by plant tissues, finally adding CO2 to the plant. A better CO2 fixation process was undertaken where not only root yield, but also shoot yield and total yield were increased [35,36]. These reasons can explain the 20% increase in root yield and the 19% increase in root dry matter yield and the 23% increase in total yield compared to the control treatment after methanol application. Climatically, both experimental locations had daily heat, but the intensity of tension was higher in the Qom region because this region is in a hot and dry location.
Therefore, the plants were definitely exposed to heat and drought stresses at midday, more so in Qom and less in the Hamedan region. Under improper environmental conditions, free radicals are produced. Free oxygen radicals such as peroxides react with most cell compounds and might damage membranes and other macro molecules. Enhancement of the catalase (CAT) antioxidant enzyme content increased the plants’ tolerance against abiotic stresses [23]. Elevated catalase levels were observed in the Qom region (2.25 u/mg.pr) more so than in Hamedan (1.58 u/mg.pr) to compensate for the effects of cellular peroxides [26] (Table 5). According to Table 6, along with methanol consumption, the amount of catalase also increased, so that in the treatment of 30% by volume of methanol and consumption of 4 g of glycine, in the Hamedan region, due to less drought stress and less free radicals, the amount of CAT was lower at 1.89 u/mg.pr, but in the treatment of 30% by volume of methanol and 4 g of glycine in the Qom region, due to the presence of stress and more free radicals, the value reached 2.47 u/mg.pr. Methanol, together with GB, was oxidized by the catalase enzyme accompanied with the leaf extract [30] to enhance the chlorophyll content to accelerate the production of sugar and amino acids, which increased the dry matter production and total yield. Methanol has a smaller molecule than CO2, so it is absorbed through the cuticle by its methyl agent. As it enters the leaf tissue, it has oxidized to carbon CO2 and used as a carbon source [13]. Increasing the concentration of CO2 in the presence of Rubisco reduced the ability of oxygen competition. Methanol changed the nature of light respiration from a catabolic reaction to an anabolic reaction, so that instead of producing one serine molecule in this process, it allowed methanol to produce two molecules of serine, which doubles the production of sucrose that takes place. These can be considered as reasons for increased sugar content and yield components [39]. Therefore, according to Table 6, after methanol and glycine foliar application, an increase in the amount of sugar recorded. In the Hamedan region, 15% by volume of methanol and four grams of glycine produced the highest amount of sugar content (938.78). At the same time, in the Qom region, the treatment of 30% by volume of methanol and four grams of glycine recorded the highest amount of sugar content (564.65). In the Qom region, a higher concentration of methanol was required. One part of the methanol participated in the process of conversion to formaldehyde and formic acid and the production of carbon dioxide and assimilation, and the other part was oxidized to maintain the efficiency of chlorophyll and photosynthesis and growth and yield production. Meanwhile, one part was needed to overcome light respiration. The other part was used to produce the product and yield. Therefore, these reasons could explain the increase in the root yield, root dry matter yield, and total yield in normal conditions and stress situations compared to the control treatment after methanol consumption. Methanol, by making differences in cellular PH, increased ATP and NADH production in stomatal guard cells, causing stomatal dilatation. Methylotrophic bacteria also converted some of the methanol to ATP and NADH and increased the ability of guard cells to trade CO2 by the potassium pump [83]. The result of these interactions was an enhancement in the metabolic activity and CO2 conductivity of the leaves, which led to an increase in yield components and more root growth. Although auxin and cytokine from methylotrophic bacteria played the most important role in increasing root growth, in the Qom region, due to greater stress, growth was less. In the Hamedan treatment, after consuming 15% by volume of methanol, root growth increased from 25.93 cm, in the control treatment to 35.76 cm; and in the Qom region, it was 18.49 cm while in the control treatment it was 29.41 cm after 30% methanol application (Table 6). In the Qom region, it was appropriate to use 30% by volume of methanol because some part of the methanol was used to neutralize light respiration. Simultaneously with the growth of the root system, the absorption of elements increased. One of these elements was sodium. The other element was nitrogen, which caused growth of the plant and increased the yield. Due to their high nitrogen and sodium intake, some of them did not accumulate in vacuoles and accumulated freely in the roots. Some non-sugar compounds such as sodium and potassium as well as crude protein and even sugars participate in cell absorption and osmotic protection phenomena in order to reduce the effects of oxidative stress and affect the antioxidant system. Therefore, the amount of these elements and compounds was less after methanol and GB application. Therefore, the crude protein not only dropped from 14.17 % in the control treatment to 11.64 % in the methanol consumption treatment in Hamedan, but also in Qom, it dropped from 12.07% in the control treatment to 10.21%. Glycine improved the efficiency of methanol in all treatments (Table 6). Glycine in the Qom region participated more in activities related to controlling heat and moisture stress and performed osmotic protection. Furthermore, in the performance of chloroplasts, it is essential and therefore able to improve photosynthesis and increase the assimilation efficiency by keeping the cell wall stable at all times. In addition to methanol consumption, glycine led to better results. Glycine alone promoted root growth in the Hamadan region where it increased from 25.93 cm to 25.93 cm, and along with methanol, intensified the results of methanol efficiency and increased root growth up to 34.25 cm. Glycine alone increased root yield in the Hamedan region from 98.31 t/ha to 105.19 t/ha and the total yield increased from 119.76 to128.05 t/ha. In the Qom region, the effectiveness of glycine with methanol was reported (Table 6). According to Table 6, in the Qom region, more heat and drought disrupted Rubisco activity because the stomata closed in the middle of the day due to moisture retention and less CO2 transmission occurred. Therefore, root yield and other yield components were on average lower than in Hamedan. In addition, in these unfavorable conditions, the activity of bacteria seems to be slightly limited. As reported in Table 3, an average of 55% difference in root yield, 52% difference in dry matter yield, 49% difference in total yield, and 22% difference in shoot dry matter yield were recorded between the Hamedan and Qom locations. Four grams of glycine application caused a 15% increase in root yield compared to the treatment (Table 3). Glycine accumulated in chloroplasts play a special role in both the protection of the thylakoid membrane and the photosynthetic efficiency maintenance. Under the heat condition of the Qom region, glycine caused resistance and drought tolerance of genotypes. GB stabilized cellular structures and functional proteins, and therefore protected the integrity of cell membranes against stress [43]. The beneficial efficacy of glycine in heat and dry stress conditions was the same for all performance components. Species and genotypes, based on their genetics and gene expression, were very different in the face of environmental and climatic conditions and had different functions.

5. Conclusions

The results of this study indicated the possibility of using methanol and glycine with the aim of increasing or improving some of the quantitative and qualitative traits of different fodder beet genotypes. Researchers have illustrated that methanol foliar application increased root yield, sugar yield, and total yield in sugar beet cultivars. They reported a significant difference between the presentation of root yield in normal situations and drought stress conditions [39]. Noteworthy is that similar differences observed in the present study on shoot and root yield, purity percentage, and the non-sugar soluble (potassium and sodium and α -amino nitrogen) content. As observed, experimental locations showed significant differences and the Hamedan treatment recorded higher values in most of the evaluated traits, which could be justified to a better adaptation of sugar beet to the temperate climate of this location. Additionally, methanol foliar application improved root yield, shoot and total forage production. The interaction between 15 and 30% concentrations of methanol and genotype showed that Kyros, with about 140 t/ha, and SBSI052 with about 135 t/ha, had the highest average range in total performance. Furthermore, in this interaction, the highest root yield was assigned to the Kyros genotype with an average of 120 t/ha and SBSI052 with about 105 t/ha, respectively. Again, Kyros and SBSI052 recorded the highest dry matter yield with an average of 21 and 19 t/ha. The Jamon cultivar did not show an acceptable performance in most of the studied traits. Other genotypes had lower results than Kyros and SBSI052. Different levels of methanol foliar application did not show a significant difference. Glycine betaine created positive effects and improved some quantitative traits. Glycine increased root yield by an average of 13 t/ha and total yield by about 17 t/ha, but had no significant effect on root dry matter digestibility. There was a significant difference between genotypes in morphological traits and most of the quantitative and qualitative features. One of the most important goals of this study was self-sufficiency in forage production and reducing dependence on imports of agricultural products, which is strongly recommended to the farmers, researchers, and experts. Methanol and glycine betaine reduced the effect of abiotic stresses such as drought stress and dehydration, improved water use efficiency, and significantly raised root yield and total performance. According to the results, the global climate is going to heat, and more than 60% of our country (Iran) is located in a semi-arid region. In this situation, methanol and GB spraying can be very important to maintain optimal performance. Therefore, it is worthwhile treating other genotypes with different levels of methanol and GB in wider climates for new results and future provide modeling. Finally, based on the data and results, the Kyros genotype in the Hamedan location including 15% by volume of methanol foliar application and four grams of GB concentration with an average of 120 t/ha root yield (Figure 1 and Figure 2), 20 t/ha root dry matter yield (Figure 3), and 142 t/ha total yield (Figure 5) is the best recommended treatment.

Author Contributions

Conceptualization, D.H., P.H., H.M., B.S. and M.S.; Methodology, D.H., P.H. and M.S.; Software, B.S. and P.H.; Validation, M.S., B.S. and P.H.; Formal analysis, D.H.; P.H., H.M., B.S. and M.S.; Investigation, D.H., P.H. and M.S.; Resources, D.H. and M.S.; Data curation, P.H., H.M. and M.S.; Writing—original draft preparation, P.H., H.M. and M.S.; Writing—review and editing, D.H. and P.H.; Visualization, D.H., P.H. and H.M.; Supervision, D.H., P.H., B.S. and M.S.; Project administration, P.H. and M.S.; Funding acquisition, P.H. All authors have read and agreed to the published version of the manuscript.

Funding

This research received no external funding.

Institutional Review Board Statement

Not applicable.

Informed Consent Statement

Not applicable.

Data Availability Statement

The data presented in this study are available upon request from the corresponding author.

Acknowledgments

We thank all the professors who helped us in this research and the management and specialists of the Karaj Sugar Beet Research Institute (SBSI), Alborz, Iran, for their countless contributions.

Conflicts of Interest

The authors declare no conflict of interest.

References

  1. He, M.; He, C.-Q.; Ding, N.-Z. Abiotic Stresses: General Defenses of Land Plants and Chances for Engineering Multistress Tolerance. Front. Plant Sci. 2018, 9, 1771. [Google Scholar] [CrossRef] [PubMed] [Green Version]
  2. Jeandroz, S.; Lamotte, O. Plant responses to biotic and abiotic stresses: Lessons from cell signaling. Front. Plant Sci. 2017, 8, 1772. [Google Scholar] [CrossRef] [PubMed] [Green Version]
  3. Goldman, I.L.; Janick, J. Evolution of Root Morphology in Table Beet: Historical and Iconographic. Front. Plant Sci. 2021, 12. [Google Scholar] [CrossRef] [PubMed]
  4. Wiśniewska, A.; Andryka-Dudek, P.; Czerwiński, M.; Chołuj, D. Fodder beet is a reservoir of drought tolerance alleles for sugar beet breeding. Plant Physiol. Biochem. 2019, 145, 120–131. [Google Scholar] [CrossRef]
  5. SadeghiShoae, M.; Mirzaee, M.R.; Mahdikhani, M.; Jalilian, A.; Nadali, F.; Pedram, A.; Nemati, R.; Rezaei, J. Determination of Field Value of Fodder Beet Cultivars; Final Report of Sugar Beet Seed Institute (SBSI); Journal of Sugar Beet; Agricultural Research Education and Extension Organization (AREEO): Karaj, Iran, 2020; 28p. [Google Scholar]
  6. SadeghiShoae, M.; Aghaeezadeh, M.; Rahnamaeian, M. Purification and Preparation of New Fodder Beet Masses; Final Report of Sugar Beet Seed Institute, (SBSI); Journal of Sugar Beet; Agricultural Research, Education and Extension Organization (AREEO): Karaj, Iran, 2019; 17p. [Google Scholar]
  7. Islam, J.; Kim, J.; Begum, M.; Sohel, A.T.; Lim, Y.-S. Physiological and Biochemical Changes in Sugar Beet Seedlings to Confer Stress Adaptability under Drought Condition. Plants 2020, 9, 1511. [Google Scholar] [CrossRef]
  8. Hussain, S.; Shuxian, L.; Mumtaz, M.; Shafiq, I.; Iqbal, N.; Brestic, M.; Shoaib, M.; Sisi, Q.; Li, W.; Mei, X.; et al. Foliar application of silicon improves stem strength under low light stress by regulating lignin biosynthesis genes in soybean (Glycine max (L.) Merr.). J. Hazard. Mater. 2020, 401, 123256. [Google Scholar] [CrossRef]
  9. Sheteiwy, M.S.; Elgawad, H.A.; Xiong, Y.; Macovei, A.; Brestic, M.; Skalicky, M.; Shaghaleh, H.; Hamoud, Y.A.; El-Sawah, A.M. Inoculation with Bacillus amyloliquefaciens and mycorrhiza confers tolerance to drought stress and improve seed yield and quality of soybean plant. Physiol. Plant. 2021. [Google Scholar] [CrossRef]
  10. Felix, J.D.; Roebuck, J.A.; Mead, R.N.; Willey, J.D.; Avery, G.B.; Kieber, R.J. Methanol and ethanol concentrations in a Greenland ice core. Atmos. Environ. 2019, 217, 116948. [Google Scholar] [CrossRef]
  11. Saneienejad, A.; Tohidi, M.; Khaniani, B.H.; Sadeghi, M. Effect of Foliar Application of Methanol on Changes of Antioxidant Enzymes of Vigna unguiculata L. in Water-Deficit Stress. Agric. Sci. Dig. A Res. J. 2019, 39, 296–300. [Google Scholar] [CrossRef] [Green Version]
  12. Dorokhov, Y.L.; Sheshukova, E.V.; Komarova, T.V. Methanol in plant life. Front. Plant Sci. 2018, 9, 1623. [Google Scholar] [CrossRef] [Green Version]
  13. Nonomura, A.M.; Benson, A.A. The path of carbon in photosynthesis: Improved crop yields with methanol. Proc. Natl. Acad. Sci. USA 1992, 89, 9794–9798. [Google Scholar] [CrossRef] [PubMed] [Green Version]
  14. Demmers-Derks, H.; Mitchel, R.A.C.; Mitchell, V.J.; Driscoll, S.P.; Gibbard, C.; Lawlor, D.W. Sugar beet under climatic change: Photosynthesis and production. Asp. Appl. Biol. 1996, 45, 163–170. [Google Scholar]
  15. Nadali, I.; Paknejad, F.; Moradi, F.; Vazan, S.; Tookalo, M.; Jami Al-Ahmadi, M.; Pazoki, A. Effect of foliar application of methanol on sugar beet (Beta vulgaris). Aust. J. Crop. Sci. 2010, 4, 398–401. [Google Scholar]
  16. Fall, R.; Benson, A.A. Leaf methanol—The simplest natural product from plants. Trends Plant Sci. 1996, 1, 296–301. [Google Scholar] [CrossRef]
  17. Galbally, E.; Kirstine, W. The Production of methanol by flowering plants and the global cycle of methanol. J. Atmos. Chem. 2002, 43, 195–229. [Google Scholar] [CrossRef]
  18. Nonomura, A.M. Method and composition for enhancing carbon fixation in plants. Proc. Natl. Acad. Sci. USA 1997, 91, 0094–0098. [Google Scholar]
  19. Blokhina, O.; Virolainen, E.; Fagerstedt, K.V. Antioxidants, Oxidative Damage and Oxygen Deprivation Stress: A Review. Ann. Bot. 2003, 91, 179–194. [Google Scholar] [CrossRef] [Green Version]
  20. AL-Aghabary, K.; Zhujun, Z.; Qinhua, S. Influence of silicon supply on chlorophyll content, chlorophyll fluorescence, and antioxidative enzyme activities in tomato plants under salt stress. Plant Nutr. 2004, 27, 2101–2115. [Google Scholar] [CrossRef]
  21. Esfandiari, A.; Mahbob, S.; Shekari, F. Harmful Effects of Active Oxygen Types, Preservative Mechanisms of Plant And Necessity of Paying Attention To Them. In Proceedings of the of 10th Congress of Iran Agronomy and Plant Breeding, Karaj, Iran, 19–21 August 2008; pp. 1–8. [Google Scholar]
  22. Asada, K. The water-water cycle in chloroplasts: Scavenging of Active Oxygens and dissipation of exess photons. Ann. Rev. Plant Physiol. Plant Mol. Biol. 1999, 50, 601–639. [Google Scholar] [CrossRef]
  23. Guo, Z.; Tan, H.; Zhu, Z.; Lu, S.; Zhou, B. Effects of intermediates on ascorbic acid and oxalate. Plant Physiol. Biochem. 2005, 43, 955–962. [Google Scholar] [CrossRef]
  24. Alexieva, V.; Sergiev, I.; Mapelli, S.; Karanov, E. The effect of drought and ultraviolet radiation on growth and stress markers in pea and wheat. Plant Cell Environ. 2001, 24, 1337–1344. [Google Scholar] [CrossRef]
  25. Ames, B.N.; Shigena, M.K.; Hegen, T.M. Oxidants, antioxidants and the degenerative diseases of aging. Proc. Natl. Acad. Sci. USA 1993, 90, 7915–7922. [Google Scholar] [CrossRef] [Green Version]
  26. Khatun, S.; Ali, M.B.; Hahn, E.J.; Paek, K.Y. Cooper toxicity in Withania somnifera: Growth and antioxidant enzymes responses of In Vitro grown plants. J. Exp. Bot. 2008, 47, 259–266. [Google Scholar]
  27. Gaetke, L.M.; Chow, C.K. Copper toxicity oxidative stress and antioxidant nutrients. Toxicology 2003, 189, 163–197. [Google Scholar] [CrossRef]
  28. Garnczarska, M.; Ratajczak, L. Metabolic responses of Lemna minor to lead ions II. Induction of antioxidant enzymes in roots. Acta Physiol. Plant. 2000, 22, 429–432. [Google Scholar] [CrossRef]
  29. Sinclair, T.R.; Ludlow, M.M. Who taught plants thermodynamics? The unfulfilled potential of plant water potential. Aust. J. Plant Biol. 1985, 12, 213–217. [Google Scholar] [CrossRef]
  30. Nemecek-Marshall, M.; MacDonald, R.C.; Franzen, J.J.; Wojciechowski, C.L.; Fall, R. Methanol emission from leaves: Enzymatic detection of gas-phase methanol and relation of methanol fluxes to stomatal conductance and leaf development. Plant Physiol. 1995, 108, 1359–1368. [Google Scholar] [CrossRef] [PubMed] [Green Version]
  31. Valizadeh-Kamran, R.; Mehrabani, L.V.; Pessarakli, M. Effects of foliar application of methanol on some physiological characteristics of Lavandula stoechas L. under NaCl salinity conditions. J. Plant Nutr. 2019, 42, 261–268. [Google Scholar] [CrossRef]
  32. Safarzade Vishkaei, M. Effect of Methanol on Growth and Yield of Peanut. Ph.D. Thesis, Islamic Azad University, Science and Research Branch. Tehran, Iran, 2007; 270p. [Google Scholar]
  33. Lee, H.S.; Madhaiyan, M.; Kim, C.W.; Choi, S.J.; Chung, K.Y.; Sa, T.M. Physiological enhancement of early growth of rice seedlings (Oryza sativa L.) by production of phytohormone of N 2-fixing methylotrophic isolates. Biol. Fertil. Soils 2006, 42, 402–408. [Google Scholar] [CrossRef]
  34. Staler, S.O.; Thimann, K.V. The Influence of aliphatic alcohols on leaf senescence. Plant Physiol. 1980, 66, 395–399. [Google Scholar] [CrossRef] [PubMed] [Green Version]
  35. Ramberg, H.A.; Bradley, J.C.; Olson, J.S.C.; Nishio, J.N.; Markwell, J.; Osterman, J.C. The role of methanol in promoting plant growth: An update. Rev. Plant Biochem. Biotechnol. 2002, 1, 113–126. [Google Scholar]
  36. Ramírez, I.; Dorta, F.; Espinoza, V.; Jiménez, E.; Mercado, A.; Peña-Cortés, H. Effects of Foliar and Root Applications of Methanol on the Growth of Arabidopsis, Tobacco, and Tomato Plants. J. Plant Growth Regul. 2006, 25, 30–44. [Google Scholar] [CrossRef]
  37. Devlin, M.; Bhowmik, P.C.; Karczmarczyk, S.J. Influence of methanol on plant germination and growth. Plant Growth Regulation. Soc. Am. Q. 1994, 22, 102–108. [Google Scholar]
  38. Faver, K.L.; Gerik, T.J. Foliar-applied methanol effects on cotton (Gossypium hirsutum L.) gas exchange and growth. Field Crops Res. 1996, 47, 227–234. [Google Scholar] [CrossRef]
  39. Sadeghi-Shoae, M.; Paknejad, F.; Kashani, A.; Vazan, S.; Nooralvandi, T. Methanol and its period of foliar application on sugar beet in different available water. In Proceedings of the Conference on International Research on Food Security, Natural Resource Management and Rural Development, Göttingen, Germany, 19–21 September 2012. [Google Scholar]
  40. Paknejad, F.; Mirakhori, M.; Jami Al-Ahmadi, M.; Tookalo, M.R.; Pazoki, A.R.; Nazeri, P. Physiological Response of Soybean (Glycine max) to Foliar Application of Methanol under Different Soil Moistures. Am. J. Agric. Biol. Sci. 2009, 4, 311–318. [Google Scholar] [CrossRef] [Green Version]
  41. Paknejad, F.; Bayat, V.; Ardakani, M.R.; Vazan, S. Effect of Methanol Foliar Application on Seed Yield and the Quality of Soybean (Glycine max L.) under Water Deficit Conditions. Ann. Biol. Res. 2012, 3, 2108–2117. [Google Scholar]
  42. Preedy, V. Betaine: Chemistry, Analysis, Function and Effects; Royal Society of Chemistry: Cambridge, UK, 2015. [Google Scholar]
  43. Park, E.J.; Jeknic, Z.; Chen, T.H. Exogenous application of glycine betaine increases chilling tolerance in tomato plants. Plant Cell Physiol. 2006, 47, 706–714. [Google Scholar] [CrossRef] [PubMed] [Green Version]
  44. Ashraf, M.; Foolad, M. Roles of glycine betaine and proline in improving plant abiotic stress resistance. Environ. Exp. Bot. 2007, 59, 206–216. [Google Scholar] [CrossRef]
  45. Mäkelä, P.; Kärkkäinen, J.; Somersalo, S. Effect of Glycinebetaine on Chloroplast Ultrastructure, Chlorophyll and Protein Content, and RuBPCO Activities in Tomato Grown under Drought or Salinity. Biol. Plant. 2000, 43, 471–475. [Google Scholar] [CrossRef]
  46. Mäkelä, P.; Peltonen-Sainio, P.; Jokinen, K.; Pehu, E.; Setälä, H.; Hinkkanen, R.; Somersalo, S. Uptake and translocation of foliar-applied glycine betaine in crop plants. Plant Sci. 1996, 121, 221–230. [Google Scholar] [CrossRef]
  47. Dini-Andreote, F. Endophytes: The second layer of plant defense. Trends Plant Sci. 2020, 25, 4. [Google Scholar] [CrossRef] [PubMed]
  48. Skalicky, M.; Kubes, J.; Shokoofeh, H.; Arif, T.U.; Vachova, P.; Hejnak, V. Betacyanins and Betaxanthins in Cultivated Varieties of Beta vulgaris L. Compared to Weed Beets. Molecules 2020, 25, 5395. [Google Scholar] [CrossRef] [PubMed]
  49. Tilley, J.M.A.; Terry, R.A. A Two-Stage Technique for the In Vitro Digestion of Forage Crops. Grass Forage Sci. 1963, 18, 104–111. [Google Scholar] [CrossRef]
  50. Clover, G.; Smith, H.; Jaggard, K. The crop under stress. Br. Sugar Beet Rev. 1998, 66, 17–19. [Google Scholar]
  51. Paglia, D.E.; Valentine, W.N. Studies on the quantitative and qualitative characterization of erythrocyte glutathione peroxidase. J. Lab. Clin. Med. 1967, 70, 158–169. [Google Scholar] [PubMed]
  52. Lowry, O.H.; Rosebrough, N.J.; Farr, A.L.; Randall, R.J. Protein measurement with the Folin phenol reagent. J. Biol. Chem. 1951, 193, 265–275. [Google Scholar] [CrossRef]
  53. McGiffen, M.; Manthey, J.A. The role of methanol in promoting plant growth: A current evaluation. HortScience 1996, 31, 1092–1096. [Google Scholar] [CrossRef]
  54. Downie, A.; Miyazaki, S.; Bohnert, H.; John, P.; Coleman, J.; Parry, M.; Haslam, R. Expression profiling of the response of Arabidopsis thaliana to methanol stimulation. Phytochemistry 2004, 65, 2305–2316. [Google Scholar] [CrossRef]
  55. Hemming, D.J.; Criddle, R.S.; Hansen, L.D. Effects of Methanol on Plant Respiration. J. Plant Physiol. 1995, 146, 193–198. [Google Scholar] [CrossRef]
  56. Andres, R.J.; Lazaro, A.; Chueca, R.; Hermoso, L.; Gorge, L. Effect of alcohols on the association of photosynthetic fructose-1, 6-bisphosphatase to thylakoid membranes. Plant Physiol. 1990, 78, 409–413. [Google Scholar] [CrossRef]
  57. Nadali, I.; Paknejad, F.; Soghani, M.; Elahipanah, F.; Ghafari, M. Effect of methanol on yield, yield component and growth indices in chick pea. J. Crop. Ecophysiol. 2010, 2, 176–184. [Google Scholar] [CrossRef]
  58. Farshpour, A.; Sadeghi Shoae, M.; Habibi, D. Quantitative and Qualitative Yield of Fodder Beet Cultivars during Spring and Summer Cultivation in Karaj Region. Master’s Thesis, Islamic Azad University, Karaj, Iran, 2017; 109p. [Google Scholar]
  59. Zbieć, I.I.; Karczmarczyk, S.; Koszański, Z. Influence of methanol on some cultivated plants. Folia Univ. Agric. Stetin. Agric. 1999, 73, 217–220. [Google Scholar]
  60. Rowe, R.N.; Farr, D.J.; Richards, B.A.J. Effects of foliar and root applications of methanol or ethanol on the growth of tomato plants (Lycopersicon esculentum Mill.). N. Zealand J. Crop. Hortic. Sci. 1994, 22, 335–337. [Google Scholar] [CrossRef]
  61. Omer, Z.S.; Tombolini, R.; Gerhardson, B. Plant colonization by pink-pigmented facultative methylotrophic bacteria (PPFMS). FEMS Microbiol. Ecol. 2004, 46, 319–326. [Google Scholar] [CrossRef] [Green Version]
  62. Ivanova, E.G.; Doronina, N.V.; Trotsenko, Y.A. Aerobic methyl bacteria are capable of synthesizing auxins. Microbiology 2001, 70, 392–397. [Google Scholar] [CrossRef]
  63. Makhdum, M.I.; Malik, M.N.A.; Din, S.U.; Ahmad, F.; Chaudhry, F.I. Physiology response of cotton to methanol foliar application. J. Res. Sci. 2002, 13, 37–43. [Google Scholar]
  64. Khani Chegeni, A.; Sadeghi Shoae, M.; Habibi, D. Comparison of Quantitative and Qualitative Yield Response and Water Use Efficiency of Fodder Beet Cultivars under Different Irrigation Conditions. Master’s Thesis, Islamic Azad University, Karaj, Iran, 2017; 100p. [Google Scholar]
  65. Zbiec, L.; Karczmarczyk, S.; Podsiadlo, C. Response of some cultivated plants to methanol as compared to supplemental irrigation. Electron. J. Pol. Agric. Univ. 2003, 6, 1–7. [Google Scholar]
  66. Li, Y.; Gupta, G.; Joshi, J.M.; Siyumbano, A.K. Effect of methanol on soybean photosynthesis and chlorophyll. J. Plant Nutr. 1995, 18, 1875–1880. [Google Scholar] [CrossRef]
  67. Kotzabasis, K.; Hatziathanasiou, A.; Bengoa-Ruigomez, M.V.; Kentouri, M.; Divanach, P. Methanol as alternative carbon source for quicker efficient production of the microalgae Chlorella minutissima: Role of the concentration and frequence of administraion. J. Biotechnol. 1999, 70, 357–362. [Google Scholar] [CrossRef]
  68. Ghafari, S.; Sadeghi Shoae, M.; Mirhadi, M.J.; Ghasemkhan Ghajar, F. Evaluation of the Effect of Nano-Micronutrients and Growth-Promoting Bacteria on Quantitative and Qualitative Yield of Different Forage Beet Cultivars. Master’s Thesis, Islamic Azad University, Research Sciences Branch. Tehran, Iran, 2018; 140p. [Google Scholar]
  69. Koochaki, A.; Rashed Mohassel, M.H.; Nasiri, M.; Sadrabadi, R. The Physiological Basis of Crop Plants Growth and Development; Razavi Publications: Teheran, Iran, 1996. [Google Scholar]
  70. Loilier, M. Improvement of the quality of sugar root. Sucre Fr. 1981, 122, 131–140. [Google Scholar]
  71. Raza, M.A.S.; Saleem, M.F.; Shah, G.M.; Khan, I.H.; Raza, A. The exogenous application of glycine betaine and potassium for improving water relations and grain yield of wheat under drought. J. Soil Sci. Plant Nutr. 2014, 14, 348–364. [Google Scholar]
  72. Tohidi-Moghadam, H.; Shirani-Rad, A.; Nour-Mohammadi, G.; Habibi, D.; Mash-hadi-Akbar-Boojar, M. Effect of Super Absorbent Application on Antioxidant Enzyme Activities in Canola (Brassica napus L.) Cultivars under Water Stress Conditions. Am. J. Agric. Biol. Sci. 2009, 4, 215–223. [Google Scholar] [CrossRef]
  73. Amraei, B.; Paknejad, F.; Ebrahimi, M.; Sobhanian, H. Effects of methanol spraying on some biochemical and physiological characteristics of soybean (Glycine betaine max L.) under drought stress. J. Iran. Plant Eco Physiol. Res. 2017, 12, 81–94. [Google Scholar]
  74. Keles, Y.; Öncel, I. Growth and Solute Composition in Two Wheat Species Experiencing Combined Influence of Stress Conditions. Russ. J. Plant Physiol. 2004, 51, 203–209. [Google Scholar] [CrossRef]
  75. Cruz, F.J.R.; de Castro, G.L.S.; Junior, D.D.D.S.; Festucci-Buselli, R.A.; Pinheiro, H.A. Exogenous glycine betaine modulates ascorbate peroxidase and catalase activities and prevent lipid peroxidation in mild water-stressed Carapa guianensis plants. Photosynthetica 2013, 51, 102–108. [Google Scholar] [CrossRef]
  76. Prajapat, P.; Singh, D.; Tripathi, S.; Patel, K.; Abbas, H.; Patel, A. Effect of water stress on antioxidative enzymes and glycine betaine content in drought tolerant and drought susceptible cotton (Gossypium hirsutum L.) genotypes. Indian J. Biochem. Biophys. 2018, 55, 198–204. Available online: http://nopr.niscair.res.in/handle/123456789/44627 (accessed on 28 September 2021).
  77. Fu, J.; Huang, B. Involvement of antioxidants and lipid peroxidation in the adaptation of two cool-season grasses to localized drought stress. Environ. Exp. Bot. 2001, 45, 105–114. [Google Scholar] [CrossRef]
  78. Gente, R.; Busch, S.F.; Stubling, E.-M.; Schneider, L.M.; Hirschmann, C.B.; Balzer, J.C.; Koch, M. Quality Control of Sugar Beet Seeds with THz Time-Domain Spectroscopy. IEEE Trans. Terahertz Sci. Technol. 2016, 6, 1–3. [Google Scholar] [CrossRef]
  79. Hoffmann, C.M. Sucrose Accumulation in Sugar Beet Under Drought Stress. J. Agron. Crop. Sci. 2010, 196, 243–252. [Google Scholar] [CrossRef]
  80. Sadeghi-Shoae, M.; Paknejad, F.; Kashani, A.; Nooralvandi, T.; Tookalloo, M.R. Can foliar application with methanol improve the yield, yield components and physiological performance of mung bean (Vigna radiata L.). Ann. Biol. Res. 2012, 3, 4780–4785. [Google Scholar]
  81. Ali, Q.; Ahraf, M. Exogenously applied glycine betaine enhances seed and seed oil quality of maize (Zea mays L.) under water deficit conditions. Environ. Exp. Bot. 2011, 71, 249–259. [Google Scholar] [CrossRef]
  82. Kurpein, L.V.; Ivanov, A.G.; Zaman, M.; Pharis, R.P.; Hurry, V.; Huner, N.P. Interaction of glycine betaine and plant hormones: Protection of the photosynthetic apparatus during abiotic stress. In Photosynthesis: Structures, Mechanisms, and Applications; Springer: Cham, Switzerland, 2017. [Google Scholar]
  83. Outlaw, W.H. An introduction to carbon metabolism in guard cells. In Stomatal Function; Zeiger, E., Farquhar, G.D., Cowan, L.R., Eds.; Stanford University Press: Stanford, CA, USA, 1987; pp. 115–123. [Google Scholar]
Figure 1. The interaction effect of location × genotype on root yield. Means followed by the same letter(s) is/are not significantly differ at 5% level of probability.
Agronomy 11 02122 g001
Figure 2. The interaction effect of methanol × genotype on root yield. Means followed by the same letter(s) is/are not significantly differ at 5% level of probability.
Agronomy 11 02122 g002
Figure 3. The interaction effects of methanol × genotype on root dry matter yield. Means followed by the same letter(s) is/are not significantly differ at 5% level of probability.
Agronomy 11 02122 g003
Figure 4. The interaction effects of genotype × methanol on shoot dry matter yield. Means followed by the same letter(s) is/are not significantly differ at 5% level of probability.
Agronomy 11 02122 g004
Figure 5. The interaction effects of methanol × genotype on total yield. Means followed by the same letter(s) is/are not significantly differ at 5% level of probability.
Agronomy 11 02122 g005
Figure 6. The interaction effects of methanol × genotype on total DM yield. Means followed by the same letter(s) is/are not significantly differ at 5% level of probability.
Agronomy 11 02122 g006
Figure 7. The interaction effects of location × genotype on root crude protein. Means followed by the same letter(s) is/are not significantly differ at 5% level of probability.
Agronomy 11 02122 g007
Figure 8. The interaction effects of methanol × genotype on root length. Means followed by the same letter(s) is/are not significantly differ at 5% level of probability.
Agronomy 11 02122 g008
Figure 9. The interaction effect of location × genotype on catalase content.
Agronomy 11 02122 g009
Table 1. Results of the experimental farm soil from a depth of 0–60 cm. P: Parameters of the soil; U: Units; H: Hamedan (location); Q: Qom (location).
PECNaPKNH4NO3O.CpHSoil Texture
Uds∙m−1meq∙l−1mg∙kg−1mg∙kg−1mg∙kg−1mg∙kg−1%--
H1.036.3612.065685.9514.631.037.84Clay-Loam
Q1.838.928.466896.3015.820.217.82Clay
Table 2. Analysis of variance of evaluated quantitative traits. T 1: Root yield (t/ha); T 2: Root dry matter yield (t/ha); T 3: Shoot dry matter yield (t/ha); T 4: Total yield (t/ha); T 5: Total Dry Matter Yield (t/ha); A: Methanol concentration; B: Glycine betaine concentration; C: Genotypes; L: Location; ns (non-significant), * (significant at 0.05), ** (significant at 0.001).
S.O.VDFT 1T 2T 3T 4T 5
L188973.28 **2491.79 **39.01 **111,966 **3154.40 **
Block4286.8410.357.77466.3718.64
A26724.13 **187.82 **32.00 **13,072 **373.39 **
B19434.05 **235.54 **23.93 *16,480 **409.64 **
A ⨯ B21526.84 ns48.76 ns2.58 ns1065.69 ns31.84 ns
L ⨯ A2670.60 ns11.21 ns18.98 *1744.62 *49.55 *
L ⨯ B13182.89 ns92.51ns2.84 ns2443.32 ns62.92 ns
L ⨯ A ⨯ B2567.31 ns20.23 ns13.21 ns226.71 ns6.07 ns
Block(A ⨯ B)10422.0913.643.03420.6313.83
C53465.98 **100.91 **9.63 *3900.65 **123.82 **
L ⨯ C5899.52 **16.46 ns7.10 ns661.25 **11.28 *
A ⨯ C10255.04 **7.81 **7.29 *545.95 **17.18 **
L ⨯ A ⨯ C10205.89 ns7.20 ns6.61 ns447.14 ns13.70 ns
B ⨯ C5162.40 ns4.48 ns7.19 ns230.00 ns11.06 ns
L ⨯ B ⨯ C5164.69 ns3.24 ns9.32 ns290.64 ns12.99 ns
A ⨯ B ⨯ C1064.34 ns1.95 ns5.58 ns138.28 ns4.39 ns
L ⨯ A ⨯ B ⨯ C1048.64 ns2.36 ns1.59 ns50.61 ns3.40 ns
(error)13021.781.143.96140.525.19
Table 3. Mean comparison of evaluated quantitative traits. T 1: Root yield (t/ha); T 2: Root dry matter yield (t/ha); T 3: Shoot dry matter yield (t/ha); T 4: Total yield (t/ha); T 5: Total dry matter yield (t/ha); A: Methanol concentration; B: Glycine betaine concentration; C: Genotypes; L: Location; Means followed by the same letter(s) is/are not significantly differ at 5% level of probability.
T 1T 2T 3T 4T 5
L
Qom72.71 b13.07 b3.72 b92.11 b16.80 b
Hamedan113.30 a19.86 a4.57 a137.64 a24.44 a
A
Control81.85 b14.60 b3.38 b99.33 b17.99 b
15% V.V98.76 a17.45 a4.46 a122.19 a21.92 a
30% V.V98.41 a17.34 a4.60 a123.11 a21.95 a
B
Control86.40 b15.42 b3.82 b106.14 b19.24 b
4 gram99.62 a17.51 a4.48a123.61 a22.00 a
C
SBSI 05082.54 d16.50 b4.21 ab103.91 c20.71 b
SBSI 05188.52 c15.48 c4.49 ab114.19 b19.98 b
SBSI 05297.44 b17.80 a4.98 a125.06 a22.80 a
Brunium89.68 c16.73 b3.59 b106.77 bc20.32 b
Jamon89.32 c13.80 d3.80 ab109.53 bc17.60 c
Kyros110.54 a18.47 a3.83 ab129.81 a22.31 a
Table 4. Analysis of variance of evaluated quantitative and qualitative traits. T 6: Root length (cm); T 7: Root dry matter digestibility (%); T 8: Root crude protein (%); T 9: Sodium content (mg/100 g.sugar); T 10: Catalase content (u/mg.pr); T 11: Sugar content (mg/g DM); A: Methanol concentration; B: Glycine betaine concentration; C: Genotypes; L: Location; ns non-significant, * significant at 0.05, ** significant at 0.001.
S.O.VDFT 6T 7T 8T 9T 10T11
L12006.71 **152.67 **30.88 *13422.84 **23.89 **2,084,425.09 **
Block421.944.347.62 ns13.420.1139,542.03 *
A2468.65 **3.68 ns8.21 ns126.16 **2.11 **552,236.82 **
B1401.55 **0.29 ns33.50 ns151.22 **3.56 **58,666.62 *
A ⨯ B217.18 ns2.93 ns4.94 ns16.64 *0.16 **5939 *
L ⨯ A2303.53 **0.11 ns0.91 ns56.22 **0.47 **626,817.64 **
L ⨯ B188.12 ns0.001 ns0.0004 ns31.14 *2.84 *46,372.51 *
L ⨯ A ⨯ B270.06 ns0.35 ns2.73 ns36.66 **0.27 *33,186.76 *
Block (A ⨯ B)1018.311.445.976.890.079487.34
C5253.10 **18.39 **22.54 *63.73 **0.79 **204,233.34 **
L ⨯ C558.00 *13.56 **17.54 ns18.98 **0.73 **12,957.42 *
A ⨯ C1048.93 *1.11 ns5.02 ns10.92 *0.09 ns25,040.29 *
L ⨯ A ⨯ C1035.78 ns0.27 ns3.34 ns11.13 *0.26 *15,196.35 *
B ⨯ C523.96 ns0.0003 ns0.0002 ns4.85 ns0.05 ns10,650.56 *
L ⨯ B ⨯ C514.03 ns0.0001 ns0.0003 ns10.73 *0.12 *18,881.84 *
A ⨯ B ⨯ C1041.42 ns3.30 ns15.11 ns4.1 ns0.04 ns10,101.9 *
L ⨯ A ⨯ B ⨯ C1027.63 ns0.83 ns10.03 ns7.31 *0.1 *2,084,425.09 **
(error)13020.902.228.443.560.0539,542.03 *
Table 5. Mean comparison of evaluated quantitative and qualitative traits. T 6: Root length (cm); T 7: Root dry matter digestibility (%); T 8: Root crude protein (%); T 9: Sodium content (mg/100 g.sugar); T 10: Catalase content (u/mg.pr); T 11: Sugar content (mg/g DM); A: Methanol concentration; B: Glycine betaine concentration; C: Genotypes; L: Location; Means followed by the same letter(s) is/are not significantly different at the 5% level of probability.
T 6T 7T 8T 9T 10T 11
L
Qom23.71 b88.17 a10.98 b5.23 b2.25 a595.27 b
Hamedan29.81 a88.15 a12.66 a15.68 a1.58 b791.74 a
A
Control23.81 b88.38 a11.97 a11.74 c1.72 b592.64 b
15% V.V28.17 a88.33 a11.93 a14.39 a2.02 a737.61 a
30% V.V28.29 a87.77 a11.56 a13.21 b2.01 a750.26 a
B
Control25.40 b88.55 a11.86 a12.28 b1.79 b639.63 b
4 grams28.12 a87.76 a11.78 a13.95 a2.04 a747.37 a
C
SBSI 05024.47 c89.04 a12.78 a13.29 c1.91 c697.97 c
SBSI 05123.42 c87.50 ab11.36 b12.76 c1.89 c662.74 c
SBSI 05227.64 ab88.77 ab11.43 b14.72 b2.1 b795.09 a
Brunium25.75 bc88.48 ab12.70 a12.79 c1.85 c683.86 c
Jamon29.18 a86.96 b11.30 b10.92 d1.69 d574.56 d
Kyros30.09 a88.20 ab11.35 b14.20 a2.05 a746.79 b
Table 6. Mean comparison of the interaction effects of methanol ⨯ glycine betaine ⨯ genotype on the evaluated traits. T 1: Root yield (t/ha); T 2: Root dry matter yield (t/ha); T 3: Shoot dry matter yield (t/ha); T 4: Total yield (t/ha); T 5: Total dry matter yield (t/ha); T 6: Root length (cm); T 7: Root dry matter digestibility (%); T 8: Root crude protein (%); T 9: Sodium content (mg/100 g.sugar); T 10: Catalase content (u/mg.pr); T 11: Sugar content (mg/g DM); Met: Methanol; Gly: Glycine betaine.
TreatmentsT1T 2T 3T 4T 5T 6T 7T 8T 9T 10T 11
Hamedan Met 0 Gly 098.3117.273.97119.7621.2625.9393.4414.1723.561.33673.31
Hamedan Met 0 Gly 4105.1918.464.25128.0522.7127.7296.9513.5424.081.4747.90
Hamedan Met 15 Gly 0107.3518.854.34129.9423.2328.3487.2612.0318.881.56758.91
Hamedan Met 15 Gly 4135.6723.865.48165.1629.3735.7685.5012.4210.931.67938.78
Hamedan Met 30 Gly 0101.9717.844.12123.8721.9826.8781.9712.1514.601.65721.93
Hamedan Met 30 Gly 4129.9522.835.25158.2528.1434.2583.7411.6412.781.89909.59
Qom Met 0 Gly 056.7110.192.9171.8413.1118.4999.6412.074.101.95459.38
Qom Met 0 Gly 460.3410.843.1176.4513.9719.6794.3511.634.392.19489.97
Qom Met 15 Gly 073.5213.223.7693.0316.9523.9686.4110.655.272.19598.18
Qom Met 15 Gly 479.9714.374.07101.3218.4426.1784.6510.875.712.64654.58
Qom Met 30 Gly 075.6113.593.8695.7917.4924.3583.7710.435.452.04626.08
Qom Met 30 Gly 490.1616.244.62114.2120.8329.4181.1310.216.452.47743.42
Publisher’s Note: MDPI stays neutral with regard to jurisdictional claims in published maps and institutional affiliations.

