Article

Interactive Effects of Drought–Flood Abrupt Alternation on Morpho-Agronomic and Nutrient Use Traits in Rice

1
State Key Laboratory of Water Resources and Hydropower Engineering Science, Wuhan University, Wuhan 430072, China
2
Hubei Water Resources Research Institute, Wuhan 430070, China
3
Hubei Provincial Water Saving Research Center, Wuhan 430070, China
4
Key Laboratory of Water Conservancy and Water Resources of Anhui Province, Anhui & Huai River Institute of Hydraulic Research, Bengbu 233000, China
*
Author to whom correspondence should be addressed.
Agronomy 2021, 11(11), 2103; https://doi.org/10.3390/agronomy11112103
Submission received: 7 September 2021 / Revised: 14 October 2021 / Accepted: 15 October 2021 / Published: 20 October 2021

Abstract

:
The frequent occurrence of drought–flood abrupt alternation (DFAA) in Huaibei Plain has shown a great impact on local rice production. Pot experiments were performed in 2016–2018 to investigate the effects of co-occurring drought and flooding stresses on dry weight (DW), grain yield, nitrogen (N), phosphorus (P) and potassium (K) uptake and use efficiencies (NUE, PUE and KUE) in rice. The results showed that DFAA changed the accumulation of biomass and nutrients among different organs in rice. Compared with control, DFAA significantly reduced the grain yield (−29.8%) and root DW (−30.0%), but increased the DW in stem and leaf (10.2% and 9.7%). The root/shoot ratio and morphological size of the root system in DFAA-treated plants was smaller than those of drought alone and flooding alone. Under DFAA stresses, the specific absorption rate of N, P and K increased significantly (47.9%, 31.8% and 32.8%, respectively), while NUE, PUE and KUE decreased significantly (−27.9%, −10.8% and −19.7%, respectively). The decrease of nutrient use efficiencies was mainly due to the redundant growth of branches and leaves, and the key factor limiting grain yield under DFAA conditions was the effective utilization of N. Compared with the earlier drought, the subsequent flooding might have more influence on rice growth, nutrient utilization and yield formation, but the interaction of the two weakened the cumulative effect of drought and flooding. These findings provide a scientific basis for establishing a nutrient and water management system of rice cultivation under transient soil moisture conditions.

1. Introduction

In recent years, the changing weather patterns have led to extreme changes in the frequency, intensity, spatial extent and duration of rainfall [1]. These extreme events occur with increasing frequency and magnitude across the globe [2], which generally negatively affect traditional agriculture in a major way [3]. Rain-fed agriculture is particularly vulnerable to changes in weather patterns. Some areas experience severe water depletion, whereas others experience excessive rainfall, thereby resulting in flooding [4]. Inevitably, drought and flooding occur one after another in a given region, leading to transient fluctuations in soil moisture, among which, drought–flood abrupt alternation (DFAA) is the most common [5].
Generally, plants are highly plastic to various stressors [6]. Drought reduced the morphological traits such as leaf area, shoot length and vegetative growth, as well as physiological traits such as the leaf water potential and sap movement in the plants [7]. Flooding, especially complete submergence, will dramatically change the gas exchange environment of rice plants [8]. In order to get more energy resources, the internodes of plants under deep water are rapidly and substantially elongated with the help of the activated ethylene biosynthesis and the increase in gibberellin acid/abscisic acid [9]. Meanwhile, the activated ethylene also promotes the appearance of aerenchyma in the internodes and the increase in the number of adventitious roots [10]. The risk of DFAA depends not only on the scale and extent of the hazard, such as the degree and duration of drought and flooding, but also on the vulnerability and adaptability of the plant to that event, such as the size, growth rates, root–shoot ratios, grain yield and chemical constituents. As an important food crop, rice must develop some growth foraging strategies to deal with a highly variable distribution of soil moisture, such as a plastic change of root system, adjustment of crown size and distribution of nutrients. Thus, understanding the adaptive mechanism of plant growth and metabolic mechanism of nutrient accumulation in rice is important in order to implement efficient and effective water and nutrient management practices to ensure sustainable rice production systems.
Root phenotypic plasticity plays an important role in plant adaptation to various water stresses [11]. A moderate combination of drought and flooding can improve the root system. A safe alternate wetting and drying irrigation can increase root length (RL), distribution of roots in the soil, concentration of cytokines and root oxidation activity [12,13]. Alternate partial root-zone irrigation can markedly improve the development of root areas and forks [14,15]. However, some combinations of extreme drought and flooding can adversely damage root structure mainly by altering morpho-anatomical traits, physiological and biochemical processes, gene expression and metabolic regulation networks [16]. For instance, irrigation control and drainage considerably decrease root dry weight (DW), RL and root–shoot ratio at harvest, and the yield reduction for this constraint applies to different growth periods ranging from 5.7% to 23.3% [17]. Given these findings, the response of roots to DFAA water stress may be perceived as more detrimental to plants when under severe drought or heavy flooding than alternate wetting and drying irrigation and controlled irrigation and drainage. Under such adverse conditions, roots must simultaneously acquire oxygen, water and nutrients. The inability to acclimate to such soil moisture fluctuation is assumed to affect the growth and function of the root system, and the accumulation of biomass and nutrient elements.
In paddy field environments, soil moisture fluctuation alters the amount of available N (NH4+, NO3), P and K in soil [18,19]. The accumulation of these nutrients in plants, net photosynthetic rate and dry matter accumulation and distribution will then be affected [20,21,22]. Recent research on nutrient uptake and utilization of rice under water stress mainly focuses on single water stress, and the results are inconsistent [21,23,24,25]. Moderate drought stress benefits the accumulation of nutrients in rice, whereas severe drought stress is harmful to the P absorption and the K+ reflux from grain to straw during the ripening period [26]. Reddy and Mittra [27,28] reported that total N content in rice increases when the plants are completely submerged by flooding at seeding, booting or flowering stages, whereas P and K uptake shows the opposite trend. However, Setter et al. [29] argued that K content increases in the growing zone of the emerging leaf in the air under incomplete submergence conditions. The desirable N, P and K changes in plants under combined water stresses may be different from those under drought stress alone or flooding stress alone. For instance, alternate wetting and drying irrigation applied during the early stages substantially reduces tissue P and K content and redistribution to panicles in comparison with a situation when this water stress is imposed during the later growth stages, and the lowest reductions are observed in N [30]. Similarly, Cabangon et al. [31] also found that alternate wetting and drying irrigation increases total N uptake by increasing the number of N-fertilizer application splits, but not total P and total K. With the same irrigation amount, the N and P uptake of winter wheat with alternate partial root-zone irrigation is more than that with all soil area irrigation and fixed half of root area irrigation [32].
Transient soil aeration-anoxia under DFAA affects the availability of soil nutrients to rice plants [19,33]. The loss of yield under DFAA may be caused by soil permeability on the one hand and the limited availability of N, P and K on the other hand [34,35]. Evidence shows that rice cultivation with soil moisture fluctuation in China has very low fertilizer use efficiency because of the nitrification–denitrification, leaching and fixation processes [36,37]. Deep water submergence during the DFAA process, a completely oxygen-deficient environment, is very conductive to the denitrification of microorganisms and accelerates the loss of soil nitrogen [38]. Shao et al. [19] reported that controlled irrigation and drainage remarkably decreases the loss of NH4+ and NO3 in paddy soil, and the NH4+ concentration in surface water at tillering stage is higher than that at the following jointing–booting and panicle initiation stages. During the drought period, P and K may be fixed in soil and become unavailable for root uptake, but their availability increases after submergence [14]. Thus, soil moisture fluctuation may have a high P use efficiency (PUE) and K use efficiency (KUE) despite that water stress limits P and K uptake [39].
Although the effects of combined drought and flooding on rice root growth and the N, P and K uptake and utilization remain poorly understood, relevant studies on the shoot growth, grain yield and the paddy water nutrient concentrations change and loss have been reported [17,19,24,33,40,41,42,43]. Rice is known as a crop that is sensitive to drought. Under DFAA conditions, rice is firstly affected by preceding drought and then is subjected to another flooding stress. How this combined stress would ultimately affect rice root growth and nutrient uptake is uncertain, and it is important to further understand the morphological and physiological mechanisms that cause rice yield loss in order to develop theoretical and scientific solutions for drought and flood management in rice cultivation.
Thus, this study aimed (a) to reveal rice morphological (mainly focused on the root traits) and physiological (N, P and K uptake and utilization) performance under DFAA conditions, as well as in drought alone (D), flooding alone (F) and control treatments and, accordingly, (b) to evaluate the interactive effects of drought followed by flooding on morpho-agronomic and nutrient use traits in rice plants.

2. Materials and Methods

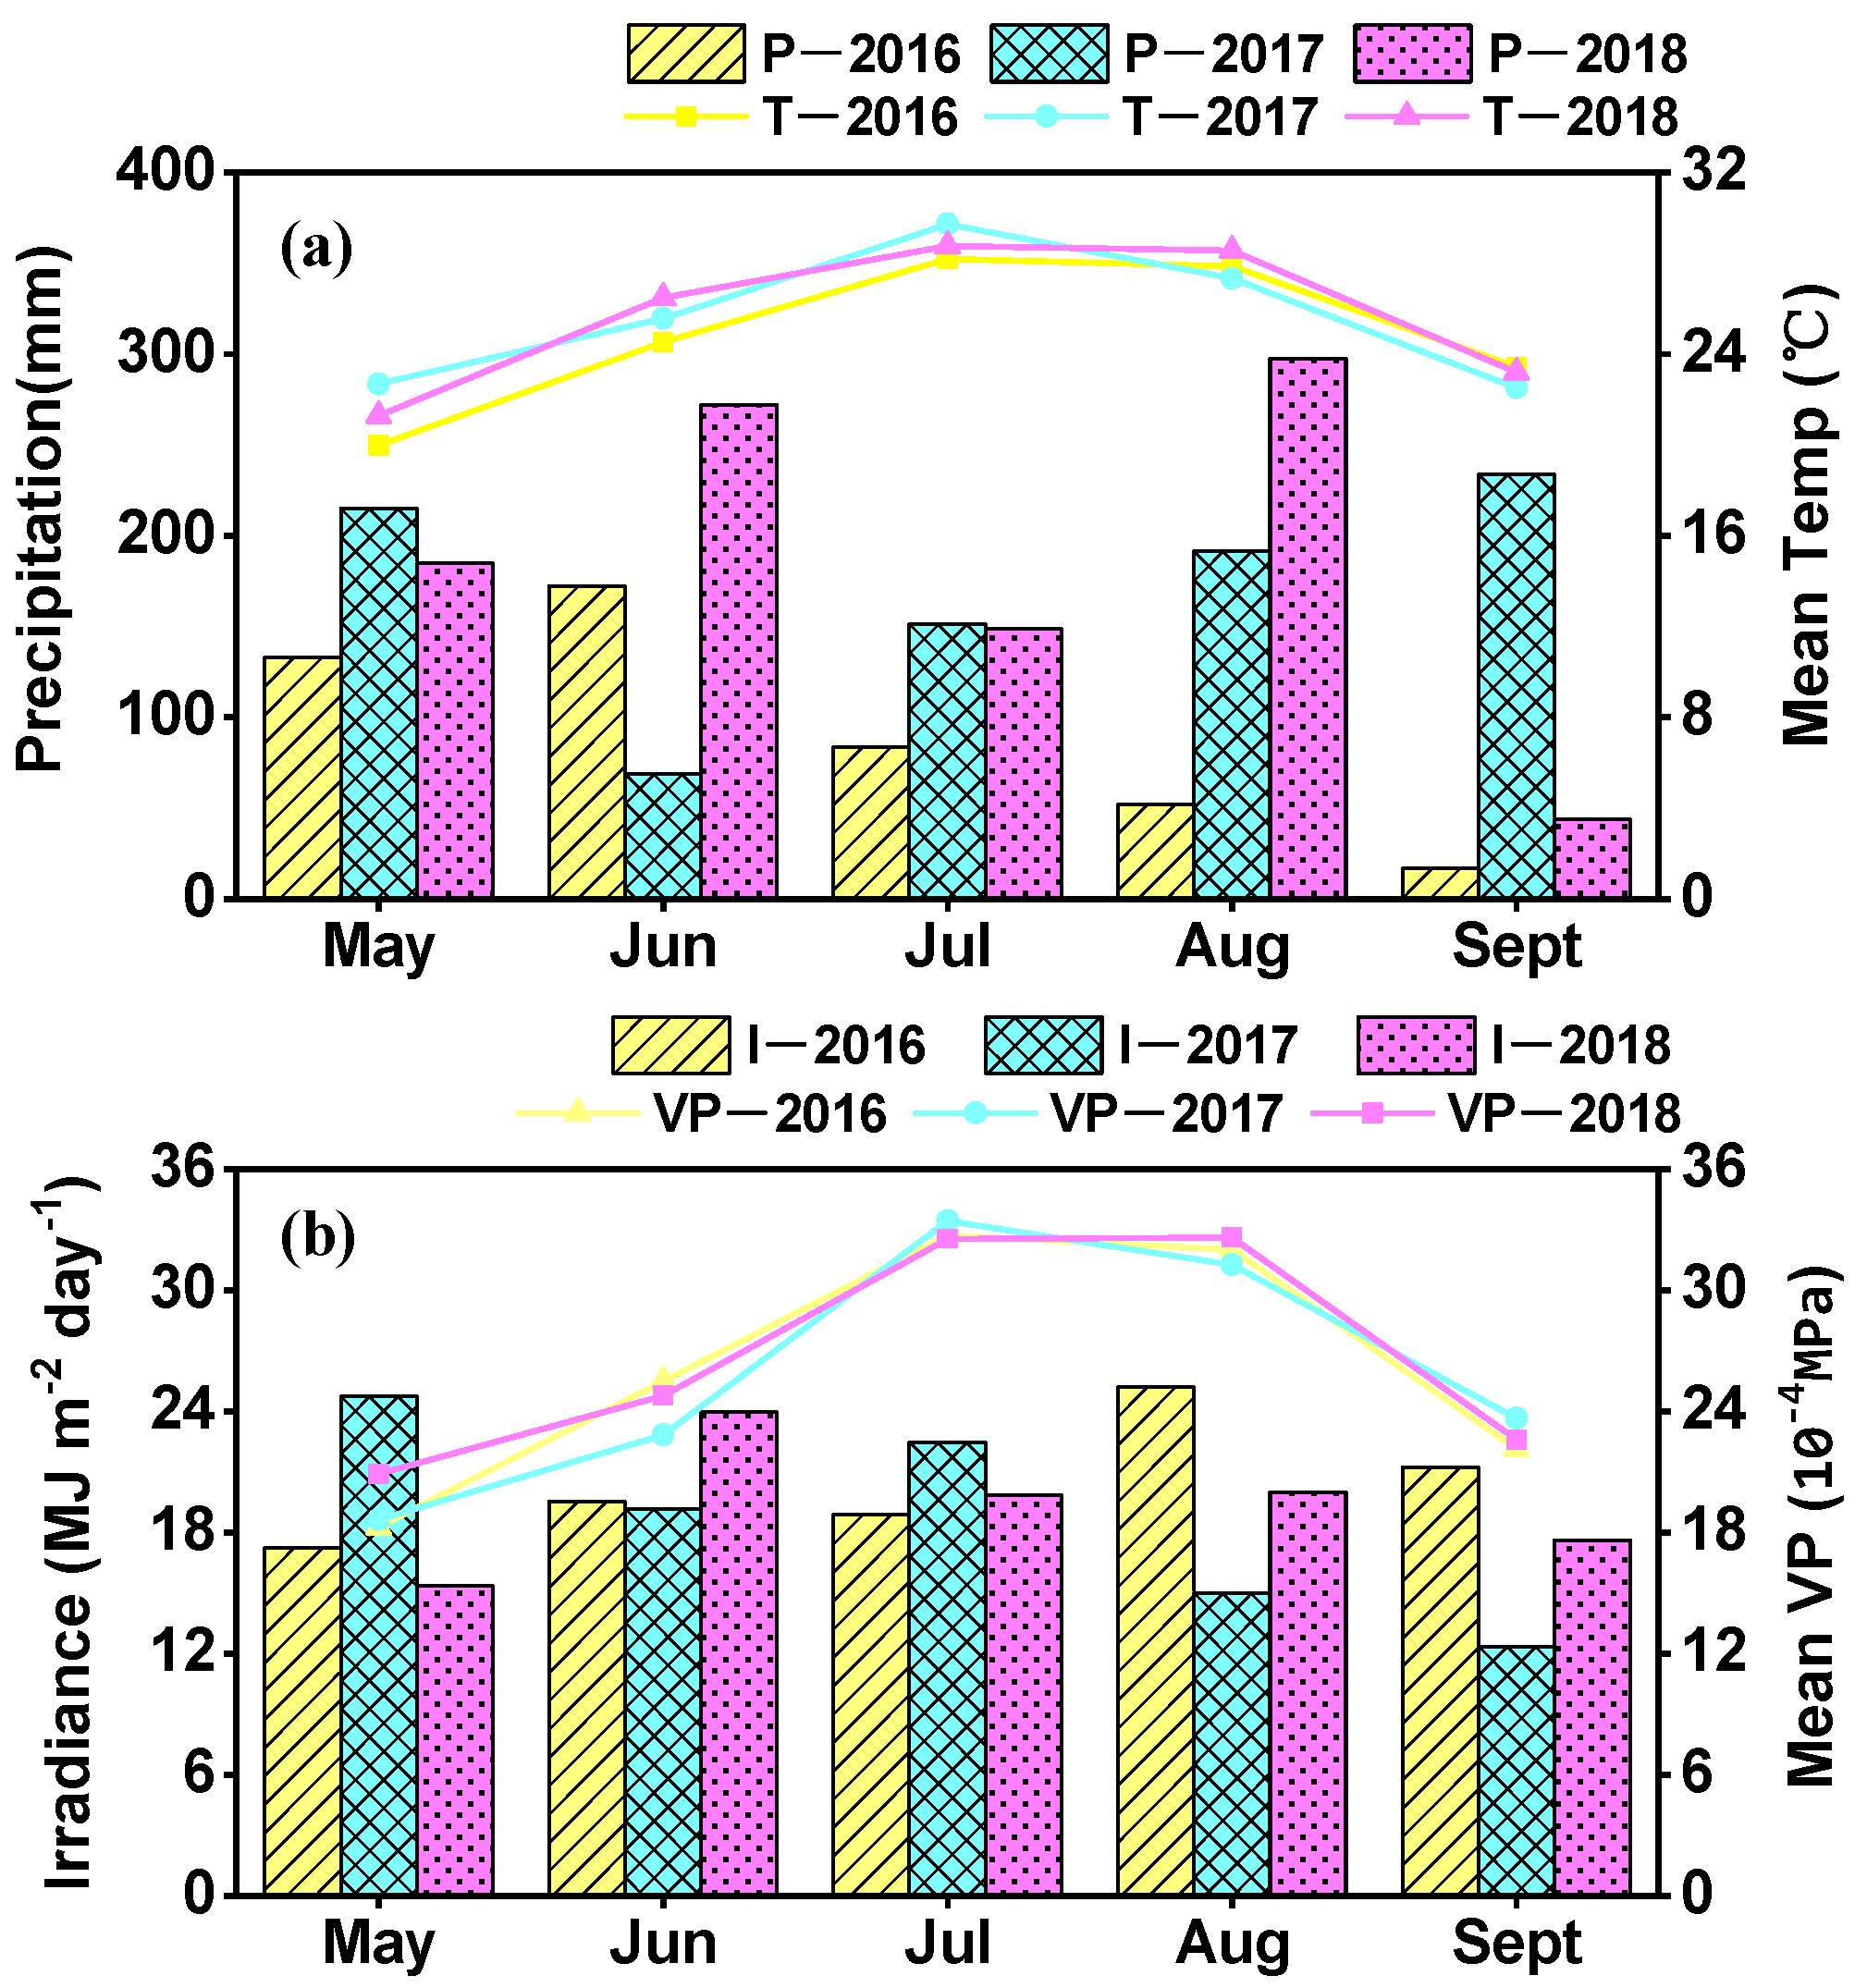
2.1. Site Description

The study site was at the Xinmaqiao Comprehensive Experiment Station of Irrigation and Drainage, Bengbu, China (117°21′34″ E, 33°08′56″ N) during the rice growing season (May to September) in 2016–2018. The annual average temperature and rainfall in this area are 14.3 °C and 911 mm, respectively. More than 60% of the rainfall is concentrated between July and September and falls in the form of torrential rain. Frequent drought is another climate defect in this region. Thus, most local crops are at a high risk of DFAA stresses. Weather data (i.e., precipitation, air temperature, irradiance and vapor pressure) were recorded daily and reported as monthly averages for the 3 years that the experiment was conducted (Figure 1).

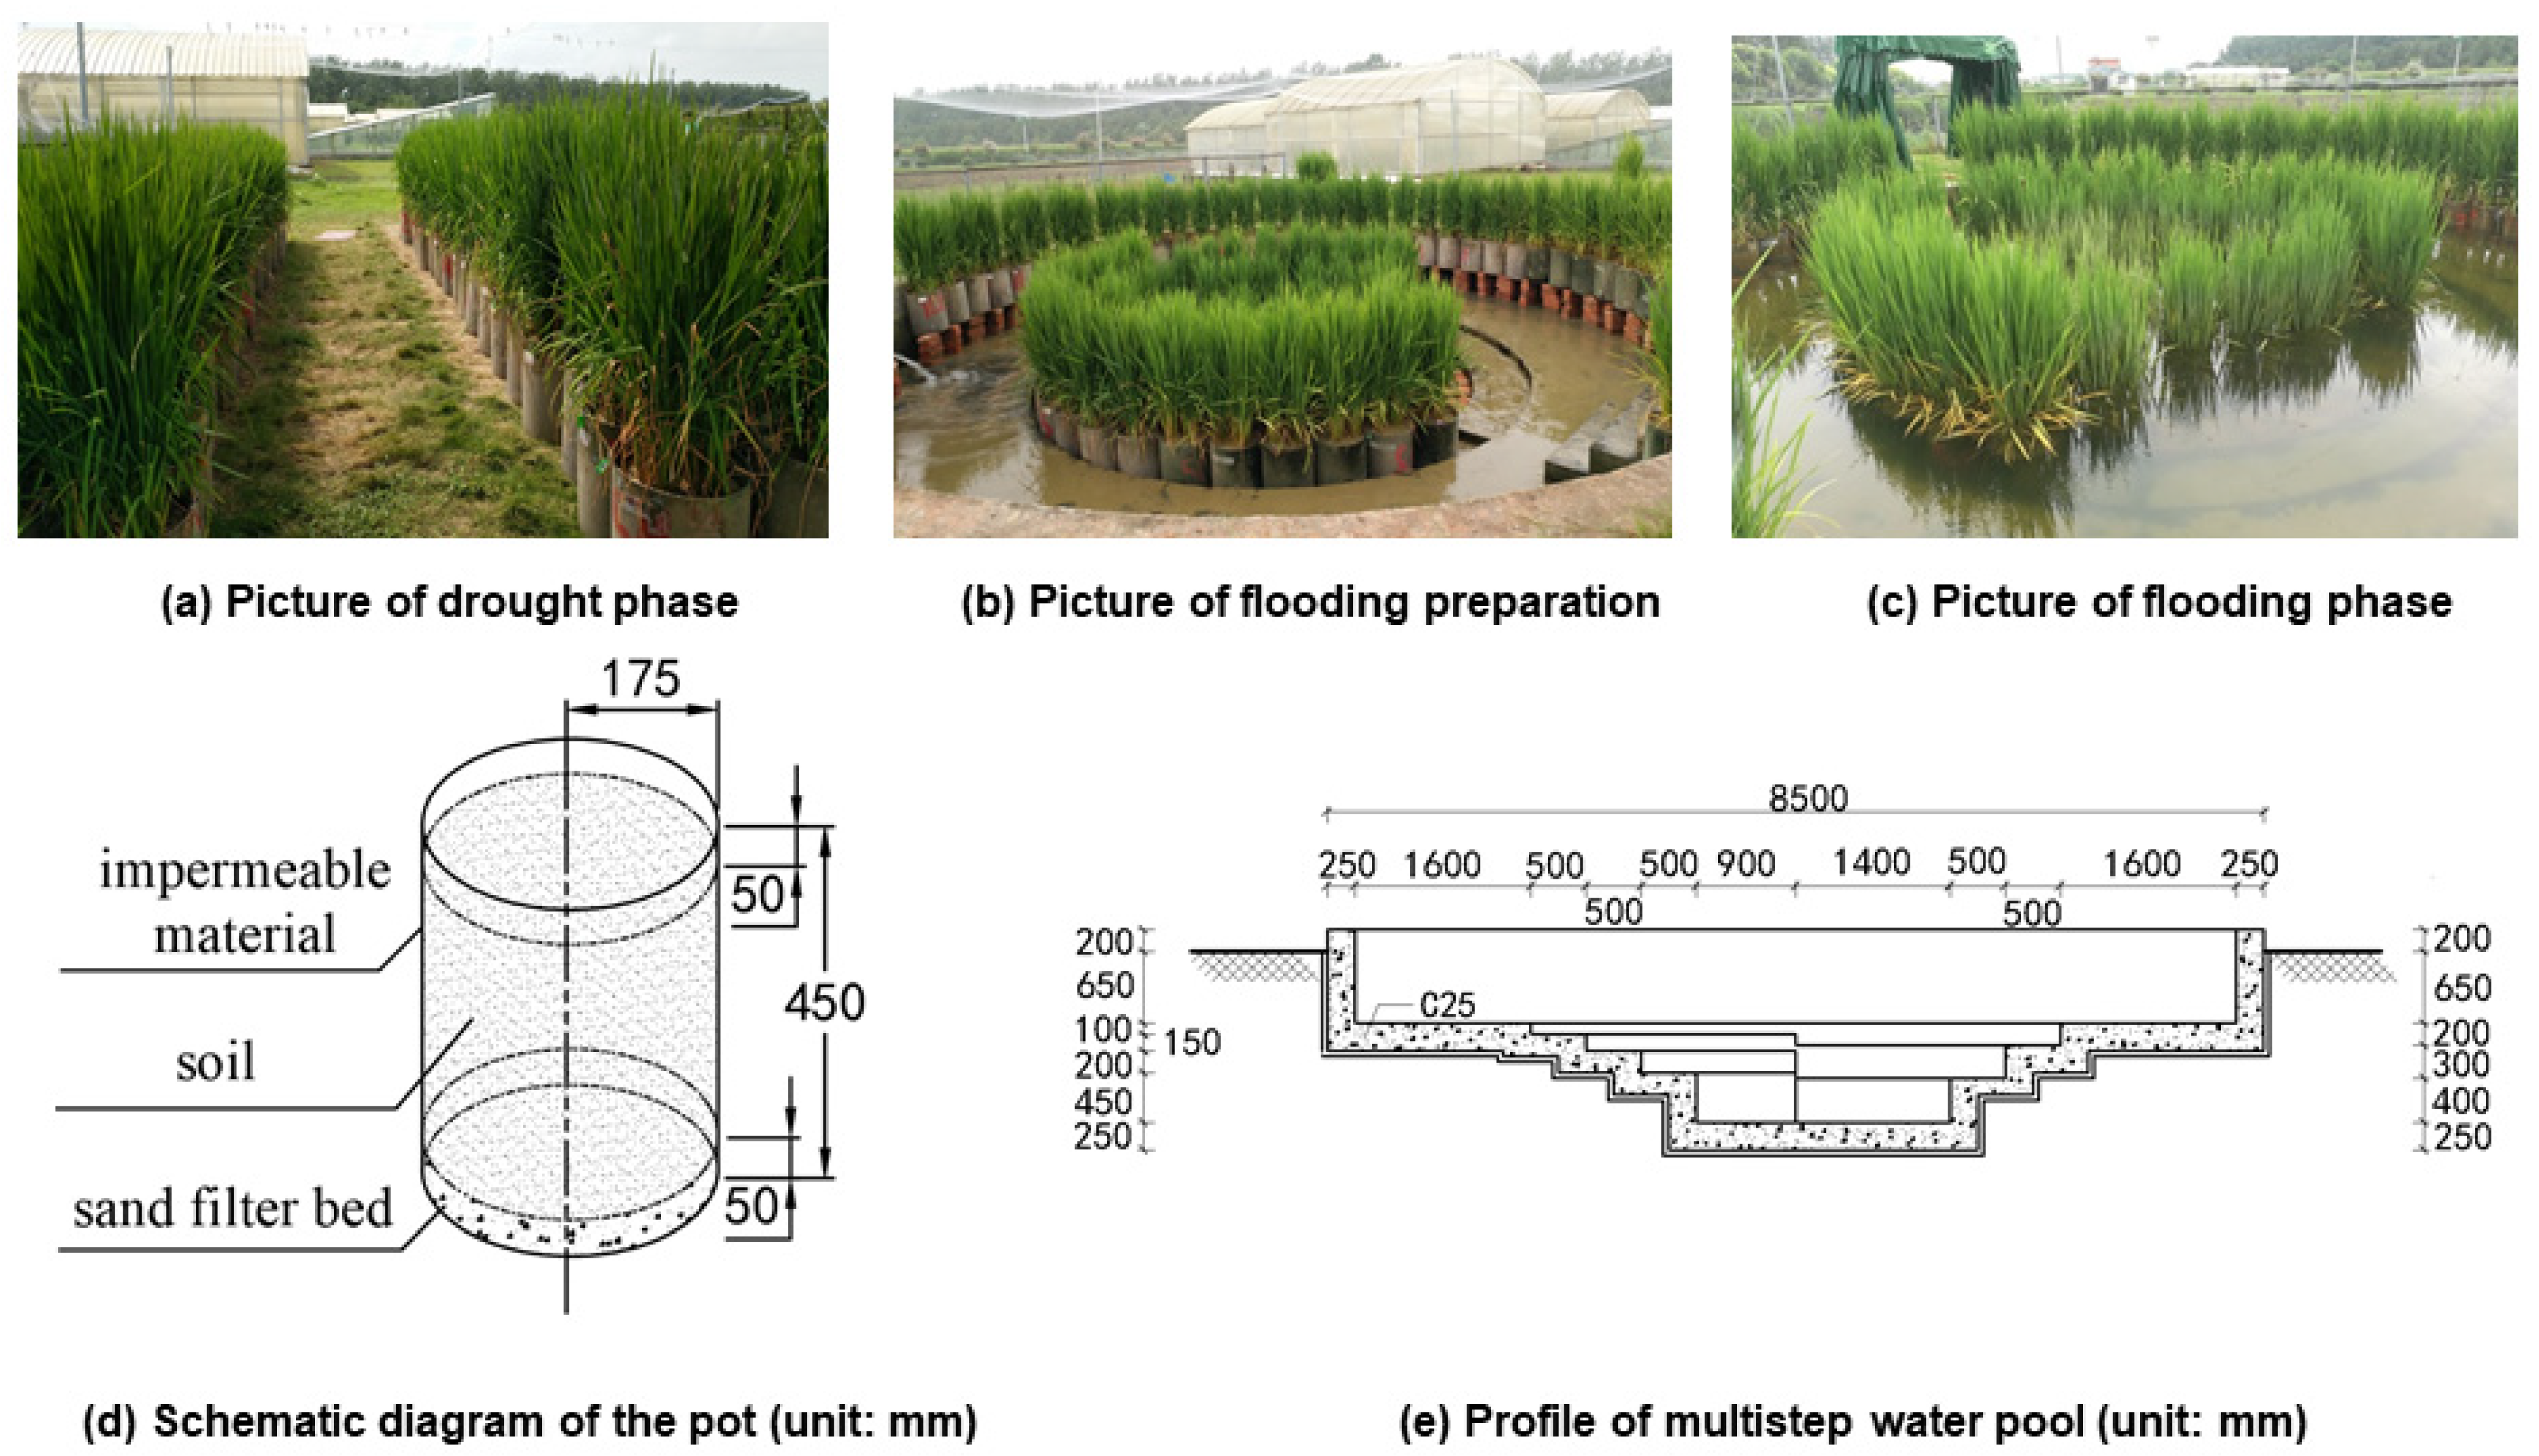
2.2. Pot Establishment and Plant Cultivation

The experiment was laid out in outdoor pots designed with three replications in each year (Figure 2). This outdoor pot experiment was carried out in a multistep circular water pool with an internal diameter of 8 m (Figure 2b,e). It was designed with seven steps of different depths to satisfy the requirements of different submergence depths. The dimensions of the experimental pots were 35 cm in inner diameter and 45 cm in height (Figure 2d). The tiny holes of 2.5 mm in the bottom of pots and the sand filter layer were composed of a water-permeable filter cloth, 3 cm coarse gravel and 2 cm fine sand from bottom to top, allowing the free seepage of water. The soil in pots was a typical black sandy loam (sub clays) containing 8.59 g kg–1 organic matter, 632.00 mg kg–1 total N, 92.11 mg kg−1 alkali-hydrolysable N, 16.10 mg kg−1 available P2O5 and 93.91 mg kg−1 available K2O. The pH of soil was 7.5. The bulk density and FC of 0–40 cm were 1.544 g cm−3 and 0.42 cm cm−3, respectively. On the south side of the pool was a movable rain shelter (8.0 m long, 8.0 m wide and 2.5 m high) that protects the drought–stressed pots from rainfall (Figure 2a).
Longliangyouhuazhan (Oryza sativa L.), a predominant local middle-season rice cultivar bred by China National Rice Research Institute was used in this study. Seeds were germinated and sown in a seedbed for approximately 30 days before they were transplanted into pots around mid-June in three years. Each pot had three hills arranged in a triangle (18 × 18 × 18 cm3), with two plants per hill. Compound fertilizer (1200 kg ha−1, N:P2O5:K2O = 15%:15%:15%) was applied one day before transplanting. Foliar spraying mixture of pesticide and fertilizer (foliar fertilizer (water soluble fertilizer containing amino acid, amino acid ≥ 100 g/L, Zn (Zinc) + B (Boron) ≥ 20 g/L, Henan dingpin chemical products Co., Ltd., China, 525 g ha−1) + cyantraniliprole (300 g ha−1) + pyraclostrobin (150 g ha−1) and fipronil (450 mL ha−1)) was applied on 15 July and September 7 to control insects and diseases. All of the other management practices followed the local farming methods during the entire growth period.

2.3. Experimental Design and Management

Based on the analysis of DFAA historical data [44,45], this experiment designed four soil moisture control methods (Table 1) for rice jointing–booting stage when DFAA easily occurs according to China’s drought-grading, drainage standards and some references [46,47], as follows:
(1)
Control treatment (without water stress), keeping 2–3 cm water level above the soil surface;
(2)
Nine DFAA treatments, combined with drought degree (50%, 60% and 70% of field capacity (FC)), drought duration (5, 10 and 15 days), flooding degree (1/2, 3/4 and 1/1 of plant height) and flooding duration (5, 7 and 9 days) according to the standard orthogonal table (L9 (34));
(3)
Nine drought alone treatments, drought stage following the same as DFAA treatments and the other stages following the same as the control treatment;
(4)
Nine flooding alone treatments, flooding stage following the same as DFAA treatments and the other stages following the same as the control treatment.
Only six drought alone treatments and six flooding alone treatments were set up in 2016 because of the limited number of pots. Thus, 28 treatments were performed in 2017–2018, and 22 treatments were performed in 2016 with the absence of D4–6 and F4–6.
The entire process of water control was divided into three phases, that is, drought phase (Stage I), flooding phase (Stage II, Table 1) and recovery phase (Stage III). At the beginning, all pots (66 in 2016 and 84 in 2017–2018) were on the furthest step from the center of the water pool, maintaining 2–3 cm water level above the soil surface. Approximately 25–35 days after transplantation, parts of pots (45 in 2016 and 54 in 2017–2018) were shifted onto the shore of the pool for drought. Their weights were recorded at 6 a.m. and 6 p.m. daily. Water was added to the pots until the control requirements of drought pots were met (Table 1). After drought (the beginning of flooding), these pots were moved to the corresponding rings from the border to the center of the pool, using bricks (235 mm long × 115 mm wide × 53 mm height) to adjust the designed depths of flooding (Figure 2b). At the end of flooding, all pots were returned to the farthest step from the center. The water table of the pool was measured at 9 a.m. daily, and water was added into or drained out as required. The experiment was repeated in 2016–2018 with only slight variation in water stress time per year, and three duplicate pots were used in each treatment excluding those destroyed at the end of DFAA, when each treatment had two additional duplicate pots to observe the growth indicators after water stresses. The pots were randomized complete block design according to the experiment design (Table 1).

2.4. Sampling and Measurements

2.4.1. Shoot and Root Sampling

At the end of DFAA (Table 1) and at maturity (28 September 2016; 20 September 2017; 15 September 2018), rice shoot and root samples were collected. Shoot samples were divided into three parts: stems (containing both stem and leaf sheath), leaves (only leaf blade) and panicles. The number of panicles per pot, spikelets per panicle and grain yield were then examined. The unfilled (without developed grains) and filled (with developed grains) spikelets were counted separately. Then, filled grains (FGs) were computed as the ratio of filled spikelets and total number of spikelets.
Root samples in the entire soil column (0–40 cm soil zone) were carefully collected and flushed. The soil samples were carefully transferred into a screen bag with a 2 mm aperture and were flushed using a hose from the tap at low pressure [48]. The maximum root depth was measured with a ruler, and the adventitious root numbers were estimated manually. All of the collected roots were washed free of soil and dirt in a trough with running water. The cleaned fresh roots were then stored in a solution of formaldehyde–acetic acid–70% ethanol (1:1:18 ratio by volume) for preservation and further measurements. To measure the RL, root surface area (RSA), root volume (RV) and root mean diameter (RMD), we arranged the roots, floated them on shallow water (2.0 mm) in a transparent rectangular tray (250 mm × 200 mm × 20 mm, thickness of 4.5 mm), scanned them using the Epson Perfection V800 Photo Scanner (8.5” × 11.7”, 216 × 297 mm, 6400 dpi × 9600 dpi) and analyzed the images by using WinRHIZO Pro2015a software (Regent Instrument Inc., Quebec, Canada). All shoot and root samples were oven dried at 75 °C for 48 h before dry weights (DWs) were recorded. The root/shoot ratio (g g−1), RL density (the ratio of RL and soil column volume, cm cm−3), specific RL (SRL, the ratio of RL and root DW, m g−1) and S/V ratio (RSA/RV ratio, cm2 cm−3) were calculated.

2.4.2. Chemical Analysis and Calculation

Oven-dried samples (root, stem, leaf and panicle) were ground in the laboratory using a Wiley hammer mill with 1 mm mesh size. The samples were analyzed for N, P and K concentration. The determination of nutrients was obtained by acid-wet digestion method [49]. During digestion, the 0.25 g ground samples were transferred to a clean 100 mL digestion flask, and 5 mL concentrated sulfuric acid (H2SO4) was added to each digestion bottle. After 2 h, 2 mL of 50% hydrogen peroxide (H2O2) was added. The flasks were heated at 285 °C for 45 min, and then allowed to cool. This process was repeated three times to make the digestion clear (colorless). The flasks were then removed from the digestion block, cooled to room temperature and made up to 100 mL with distilled water filtered through filter paper (Whatman no. 1). The digested samples were stored in plastic vials before analysis for N, P and K. N and P were determined with an auto analyzer (Smartchem 200) (reagent dosage, 3.0 uL–300 uL; spectral range, 420 nm–880 nm; Alliance, France) following the Kjeldahl method [50] and molybdo-vanado-phosphate method [51], respectively, while K was determined using a flame spectrophotometer (FP6410, INESA Scientific Instrument CO., Ltd., Shanghai, China) [52].
The accumulation (mg pot−1) of N, P and K in root, stem, leaf and panicle was computed as the product of the concentration multiplied by the tissue DW. The specific absorption rate (SAR, mg g−1 root DW) was calculated as the ratio between total nutrient accumulation in plant and root DW [53]. N use efficiency (NUE, g grain mg−1 N) was calculated as the ratio of grain yield and plant total N content [54]. PUE and KUE were calculated via the same method.

2.5. Statistical Analysis

Variance and correlation analyses were performed using the SPSS 21.0 statistical analysis package (IBM, Chicago, IL, USA). Data from each sampling date were analyzed separately. Analysis of variance (ANOVA) was used to determine the significance of the differences between the means of different treatments on the morpho-agronomic and nutrient use related properties. Then sources of variation due to replication, year, drought, flooding, interactions of drought × flooding and interactions of year × drought, year × flooding and year × drought × flooding were analyzed. When a significant difference was found, a least significant difference (LSD) test was used to compare the treatment means. The means were considered to be significantly different at p < 0.05. Pearson’s correlation coefficient (r) was used to reveal the relationships among main root traits, grain yield, total nutrient uptake, specific absorption rates and nutrient use efficiencies in a combined analysis of data over the three years.
In the practice of different water stresses, it is crucial to establish and apply the relationship between water stress intensity and plant characters. Therefore, a commonly used method called crop relative growth stress index (RGSI) [55] was adopted in the present work and calculated as follows:
R G S I = X w s t X c o n
where R G S I is the relative growth stress index, and X w s t and X c o n are the water stresses and control growth characters, respectively, in this study. Thus, the loss ratio of a crop (RR) can be calculated as follows:
R R = ( 1 R G S I ) × 100 % = ( 1 X w s t X c o n ) × 100 %

3. Results

3.1. Morpho-Agronomic Traits

3.1.1. Biological Yield

Statistical analyses showed significant differences (p < 0.01) in biomass (root, stem, leaf and panicle), grain yield and its components (spikelets per panicle and FGs) among different drought levels, flooding levels and drought × flooding interactions in 2016–2018. Only panicle numbers under different water levels were not significant (Supplementary Table S1). These traits were not significant (p > 0.05) among year × drought levels. However, among year levels, year × drought levels, year × flooding levels and year × drought levels × flooding levels, those characters apart from the DWs of root, stem and leaf, as well as panicle numbers were significant (p < 0.05), which might be due to the increased precipitation, mean air temperature, sunshine hours and mean vapor pressure in July in 2017 and 2018 (Figure 2), leading to the early appearance of panicles. This condition increased the probability of a decrease in spikelets per panicle and seed setting rates during the later stage of growth (Table 2).
Drought and flooding caused interactive effects on the reduction of rice biomass production (Table 2). Three kinds of water stresses (D, F and DFAA) had significant inhibition effects (p < 0.05) on the accumulation of dry matter in root and shoot. On average, the total DW of D, F and DFAA treatments decreased by approximately 9.9%, 5.3% and 9.0%, respectively. Root DW of D, F and DFAA treatments decreased by approximately 20.7%, 16.4% and 30.0%, whereas shoot DW decreased by approximately 9.3%, 4.7% and 7.7%, respectively, compared with the treatment of control. Among different combinations of drought and flooding, the reduction effect of mild drought + light flooding (e.g., DFAA7) on total DW was less than that of severe drought + heavy flooding (e.g., DFAA2). A higher stem DW was observed in F and DFAA treatments by 32.5% and 10.2% compared with control treatment, while for D treatments, stem DW decreased by 12.2%. The reduction in the root DW was significant (p < 0.05) in most cases, except for individual treatments in which waterlogging was less severe, such as in DFAA3, F7 and F9. Compared with the two other water stresses (D and F), DFAA decreased the root DW level by approximately 11.8% and 16.3%, respectively, indicating that the subsequent flooding caused superimposed damage to the pre-drought stressed roots. Notably, sudden increased root DW in F7 and F9 revealed the existence of overcompensation effects after mild flooding (Table 2).
Differences in root DW and shoot DW among different water treatments led to a significant difference in root/shoot ratios (p < 0.05; Supplementary Table S1). By contrast, DFAA reduced the root/shoot ratio most (−23.8%, on average compared with control), followed by D (−12.6%) and F (−11.85%), indicating that the subsequent flooding did not compensate for the effects of preceding drought on the balance of root and shoot growth, but rather further aggravated such effects.
Among different plant parts, root DW partitioning was lower under the DFAA treatments (4.3%) than under the control treatment (5.6%). Comparable values were found in the root DW partitioning between D (4.92%) and F (4.93%) treatments and in the Panicle DW partitioning between D (43.7%) and control (43.5%) treatments. Remarkable increases were detected in stem and leaf DW partitioning among DFAA and F treatments, while that of D treatments was the opposite. Compared with control, DFAA and F treatments decreased DW distribution in the panicle by 9.4% and 29.0%, while D treatments increased by 0.2%.
All three water stresses (D, F and DFAA) tended to reduce the grain yield of rice, among which F had the greatest reduction effect (−42.8%), followed by DFAA (−29.8%) and D (−9.8%). The loss of yield under water stress may be directly related to the reduction of the number of spikelets per panicle (−31.1%, −22.8% and −35.3% for DFAA, D and F, respectively). Drought alone increased the number of filled grains by 11.0%, whereas the flooding alone decreased it by 15.1%. The co-incorporated environments of drought and flooding contributed to an increase of 2.8% in the proportion of filled grains under DFAA treatments (Table 2).

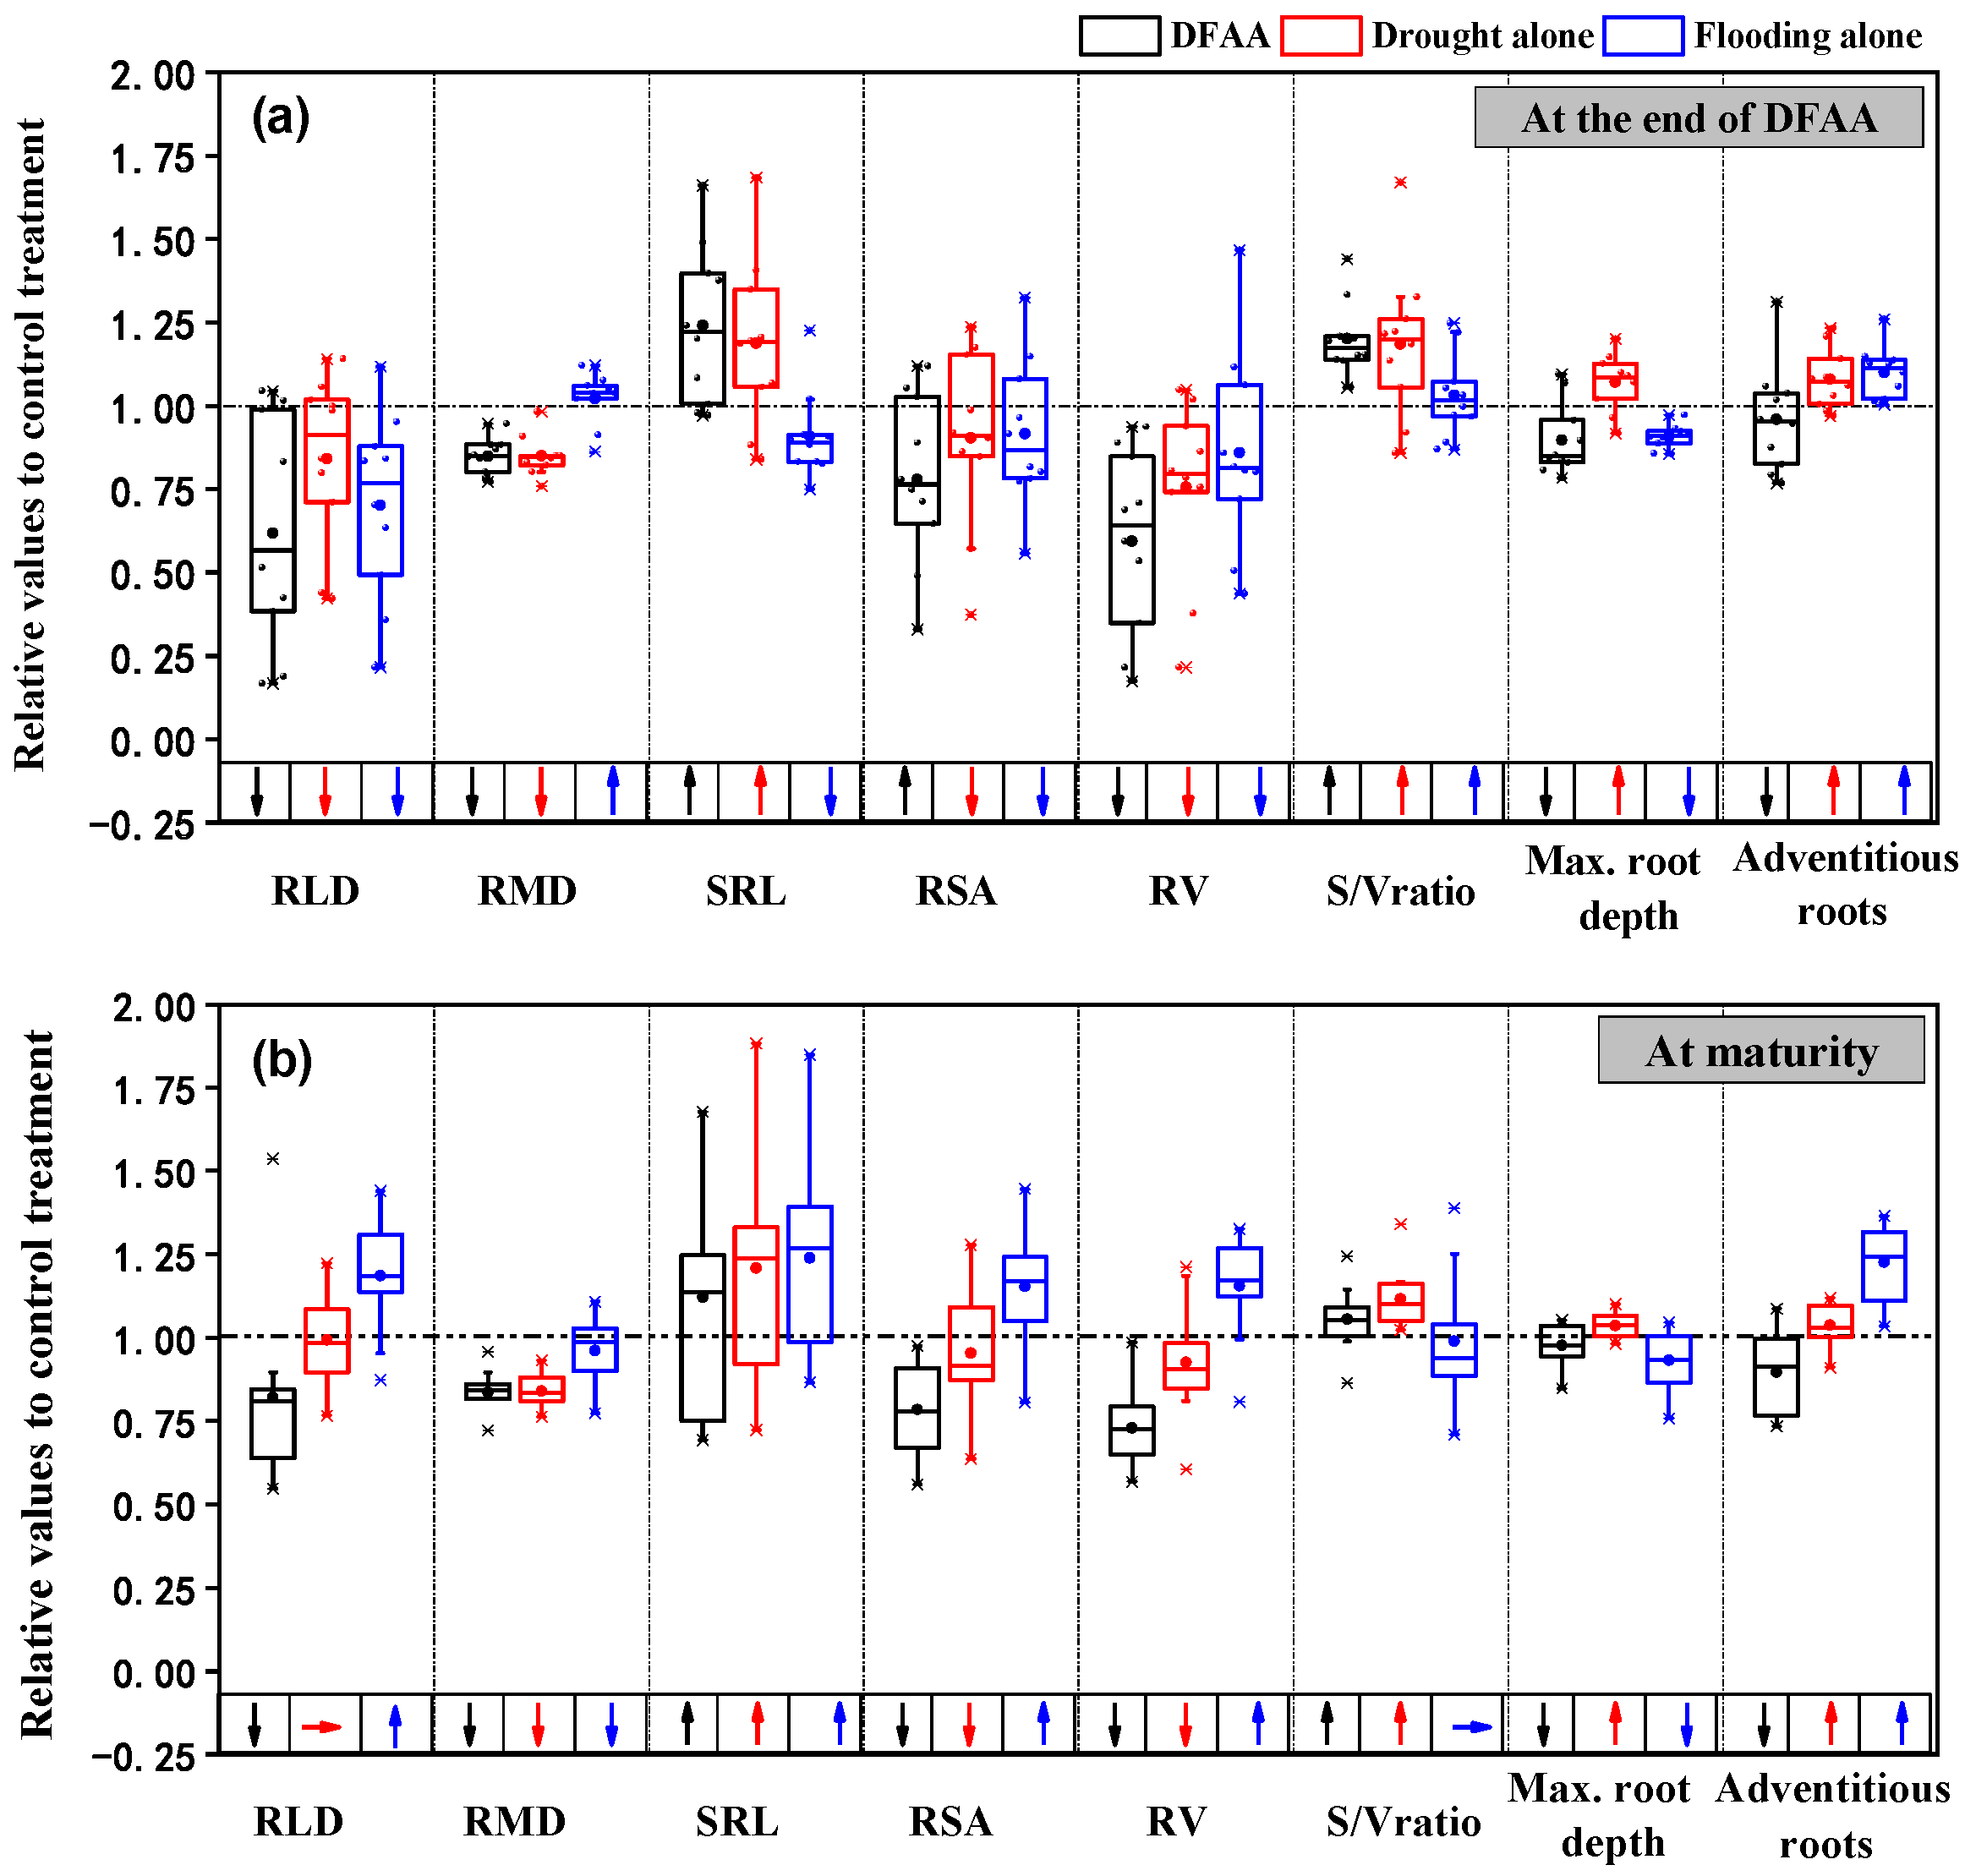
3.1.2. Root Morphology

RLD, RMD, SRL, RSA, RV, S/V ratio and maximum root depth and adventitious root numbers showed significant differences (p < 0.05) under different water stresses (Figure 3). Compared with control treatment, water stresses significantly inhibited root morphological growth, for example, RLD treated by DFAA, D and F decreased by 38.2%, 15.8% and 29.7% respectively at the end of water stress, and 18.0%, 0.7% and −18.5% respectively at maturity (Figure 3a). The effects were prominent under prolonged drought + long-term deep flooding conditions (e.g., DFAA9). While SRL treated by DFAA, D and F increased by an average of 24.1%, 18.7% and −9.2% respectively at the end of water stress, and 12.1%, 20.9% and 23.9% respectively at maturity (Figure 3a,b). This finding may be attributed to the reduced RMD as it contributes to the increased RL per unit root biomass. The subsequent flooding failed to compensate for the effects of previous droughts on RMD, especially when the severe drought lasted too long, such as in DFAA3.
The changes of RSA, RV and adventitious root numbers were consistent with that of RLD (Figure 3). Regression analysis indicated that RSA was significantly correlated with root DW, RL and adventitious root numbers (r = 0.564**, 0.825**, 0.459**, n = 78). Under the same drought degree (%FC, such as D1, D2 and D3), RSA first increased and then decreased, and RV always decreased, but adventitious root numbers had non-significant difference with prolonged drought duration. Under incomplete flooding conditions, RSA, RV and the number of adventitious roots increased at maturity. However, under complete submergence (e.g., F9), RSA and RV increased, but the number of adventitious roots decreased. As for the maximum root depth, D increased it by 7.2% at the end of water stresses, whereas DFAA and F decreased it by 10.3% and 9.3% (Figure 3a). There was no significant difference (p > 0.05) found between DFAA and F treatments, indicating that drought stress promoted the development of deep roots, while flooding stress limited it.

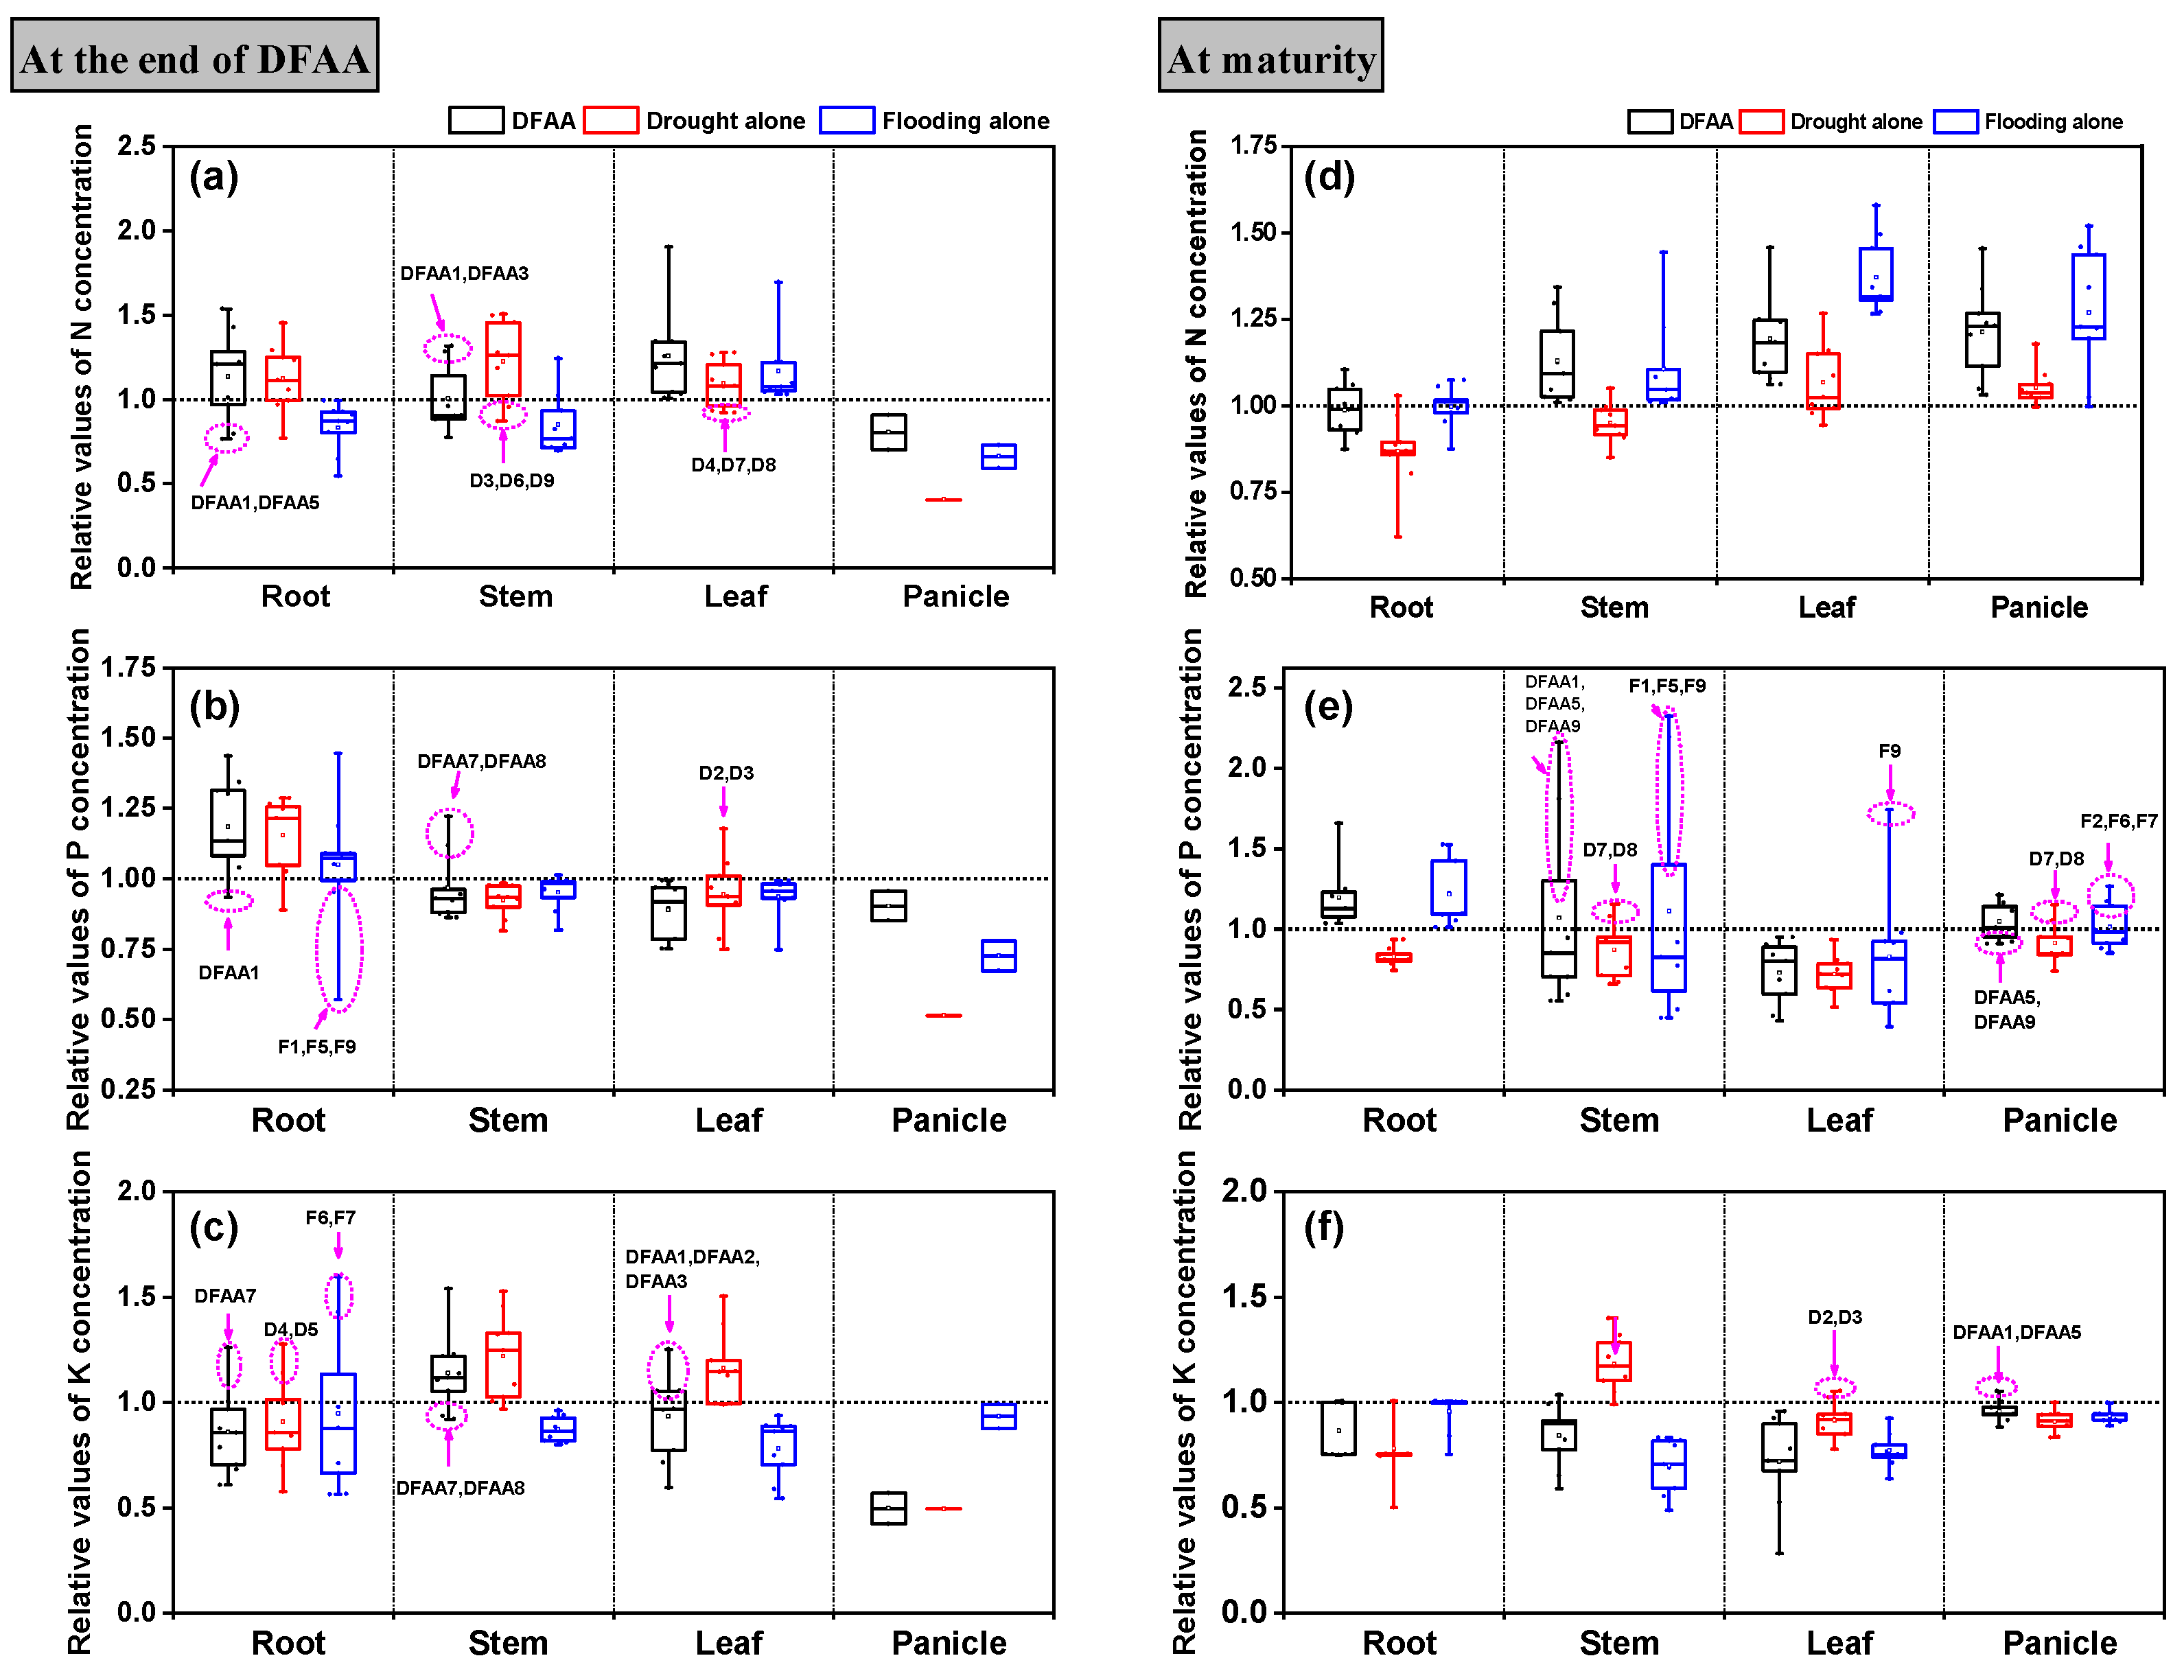
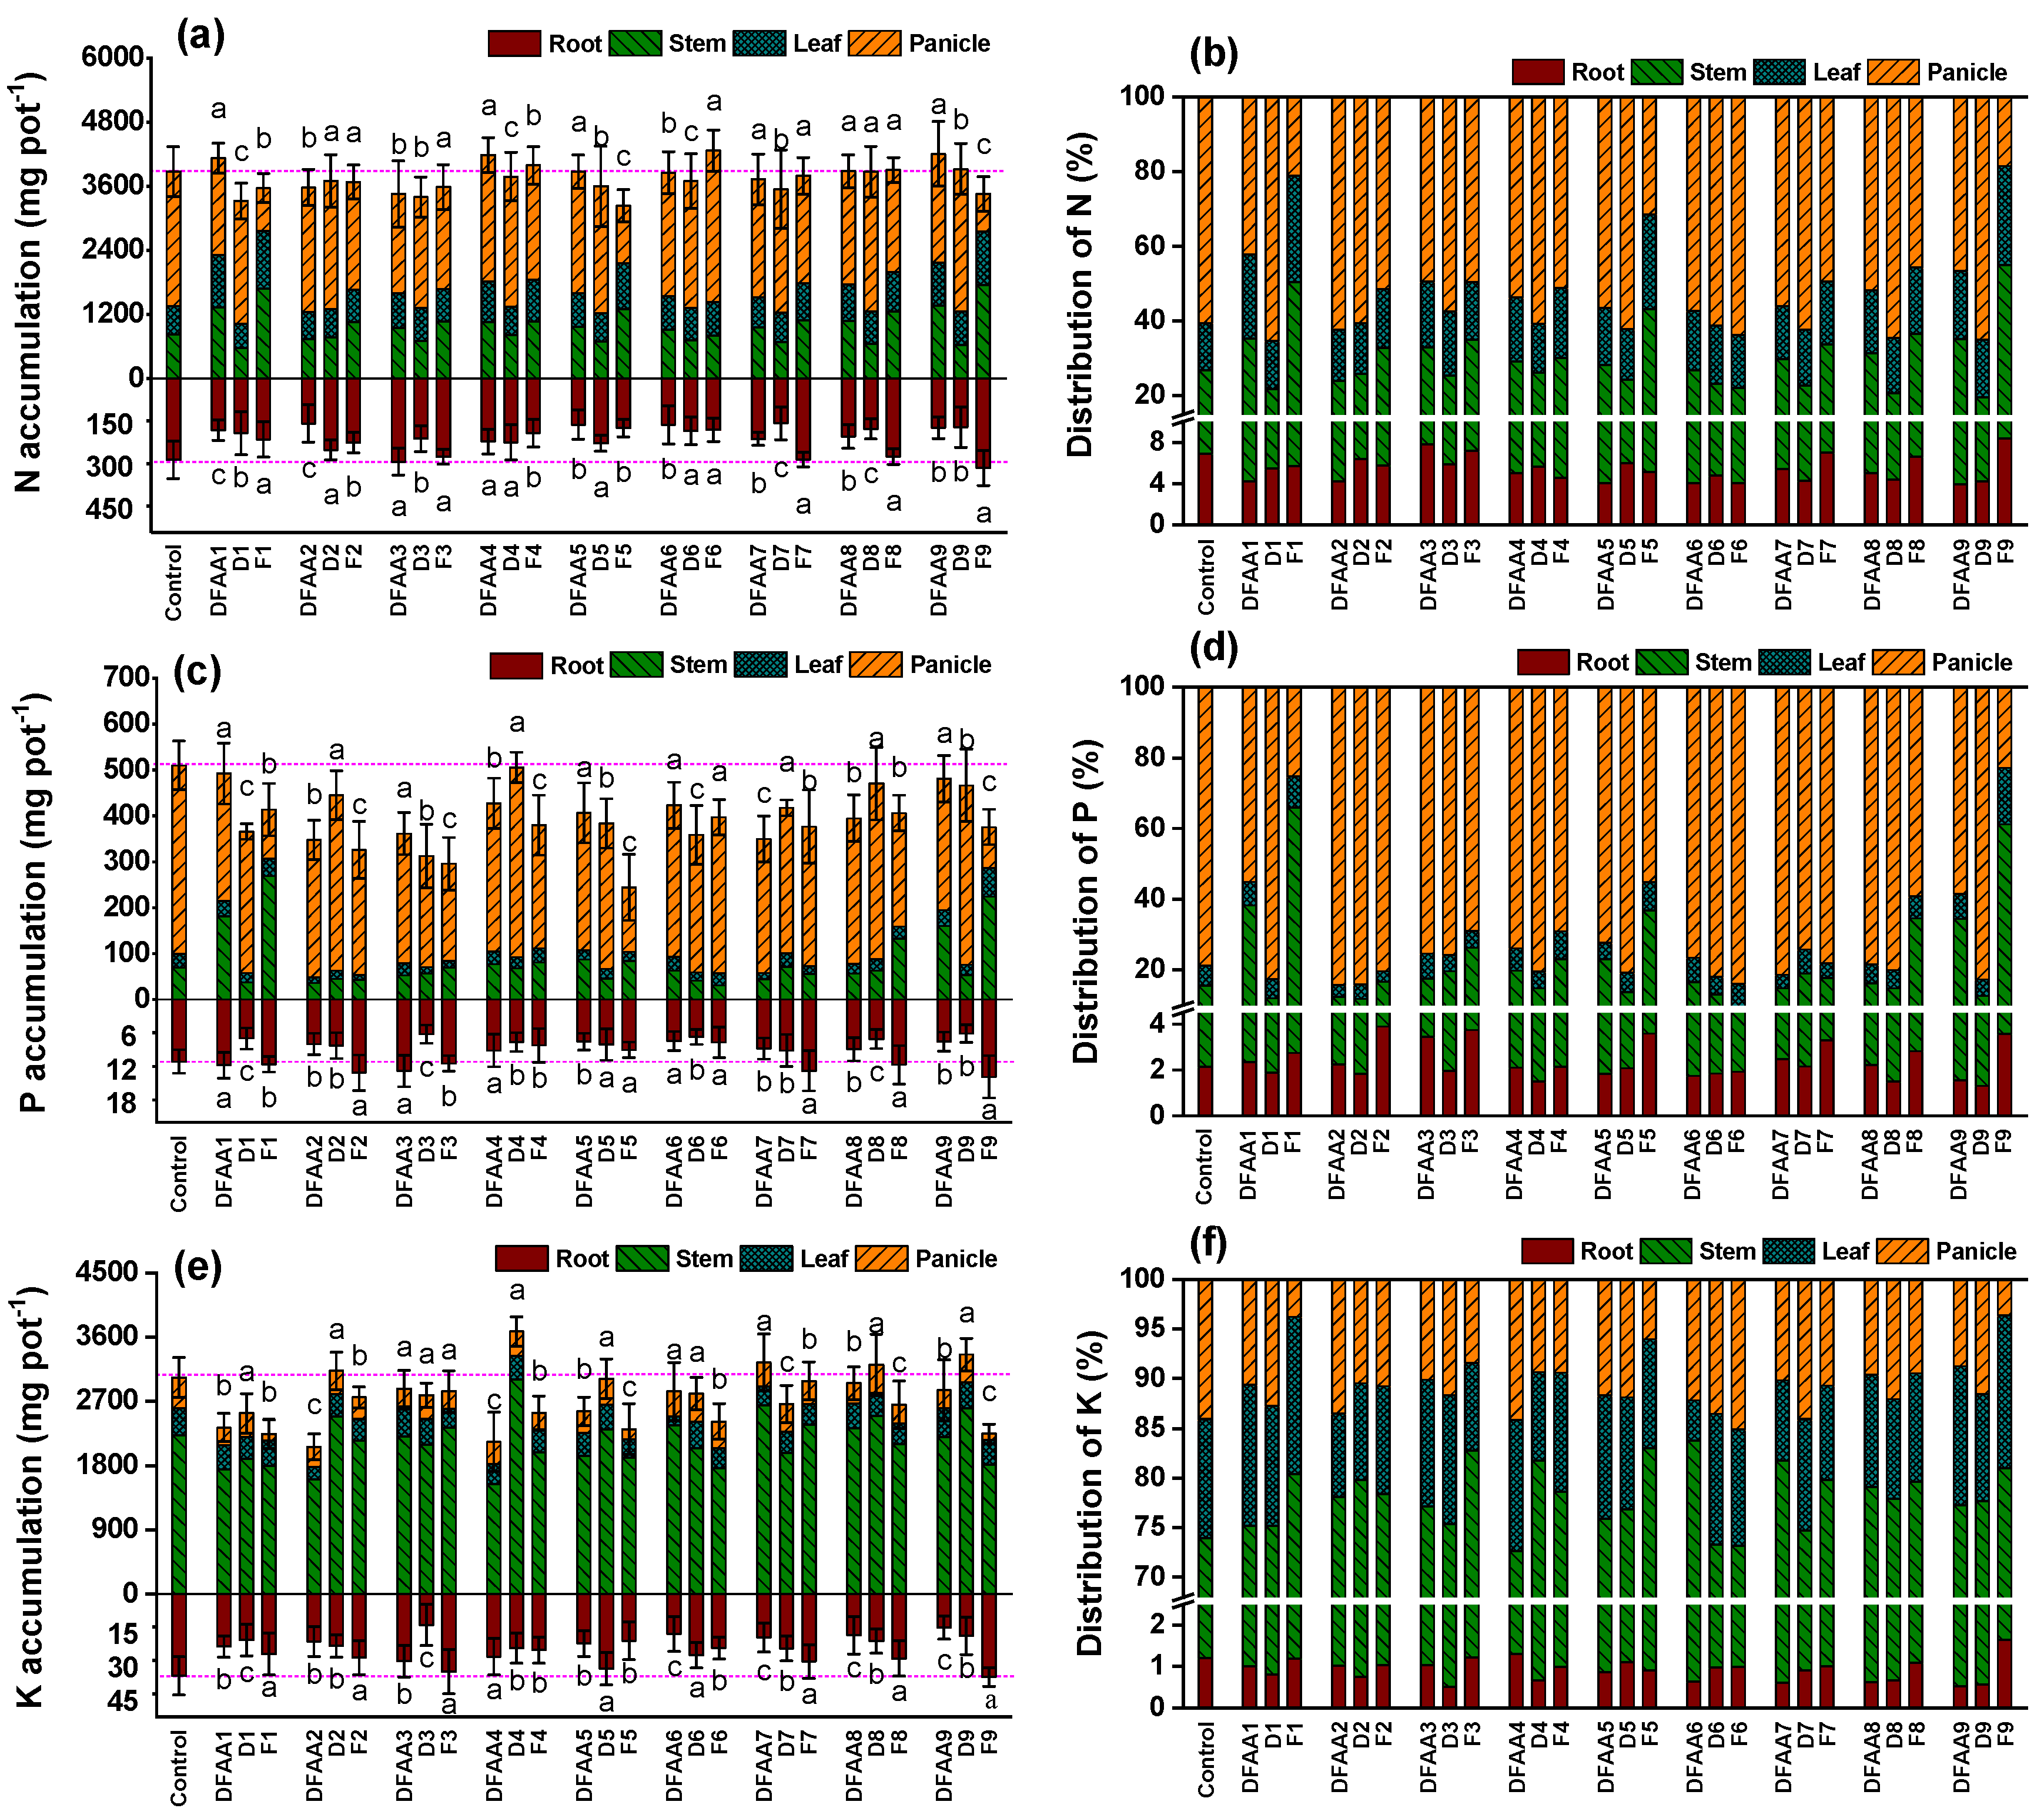
3.2. Accumulation and Partitioning of N, P and K

Drought and flood stress affected the concentration, accumulation and distribution of N, P and K, and then affected the effective utilization of them. The concentrations of N, P and K in the tissues from water stress to maturity were statistically different, except for the panicle (p < 0.05, Figure 4a–c). At maturity, the K concentrations were not significant in the panicle among the various groups (p > 0.05, Figure 4f). Nevertheless, the differences of N, P and K concentration in root, stem and leaf were still highly significant (p < 0.05). Water stresses (D, F and DFAA) tended to increase N concentration in shoot tissues (apart from stem in D) at maturity. Compared with control treatment, panicle N concentration in DFAA, D and F groups increased by 21.5%, 5.2% and 27.0%, on average, respectively (Figure 4d). N concentration in the root was reduced by D and completely underwater treatments, but it was increased by light flooding (e.g., F7). The co-effect of severe drought and heavy flooding tended to decrease root N concentration in DFAA treatments. In contrast, drought reduced P concentration in organs more than flooding, especially in panicle (Figure 4b,e). K concentration decreased in the root under three water stresses, and the decrease was proportional to the flooding duration (Figure 4c,f). At maturity, the distribution of K concentration in the organs of DFAA treatments was obviously lower than the normal value, but most of them were between the D and F treatments. It indicated that the compensation effect existed between pre-drought and post-flood stress.
Amounts of N, P and K taken up by plants among different water treatments were highly variable (Figure 5a,c,e). Compared with control, the total N accumulation under drought alone and flooding alone decreased by 7.4% and 4.1%, respectively. However, this trend was not observed in DFAA. The combination of drought and heavy flooding, such as in DFAA1, DFAA5 and DFAA9, seemed to be conducive to N accumulation in plants, especially in the stem (Figure 5a). By contrast, all three water stresses tended to reduce the total P accumulation, with a mean reduction of 19.6% in DFAA, 25.7% in D and 29.5% in F, respectively (Figure 5c). Furthermore, the total K accumulation decreased by 13.5% in D, 12.1% in F and 10.2% in DFAA (Figure 5e). Under some treatments, nutrient uptake exceeded that of the normal group. The compensation effects after water stresses may be the reason for the increased total N of F6 (50% submergence 7 days, especially in panicle) and total K of DFAA7 (70% FC 5 days + 50% submergence 5 days, especially in stem).
When different tissues were compared, the percentages of N, P and K in stem and panicle were higher than those in roots, irrespective of moisture treatment (Figure 5b,d,f). In most drought alone instances, the percentages of N and P were higher in panicles but lower in stem and root than those in the control treatment. Moreover, drought tended to increase the accumulation of K in stem but decreased it in the other tissues. In most flooding alone instances, the percentages of N, P and K were lower in panicles but higher in stem and leaf compared with the control treatment. When moisture treatments were compared, panicle N, P and K content percentages of DFAA tended to be lower than those of drought alone, but higher than those of flooding alone. The opposite result was observed in the stem of DFAA. All water stress treatments tended to reduce the percentages of N and K content in roots. However, root P content percentage seemed to increase in DFAA and F treatments, but decreased in D treatments.

3.3. N, P and K Uptake and Use Efficiencies

The effects of year, drought (D), flooding (F) and the interactions of Y × F, D × F and Y × D × F on SARs (SAR-N, SAR-P and SAR-K), nutrient use efficiencies (NUE, PUE and KUE) and nutrient ratios (N:P, N:K and K:P) were significant (p < 0.05). Only the effect of Y × D on all above traits and the effect of year on SAR-K and N:P were not significant (p > 0.05; Supplementary Table S2 and Table 3). Compared with the control, SAR-N, SAR-P and SAR-K were increased by 47.9%, 31.8% and 32.8% in DFAA (except for DFAA3). Under drought alone treatments, SARs were also higher than those of the control, but this trend was not as evident as that of SAR-P and SAR-K in flooding alone treatments. Notably, SAR-N tended to be reduced by short-term light flooding (F7) or too long heavy flooding (F9), while SAR-P and SAR-K tended to be reduced by most cases. Regression analysis showed that SAR-N, SAR-P and SAR-K had a strong negative correlation with root DW, RLD and RSA (r = −0.592**~0.894**) but a positive correlation with SRL (r = 0.098~0.129; Table 4). These results indicated that the plastic change of the root system greatly affected the nutrient absorption capacity. Moreover, SAR-N, SAR-P and SAR-K also showed a positive correlation with grain yield (r = 0.108~0.348).
A clear negative relationship was observed between nutrient use efficiencies and SARs (Table 3). Compared with the control, the three moisture regimes exhibited a different pattern of response to the nutrient utilization. NUE decreased by 2.5%, 27.9% and 43.4% on average in drought alone, DFAA and flooding alone treatments, respectively. KUE showed a similar trend to NUE among different treatments, while PUE performed differently. Under drought alone conditions, PUE increased by 1.6–30.7% compared with control treatment, while under flooding alone conditions, PUE decreased by 4.5–75.5% (except for some light flooding cases, e.g., F3, F6 and F7). Regarding DFAA treatments, pre-drought tended to weaken the effect of subsequent flooding on PUE, because their mean values (121.4 g g−1) were higher than those in flooding alone treatments (89.2 g g−1). In most DFAA instances, the nutrient use efficiencies were higher than those of F but lower than those of D even though there was a higher SAR (Table 3). Similar to SARs, the morphological characteristics of rice roots also had a certain effect on the nutrient use efficiencies (Table 4). NUE, PUE and KUE were negatively correlated with root DW, RMD and adventitious roots (r = −0.156~−0.542**), but were correlated with SRL, RSA and maximum root depth (r = 0.202~0.530**). Notably, there was a very significant positive correlation between grain yield and nutrient use efficiency (r = 0.801**~0.926**, Table 4 and Figure 6).
Irrespective of the moisture treatment (i.e., DFAA, drought alone or flooding alone), N:P ratios were larger than that of the control, and the mean value of DFAA was greater than that of drought alone but lower than that of flooding alone (Table 3). The effect of different water stresses on N:K was not significant (p > 0.05). DFAA, drought alone and flooding alone all tended to increase K:P, whose values in DFAA were lower than those in drought alone but were on par with those in flooding alone in most instances.

4. Discussion

4.1. Co-Occurring Drought and Flooding Altered Biomass Accumulation and Partitioning

In terms of plant growth, our results highlighted the dramatic changes of rice biological yield and its root morphology, such as shoot and root DW, RLD, RMD, SRL, RSA, RV, S/V ratio, adventitious root numbers and maximum root depth. The root growth response was thought to be related to the difference of soil permeability under different water stresses [56]. Under less soil moisture (drought stress), root penetration ability was improved with the increase of oxygen concentration in the up soil, thereby root depth and capillary lateral roots increased to improve their ability to absorb substantial soil water and nutrients [57]. At the same time, the aboveground plants reduced their growth viability by reducing the leaf size, vegetative growth and other physiological traits, such as photosynthesis, which ultimately lead to the cumulative reduction of plant biomass [58]. However, under the alternation from drought to flash deep flooding, the pre-drought stressed roots had to adopt another adaptive strategy to cope with the sudden shift to an anaerobic environment [59]. Internode elongation in stems [8,60] and an increase in the number of adventitious roots were observed at the end of most DFAA conditions (Figure 3). Although the aerenchyma developed well in rice roots, long-term deep ponding water, especially complete submergence, hinders the exchange of gas between air and plant [61]. The accumulation of toxic substances (e.g., Fe2+, H2S, CH4, organic acids) seriously poisons the root system and impairs its function [62]. Thus, sudden flooding stress in the later stage may be very harmful to the capillary lateral roots induced by early drought stress [63], although the flooding resistant species actually develop a tolerance mechanism and well develop the morphology, physiology and anatomical structure and will develop the plant’s underground and above ground biomass under waterlogging submergence conditions [64]. Therefore, most root morphological traits such as root DW, RLD, RMD and RSA in DFAA remained lower than those of the control, even lower than those of drought alone and flooding alone in most cases (Table 2 and Figure 3). Fortunately, an increase in SRL under DFAA conditions appeared to offer the possibility of increasing nutrient uptake per unit root DW (Figure 3b and Table 2). Undoubtedly, the abovementioned root plastic changes in DFAA will affect the absorption of water and nutrients, and then affect the process of accumulation, translocation and allocation of the above-ground biomass [65] (Table 2 and Table 4).
Interestingly, the reduction effect of DFAA on root DW was greater than that of either drought or heavy flooding in isolation (−30.0%, −20.7% and −16.4% in DFAA, drought alone and flooding alone, respectively; Table 2). However, the effect of DFAA on stem and leaf DW tended to be positive (10.2% and 9.7% higher than that of control). From the dry matter partitioning (Table 2), the plant seemed to transfer more dry matter to stems and leaves than to panicles. This condition eventually resulted in a significantly lower root/shoot ratio under DFAA conditions (Table 2). This finding was consistent with that obtained by Feng and Luo [66] and Shao et al. [17] but not with that by Guo et al. [67]. In the study of Guo et al., the root/shoot ratio gradually normalized during the recovery period after a short-term decrease when DFAA occurred at the tillering stage. The differences may be attributed to the different fertility stages in the occurrence of DFAA. However, one thing in common is that the root DW decreased whether DFAA occurred at tillering stage or at jointing–booting stage, whereas the shoot DW appeared to be reduced less, especially the stem DW, and may even increase [17,67]. This finding suggested that the root and shoot might have different adaptive mechanisms when DFAA occurred at the jointing–booting stage. The preceding drought increased the sensitivity of roots to the subsequent flooding, that is, the roots adopted some escape strategies, e.g., RLD became smaller and deep roots disappeared (Figure 3). For shoots, the response might be an escape mechanism [67] or a tolerance mechanism [17]. Results seemed to indicate the latter, because the drought-stressed stems tended to increase after the subsequent flooding (Table 2). Unfortunately, the above different adaptation mechanisms resulted in redundant growth of stem and leaf, which might be one of the reasons for the reduction of grain yield under DFAA conditions.

4.2. Co-Occurring Drought and Flooding Altered N, P and K Uptake and Utilization

The availability of N, P and K plays an important role in plant growth; nevertheless, the physiological factors in nutrient, soil, plant or root absorption sites may interact antagonistically or synergistically [68]. Many studies have reported the single effect of drought or flooding on nutrient uptake in rice plants, e.g., nutrient element uptake decreased when drought stress intensity increased [23], while under deep flooding conditions, the N content increased and P and K contents decreased [27,28]. Moreover, both increases and decreases in NUE have been reported under alternate wetting and drying irrigation [41,69]. Due to NH4+ being the main source of N in flooded soils, and NO3 being more common in drought soil, the cooperation of NH4+ and NO3 can improve the growth and yield significantly compared to growth on either NH4+ or NO3 alone of equal amount [70]. Rice plants with DFAA seemed to benefit more than with control and flooding alone. Indeed, the total N content of the plant in DFAA was comparable with the normal group (Figure 5a). However, a significant shift in N partitioning was observed in favor of DFAA to the stem and leaf (luxury consumption), with panicle N partitioning that was smaller (Figure 5b). In addition, a significantly lower NUE in DFAA than drought alone in this study indicated that the consequent flooding stress was more severe and caused a greater inefficient utilization of N compared with drought alone (Table 3). This finding is supported by previous pot experiments conducted in Nanjing, China, where both N uptake and NUE in rice of Nanjing 44 were reduced when DFAA occurred at tillering stage [67].
Even though panicle N and P concentrations in DFAA were higher than those in Control in most cases and panicle K in DFAA was comparable with that in control (Figure 4), panicle N, P and K content were reduced (Figure 5). This indicates that the reduced N, P and K contents of the panicle in DFAA treatments were mainly attributed to the reduced panicle DW (Table 2). When total DW of DFAA at maturity was 91.04% of that in control, the total N in DFAA was 98.13% of that in control while the corresponding values for P (80.40%) and K (89.77%) contents were lower (Table 2 and Figure 5). The reduced P and K contents, especially the P content in DFAA in comparison to control indicate the greater sensitivity of P uptake to this transient soil water environment of drought and flooding. This is mainly because P in soil is mostly immobile and unavailable to plants, and further restricted when moisture stress occurs [60]. Additionally, once P is absorbed, plants may improve the use efficiency of P by translocating P from senescent tissues to tissues with greater demand [39]. Supporting this contention, PUE (−10.81%) was reduced less by DFAA relative to NUE (−27.88%) and KUE (−19.74%) in this study (Table 3). Apparently, NUE, PUE and KUE varied with the different combinations of drought and flooding, and the subsequent flooding tended to aggravate the effect of pre-drought on the availability of N, P and K because lower nutrient use efficiencies were observed in DFAA than that in drought alone. However, due to the existence of a compensation effect between drought and flooding, the nutrient use efficiencies in DFAA were higher than that in flooding alone (Table 3). As the plants were cultured in pots in this experiment and the water in the pool was static without leakage or drainage, soil water stress may not have restricted the availability of N, P and K to rice roots. Therefore, further research will be carried out in the field to understand the actual growth of field crops more accurately.

4.3. Influence of Root Plasticity on N, P and K Uptake and Utilization

Under DFAA conditions, the rice plant tried to reduce its root size to avoid the redundant consumption of nutrients (Figure 3), whereas the absorption capacity of roots was significantly improved (p < 0.05) to maintain the nutrient supply to the aboveground parts as much as possible (Table 3). This response is a remarkable manifestation of plant self-regulation to adapt to the changing environment [71,72]. The specific absorption rates of N, P and K in most DFAA conditions were significantly higher than those in drought alone and flooding alone conditions (Table 3 and Supplementary Table S2). However, if the degree of DFAA is too heavy, such as in DFAA3, with a long-term severe drought + deep flooding, the absorptive capacity of roots will be limited due to a serious decline in root activity [73]. There was a significant negative correlation between root traits (root DW, RLD, RSA) and SARs (SAR-N, SAR-P and SAR-K; Table 4). This view that small root systems under transient soil moisture do not limit the absorption capacity of roots has also been confirmed in many previous reports [31,39,74,75]. Moreover, according to the correlation analysis (Table 4), root plasticity did not seem to affect the final total N, total P and total K contents at maturity. However, nutrient use efficiencies decreased in most DFAA cases although the root absorptive capacity increased (Table 3). From Figure 6 and Table 4, we found that there was a strong positive correlation between nutrient use efficiencies and GY, which indicated that the reductions of nutrient use efficiencies in DFAA were mainly driven by the decrease in GY, because there was almost no difference in variation of nutrient uptake with the variations of GY (Figure 6a). This conclusion is not very consistent with the point of Ye et al. [41], who proposed increased nutrient uptake with increased GY and decreased nutrient use efficiency with increasing GY. This difference was mainly due to the combination of drought and flooding in different degrees. Zhang et al. [10] also demonstrated that a moderate alternate wetting and drying could improve root growth, facilitate the reuse of stored carbon to cereals, accelerate grain filling and promote grain yield, while in our study, the opposite trend was observed due to the fact that DFAA had a stronger degree of drought or flooding (Supplementary Tables S1 and S2).
Notably, there were significant breakpoints in the relationship between relative PUEc or KUEc and relative GY (RGY; Figure 6c,d), but not between relative NUEc and RGY (Figure 6b). This may be related to the imbalance of N, P and K absorption (Table 3). The content ratios of N:P, N:K and K:P under water stresses, except N:K under drought alone and K:P under flooding alone, were all higher than that of control. Thus, the importance of P in the yield-forming process of rice under DFAA increased (i.e., uptake of P was much smaller than that of N and K), which is in accordance with the viewpoint of Somaweera et al. [30]. Additionally, correlation analysis revealed a positive correlation between maximum root depth and NUE (r = 0.483**), PUE (r = 0.530**) and KUE (r = 0.202). Therefore, the abundance of N and K in DFAA-stressed plants may improve P use efficiency. Thus, further research is needed to study how to reduce the impact of this extreme climate on rice growth through some fertilizer measures or oxygen release agent in actual practice during post-DFAA recovery periods.

5. Conclusions

The present study aimed to investigate the interaction of drought and flooding on root growth and nutrient absorption in rice. Several indicators reveal that roots and shoots may adopt different adaptation mechanisms when DFAA occurs. Roots seemed to adopt an escape strategy, whereas shoots tended to adopt a tolerance strategy. Compared with drought alone and flooding alone, DFAA tended to induce a smaller root structure, such as the smaller number of roots DW, RLD, RMD, RSA, RV and adventitious roots, and a larger crown, such as the increased accumulation in stem and leaf biomass (10.2% and 9.7%). However, grain yield in DFAA was ultimately reduced by 29.8% as a result of the reduced nutrient uptake and utilization efficiencies of N, P and K. Among the DFAA-stressed plants, total P decreased by 19.6%, followed by total K (−10.2%) and total N (−1.9%), which highlighted the importance of P in the yield-forming process of rice. Therefore, our results suggest that post-drought exposure to flooding may impede the root uptake of P, thus hindering root growth and organ biomass redistribution, thereby reducing rice yield and nutrient availability. Therefore, fertilization application measures under DFAA conditions are the urgent problem to be studied in order to adapt to the future changing climate and soil environment.

Supplementary Materials

The following are available online at https://www.mdpi.com/article/10.3390/agronomy11112103/s1, Table S1: Biomass, yield and its components of Longliangyouhuazhan (Indica hybrid cultivar) under different water stresses at maturity, Table S2. Specific absorption rates, nutrient use efficiencies and nutrient’s ratios of Longliangyouhuazhan (Indica hybrid cultivar) under different water stresses at maturity.

Author Contributions

Conceptualization, J.H., T.H. and F.W.; investigation, J.H.; writing—original draft preparation, J.H.; resource, J.L.; writing—review and editing, T.H., J.W., X.W. and C.L.; supervision and funding acquisition, L.L. and F.W. All authors have read and agreed to the published version of the manuscript.

Funding

This research was funded by the National Natural Science Foundation of China (51709098, 52179022, 51339004 and 51909083); the National Key Research and Development Program of China (2018YFC1508305); the Financial Project of Hubei Province (2021-218-006-001).

Institutional Review Board Statement

Not applicable.

Informed Consent Statement

Not applicable.

Data Availability Statement

Not applicable.

Acknowledgments

The authors are very grateful to the Xinmaqiao Comprehensive Experiment Station of Irrigation and Drainage for providing the study site and meteorological data. In addition, all of the authors sincerely thank the anonymous reviewers for their review and helpful comments.

Conflicts of Interest

The authors declare no conflict of interest. The funders had no role in the design of the study; in the collection, analyses, or interpretation of data; in the writing of the manuscript, or in the decision to publish the results.

Abbreviations

DFAAdrought–flood abrupt alternation or drought followed by flood
Ddrought followed by no flood
Fno drought followed by flood
FCfield capacity
Nnitrogen
Pphosphorus
Kpotassium
DWdry weight
GYgrain yield
RLDroot length density
SRLspecific root length
RMDroot mean diameter
RSAroot surface area
RVroot volume
S/Vratio the ratio of root surface area and root volume
UEuse efficiency
SARspecific absorption rate

References

  1. Lehner, B.; Döll, P.; Alcamo, J.; Henrichs, T.; Kaspar, F. Estimating the Impact of Global Change on Flood and Drought Risks in Europe: A Continental, Integrated Analysis. Clim. Chang. 2006, 75, 273–299. [Google Scholar] [CrossRef]
  2. Easterling, D.R.; Evans, J.L.; Groisman, P.Y.; Karl, T.R.; Kunkel, K.E.; Ambenje, P. Observed variability and trends in extreme climate events: A brief review. Bull. Am. Meteorol. Soc. 2000, 81, 417–426. [Google Scholar] [CrossRef] [Green Version]
  3. Sun, Q.; Miao, C.; Duan, Q. Extreme climate events and agricultural climate indices in China: CMIP5 model evaluation and projections. Int. J. Clim. 2016, 36, 43–61. [Google Scholar] [CrossRef]
  4. Watanabe, T.; Cullmann, J.; Pathak, C.S.; Turunen, M.; Emami, K.; Ghinassi, G.; Siddiqi, Y. Management of Climatic Extremes with Focus on Floods and Droughts in Agriculture. Irrig. Drain. 2018, 67, 29–42. [Google Scholar] [CrossRef]
  5. Tao, F.; Zhang, S.; Zhang, Z. Changes in rice disasters across China in recent decades and the meteorological and agronomic causes. Reg. Environ. Chang. 2013, 13, 743–759. [Google Scholar] [CrossRef]
  6. Sultan, S.E. Phenotypic plasticity for plant development, function and life history. Trends Plant Sci. 2000, 5, 537–542. [Google Scholar] [CrossRef]
  7. Bhusal, N.; Lee, M.; Han, A.R.; Kim, H.S. Responses to drought stress in Prunus sargentii and Larix kaempferi seedlings using morphological and physiological parameters. For. Ecol. Manag. 2020, 465, 118099. [Google Scholar] [CrossRef]
  8. Nishiuchi, S.; Yamauchi, T.; Takahashi, H.; Kotula, L.; Nakazono, M. Mechanisms for coping with submergence and waterlogging in rice. Rice 2012, 5, 2. [Google Scholar] [CrossRef] [PubMed] [Green Version]
  9. Pradhan, C.; Mohanty, M. Submergence stress: Responses and adaptations in crop plants. In Molecular Stress Physiology Plants; Springer: Utkal University, BhubaneswarIndia, India, 2013; pp. 31–357. [Google Scholar]
  10. Steffens, B.; Wang, J.; Sauter, M. Interactions between ethylene, gibberellin and abscisic acid regulate emergence and growth rate of adventitious roots in deep water rice. Planta 2006, 223, 604–612. [Google Scholar] [CrossRef] [PubMed]
  11. Yamauchi, A.; Pardales, J.R., Jr.; Kono, Y. Root system structure and its relation to stress tolerance. In Roots and Nitrogen in Cropping Systems of the Semi-Arid Tropics; Ito, O., Katayama, K., Johansen, C., Kumar Rao, J.V.D.K., Adu-Gyamfi, J.J., Rego, T.J., Eds.; JIRCAS Publication: Tsukuba, Japan, 1996; pp. 211–234. [Google Scholar]
  12. Zhang, H.; Xue, Y.; Wang, Z.; Yang, J.; Zhang, J. An alternate wetting and moderate soil drying regime improves root and shoot growth in rice. Crop. Sci. 2009, 49, 2246–2260. [Google Scholar] [CrossRef]
  13. Chu, G.; Chen, T.; Wang, Z.; Yang, J.; Zhang, J. Reprint of “Morphological and physiological traits of roots and their relationships with water productivity in water-saving and drought-resistant rice”. Field Crop. Res. 2014, 165, 36–48. [Google Scholar] [CrossRef]
  14. Xu, G.-W.; Lyu, Q.; Lu, D.-K.; Wang, H.-Z.; Chen, M.-C. Effect of Wetting and Drying Alternative Irrigation Coupling with Nitrogen Application on Root Characteristic and Grain-sink Activity. Acta Agron. Sin. 2016, 42, 1495–1505. [Google Scholar] [CrossRef]
  15. Mehrabi, F.; Sepaskhah, A.R.; Ahmadi, S.H. Winter wheat root distribution with irrigation, planting methods, and nitrogen application. Nutr. Cycl. Agroecosys. 2021, 119, 231–245. [Google Scholar] [CrossRef]
  16. Wang, J.; Niu, W.; Zhang, M.; Li, Y. Effect of alternate partial root-zone drip irrigation on soil bacterial communities and tomato yield. Appl. Soil Ecol. 2017, 119, 250–259. [Google Scholar] [CrossRef]
  17. Du, S.; Tong, L.; Kang, S.; Li, F.; Du, T.; Li, S.; Ding, R. Alternate partial root-zone irrigation with high irrigation frequency improves root growth and reduces unproductive water loss by apple trees in arid north-west China. Front. Agric. Sci. Eng. 2018, 5, 188–196. [Google Scholar] [CrossRef] [Green Version]
  18. Suralta, R.R.; Kano-Nakata, M.; Niones, J.M.; Inukai, Y.; Kameoka, E.; Tran, T.T.; Menge, D.; Mitsuya, S.; Yamauchi, A. Root plasticity for maintenance of productivity under abiotic stressed soil environments in rice: Progress and prospects. Field Crop. Res. 2016, 220, 57–66. [Google Scholar] [CrossRef]
  19. Shao, G.-C.; Deng, S.; Liu, N.; Yu, S.-E.; Wang, M.-H.; She, D.-L. Effects of controlled irrigation and drainage on growth, grain yield and water use in paddy rice. Eur. J. Agron. 2014, 53, 1–9. [Google Scholar] [CrossRef]
  20. Shekhar, S.; Mailapalli, D.R.; Raghuwanshi, N.S. Simulating nitrogen transport in paddy crop irrigated with alternate wetting and drying practice. Paddy Water Environ. 2021, 19, 499–513. [Google Scholar] [CrossRef]
  21. Shao, G.-C.; Wang, M.-H.; Yu, S.-E.; Liu, N.; Xiao, M.-H.; Yuan, M. Potential of Controlled Irrigation and Drainage for Reducing Nitrogen Emission from Rice Paddies in Southern China. J. Chem. 2015, 2015, 1–9. [Google Scholar] [CrossRef] [Green Version]
  22. Suriyagoda, L.; De Costa, W.A.J.M.; Lambers, H. Growth and phosphorus nutrition of rice when inorganic fertiliser application is partly replaced by straw under varying moisture availability in sandy and clay soils. Plant Soil 2014, 384, 53–68. [Google Scholar] [CrossRef]
  23. Kato, Y.; Tajima, R.; Toriumi, A.; Homma, K.; Moritsuka, N.; Shiraiwa, T.; Yamagishi, J.; Mekwatanakern, P.; Chamarerk, V.; Jongdee, B. Grain yield and phosphorus uptake of rainfed lowland rice under unsubmerged soil stress. Field Crop. Res. 2016, 190, 54–59. [Google Scholar] [CrossRef]
  24. Ichsan, C.N.; Basyah, B.; Zakaria, S.; Efendi, E. Alteration of dry matter accumulation under soil moisture fluctuation stress in rice (Oryza sativa L.). Aust. J. Crop. Sci. 2021, 15, 757–763. [Google Scholar] [CrossRef]
  25. Singh, S.P.; Mahapatra, B.S.; Pramanick, B.; Yadav, V.R. Effect of irrigation levels, planting methods and mulching on nutrient uptake, yield, quality, water and fertilizer productivity of field mustard (Brassica rapa L.) under sandy loam soil. Agric. Water Manag. 2021, 244, 106539. [Google Scholar] [CrossRef]
  26. Suralta, R.R. Plastic root system development responses to drought-enhanced nitrogen uptake during progressive soil drying conditions in rice. Philipp. Agric. 2011, 93, 458–462. [Google Scholar]
  27. He, M.; Dijkstra, F.A. Drought effect on plant nitrogen and phosphorus: A meta-analysis. New Phytol. 2014, 204, 924–931. [Google Scholar] [CrossRef] [PubMed]
  28. Bo, Y.C.; Ni, M.J.; Wang, J.J. Effects of water stress on rice yields and nutrients absorption under aerobic condition. Trans. Chin. Soc. Agric. Eng. 2007, 23, 101–104. [Google Scholar]
  29. Reddy, M.D.; Mittra, B.N. Effect of complete plant submergence at different growth stages on grain yield, yield components and nutrient content of rice. Plant Soil 1985, 86, 379–386. [Google Scholar] [CrossRef]
  30. Reddy, M.D.; Mittra, B.N. Effects of complete plant submergence on vegetative growth, grain yield and some biochemical changes in rice plants. Plant Soil 1985, 87, 365–374. [Google Scholar] [CrossRef]
  31. Setter, T.; Greenway, H.; Kupkanchanakul, T. Submergence of Rice. II. Adverse Effects of Low CO2 Concentrations. Funct. Plant Biol. 1989, 16, 265–278. [Google Scholar] [CrossRef]
  32. Somaweera, K.A.T.N.; Suriyagoda, L.D.B.; Sirisena, D.N.; De Costa, W.A.J.M. Accumulation and partitioning of biomass, nitrogen, phosphorus and potassium among different tissues during the life cycle of rice grown under different water management regimes. Plant Soil 2016, 401, 169–183. [Google Scholar] [CrossRef]
  33. Cabangon, R.J.; Tuong, T.P.; Castillo, E.G.; Bao, L.X.; Lu, G.; Wang, G.; Cui, Y.; Bouman, B.A.M.; Li, Y.; Chen, C.; et al. Effect of irrigation method and N-fertilizer management on rice yield, water productivity and nutrient-use efficiencies in typical lowland rice conditions in China. Paddy Water Environ. 2004, 2, 195–206. [Google Scholar] [CrossRef]
  34. Li, Z.J.; Zhang, F.C.; Kang, S.Z. Impacts of the controlled roots-divided alternative irrigation on water and nutrient use of winter wheat. Trans. Chin. Soc. Agric. Eng. 2005, 21, 17–21. [Google Scholar]
  35. Gao, S.-K.; Yu, S.-E.; Shao, G.-C.; She, D.-L.; Wang, M.; Guo, R.; Cao, R.-Z.; Yan, S.-F.; Ding, J.-H. Effects of Controlled Irrigation and Drainage on Nitrogen and Phosphorus Concentrations in Paddy Water. J. Chem. 2016, 2016, 1–9. [Google Scholar] [CrossRef] [Green Version]
  36. Haefele, S.; Wopereis, M.; Ndiaye, M.; Barro, S.; Isselmou, M.O. Internal nutrient efficiencies, fertilizer recovery rates and indigenous nutrient supply of irrigated lowland rice in Sahelian West Africa. Field Crop. Res. 2003, 80, 19–32. [Google Scholar] [CrossRef]
  37. Sattari, S.Z.; Ittersum, M.K.V.; Bouwman, A.F.; Smit, A.L.; Janssen, B.H. Crop yield response to soil fertility and N, P, K inputs in different environments: Testing and improving the quefts model. Field Crop. Res. 2014, 157, 35–46. [Google Scholar] [CrossRef]
  38. Mao, Z. Study on evaluation of irrigation performance in China. In Maintenance and Operation of Irrigation/Drainage Schemes for Improved Performance, Proceedings of the Asian Regional Symposium, Beijing, China, 24–27 May 1993; HR Wallingford: Oxford, UK, 1993; pp. 6.35–6.49. [Google Scholar]
  39. Devkota, K.P.; Manschadi, A.; Lamers, J.P.; Devkota, M.; Vlek, P.L. Mineral nitrogen dynamics in irrigated rice—Wheat system under different irrigation and establishment methods and residue levels in arid drylands of Central Asia. Eur. J. Agron. 2013, 47, 65–76. [Google Scholar] [CrossRef]
  40. Goswami, N.N.; Banerjee, M.K. Phosphorus, Potassium and Other Macro Elements in Soils and Rice; IRRI: Los Banos, Philippines, 1978; pp. 561–580. [Google Scholar]
  41. Somaweera, K.A.T.N.; Suriyagoda, L.D.B.; Sirisena, D.N.; De Costa, W.A.J.M. Growth, root adaptations, phosphorus and potassium nutrition of rice when grown under the co-limitations of phosphorus, potassium and moisture. J. Plant Nutr. 2017, 40, 18. [Google Scholar] [CrossRef]
  42. Guo, X.P.; Yuan, J.; Guo, F.; Chen, Z.P. Effects of rapid shift from drought to waterlogging stress on physiological characteristics of rice in late tillering stage. J. Hohai Univ. 2008, 36, 516–519. [Google Scholar]
  43. Ye, Y.; Liang, X.; Chen, Y.; Liu, J.; Gu, J.; Guo, R.; Li, L. Alternate wetting and drying irrigation and controlled-release nitrogen fertilizer in late-season rice. Effects on dry matter accumulation, yield, water and nitrogen use. Field Crop. Res. 2013, 144, 212–224. [Google Scholar] [CrossRef]
  44. Zhen, B.; Guo, X.; Lu, H. Effects of alternative stress of drought and waterlogging at tillering stage on rice root anatomical structure. Trans. Chin. Soc. Agric. Eng. 2015, 31, 107–113. [Google Scholar]
  45. Zhu, R.; Wu, F.; Zhou, S.; Hu, T.; Huang, J.; Gao, Y. Cumulative effects of drought–flood abrupt alternation on the photosynthetic characteristics of rice. Environ. Exp. Bot. 2020, 169, 103901. [Google Scholar] [CrossRef]
  46. Cheng, Z.; Xu, M.; Luo, L.S.; Ding, X.J. Climate characteristics of drought-flood abrupt change events in Huaihe river basin. J. China Hydrol. 2012, 32, 73–79. [Google Scholar]
  47. Huang, R.; Yan, D.H. Spatiotemporal Evolution of the Drought and Flood in Northeast China. Adv. Mater. Res. 2014, 1010–1012, 1075–1083. [Google Scholar] [CrossRef]
  48. Li, Y.S.; Peng, F.Y.; Li, D.M.; Li, Z.S. Relationship between hybrids and their parents on submergence tolerance at seedling stage. Hybrid Rice 2001, 16, 50–53. [Google Scholar]
  49. Cui, Y.; Mao, Z.; Li, Y. Study on temporal and spatial variation of rice water production function. Adv. Water Sci. 2002, 13, 484–491. [Google Scholar]
  50. Schuurman, J.J.; Goedewaagen, M.A.J. Methods for the Examination of Root Systems and Roots; Centre for Agricultural Publications and Documentation: Wageningen, The Netherlands, 1971. [Google Scholar]
  51. Bao, S.D. Soil and Agriculture Chemistry Analysis; Agricultural Press: Beijing, China, 2000. [Google Scholar]
  52. Nelson, D.W.; Sommers, L.E. Determination of Total Nitrogen in Plant Material 1. Agron. J. 1973, 65, 109–112. [Google Scholar] [CrossRef]
  53. Kitson, R.E.; Mellon, M.G. Colorimetric Determination of Phosphorus as Molybdivanadophosphoric Acid. Ind. Eng. Chem. Anal. Ed. 1944, 16, 379–383. [Google Scholar] [CrossRef]
  54. Ranst, E.V.; Verloo, M.; Demeyer, A. Manual for the Soil Chemistry and Fertility Laboratory-Analytical Methods for Soils and Plants, Equipment, and Management of Consumables; NUGI 835: Ghent, Belgium, 1999; 243p, ISBN 90-76603-01-4. [Google Scholar]
  55. Romero, J.M.R.; Marañón, T.; Murillo, J.M. Long-term responses of Melilotus segetalis to salinity. II. Nutrient absorption and utilization. Plant Cell Environ. 1994, 17, 1249–1255. [Google Scholar] [CrossRef]
  56. Ju, C.; Buresh, R.J.; Wang, Z.; Zhang, H.; Liu, L.; Yang, J.; Zhang, J. Root and shoot traits for rice varieties with higher grain yield and higher nitrogen use efficiency at lower nitrogen rates application. Field Crop. Res. 2015, 175, 47–55. [Google Scholar] [CrossRef]
  57. Blum, A.; Jordan, W.R. Breeding crop varieties for stress environments. Crit. Rev. Plant Sci. 1985, 2, 199–238. [Google Scholar] [CrossRef]
  58. Bhusal, N.; Lee, M.; Lee, H.; Adhikari, A.; Han, A.R.; Kim, H.S. Evaluation of morphological, physiological, and biochemical traits for assessing drought resistance in eleven tree species. Sci. Total Environ. 2021, 779, 146466. [Google Scholar] [CrossRef]
  59. Xu, G.-W.; Lu, D.-K.; Wang, H.-Z.; Li, Y. Morphological and physiological traits of rice roots and their relationships to yield and nitrogen utilization as influenced by irrigation regime and nitrogen rate. Agric. Water Manag. 2018, 203, 385–394. [Google Scholar] [CrossRef]
  60. Xie, X.; Quintana, M.R.; Sandhu, N.; Subedi, S.R.; Zou, Y.; Rutkoski, J.E.; Henry, A. Approaches to relating rice root plasticity with yield stability across different drought stress and establishment conditions. J. Exp. Bot. 2021, 72, 5208–5220. [Google Scholar] [CrossRef] [PubMed]
  61. Bleecker, A.B.; Schuette, J.L.; Kende, H. Anatomical analysis of growth and developmental patterns in the internode of deep-water rice. Planta 1986, 169, 490–497. [Google Scholar] [CrossRef] [PubMed]
  62. Kende, H.; van der Knaap, E.; Cho, H.-T. Deepwater Rice: A Model Plant to Study Stem Elongation. Plant Physiol. 1998, 118, 1105–1110. [Google Scholar] [CrossRef] [PubMed] [Green Version]
  63. Phukan, U.J.; Mishra, S.; Shukla, R.K. Waterlogging and submergence stress: Affects and acclimation. Crit. Rev. Biotechnol. 2015, 36, 956–966. [Google Scholar] [CrossRef]
  64. Bhusal, N.; Kim, H.S.; Han, S.-G.; Yoon, T.-M. Photosynthetic traits and plant–water relations of two apple cultivars grown as bi-leader trees under long-term waterlogging conditions. Environ. Exp. Bot. 2020, 176, 104111. [Google Scholar] [CrossRef]
  65. Suralta, R.R.; Inukai, Y.; Yamauchi, A. Genotypic Variations in Responses of Lateral Root Development to Transient Moisture Stresses in Rice Cultivars. Plant Prod. Sci. 2008, 11, 324–335. [Google Scholar] [CrossRef]
  66. Suralta, R.R.; Inukai, Y.; Yamauchi, A. Utilizing Chromosome Segment Substitution Lines (CSSLs) for Evaluation of Root Responses to Transient Moisture Stresses in Rice. Plant Prod. Sci. 2008, 11, 457–465. [Google Scholar] [CrossRef] [Green Version]
  67. Niones, J.M.; Suralta, R.R.; Inukai, Y.; Yamauchi, A. Field evaluation on functional roles of root plastic responses on dry matter production and grain yield of rice under cycles of transient soil moisture stresses using chromosome segment substitution lines. Plant Soil 2012, 359, 107–120. [Google Scholar] [CrossRef]
  68. Feng, G.; Luo, Y. Simulation on functional equilibrium of winter wheat root and shoot under different soil water regimes. Acta Ecol. Sin. 1999, 19, 96–103. [Google Scholar]
  69. Guo, X.; Xiaopu, L.I.; Hongfei, L.U.; Wang, Z.; Yang, S. Study on dry matter accumulation and nitrogen uptake under alternating drought and flooding stress in rice tillering stage. J. Irrig. Drain. 2015, 34, 20–24. [Google Scholar]
  70. Alam, S.M. Nutrient uptake by plants under stress conditions. In Handbook of Plant and Crop Stress; Pessarakli, M., Ed.; Marcel Dekker: New York, NY, USA, 1999; pp. 285–313. [Google Scholar]
  71. Bhuiyan, M.K.A.; Bhuiya, S.U.; Saleque, M.A.; Khatun, A. Nitrogen application in direct wet seeded rice under alternate wetting and drying irrigation condition: Effects on grain yield dry matter production, nitrogen uptake and nitrogen use efficiencies. J. Plant Nutr. 2017, 40, 2477–2493. [Google Scholar] [CrossRef]
  72. Kronzucker, H.; Siddiqi, M.Y.; Glass, A.D.; Kirk, G. Nitrate-Ammonium Synergism in Rice. A Subcellular Flux Analysis. Plant Physiol. 1999, 119, 1041–1046. [Google Scholar] [CrossRef] [PubMed] [Green Version]
  73. Osaki, M.; Shinano, T.; Matsumoto, M.; Zheng, T.; Tadano, T. A root-shoot interaction hypothesis for high productivity of root crops. Soil Sci. Plant Nutr. 1997, 43, 289–301. [Google Scholar] [CrossRef] [Green Version]
  74. Ruberti, I.; Sessa, G.; Ciolfi, A.; Possenti, M.; Carabelli, M.; Morelli, G. Plant adaptation to dynamically changing environment: The shade avoidance response. Biotechnol. Adv. 2012, 30, 1047–1058. [Google Scholar] [CrossRef]
  75. Huang, J.; Hu, T.; Yasir, M.; Gao, Y.; Chen, C.; Zhu, R.; Wang, X.; Yuan, H.; Yang, J. Root growth dynamics and yield responses of rice (Oryza sativa L.) under drought—Flood abrupt alternating conditions. Environ. Exp. Bot. 2019, 157, 11–25. [Google Scholar] [CrossRef]
Figure 1. (a) Monthly precipitation (P) and mean air temperature (T), (b) irradiance (I) and mean vapor pressure (VP) at the Xinmaqiao Comprehensive Experiment Station of Irrigation and Drainage, Bengbu, China (117°21′34″ E, 33°08′56″ N) during the rice growing season (May to September) in 2016–2018.
Agronomy 11 02103 g001
Figure 2. Photos of drought phase, flooding preparation and flooding phase (ac), schematic diagrams of the pots for rice growth (d) and the profile of multistep water pool for different flooding depths (e).
Agronomy 11 02103 g002
Figure 3. Changes of relative values of rice root traits under different water stresses (a) at the end of drought–flood abrupt alternation (DFAA) and (b) at maturity. Root traits include root length density (RLD, cm cm−3), root mean diameter (RMD, mm), specific root length (SRL, m g−1), root surface area (RSA, cm2 pot−1), root volume (RV, cm3 pot−1), the ratio of root surface area and root volume (S/V ratio, cm3 cm−3), maximum root depth (cm) and adventitious root numbers (no. pot−1) under different water treatments. The boxes represent the range of relative values in rice root traits. Round dots (●) in the boxes represent the means for each group. The up arrow (↑) refers to the means of water stress groups greater than the value of the normal group; the down arrow (↓) refers to the means of water stress groups lower than the values of normal group; the flat arrow to the right (→) refers to the means of water stress groups comparable to the values of normal group.
Agronomy 11 02103 g003
Figure 4. The relative value changes of rice tissue concentrations of nitrogen (N), phosphorus (P) and potassium (K) under different water stresses (ac) at the end of drought–flood abrupt alternation (DFAA) and (df) at maturity. The relative values plotted on the y-axis were calculated by the ratios of water stress groups to the normal group. The boxes represent the range of relative values in rice root traits. Round dots (●) in the boxes represent the means for each group. The ellipses plotted over the bars refer to some outstanding treatments, marked with the arrows and text next to the side.
Agronomy 11 02103 g004
Figure 5. The accumulation (a,c,e) and partitioning (b,d,f) of tissue nitrogen (N), phosphorus (P) and potassium (K) in rice under different water stresses at maturity. Each treatment was performed on means of three years (n = 9 for DFAA1–DFAA9, D1–D3, D7–D9, F1–F3 and F7–F9, n = 6 for D4–D6 and F4–F6). Different letters indicate the significant difference at 0.05 level. DFAA, drought followed by flooding; D, drought followed by no flooding (drought alone); F, no drought followed by flooding (flooding alone).
Agronomy 11 02103 g005
Figure 6. Relationships of (a) relative total nutrient content (RTN, RTP and RTK) and relative grain yield (RGY), and (bd) relative nutrient use efficiencies (NUEc, PUEc and KUEc) and RGY at maturity in 2016–2018. RTN, relative total N content; RTP, relative total P content; RTK, relative total K content. “NS” means not significant; ** indicates significant differences at 0.01 probability levels. DFAA, drought followed by flooding; D, drought followed by no flooding (drought alone); F, no drought followed by flooding (flooding alone).
Agronomy 11 02103 g006
Table 1. Experimental water control design for rice jointing–booting stage in the years of 2016–2018.
TreatmentDrought Phase (Stage I)Flooding Phase (Stage II)
Drought Degree
(% FC)
Duration
(/D)
Beginning and Ending Dates
(Mon/D)
Flooding Degree
(/Plant Height)
Duration
(/D)
Beginning and Ending Dates
(Mon/D)
201620172018201620172018
DFAA150(severe)57/25–7/297/30–8/37/28–8/11/1(heavy)77/30–8/58/4–8/108/2–8/8
DFAA250(severe)107/25–8/37/25–8/37/23–8/11/29(heavy)8/4–8/128/4–8/128/2–8/10
DFAA350(severe)157/25–8/87/20–8/37/18–8/13/45(light)8/9–8/138/4–8/88/2–8/6
DFAA460(middle)57/25–7/297/30–8/37/28–8/13/49(heavy)7/30–8/78/4–8/128/2–8/10
DFAA560(middle)107/25–8/37/25–8/37/23–8/11/1(heavy)58/4–8/88/4–8/88/2–8/6
DFAA660(middle)157/25–8/87/20–8/37/18–8/11/2(light)78/9–8/158/4–8/108/2–8/8
DFAA770(mild)57/25–7/297/30–8/37/28–8/11/25(light)7/30–8/38/4–8/88/2–8/6
DFAA870(mild)107/25–8/37/25–8/37/23–8/13/47(light)8/4–8/108/4–8/108/2–8/8
DFAA970(mild)157/25–8/87/20–8/37/18–8/11/1(heavy)98/9–8/178/4–8/128/2–8/10
Drought aloneD1~D3, D7~D9 (2016)
D1~D9 (2017, 2018)
Continuous flooding (2~3 cm)
Flooding aloneContinuous flooding (2~3 cm)F1~F3, F7~F9 (2016)
F1~F9 (2017, 2018)
ControlContinuous flooding (2~3 cm)
Notes: DFAA, drought followed by floods abrupt alternation; D, drought followed by no floods; F, no drought followed by floods. FC, field capacity; Mon/D, month/day. D1~D9 and F1~F9 are the parallel control groups of DFAA1~DFAA9.
Table 2. Biological yield and its components of Longliangyouhuazhan (Indica hybrid cultivar) under different water stresses groups at maturity.
TreatmentBiomass (Partitioning)Yield and Its Components
Root DWStem DWLeaf DWPanicle DWRoot/ShootPaniclesSpikeletsFilled GrainsYield
g/pot (%)g/pot (%)g/pot (%)g/pot (%)g/g/pot/Panicle%g/pot
Control18.6 (5.6) A126.7 (38.2) C42.3 (12.7) B144.2 (43.5) A0.0592 A30.3 A241.9 A76.8 C137.9 A
DFAA13.0 (4.3) D139.6 (46.2) B46.4 (15.4) A103.0 (34.1) C0.0447 C31.0 A166.7 C79.0 B96.8 C
Drought alone14.8 (4.9) C111.2 (37.2) D42.4 (14.2) B130.4 (43.7) B0.0520 B30.9 A186.9 B85.2 A124.4 B
Flooding alone15.5 (4.9) B167.9 (53.4) A45.4 (14.5) A85.4 (27.2) D0.0514 B30.2 A156.6 D65.2 D78.8 D
Notes: DFAA, drought–flood abrupt alternation group. DW, dry weight. Each value represents the average value for each water stress group in three years. Different letters indicate statistical significance at the p = 0.05 level within the same column. The values in parenthesis for each trait refer to the partitioning ratios of the biomass compositions.
Table 3. Specific absorption rates (SAR), nutrient use efficiencies (NUE, PUE and KUE) and nutrient ratios in rice under different water stresses at maturity.
TreatmentSpecific Absorption RatesUse EfficienciesNutrient’s Ratios
mg Nutrient/g Root DWg Grain/g Nutrientmg/mg
SAR-NSAR-PSAR-KNUEPUEKUEN:PN:KK:P
Control225.3 C28.4 C162.0 D33.5 A140.3 B46.5 A4.12 D1.39 B3.12 D
DFAA334.4 A34.7 A220.1 A24.0 B121.4 c36.7 C5.13 A1.54 A3.36 B
Drought alone266.7 C29.2 B211.6 B32.5 A162.7 A42.2 B5.04 B1.30 B3.98 A
Flooding alone272.7 B24.9 D178.5 C19.5 C89.2 D29.4 D4.57 C1.55 A2.89 C
Notes: DFAA drought–flood abrupt alternation group. Specific absorption rates, the ratio of root length and root DW, m g−1; DW, dry weight. Each value represents the average value for each water stress group in three years. Different letters indicate statistical significance at the p = 0.05 level within the same column.
Table 4. Correlation analysis of the main morpho-agronomic traits at the end of water stresses with grain yield, total uptake of N, P and K, specific absorption rates (SAR-N, SAR-P and SAR-K), nutrient use efficiencies (NUE, PUE and KUE) at maturity in 2016–2018.
Traits aGrain YieldTotal
N
Total
P
Total
K
SAR-NSAR-PSAR-KNUEPUEKUE
Grain Yield1.0000.2680.3970.423 *0.1080.2400.3480.926 **0.826 **0.801 **
Stem DW−0.856 **0.056−0.154−0.352−0.046−0.138−0.300−0.860 **−0.792 **−0.847 **
Leaf DW−0.623 **0.2260.351−0.2260.2000.345−0.024−0.617 **−0.822 **−0.622 **
Root DW0.058−0.1300.031−0.087−0.894 **−0.704 **−0.720 **−0.156−0.234−0.222
RLD−0.2540.3030.459 *0.307−0.700 **−0.734 **−0.620 **0.378 *0.437 *0.232
SRL−0.2220.2630.0890.3420.0980.0110.1290.2780.387 *0.277
RMD−0.139−0.507 **−0.403 *−0.453 *−0.038−0.143−0.123−0.380 *−0.542 **−0.383 *
RSA0.1800.2030.2320.110−0.676 **−0.702 **−0.592 **0.2870.2510.305
Max. root depth0.771 **0.391 *0.568 **0.566 **−0.1400.0170.2340.483 **0.530 **0.202
Adventitious roots0.048−0.325−0.022−0.055−0.075−0.260−0.085−0.158−0.253−0.277
Notes: Data from different water stresses (control, DFAA, drought alone and flooding alone) in the three years of 2016–2018 were included (n = 78). a SAR-N, SAR-P and SAR-K, specific absorption rates of N, P and K, respectively; NUE, PUE and KUE, use efficiencies of N, P and K, respectively; DW, dry weight; RLD, root length density; SRL, specific root length; RMD, root mean diameter; RSA, root surface area. * Significant at p < 0.05. ** Significant at p < 0.01.
Publisher’s Note: MDPI stays neutral with regard to jurisdictional claims in published maps and institutional affiliations.

