
Impact of Shelterbelt and Peatland Barriers on Agricultural Landscape Groundwater: Carbon and Nitrogen Compounds Removal Efficiency


Abstract
:1. Introduction
2. Materials and Methods
2.1. Study Area
2.1.1. Shelterbelt
2.1.2. Transect of Peatland
2.2. Groundwater Physicochemical Analyses
3. Results and Discussion
3.1. pH
3.2. Carbon
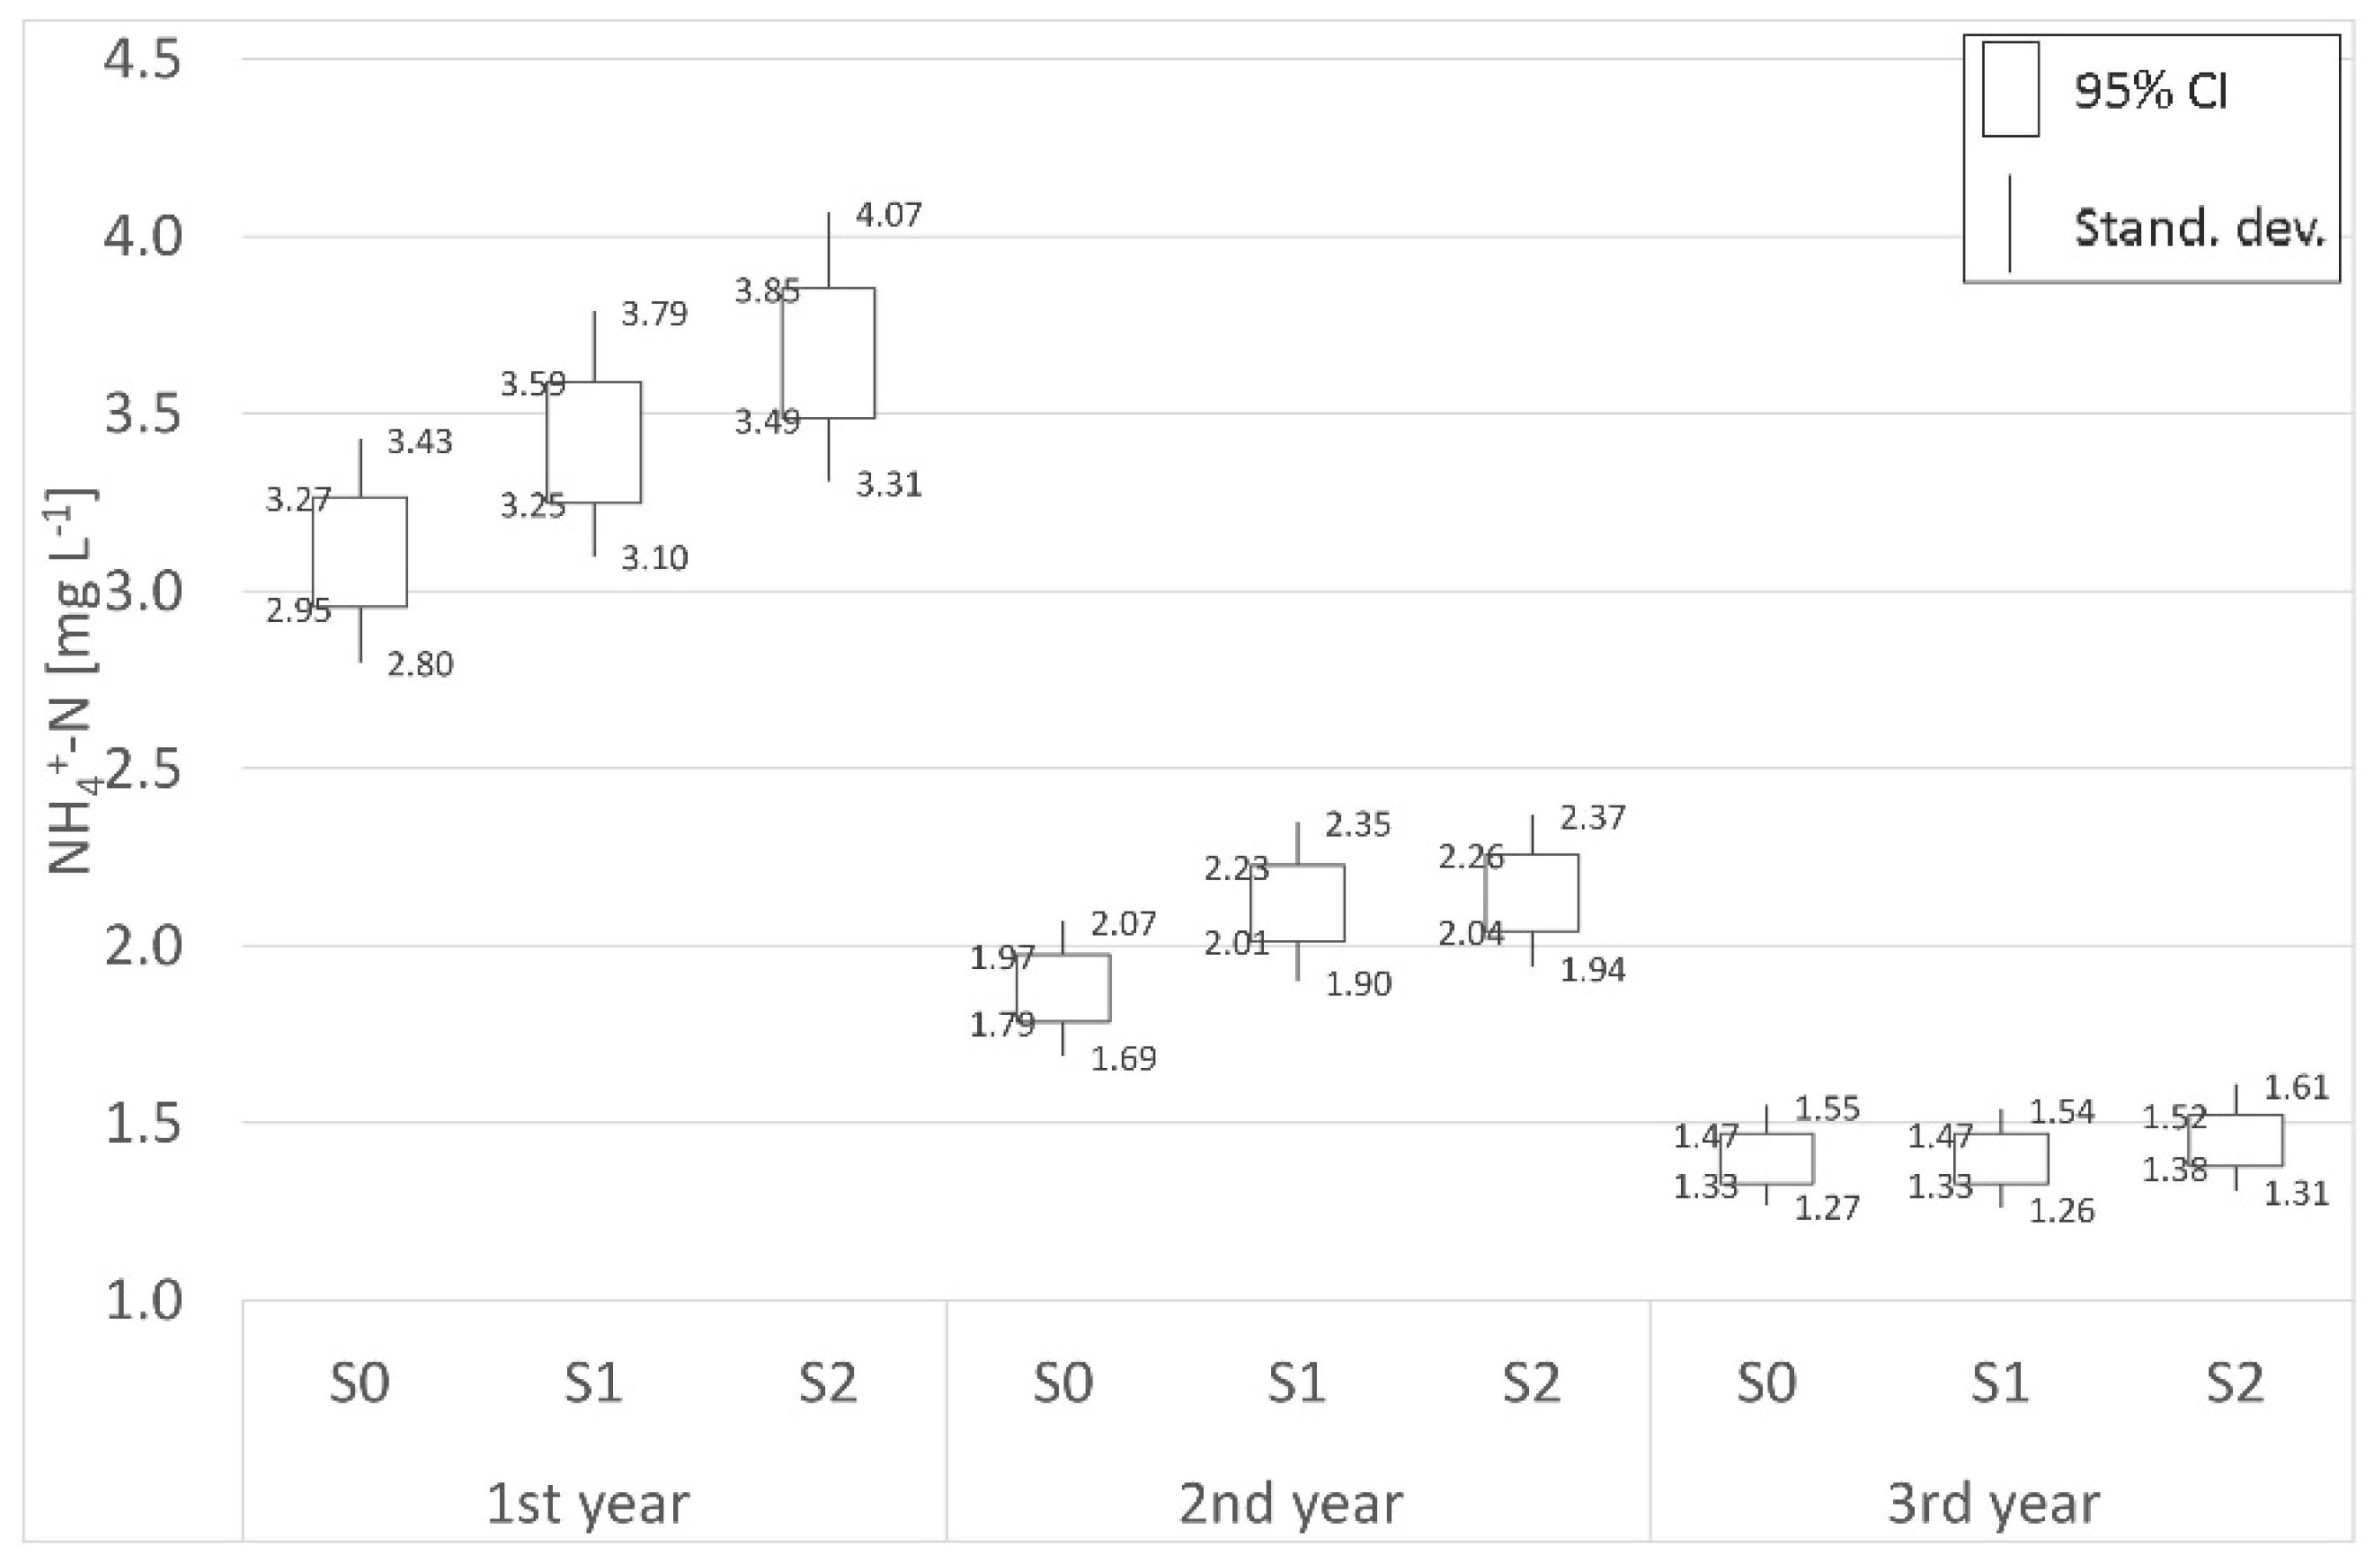
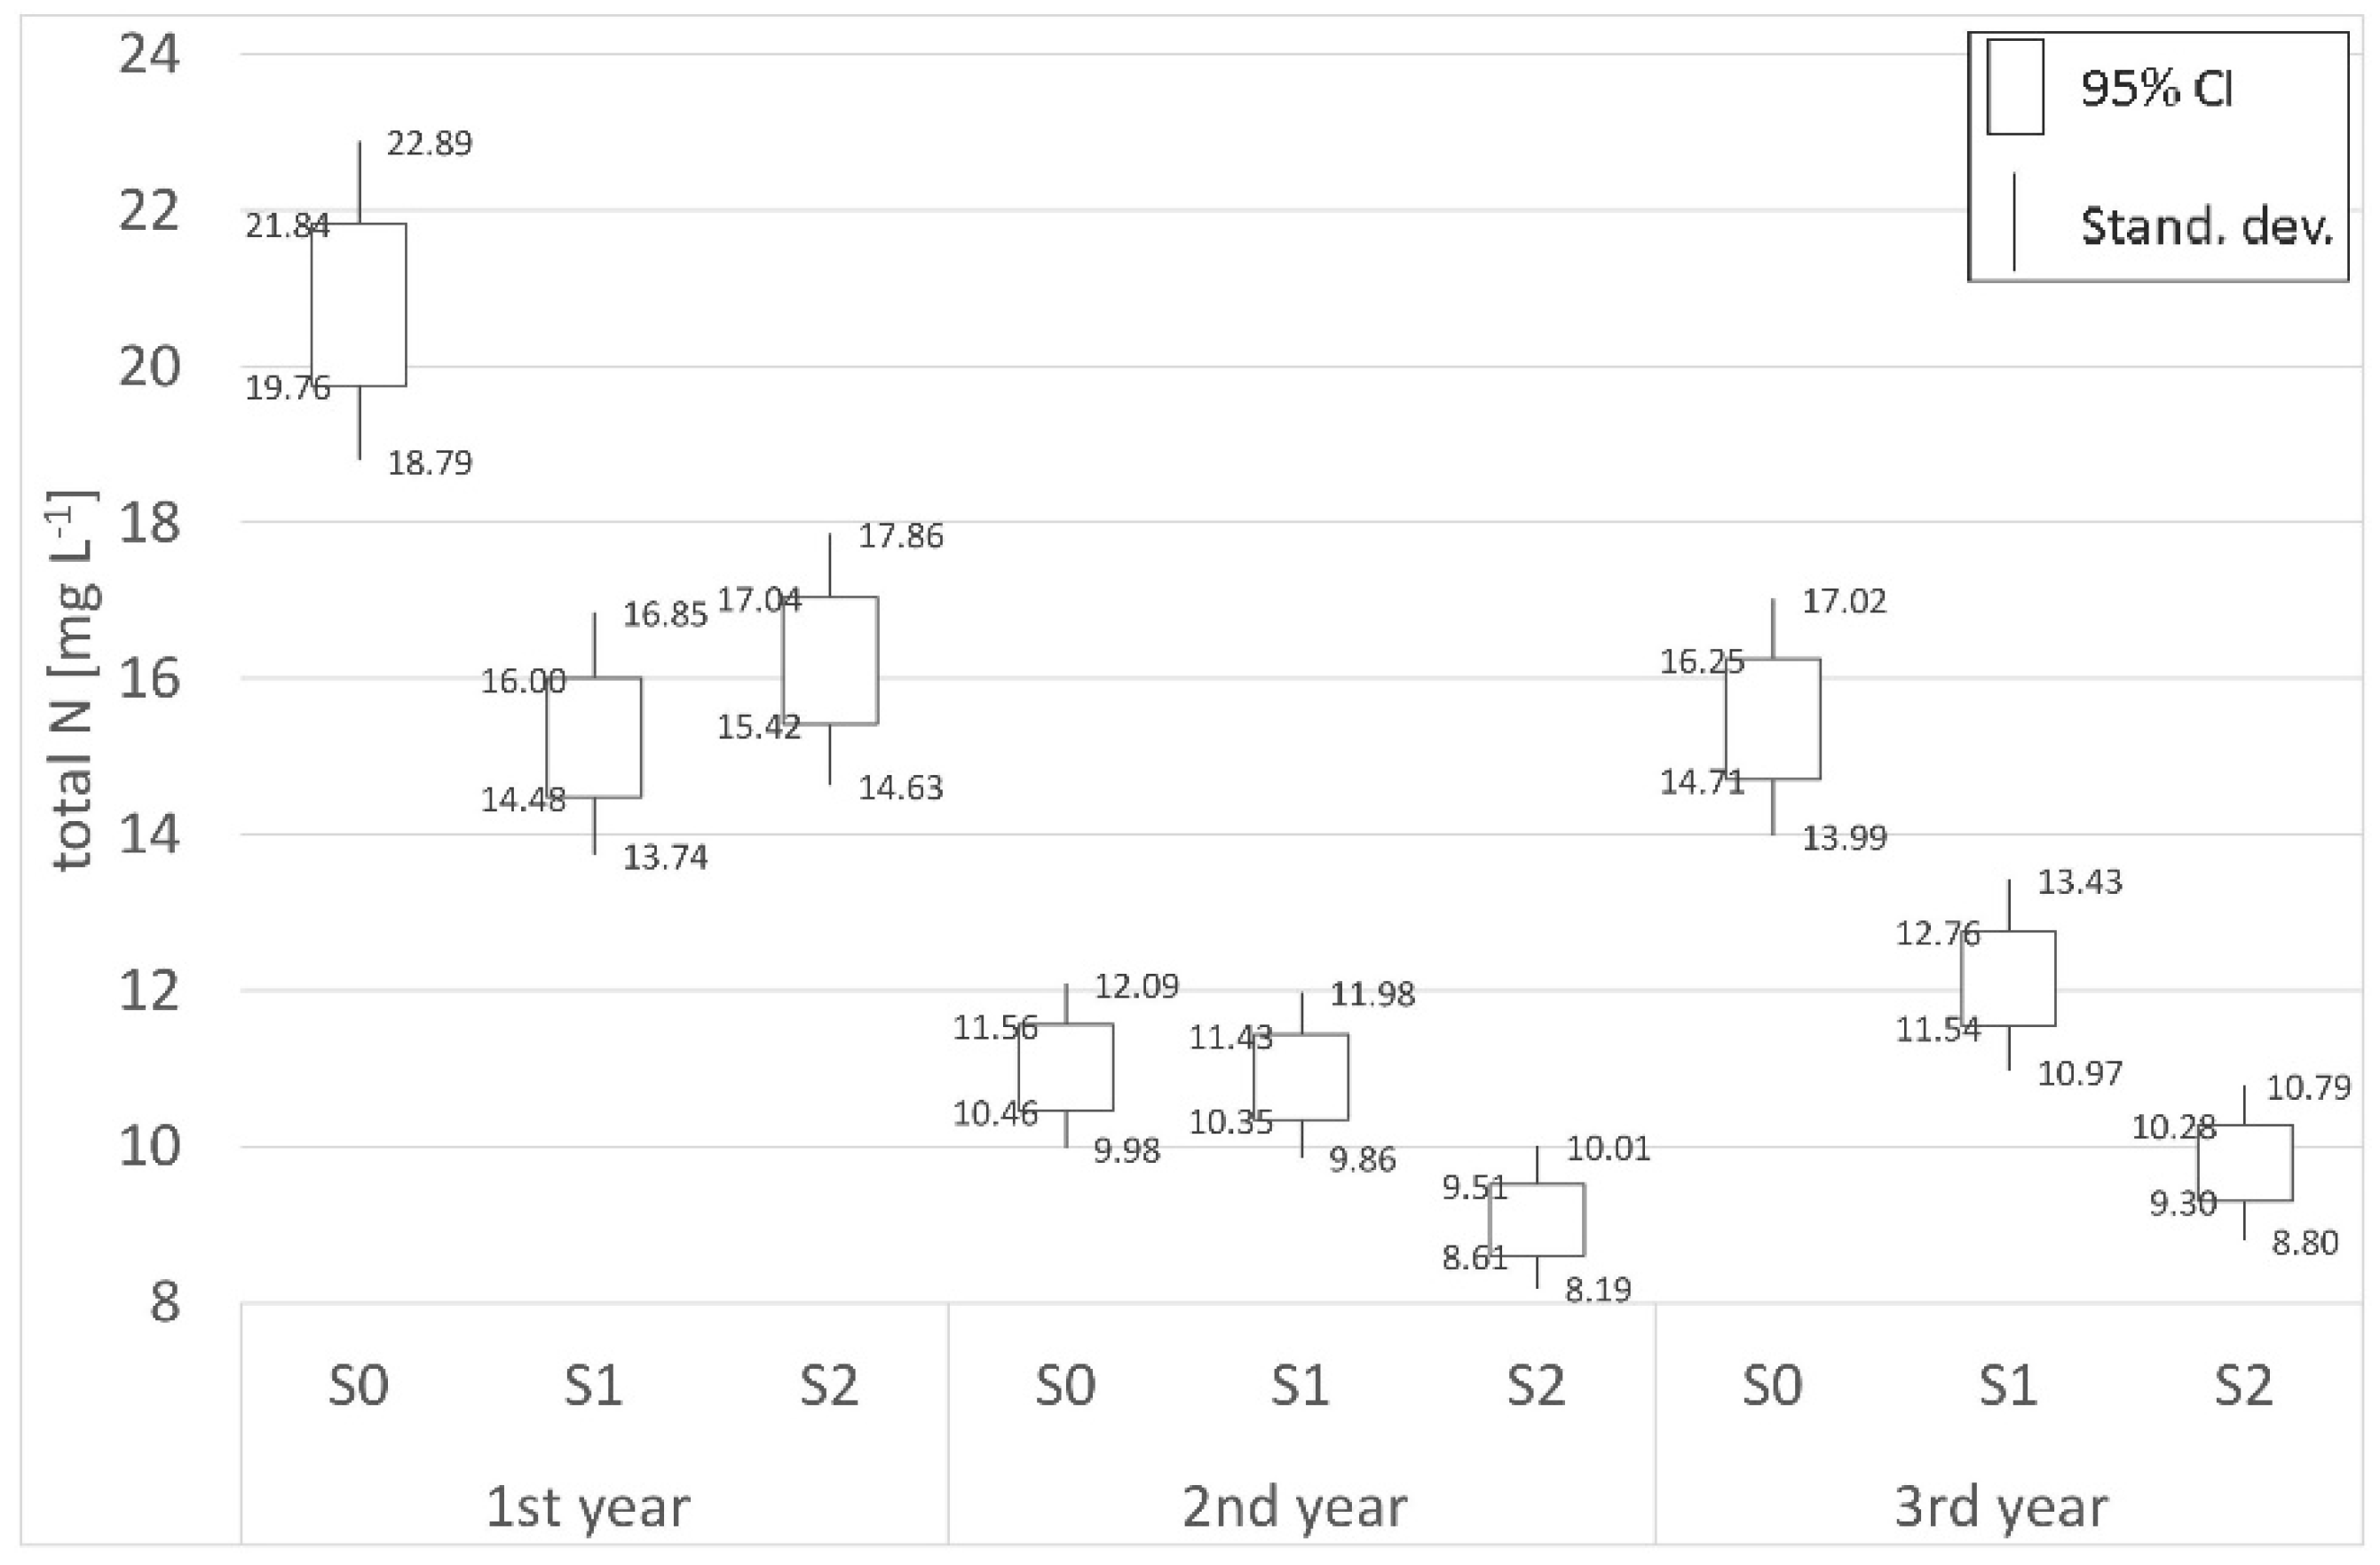
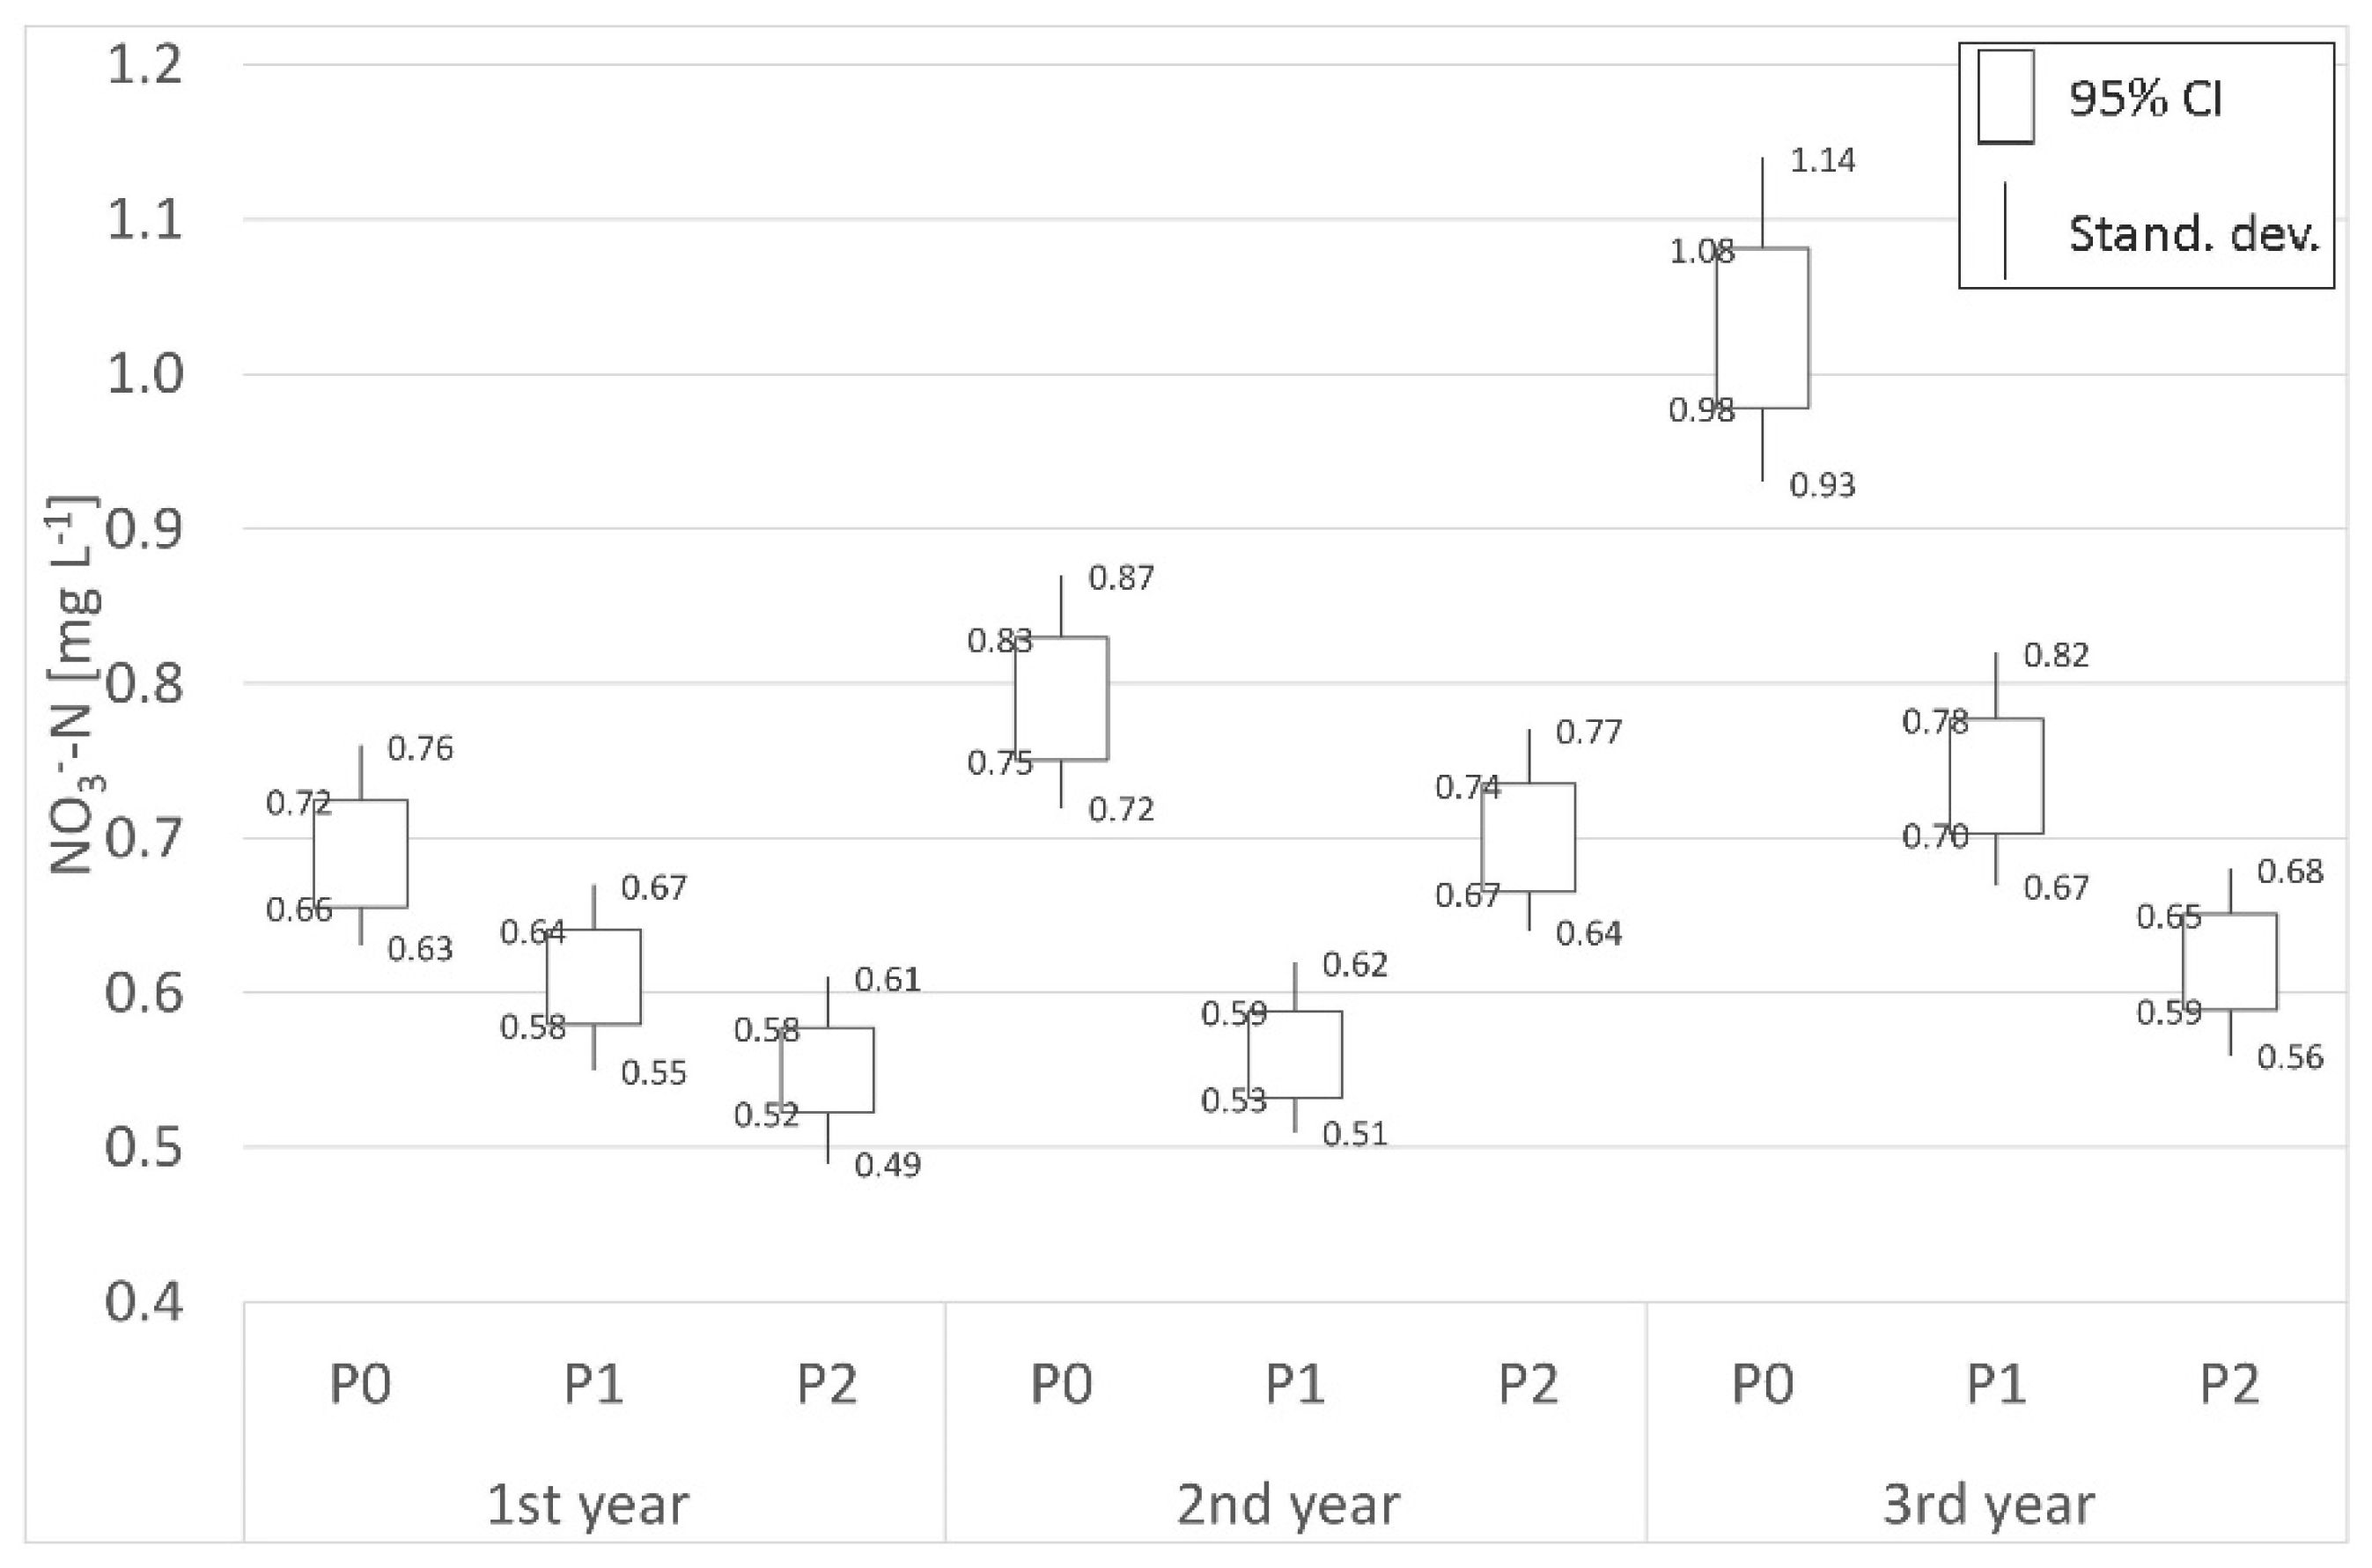
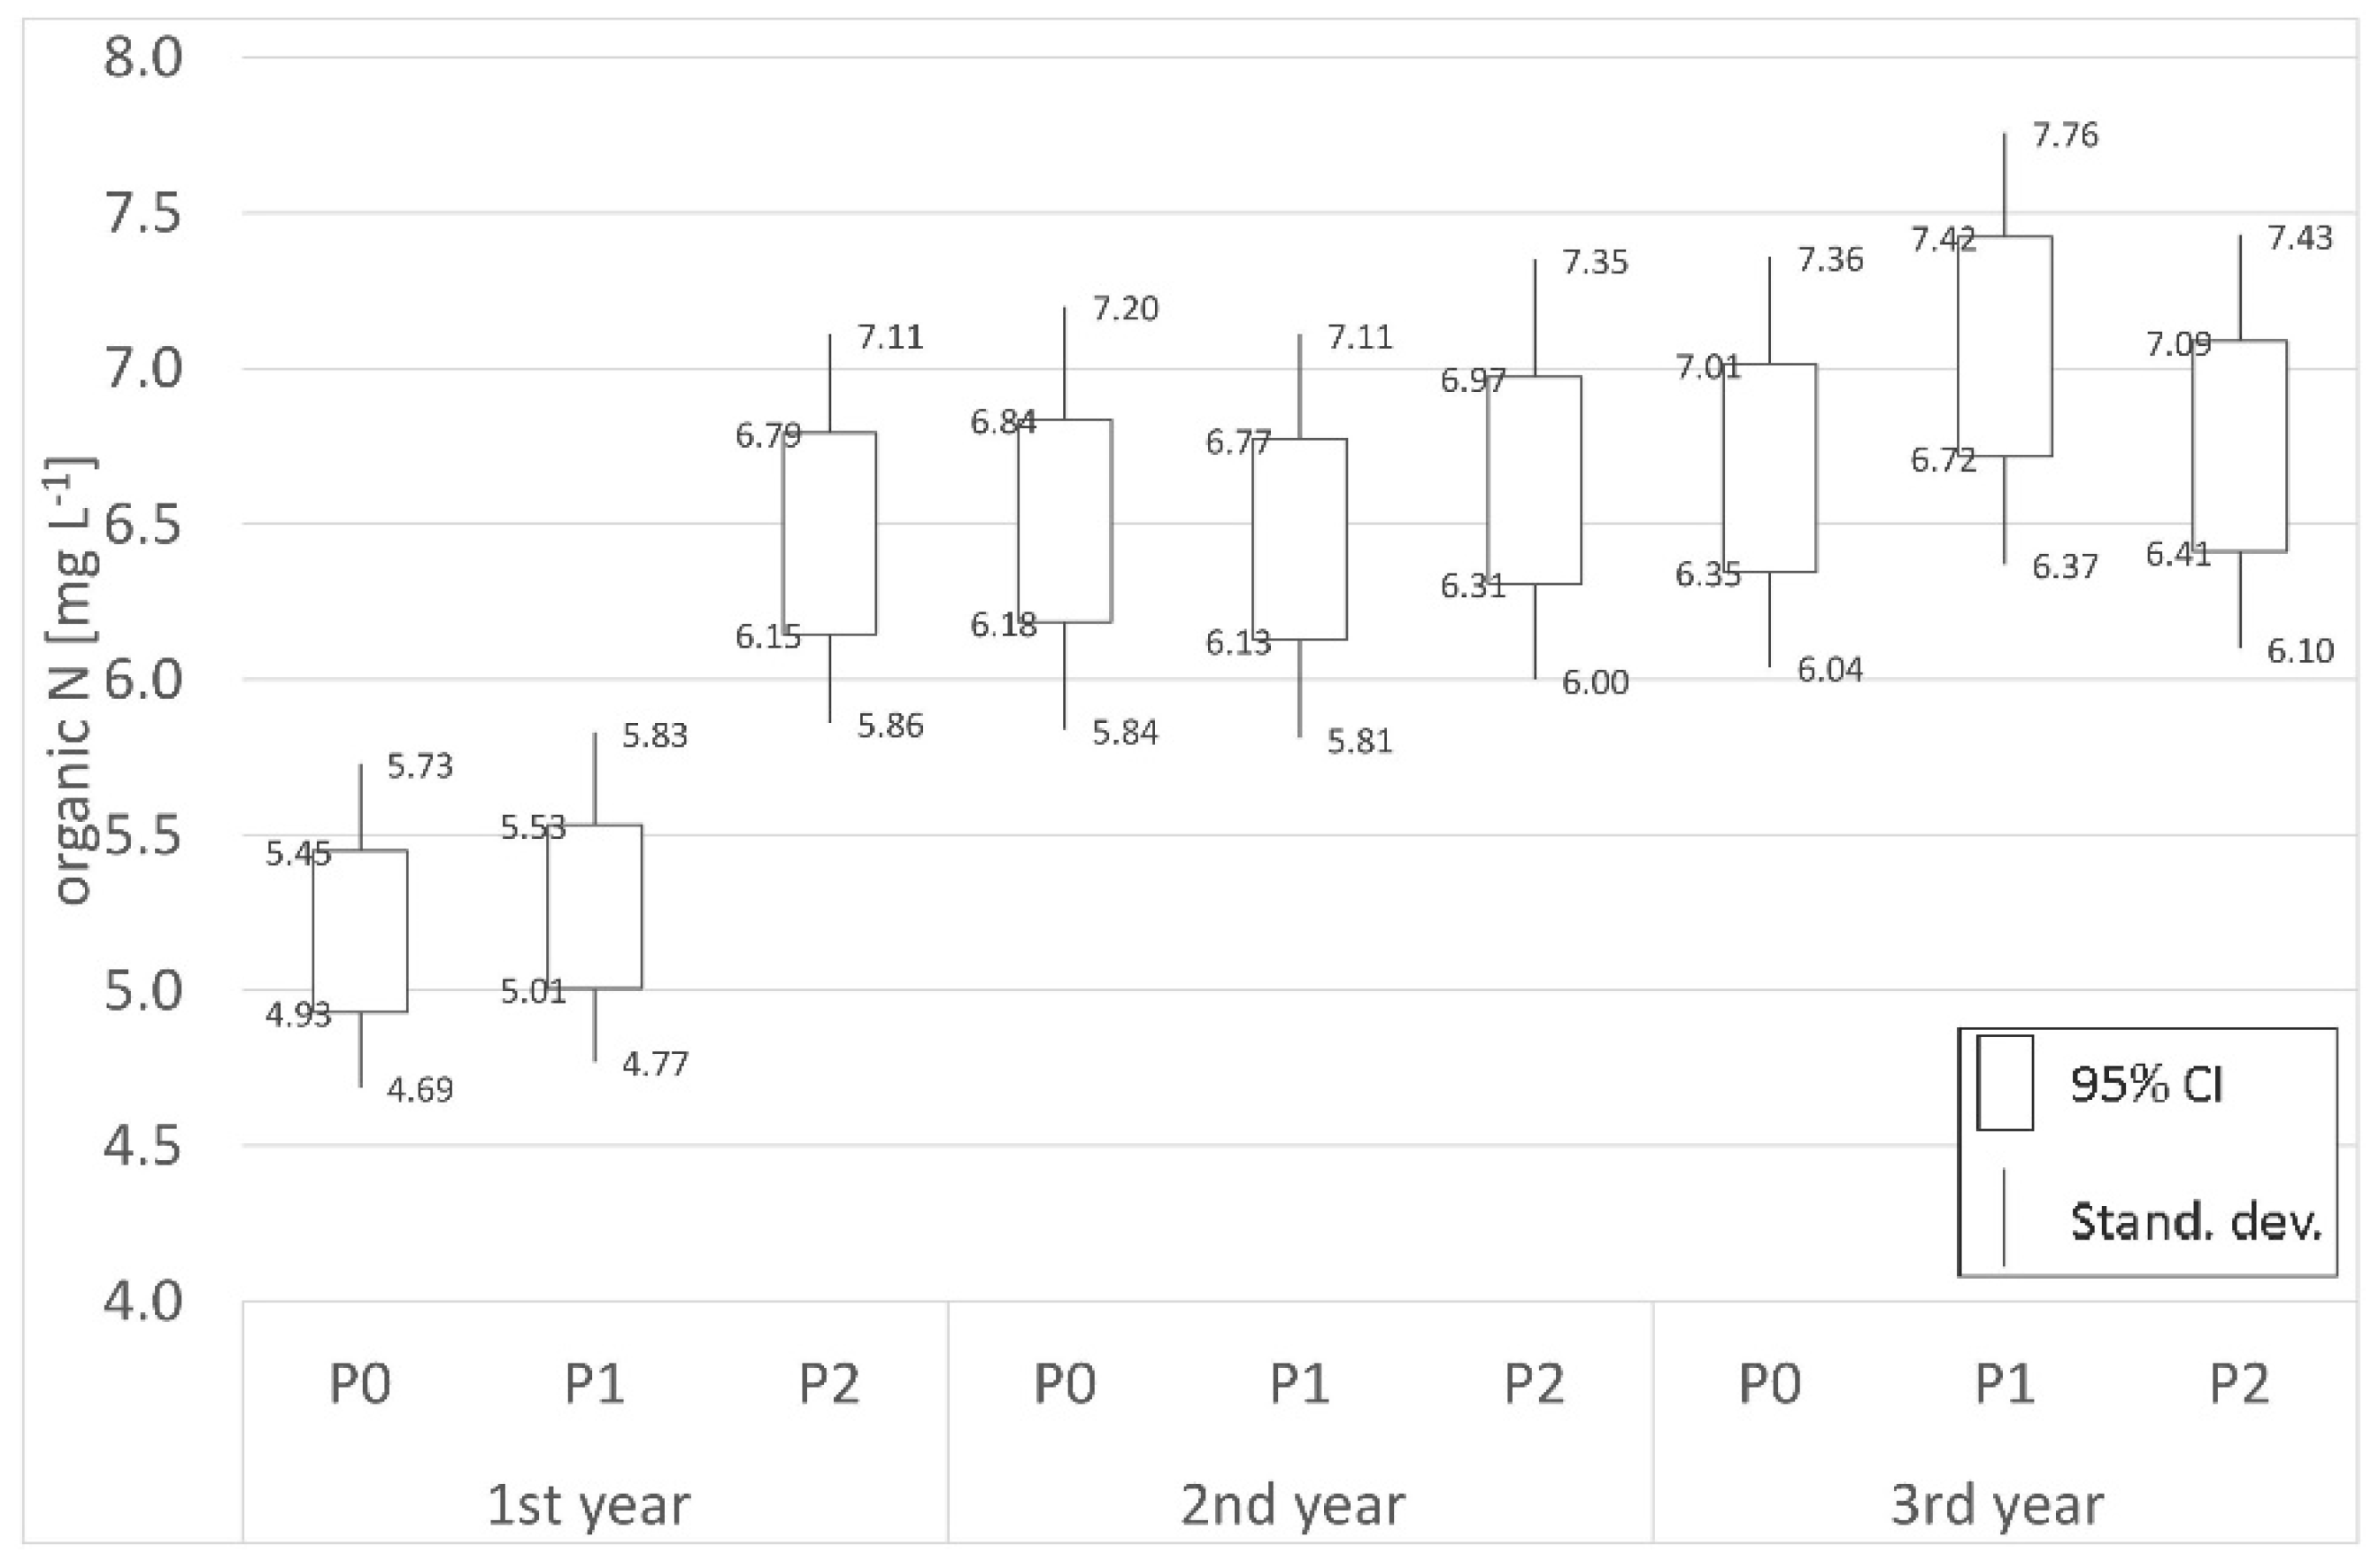
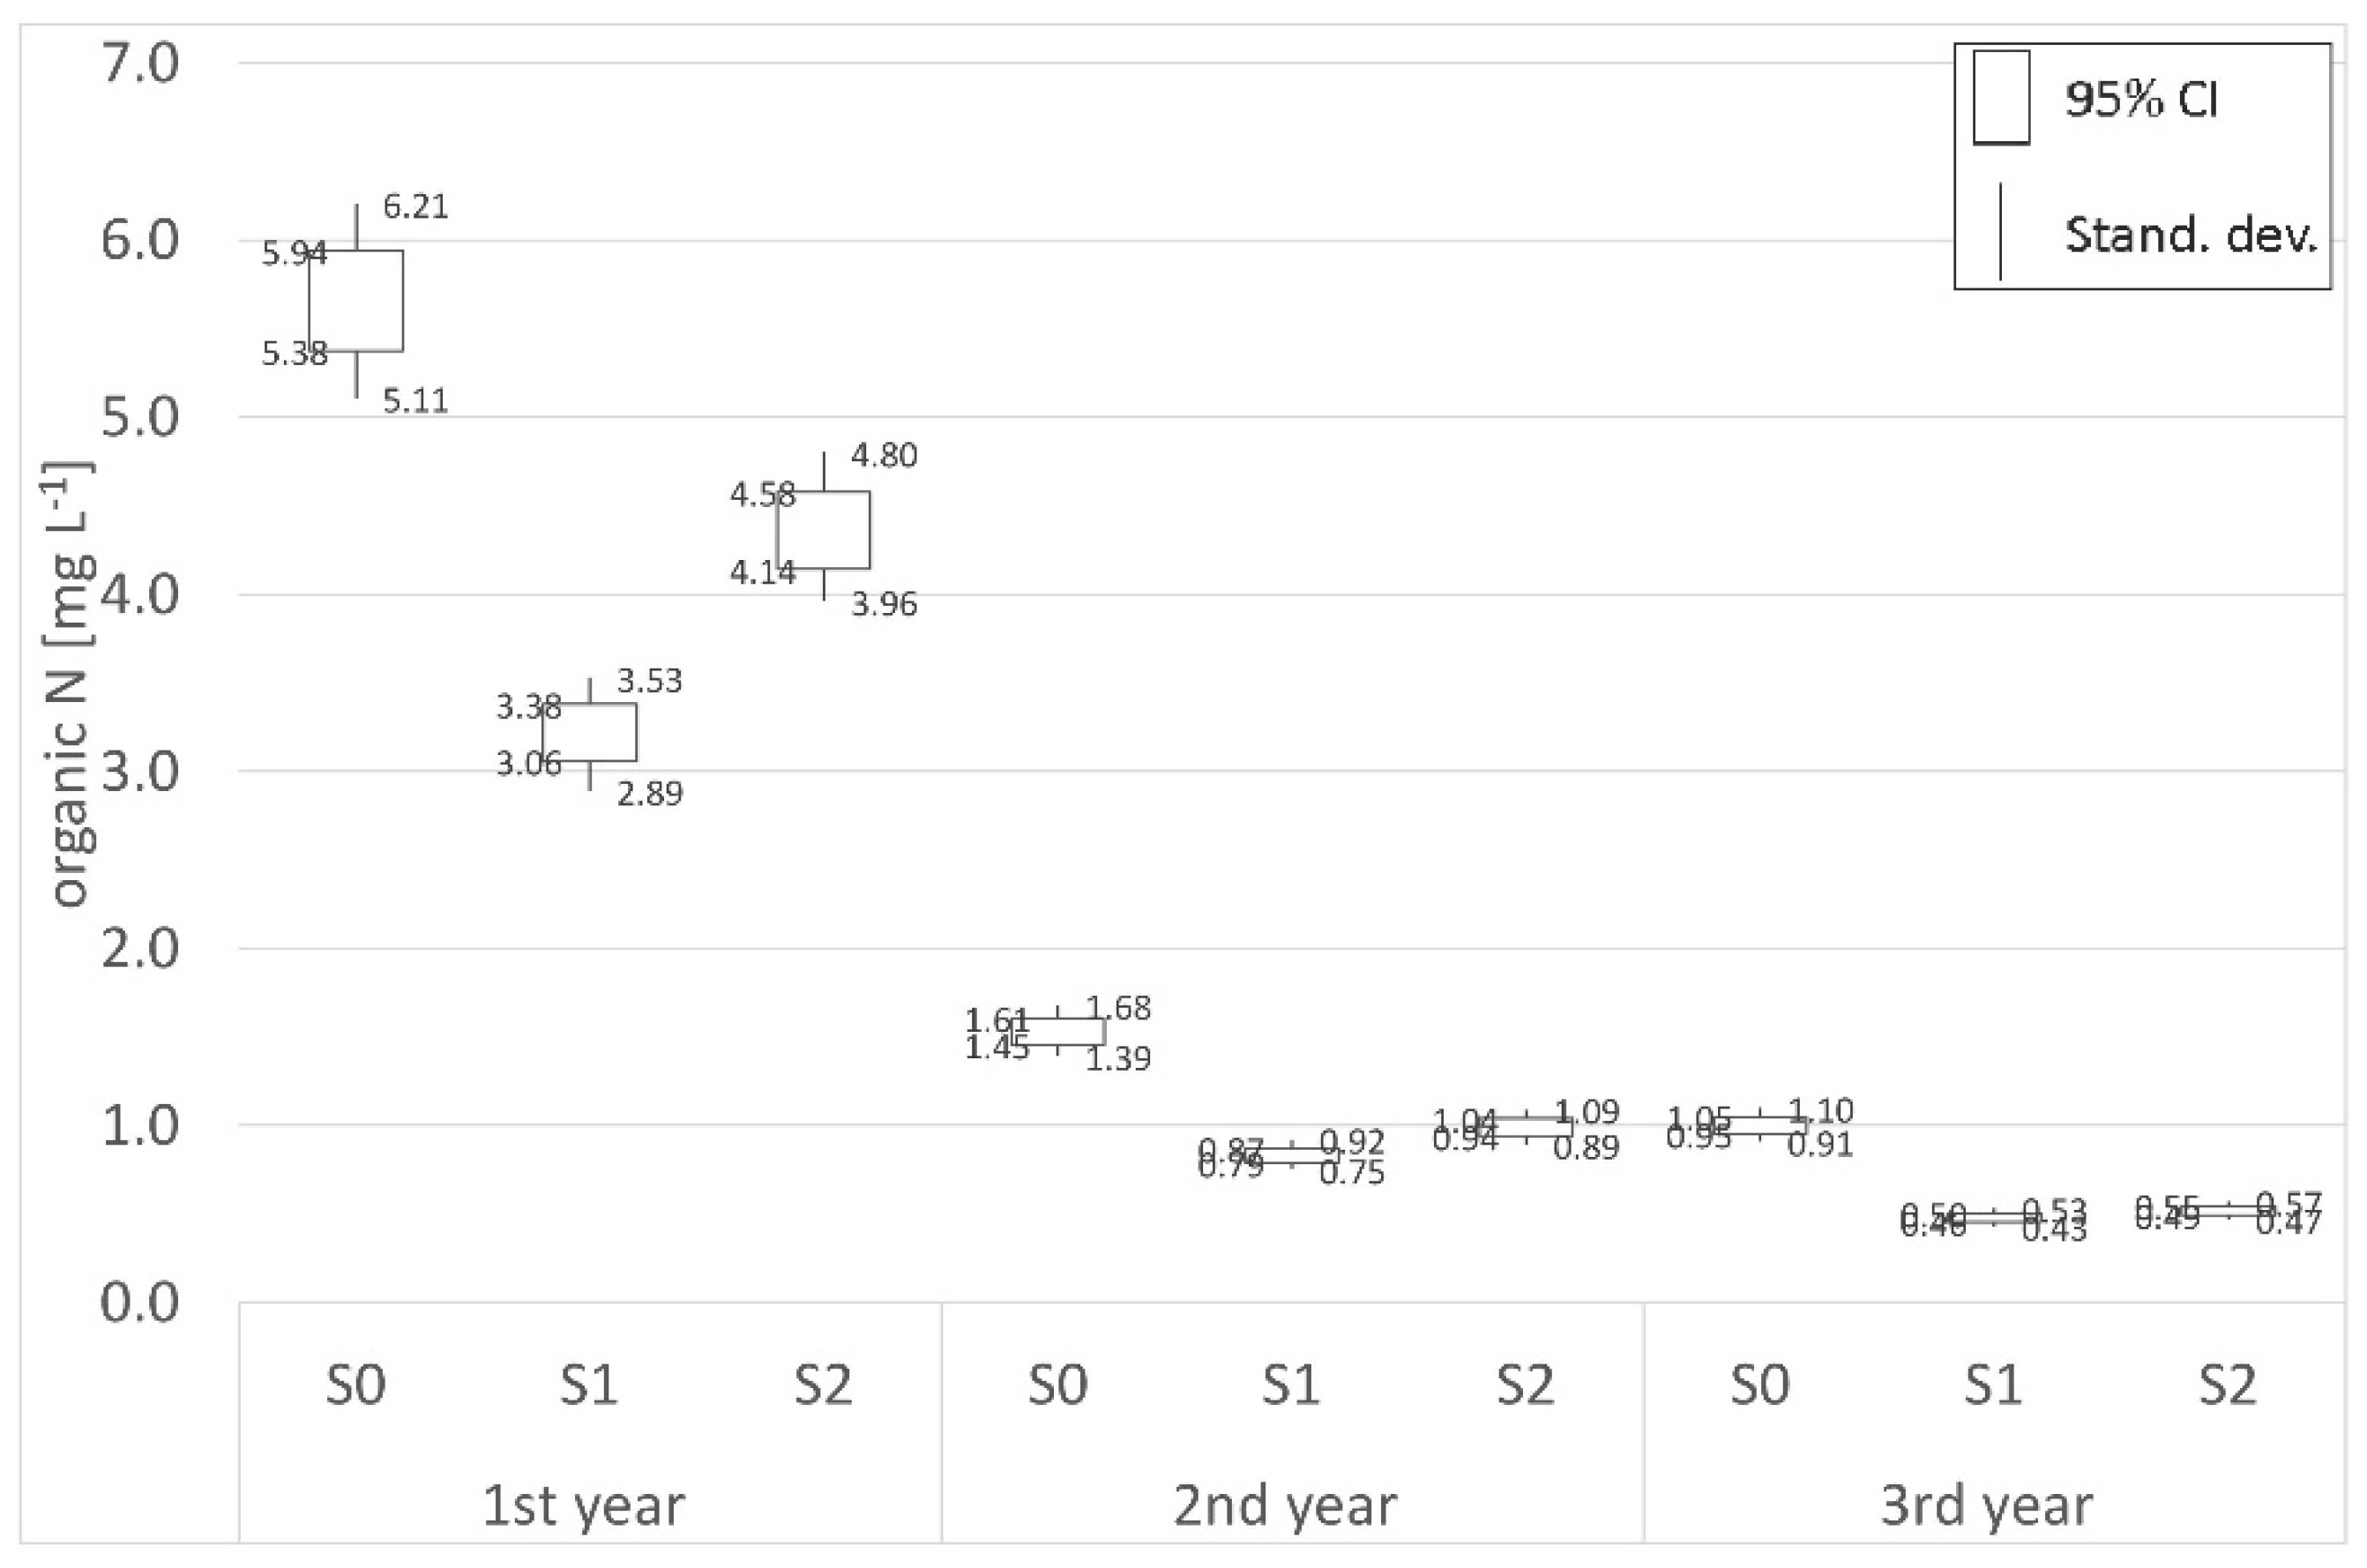
3.3. Nitrogen
4. Conclusions and Future Directions
Author Contributions
Funding
Conflicts of Interest
References
- Osmond, D.L.; Gilliam, J.W.; Evans, R.O. Riparian buffers and controlled drainage to reduce agricultural nonpoint source pollution. Raleigh, North Carolina State University. N. C. Agric. Res. Serv. Tech. Bull. 2002, 318, 1–64. [Google Scholar]
- Fabietti, G.; Biasioli, M.; Barberis, R.; Ajmone-Marsan, F. Soil contamination by organic and inorganic pollutants at the regional scale: The case of Piedmont, Italy. J. Soils Sediments 2010, 10, 290–300. [Google Scholar] [CrossRef]
- Howard-Williams, C.; Downes, M.T. Nitrogen cycling in wetlands. In Nitrate, Patterns, and Management; Burt, T.P., Heathwaite, A.L., Trudgi, S.T., Eds.; John Wiley & Sons: Chichester, UK, 1993; pp. 141–167. [Google Scholar]
- Szajdak, L.; Maryganova, V.; Meysner, T.; Tychinskaja, L. Effect of shelterbelt on two kinds of soils on the transformation of organic matter. Environ. Int. 2002, 28, 383–392. [Google Scholar] [CrossRef]
- Szajdak, L.; Życzyńska-Bałoniak, I.; Jaskulska, R. Impact of afforestation on the limitation of the spread of the pollution in groundwater and in soils. Pol. J. Environ. Stud. 2003, 12, 453–459. [Google Scholar]
- Życzyńska-Bałoniak, I.; Szajdak, L.; Jaskulska, R. Impact of biogeochemical barrier on the migration of chemical compounds with the water of agricultural landscape. Pol. J. Environ. Stud. 2005, 14, 131–136. [Google Scholar]
- Hill, A.R. Nitrate removal in stream riparian zones. J. Environ. Qual. 1996, 25, 743–755. [Google Scholar] [CrossRef]
- Carpenter, S.R.; Caraco, N.F.; Correll, D.L.; Howarth, R.W.; Sharpley, A.N.; Smith, V.H. Nonpoint pollution of surface waters with phosphorus and nitrogen. Ecol. Appl. 1998, 8, 559. [Google Scholar] [CrossRef]
- Finlay, J.C.; Small, G.E.; Sterner, R.W. Human influences on nitrogen removal in lakes. Science 2013, 342, 247–250. [Google Scholar] [CrossRef]
- Wu, H.; Zhang, J.; Ngo, H.H.; Guo, W.; Liang, S. Evaluating the sustainability of free water surface flow constructed wetlands: Methane and nitrous oxide emissions. J. Clean. Prod. 2017, 147, 152–156. [Google Scholar] [CrossRef] [Green Version]
- Kroeger, K.D.; Cole, M.L.; Valiela, I. Groundwater-transported dissolved organic nitrogen exports from coastal watersheds. Limnol. Oceanogr. 2006, 51, 2248–2261. [Google Scholar] [CrossRef] [Green Version]
- Mueller, B.A.; Newton, K.; Holly, E.A.; Preston-Martin, S. Residential water source and the risk of childhood brain tumors. Environ. Health Perspect. 2001, 109, 551–556. [Google Scholar] [CrossRef] [PubMed]
- Weyer, P.J.; Cerhan, J.R.; Kross, B.C.; Hallberg, G.R.; Kantamneni, J.; Breuer, G.; Jones, M.P.; Zheng, W.; Lynch, C.F. Municipal Drinking water nitrate level and cancer risk in older women: The Iowa women’s health study. Epidemiology 2001, 12, 327–338. [Google Scholar] [CrossRef]
- Fan, A.M. Nitrate and nitrite in drinking water: A toxicological review. In Encyclopedia of Environmental Health; Elsevier: Amsterdam, The Netherlands, 2011; pp. 137–145. [Google Scholar]
- Ward, M.H.; Brender, J.D. Drinking water nitrate and health. In Encyclopedia of Environmental Health; Elsevier: Amsterdam, The Netherlands, 2011; pp. 167–178. [Google Scholar] [CrossRef]
- Khaleel, R.; Reddy, K.; Overcash, M. Transport of potential pollutants in runoff water from land areas receiving animal wastes: A review. Water Res. 1980, 14, 421–436. [Google Scholar] [CrossRef]
- Overcash, M.R.; Davidson, J.M. (Eds.) Environmental Impact of Nonpoint Source Pollution; Science Publishers Inc.: Ann Arbor, MI, USA, 1980. [Google Scholar]
- Enfield, C.G.; Phan, T.; Walters, D.M. Kinetic model for phosphate transport and transformation in calcareous soils: II. Laboratory and field transport. Soil Sci. Soc. Am. J. 1981, 45, 1064–1070. [Google Scholar] [CrossRef]
- Correll, D.L. Buffer zones and water quality protection: General principles. In Buffer Zones: Their Processes and Potential in Water Protection; Haycock, N., Burt, T., Goulding, K., Pinay, G., Eds.; Quest Environmental: Harpenden, Herdfordshire, UK, 1997; pp. 7–20. [Google Scholar]
- Ryszkowski, L. Landscape Ecology in Agroecosystems Management; Ryszkowski, L., Ed.; CRC Press: Boca Raton, FL, USA, 2001; p. 384. [Google Scholar] [CrossRef]
- Ilnicki, P.; Szajdak, L.W. Zanikanie Torfowisk (Peatland Disappearance); Wydawnictwo Poznańskiego Towarzystwa Przyjaciół Nauk: Poznań, Poland, 2016. (In Polish) [Google Scholar]
- Krzywonos, K. Kształtowanie się czynników klimatycznych na zmeliorowanych torfowiskach, wpływających na warunki gospodarowania (The formation of climatic factors on drained peatlands affecting the management conditions). Bibl. Wiadomości IMUZ 1991, 77, 119–125. (In Polish) [Google Scholar]
- Ryszkowski, L.; Kędziora, A. Modification of water flows and nitrogen fluxes by shelterbelts. Ecol. Eng. 2007, 29, 388–400. [Google Scholar] [CrossRef]
- Szajdak, L.; Szczepański, M.; Bogacz, A. Impact of secondary transformation of peat-moorsh soils on the process of purification of ground water. Agron. Res. 2007, 5, 189–200. [Google Scholar]
- Szajdak, L.W.; Życzyńska-Bałoniak, I. Effectiveness of a shelterbelt in decreasing the level of inorganic elements in agricultural landscape. Est. J. Ecol. 2013, 62, 24–34. [Google Scholar] [CrossRef] [Green Version]
- Inisheva, L.I.; Szajdak, L.; Sergeeva, M.A. Dynamics of biochemical processes and redox conditions in geochemically linked landscapes of oligotrophic bogs. Eurasian Soil Sci. 2016, 49, 466–474. [Google Scholar] [CrossRef]
- Hammer, D.A. Designing constructed wetlands systems to treat agricultural nonpoint source pollution. Ecol. Eng. 1992, 1, 49–82. [Google Scholar] [CrossRef]
- Larson, A.C.; Gentry, L.E.; David, M.B.; Cooke, R.A.; Kovacic, D.A. The role of seepage in constructed wetlands receiving agricultural tile drainage. Ecol. Eng. 2000, 15, 91–104. [Google Scholar] [CrossRef]
- Maynard, J.J. Spatial and Temporal Dynamics of Carbon and Nutrient Cycling in a Eutrophic Flow-Through Wetland. Ph.D. Thesis, University of California, Davis, CA, USA, 2009. [Google Scholar]
- Hussain, I.; Raschid, L.; Hanjra, M.A.; Marikar, F.; van der Hoek, W. Wastewater Use in Agriculture: Review of Impacts and Methodological Issues in Valuing Impacts; Publisher: Colombo, Sri Lanka, 2002. [Google Scholar] [CrossRef]
- Angelakis, A.; Snyder, S. Wastewater treatment and reuse: Past, present, and future. Water 2015, 7, 4887–4895. [Google Scholar] [CrossRef] [Green Version]
- Recommendation No. R (94) 6 of the Committee of Ministers to Member States for a Sustainable Development and Use of the Countryside with a Particular Focus on the Safeguarding of Wildlife and Landscapes (Adopted by the Committee of Ministers on 5 September 1994 at the 516th meeting of the Ministers’ Deputies); Council of Europe Committee of Ministers: Strasbourg, France, 15 September 1999; No. R (99) 18; Available online: https://www.refworld.org/docid/510101e02.html (accessed on 30 September 2021).
- Ryszkowski, L.; Bartoszewicz, A. Impact of agricultural landscape structure on cycling of inorganic nutrients. In Ecology of Arable Land—Perspectives and Challenges; Clarholm, M., Bergstron, L., Eds.; Springer: Dordrecht, The Netherlands, 1989; pp. 241–246. [Google Scholar] [CrossRef]
- Ryszkowski, L.; Bartoszewicz, A.; Kędziora, A. Management of matter fluxes by biogeochemical barriers at the agricultural landscape level. Landsc. Ecol. 1999, 14, 479–492. [Google Scholar] [CrossRef]
- Szajdak, L.W. Shelterbelts: Efficient Element of the Landscape. Chemical and Biochemical Investigations of Ground Water and Soil; Szajdak, L.W., Ed.; LAP Lambert Academic Publishing: Saarbrücken, Germany, 2011; pp. 1–100. [Google Scholar]
- Systematyka Gleb Polski (Polish Soil Classification). Rocz. Glebozn. 1989, 40, 1–150. (In Polish)
- World Reference Base for Soil Resources 2014, Update 2015 (International Soil Classification System for Naming Soil and Creating Legends for Soil Maps; Food and Agriculture Organization of the United Nations, IUSS Working Group: Rome, Italy, 2015.
- Szajdak, L.W.; Szczepański, M. Impact of the solvent on leaching organic matter from secondary transformation of peat-moorsh soils. In Physical, Chemical and Biological Processes in Soils; Szajdak, L.W., Karabanov, A.K., Eds.; Wydawnictwo Prodruk: Poznań, Poland, 2010; pp. 475–492. [Google Scholar]
- Berg, B. Litter decomposition and organic matter turnover in northern forest soils. For. Ecol. Manag. 2000, 133, 13–22. [Google Scholar] [CrossRef]
- Bernacki, Z. Differentiation of litter decomposition rates and nitrogen and phosphorous release in different types of tree stand. In Physical, Chemical and Biological Processes in Soils; Szajdak, L.W., Karabanov, A.K., Eds.; Wydawnictwo Prodruk: Poznań, Poland, 2010; pp. 183–196. [Google Scholar]
- Licznar, M.; Drozd, J.; Licznar, S.E. Qualitative and quantitative composition of humic substances in deluvial soils of Płaskowyż Głubczycki. Zesz. Probl. Postępów Nauk Rol. 1993, 411, 139–148. [Google Scholar]
- Sapek, A.; Sapek, B.; Gotkiewicz, J. Różnicowanie się składu chemicznego warstwy murszowej gleb torfowych (Differentiation of the chemical composition of the moorsch layer of peat soils). Wiadomości IMUZ 1991, 16, 109–131. (In Polish) [Google Scholar]
- Chittleborough, D.; Smettem, K.; Cotsaris, E.; Leaney, F. Seasonal changes in pathways of dissolved organic carbon through a hillslope soil (Xeralf) with contrasting texture. Soil Res. 1992, 30, 465. [Google Scholar] [CrossRef]
- Burzyńska, I. Współzależność między zawartością DWO w roztworze ekstrakcyjnym 0.01 mol CaCl2 a wybranymi składnikami mineralnymi w wodach gruntowych (The relationships between DOC content in the 0.01 M CaCl2 soil extract and macro- and microelements in ground waters). Woda-Środowisko-Obsz. Wiej. 2004, 4, 525–535. (In Polish) [Google Scholar]
- Życzyńska-Bałoniak, I.; Ryszkowski, L.; Waack, A. Transport wodą gruntową rozpuszczonych związków organicznych poprzez zadrzewienia (Migration of dissolved organic compounds with groundwater through deciduous-tree shelterbelt). Zesz. Probl. Postępów Nauk Rol. 1998, 460, 167–176. (In Polish) [Google Scholar]
- Meysner, T.; Maryganova, V.; Szajdak, L. Transformation of nitrogen compounds in the muckous soils of a forest island. Acta Agrophys. 2006, 7, 447–452. [Google Scholar]
- Szajdak, L.W.; Szczepański, M. Impact of secondary transformation of peat-moorsh soils on the process of purification of ground water. In Mires and Peat; Kļavinš, M., Ed.; University of Latvia Press: Riga, Latvia, 2010; pp. 125–142. [Google Scholar]
- Reemtsma, T.; Bredow, A.; Gehring, M. The nature and kinetics of organic matter release from soil by salt solutions. Eur. J. Soil Sci. 1999, 50, 53–64. [Google Scholar] [CrossRef]
- Ryszkowski, L. Protection of water quality against nitrate pollution in rural areas. In L’eau, de la Cellule au Paysage; Wicherek, S., Ed.; Publisher: Paris, France, 2000; pp. 171–183. [Google Scholar]
- Hayden, M.J.; Ross, D.S. Denitrification as a nitrogen removal mechanism in a vermont peatland. J. Environ. Qual. 2005, 34, 2052–2061. [Google Scholar] [CrossRef] [PubMed]
- De Klein, C.A.M.; Van Logtestijn, R.S.P. Denitrification in the top soil of managed grasslands in The Netherlands in relation to soil type and fertilizer level. Plant. Soil 1994, 163, 33–44. [Google Scholar] [CrossRef]
- Barton, L.; McLay, C.D.A.; Schipper, L.A.; Smith, C.T. Annual denitrification rates in agricultural and forest soils: A review. Soil Res. 1999, 37, 1073. [Google Scholar] [CrossRef]
- Luo, J.; Tillman, R.W.; White, R.E.; Ball, P.R. Variation in denitrification activity with soil depth under pasture. Soil Biol. Biochem. 1998, 30, 897–903. [Google Scholar] [CrossRef]
- Jörgensen, R.G.; Richter, G.M. Composition of carbon fractions and potential denitrification in drained peat soils. J. Soil Sci. 1992, 43, 347–358. [Google Scholar] [CrossRef]
- Smolander, A.; Kitunen, V. Soil microbial activities and characteristics of dissolved organic C and N in relation to tree species. Soil Biol. Biochem. 2002, 34, 651–660. [Google Scholar] [CrossRef]
- Tiedje, J.M.; Sorensen, J.; Chang, Y.Y. Assimilatory and dissimilatory nitrate reduction: Perspectives and methodology for simultaneous measurement of several nitrogen cycle processes. In Terrestrial Nitrogen Cycles; Clark, F.E., Rosswall, T., Eds.; Ecology Bulletin 33: Stockholm, Sweden, 1981; pp. 331–342. [Google Scholar]
- Smith, W.H. Character and significance of forest tree root exudates. Ecology 1976, 57, 324–331. [Google Scholar] [CrossRef]
- Ryszkowski, L.; Marcinek, J.; Kędziora, A. Water Cycling and Biogeochemical Barriers in Agricultural Landscape; ZBŚRiL PAN: Poznań, Poland, 1990. [Google Scholar]
- White, R.E. Principles and Practice of Soil Science: The Soil as a Natural Resource, 4th ed.; Wiley-Blackwell Publishing: Oxford, UK, 2006; p. 363. [Google Scholar]


| Place of Sampling | Botanical Composition of Vegetation Cover of Investigated Places | Type of Soil |
|---|---|---|
| Mineral Soil | ||
| S0-in the boundary between field and afforestation | Acer platanoides L., Alliaria petiolate (M. Bieb.) Cavara and Grande, Chelidonium majus L., Crataegus monogyna Jacq., Fraxinus excelsior L., Quercus robur L., Robiniapseudoacacia L., Sambucus nigra L., Stachys sylvatica L., Ulmuslaevis Pall., Viola odorata L. | Division-autogenic soils, order-brown forest soils, type-hapludalfs, subtype-glossudalfs |
| S1-62 m from the edge | A. platanoides, Carpinus betulus L., Fagus sylvatica L., F. excelsior, Hedera helix L., Q. robur, S. nigra | Division-autogenic soils, order-brown forest soils, type-hapludalfs, subtype-ochraquals |
| Mineral-Organic Soil | ||
| S2-125 m from the edge | A. platanoides, Aegopodium podagraria L., Chaerophyllumaromaticum L., Ch. temulum, C. monogyna, F. excelsior, Galium aparine L., Geumurbanum L., H. helix, Ranunculus lanuginosus L., S. nigra, S. sylvatica, U. laevis, V. odorata | Division-hydrogenic soils, order-post-bog soils, type-mucky soils, subtype-muckous |
| Place of Sampling | Botanical Composition of Vegetation Cover of Investigated Places | Type of Peat-Moorsh Soils Based on Macrofossil Analysis | Stage of Soil Moorshification, Degree of Decomposition | Type of Moorsh Formation |
|---|---|---|---|---|
| P0 | Achillea millefolium L., Acorus calamus L., Alnus glutinosa (L.) Gaertn., Bidens frondosa L., Carexacutiformis L., Cerastiumholosteoides L., Cirsium arvense (L.) Scop., Conyza canadensis (L.) Cronquist, Epilobium hirsutum L., Galiummollugo L., G. palustre L., G. uliginosum L., Glechoma hederacea L., Holcus lanatus L., Iris pseudacorus L., Lathyrus palustris L., Lemna minor L., Lycopus europaeus L., Lythrumsalicaria L., Matricaria maritima (L.) W. D. J. Koch, Mentha aquatica L., Phalaris arundinacea L., Phleum pratense L., Phragmites australis (Cav.) Trin. ex Steud, Plantago lanceolata L., P. major L., Polygonum amphibium (L.) Delarbre, Potentilla reptans L., Ranunculus repens L., Rumex crispus L., Sonchus asper (L.) Hill., Stachys palustris L., Taraxacum officinale F.H. Wigg., Trifolium hybridum L., T. repens L., Urtica dioica L. | Wooden-sedge moorsh soil with peat, light degree of moorsh process MtI, deep soil developed with low Carex-Phragmiteti strongly decomposed (sapric) peat, 10 YR 2/1 black, amorfic-fibrus structure. The upper peat horizon has thin 1–2 mm mineral layers. Peaty muck horizon with subangular blocky structure with low fiber content. Moorsh horizon Mt 0–10 cm depth. Polish Hydrogenic Soil Classification [36]: MtIcc. World Reference Base [37] soil notation: Sapri-Eutric Histosols. | MtIcc 0–20 cm, R3 | Z1 |
| P1 | Achillea millefolium, Agrostis canina L., Arrhenatherum elatior (L.) P. Beauv. ex J. and C. Presl, Carexacutiformis, C. acuta L., Ceratophyllumdemersum L., Cirsium arvense, C. oleraceum (L.) Scop., Deschampsiacaespitosa (L.) P.B., Epilobium hirsutum L., Galiummollugo, Glechoma hederacea, Heracleum sphondylum L., Holcus lanatus, Hydrocharismorsus– ranae L., Lemnatrisulca L., Leucanthemum vulgare Lam., Lolium multiflorum Lam., Lysimachia vulgaris L., Lythrumsalicaria, Phragmites australis, Plantago lanceolata, P. major, Ranunculus repens, Rumex acetosa L., R. crispus, R. hydrolapathum Huds., Salix alba L., S. cinerea L., Serratula tinctoria L., Solanum dulcamara L., Taraxacum officinale, Trifolium pratense L., T. repens, Typha angustifolia L., Urtica dioica | Alder, moorsh soil with peat, medium degree of moorsh process MtII, deep soil developed with low strongly decomposed (sapric) wood peat, 10 YR 2/1 black, angular blocky structure. Humic muck horizon with subangular blocky microstructure. Very well-developed M1 moorsh sod subhorizon and subangular blocky M2 muck under subhorizon. Moorsh horizon Mt 0–20 cm depth. Polish Hydrogenic Soil Classification [36]: MtIIcc. World Reference Base [37] soil notation: Sapri-Eutric Histosols. | MtIIcc 0–20 cm R3 | Z2 |
| P2 | Achillea millefolium, Agrostis canina, Betula pendula Roth, Calystegiasepium (L.) R.Br, Cardaminopsisarenosa (L.) Hayek, Carex acuta, C. hirta L., Centaurea jacea L., Cerastiumholosteoides Fr. em. Hyl., Cirsium arvense, C. oleraceum, Dactylis glomerata L., Daucus carota L., Deschampsiacaespitosa, Eupatorium cannabinum L., Festuca arundinacea Schreb., Frangula alnus Mill., Galium album Mill., G. uliginosum, Holcus lanatus, Hypericum tetrapterum Fr., Lycopus europaeus, Lysimachia vulgaris, Mentha aquatica, Molinia caerulea (L.) Moench, Nymphaea alba L., Phleum pratense L., Plantago lanceolata, P. major, Poa pratensis L., P. trivialis L., Potentilla anserine L., Ranunculus repens, Rhamnus catharticus L., Rubus plicatus W. et N., Salix cinerea, Solanum dulcamara, Sonchus arvensis L., Sparganiumramosum L., Taraxacum officinale, Typha latifolia L., Viburnum opulus L. | Sedge-rushes, moorsh soil with peat, strong degree of moorsh process MtIII, deep soil developed with low Carex-wood decomposed (sapric) peat, 10 YR 3/1 very dark gray, angular-fibrus blocky structure. Moorsh horizon strongly drained, subangular blocky microstructure. Well-developed subhorizons M1, M2. Degraded moorsh M3 subhorizon have light identifiable. Moorsh horizon Mt 0–32 cm depth. Polish Hydrogenic Soil Classification [36]: MtIIIcc. World Reference Base [37] soil notation: Sapri-Eutric Histosols. | MtIIIcc 0–20 cm R3 | Z2 Z3 |
| Peatland | Shelterbelt | ||||||||
|---|---|---|---|---|---|---|---|---|---|
| pH | |||||||||
| Place | Distance | 1st Year | 2nd Year | 3rd Year | Place | Distance | 1st Year | 2nd Year | 3rd Year |
| P0 | border | 6.5–7.1 | 6.6–7.0 | 6.6–7.0 | S0 | Border | 7.2–7.9 | 7.2–7.8 | 6.2–8.2 |
| P1 | 700 m | 6.8–7.5 | 6.8–7.5 | 6.8–7.5 | S1 | 62 m | 7.0–7.5 | 7.0–7.7 | 6.5–7.9 |
| P2 | 1800 m | 6.4–7.5 | 6.7–7.2 | 6.6–7.3 | S2 | 125 m | 7.4–8.0 | 6.8–7.9 | 7.2–8.1 |
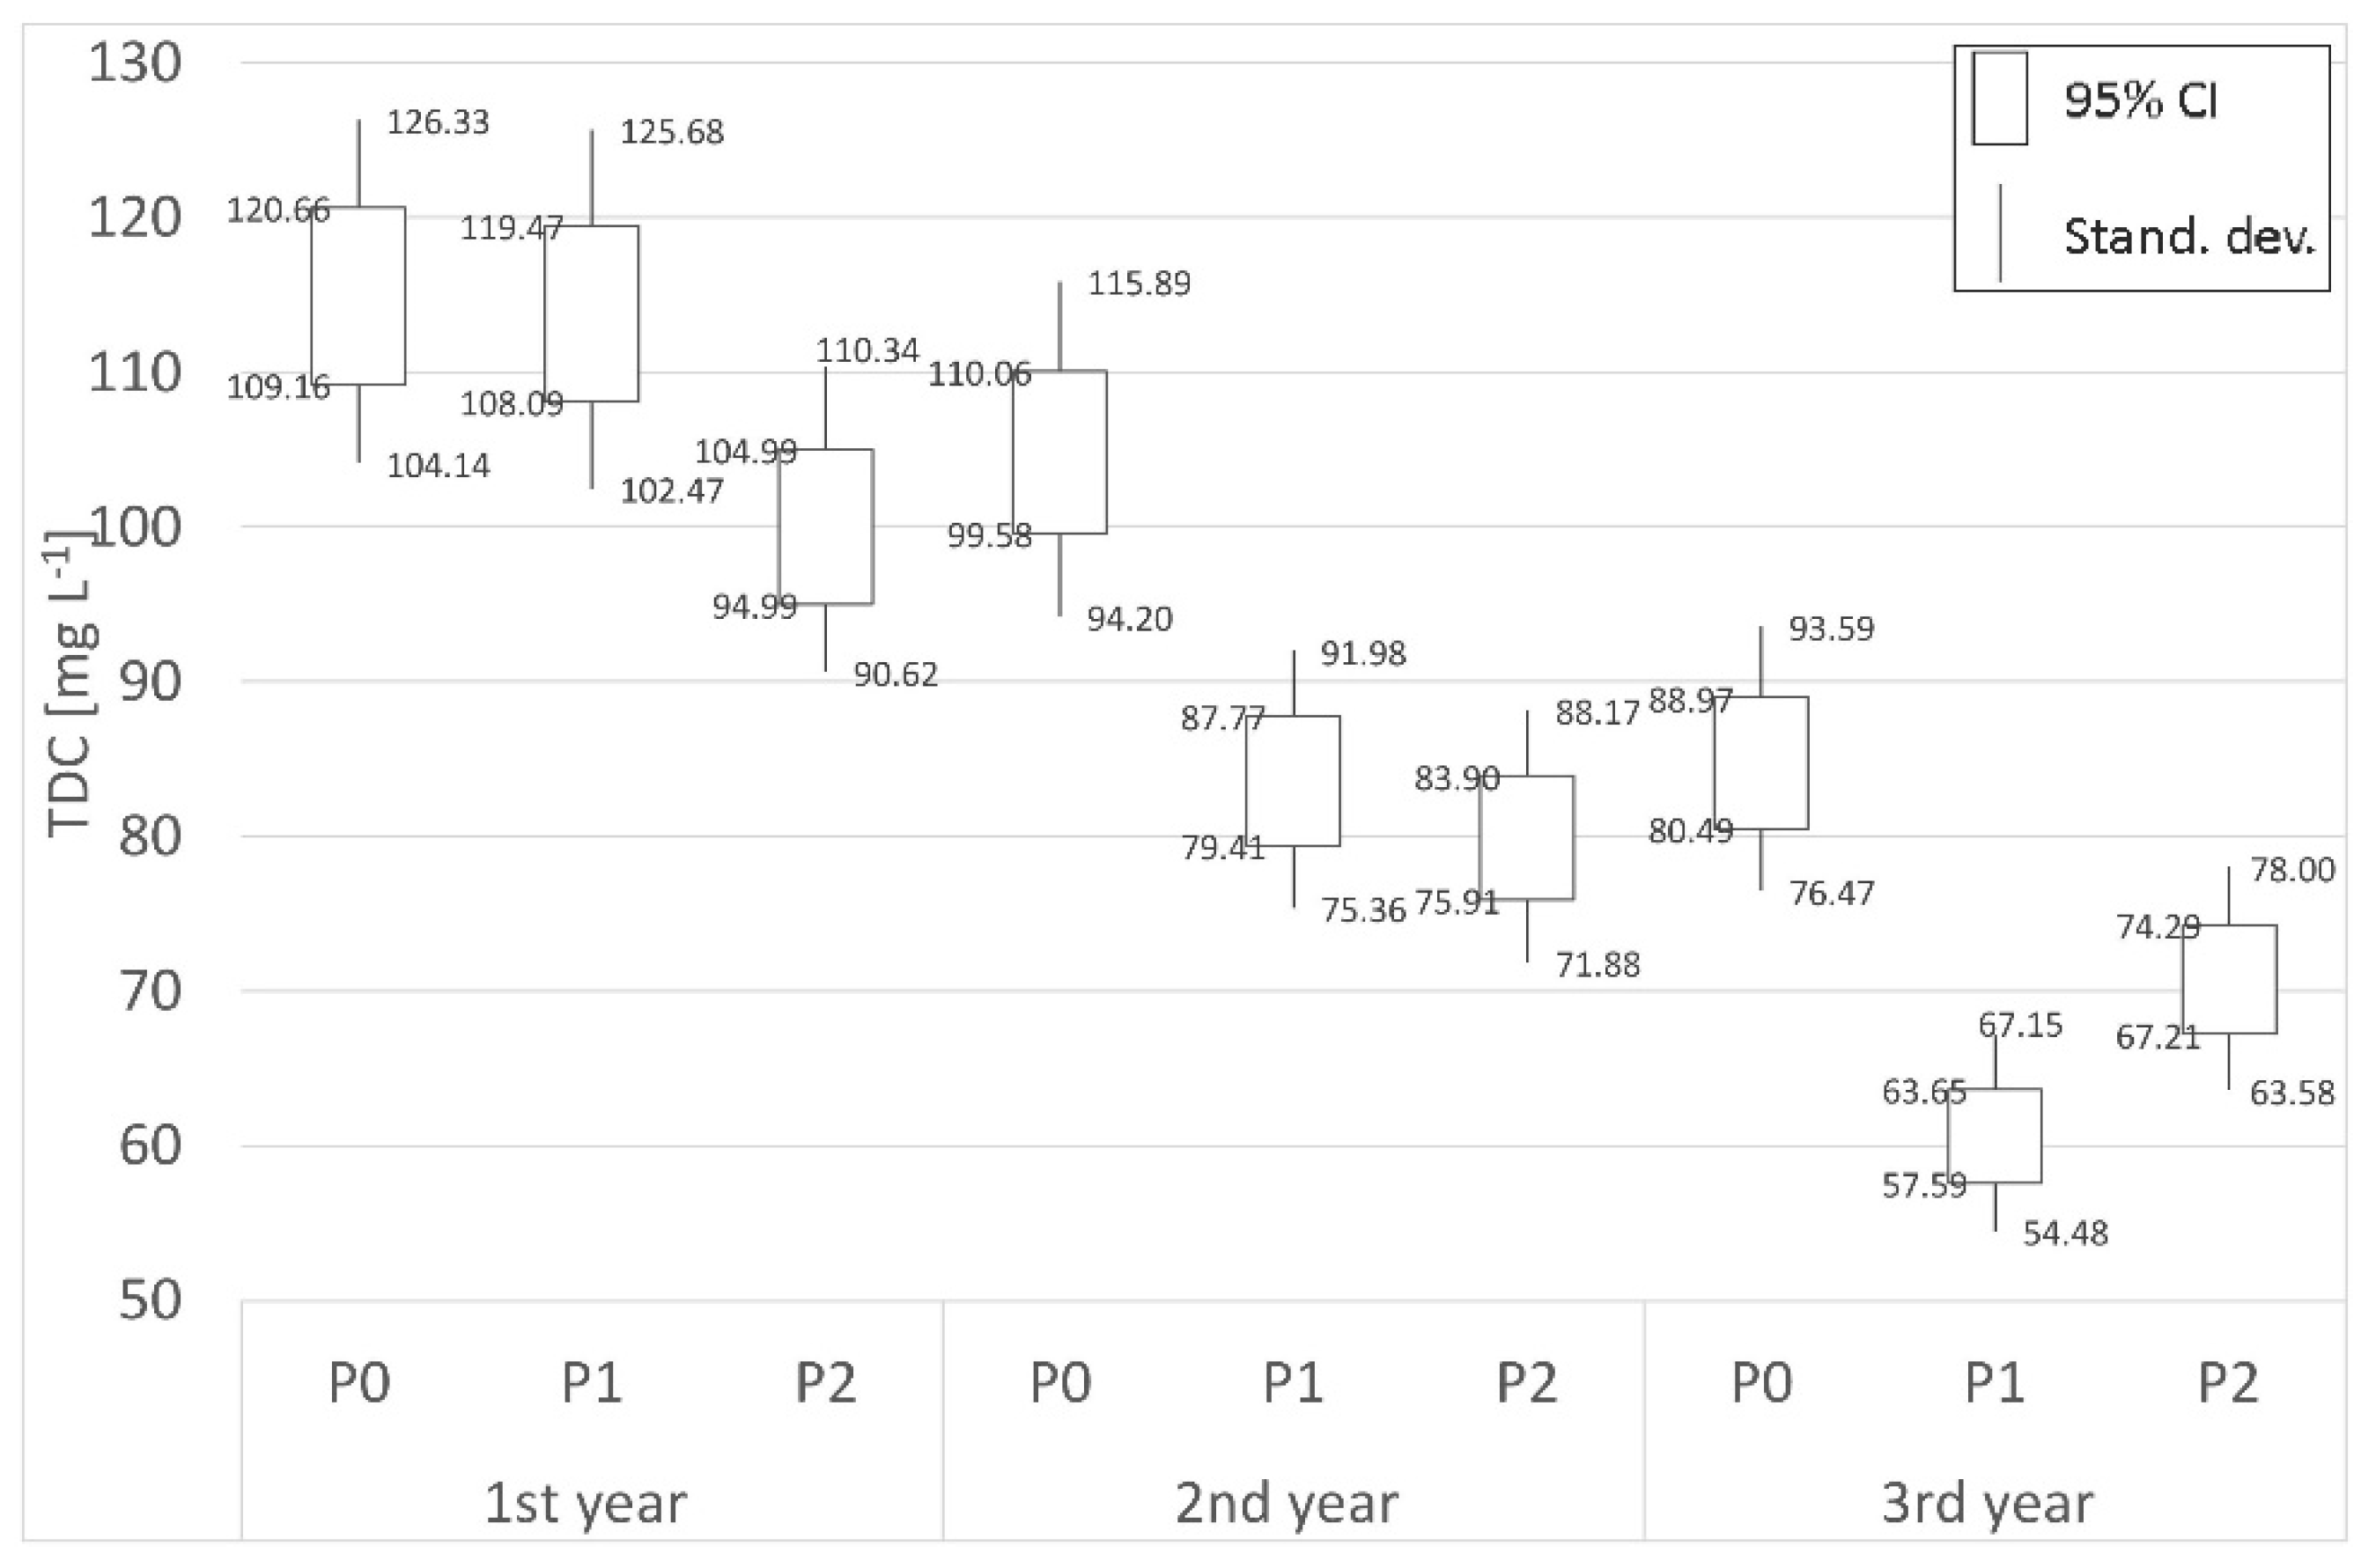
| Peatland | Shelterbelt | ||||||||
|---|---|---|---|---|---|---|---|---|---|
| TDC | |||||||||
| Place | Distance | 1st year (mg L−1) | 2nd year (mg L−1) | 3rd year (mg L−1) | Place | Distance | 1st year (mg L−1) | 2nd year (mg L−1) | 3rd year (mg L−1) |
| P0 | Border | 114.91 | 104.82 | 84.73 | S0 | Border | 137.20 | 134.16 | 88.98 |
| P1 | 700 m | 113.78 | 83.59 | 60.62 | S1 | 62 m | 40.80 | 44.41 | 43.23 |
| P2 | 1800 m | 99.99 | 79.90 | 70.75 | S2 | 125 m | 67.83 | 58.89 | 58.00 |
| (−)decr./(+)incr. | −12.98% | −23.77% | −16.50% | (−)decr./(+)incr. | −50.56% | −56.10% | −34.82% | ||
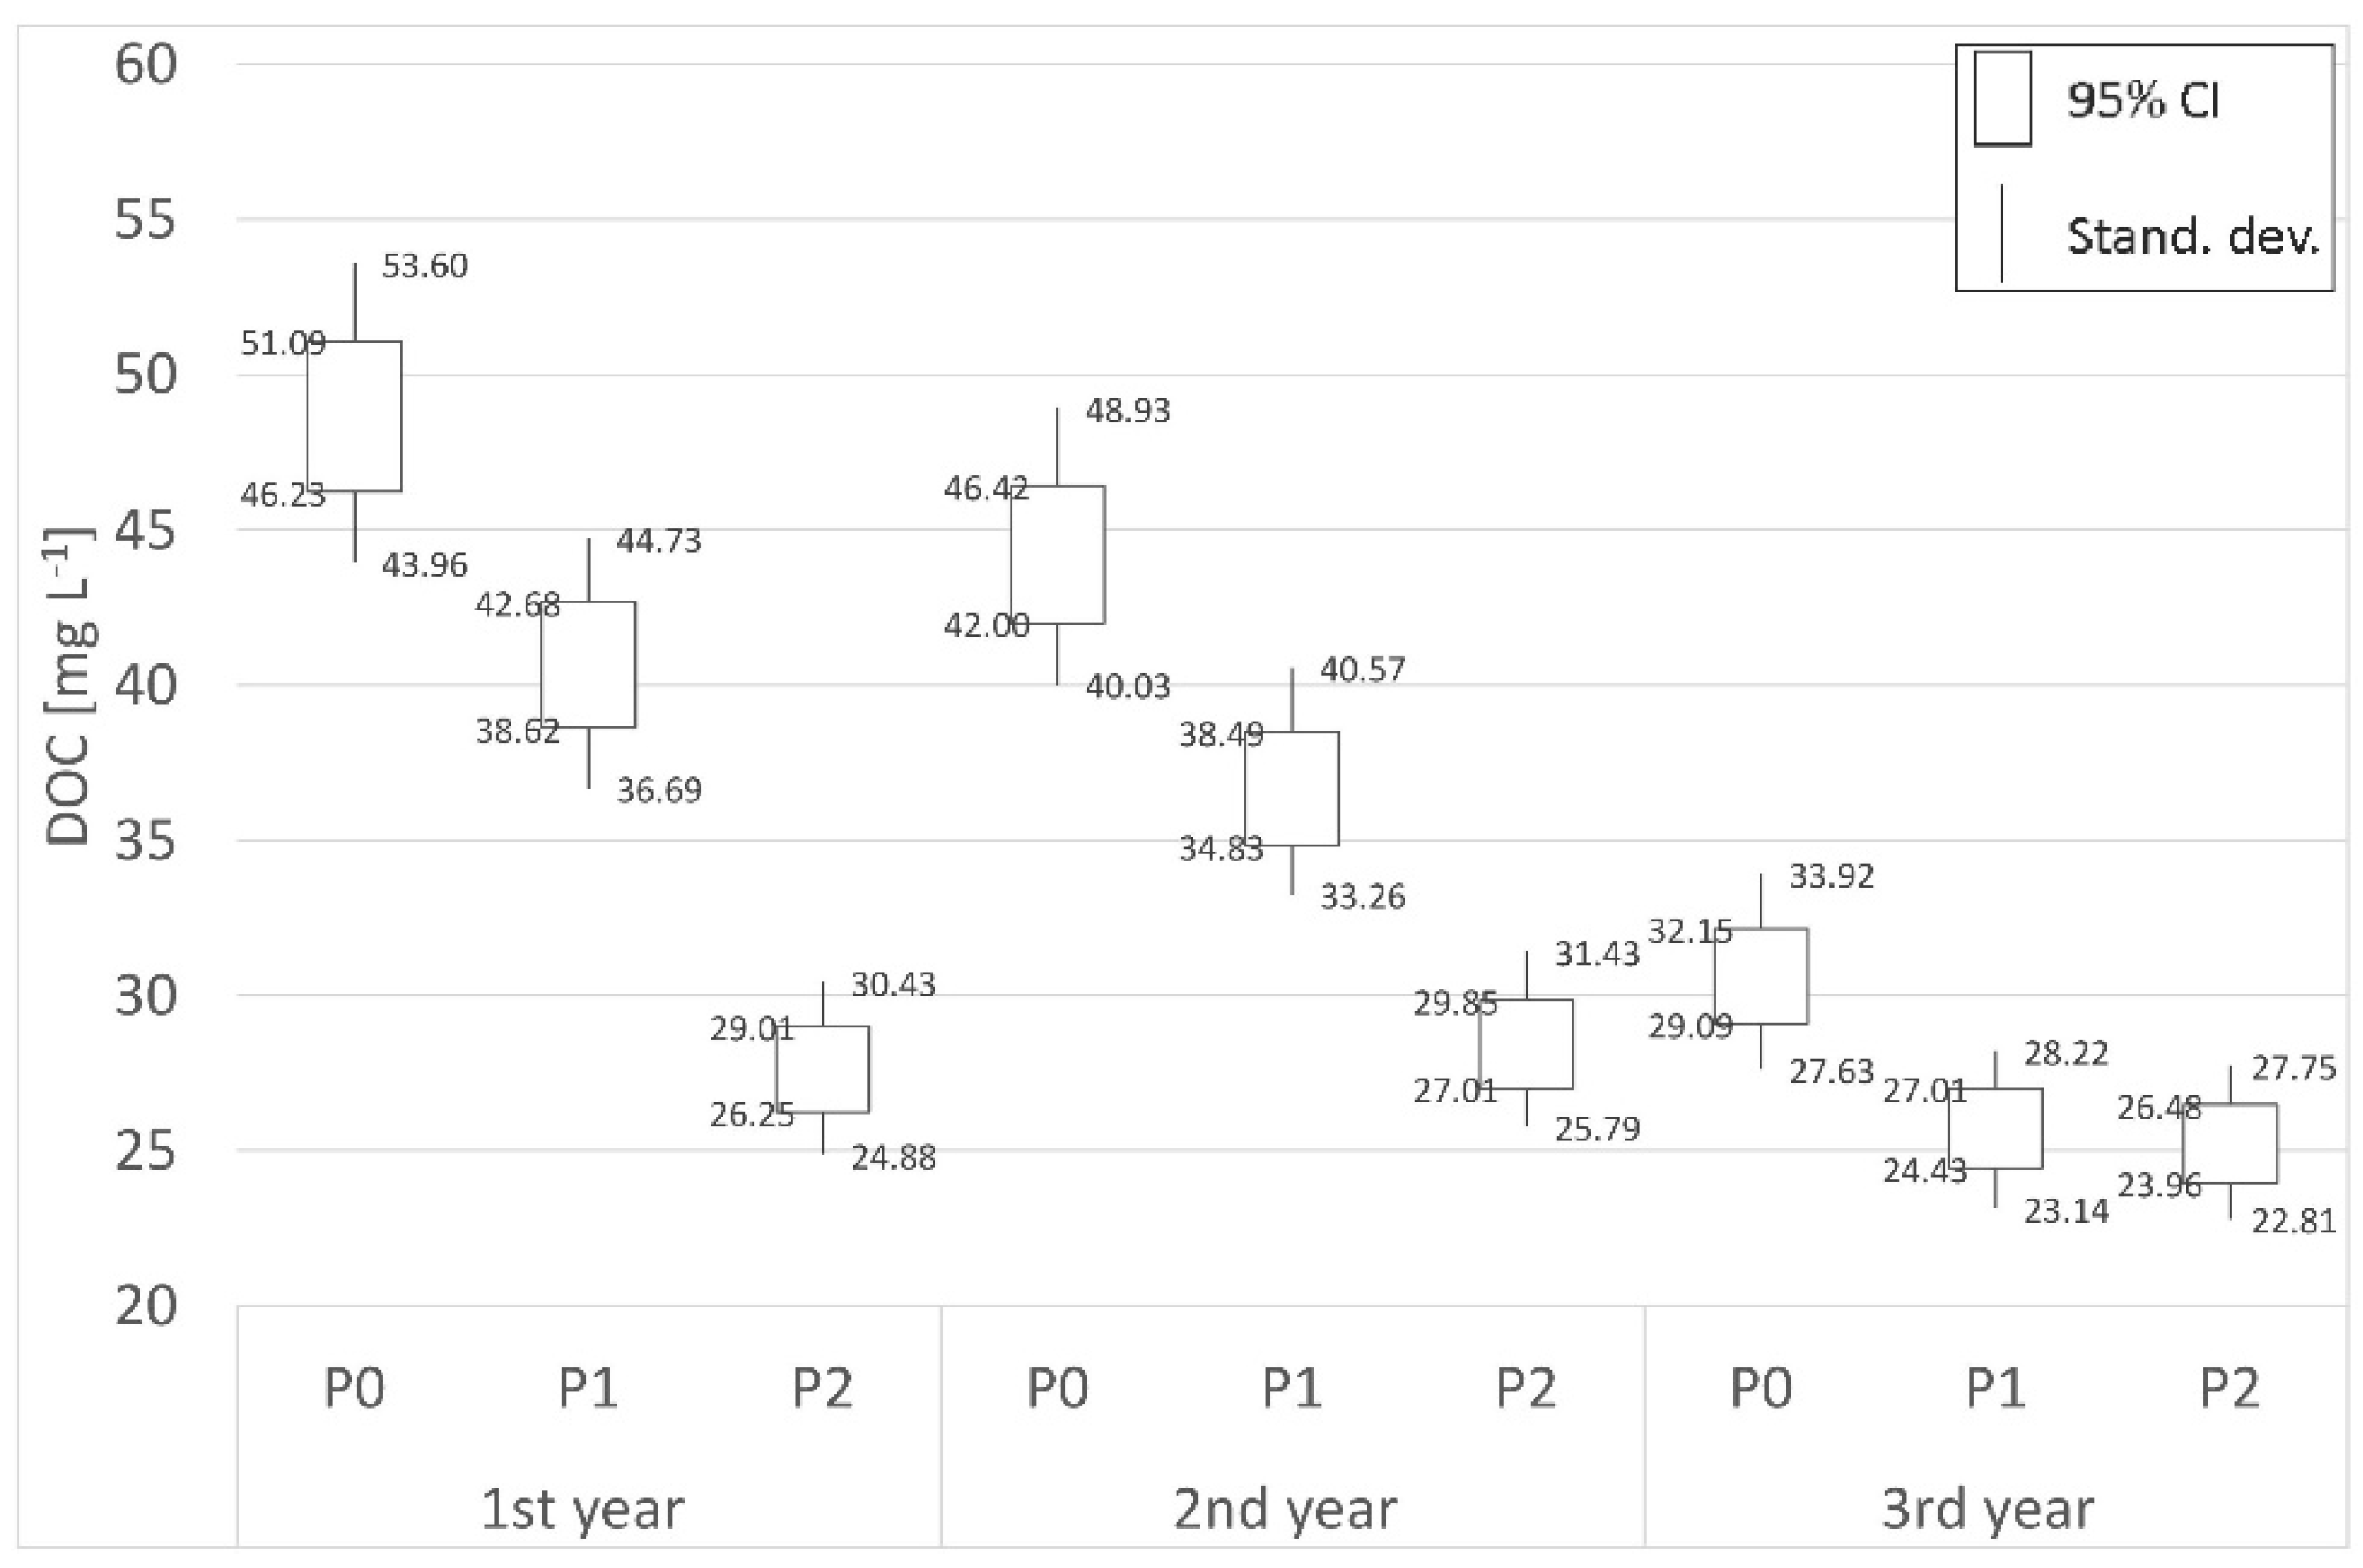
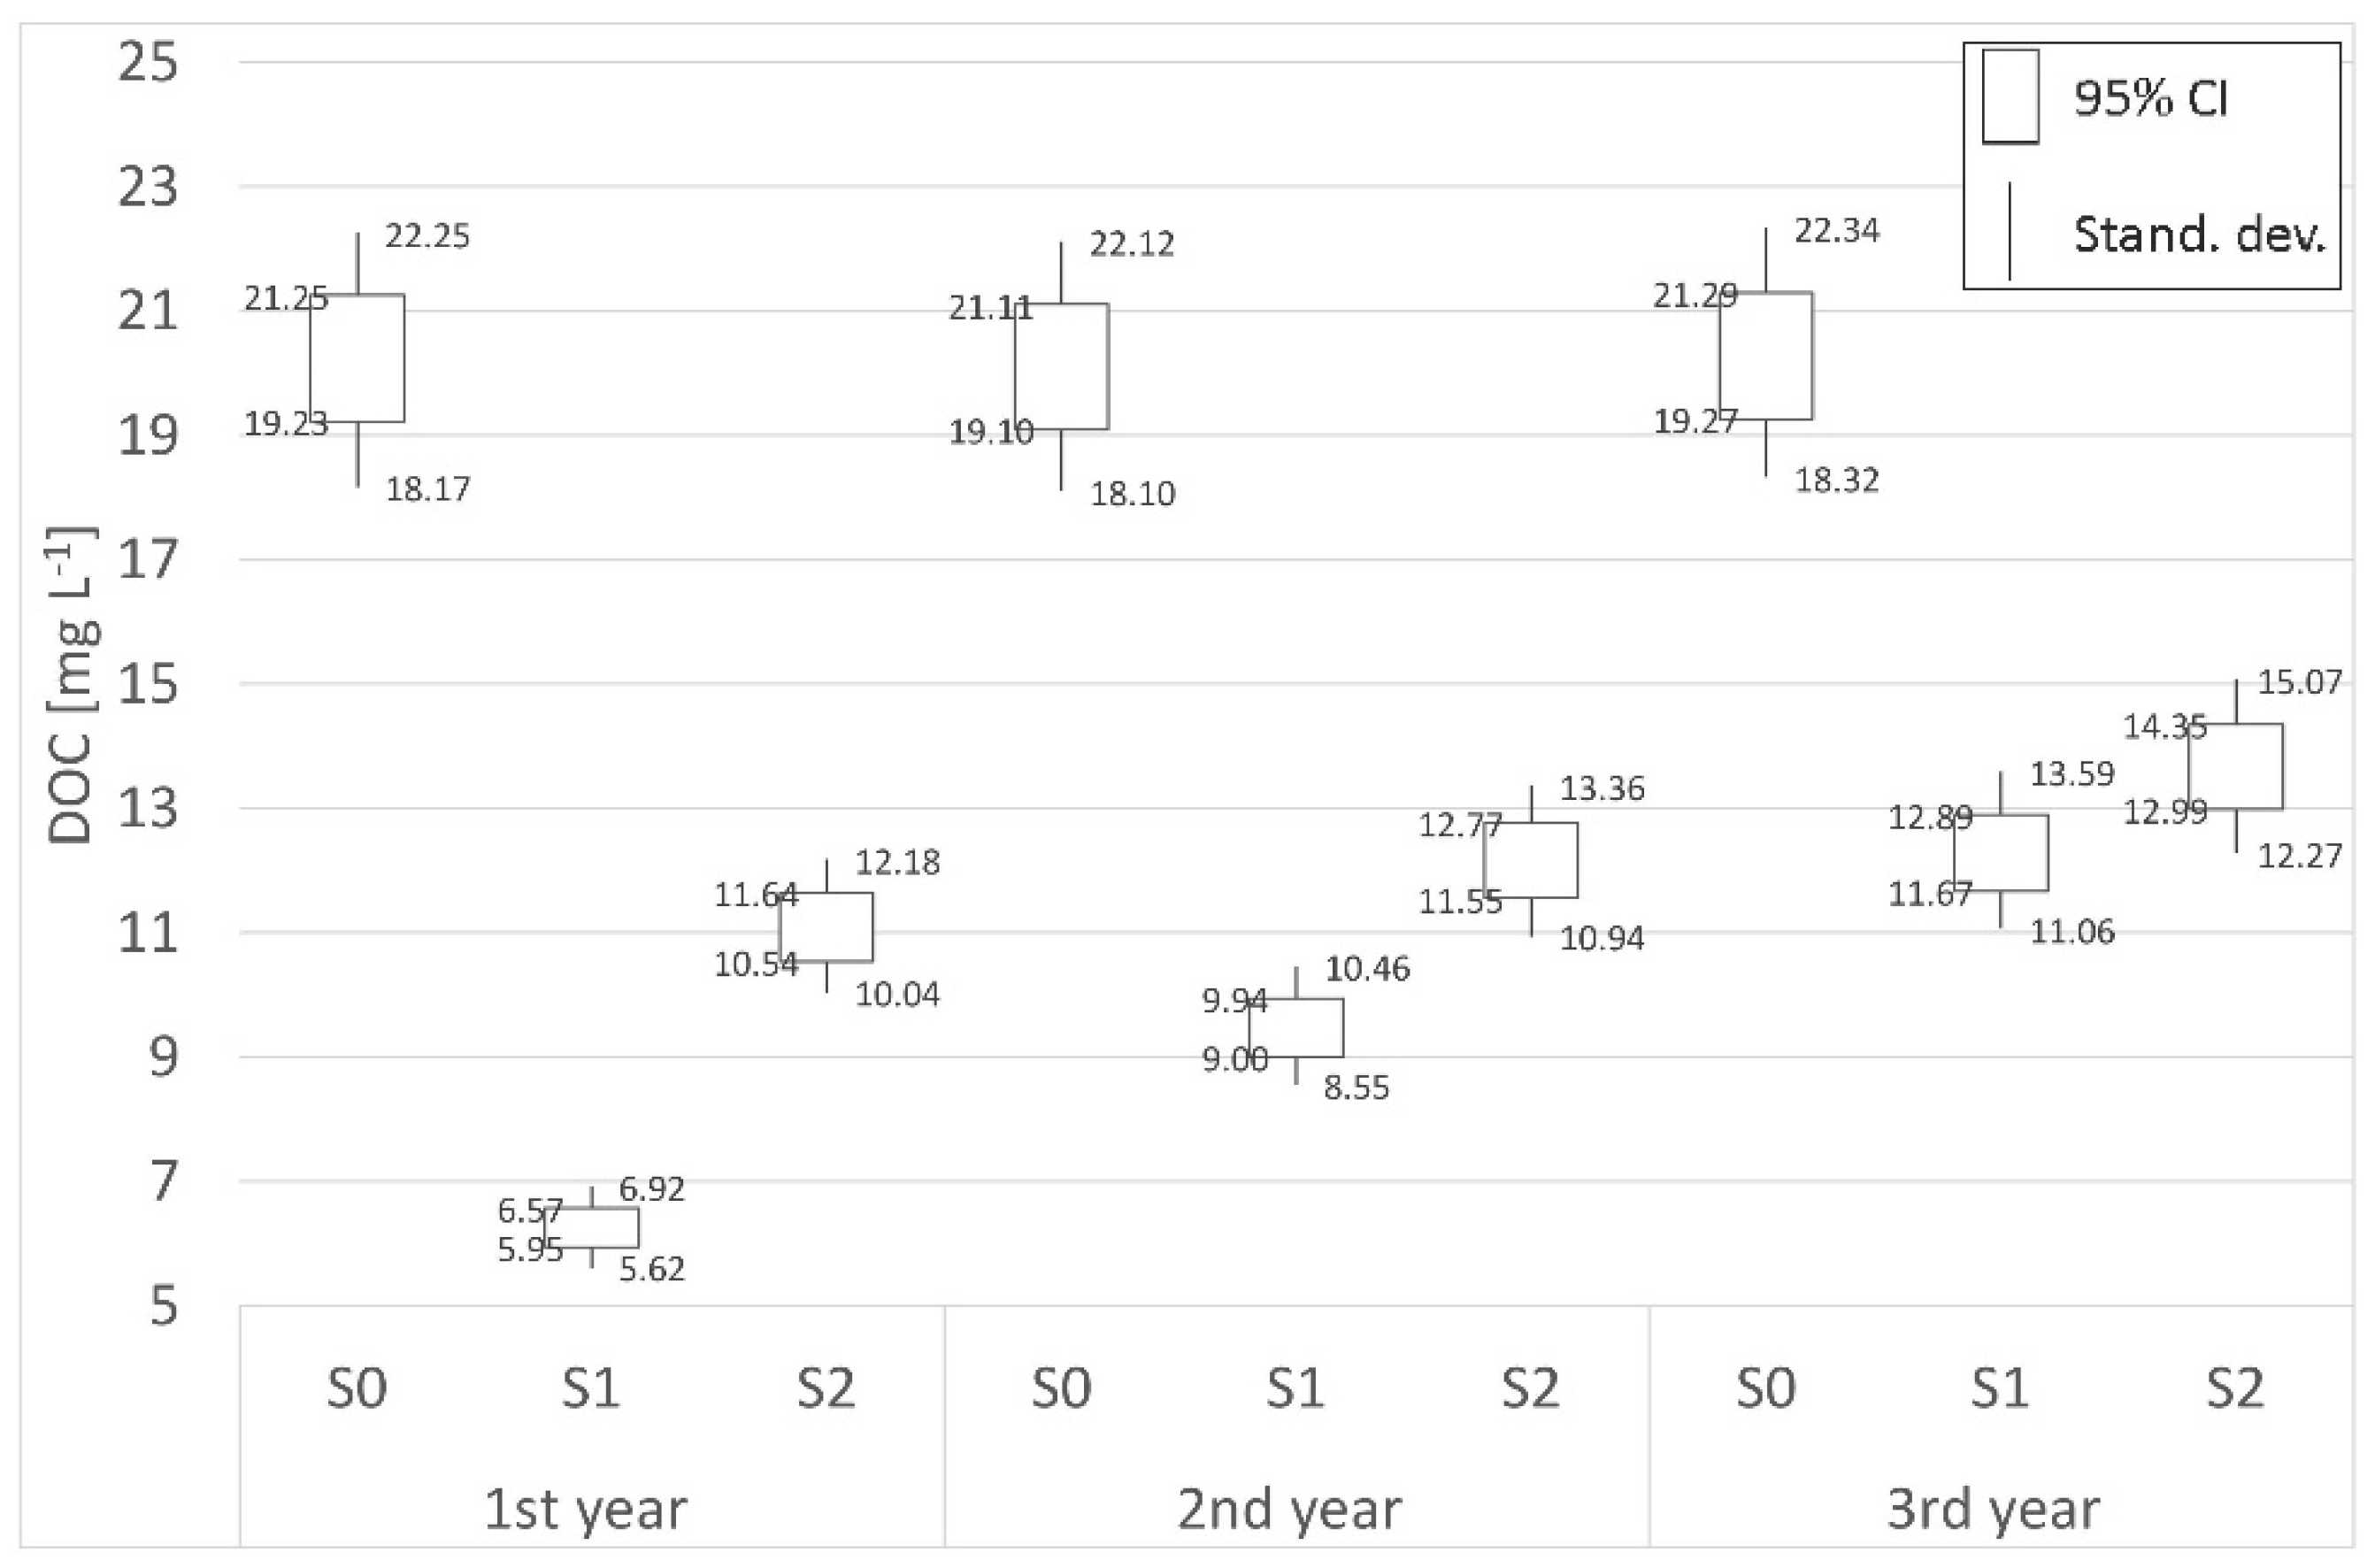
| DOC | |||||||||
| Place | Distance | 1st year (mg L−1) | 2nd year (mg L−1) | 3rd year (mg L−1) | Place | Distance | 1st year (mg L−1) | 2nd year (mg L−1) | 3rd year (mg L−1) |
| P0 | Border | 48.66 | 44.21 | 30.62 | S0 | Border | 20.24 | 20.10 | 20.28 |
| P1 | 700 m | 40.65 | 36.66 | 25.72 | S1 | 62 m | 6.26 | 9.47 | 12.28 |
| P2 | 1800 m | 27.63 | 28.43 | 25.22 | S2 | 125 m | 11.09 | 12.16 | 13.67 |
| (−)decr./(+)incr. | −43.22% | −35.69% | −17.64% | (−)decr./(+)incr. | −45.21% | −39.50% | −32.59% | ||
| Kind of Organic Matter | Place of Sampling | ||
|---|---|---|---|
| P0 | P1 | P2 | |
| Non-decomposed forms of lignin | k = 2.8549 t0.5 = 40.5 r = −0.989 | k = 2.6534 t0.5 = 43.7 r = −0.986 | k = 2.6832 t0.5 = 43.1 r = −0.967 |
| Substances in initial decomposition | k = 2.9089 t0.5 = 39.7 r = −0.989 | k = 2.4593 t0.5 = 47.0 r = −0.985 | k = 2.3045 t0.5 = 50.1 r = −0.986 |
| Fully humified organic matter | k = 2.7361 t0.5 = 42.2 r = −0.944 | k = 1.9524 t0.5 = 59.2 r = −0.925 | k = 2.3394 t0.5 = 49.4 r = −0.897 |
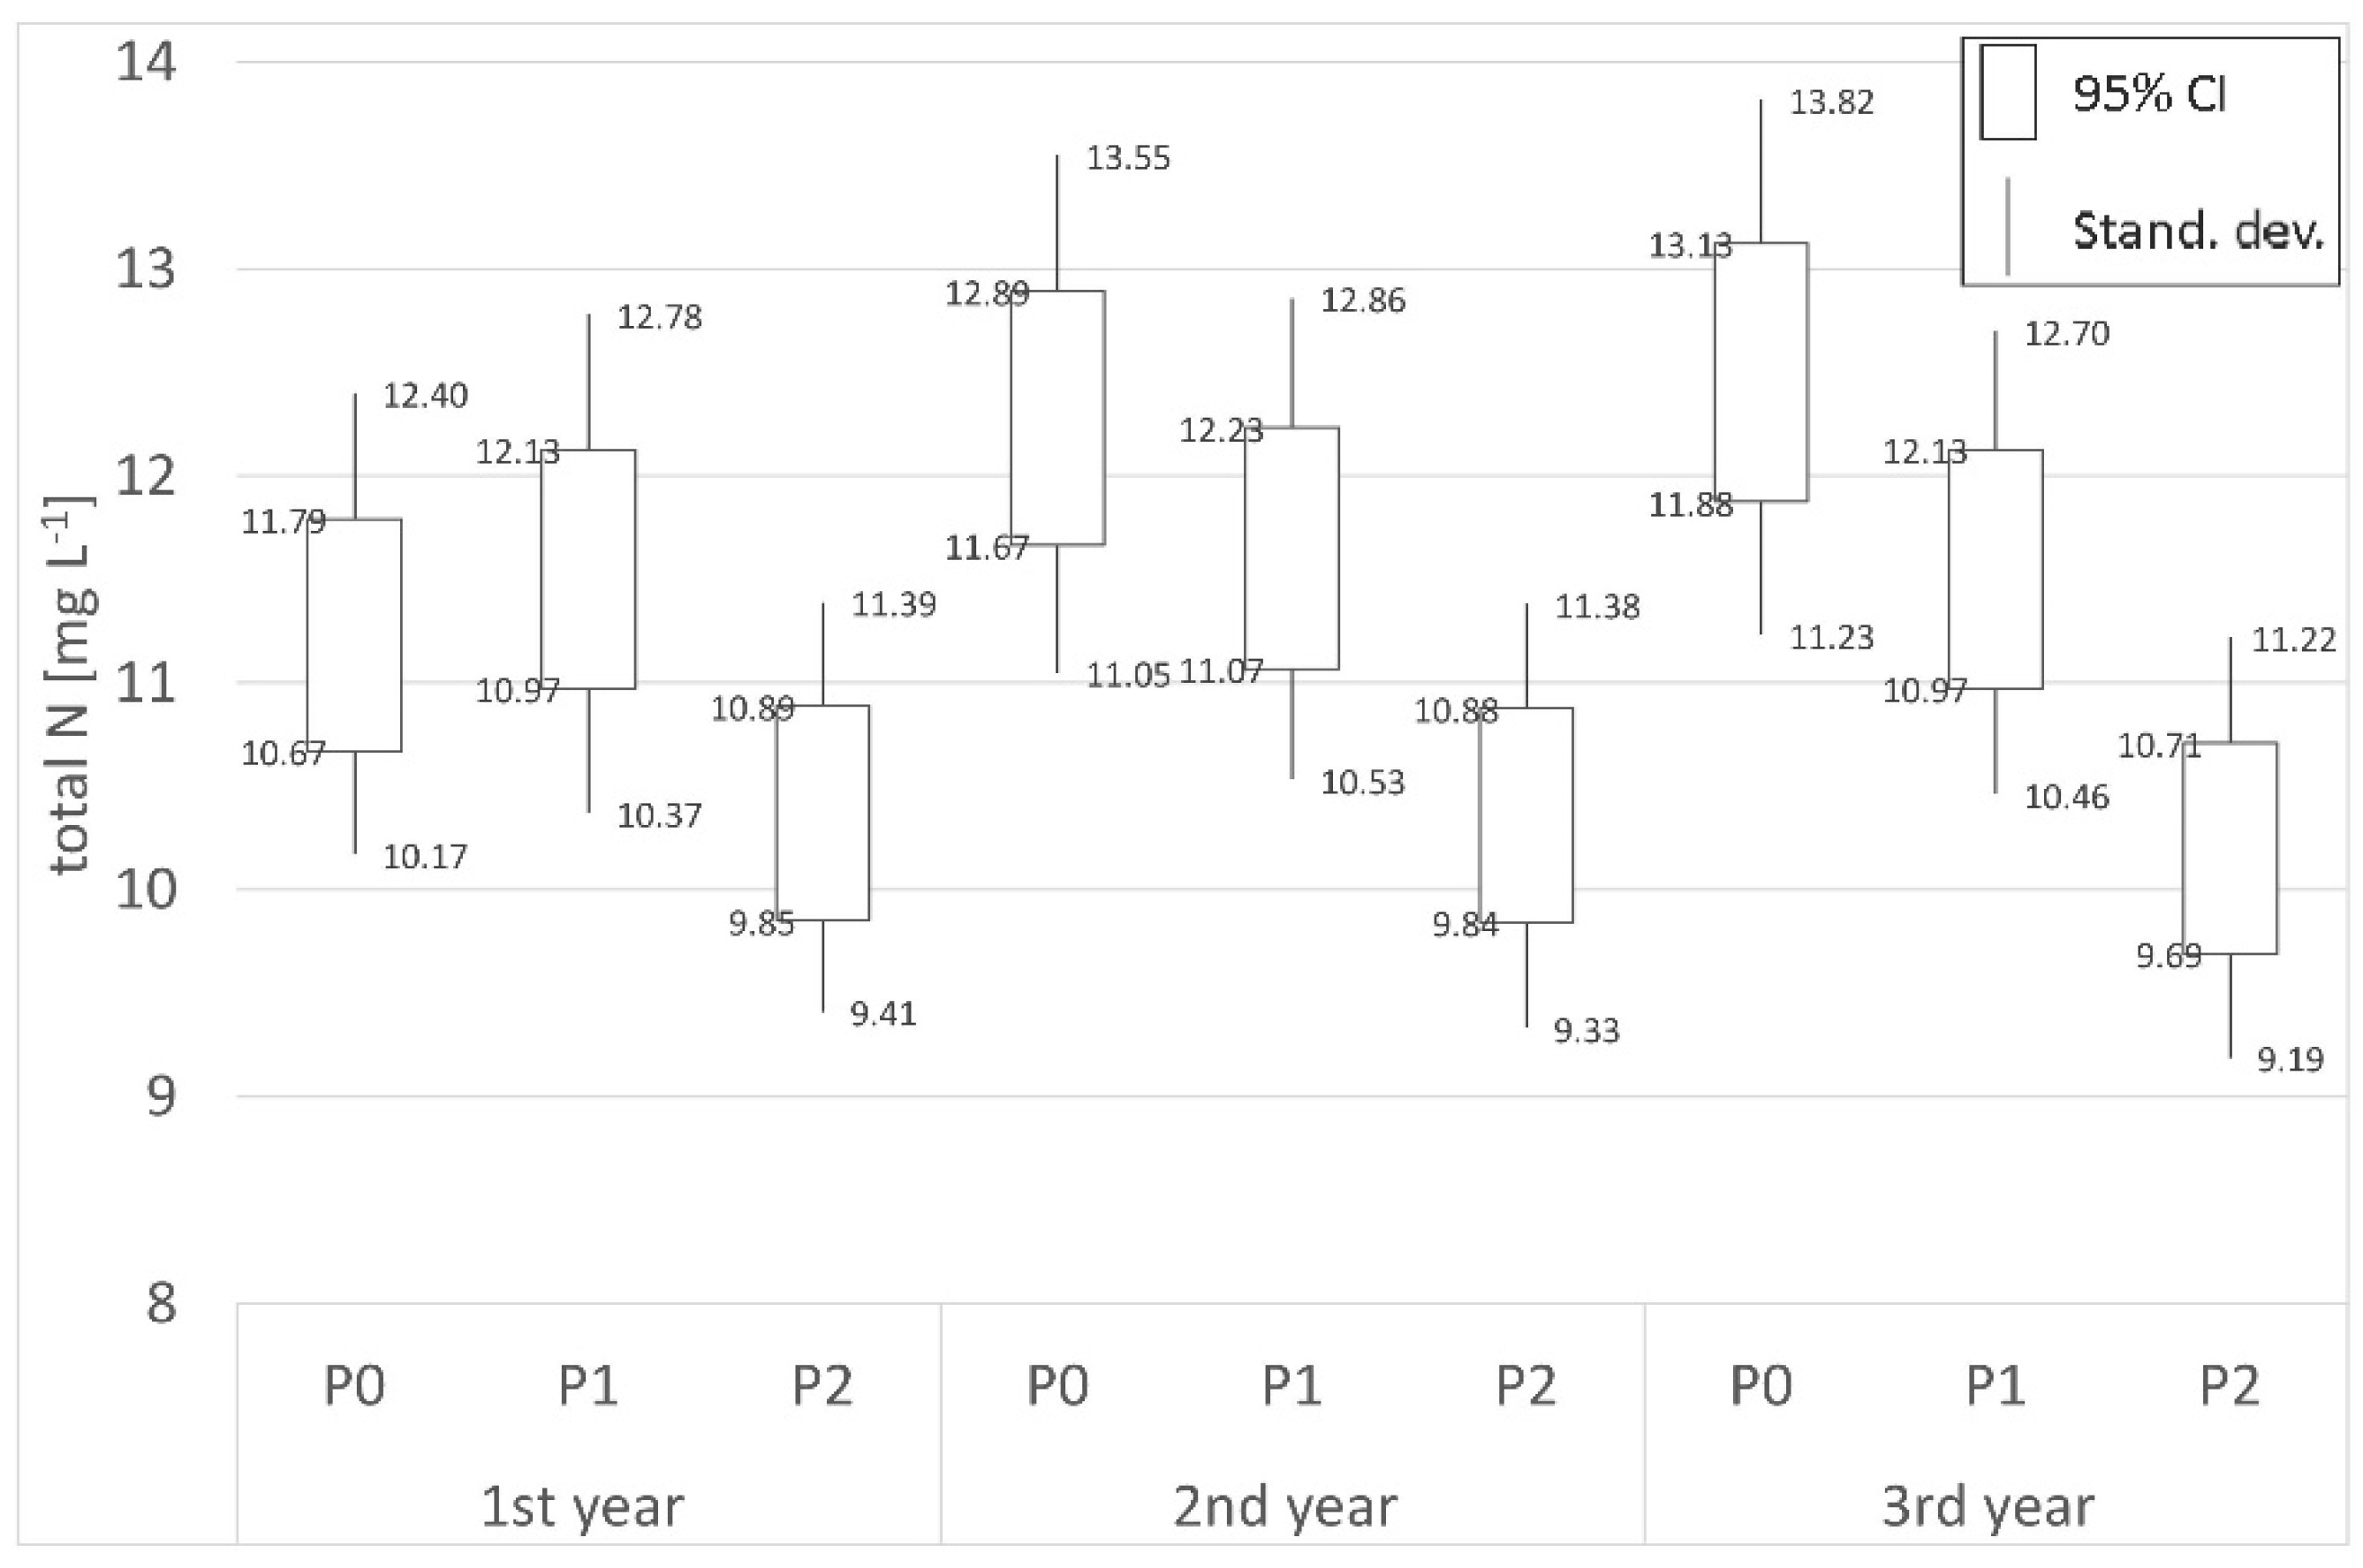
| Peatland | Shelterbelt | ||||||||
|---|---|---|---|---|---|---|---|---|---|
| Total N | |||||||||
| Place | Distance | 1st year (mg L−1) | 2nd year (mg L−1) | 3rd year (mg L−1) | Place | Distance | 1st year (mg L−1) | 2nd year (mg L−1) | 3rd year (mg L−1) |
| P0 | Border | 11.23 | 12.28 | 12.50 | S0 | Border | 20.80 | 11.01 | 15.48 |
| P1 | 700 m | 11.55 | 11.65 | 11.55 | S1 | 62 m | 15.24 | 10.89 | 12.15 |
| P2 | 1800 m | 10.37 | 10.36 | 10.20 | S2 | 125 m | 16.23 | 9.06 | 9.79 |
| (−)decr./(+)incr. | −7.63% | −15.64% | −18.35% | (−)decr./(+)incr. | −21.97% | −17.71% | −36.76% | ||
| NO3−-N | |||||||||
| Place | Distance | 1st year (mg L−1) | 2nd year (mg L−1) | 3rd year (mg L−1) | Place | Distance | 1st year (mg L−1) | 2nd year (mg L−1) | 3rd year (mg L−1) |
| P0 | Border | 0.69 | 0.79 | 1.03 | S0 | Border | 12.03 | 7.60 | 13.08 |
| P1 | 700 m | 0.61 | 0.56 | 0.74 | S1 | 62 m | 8.61 | 7.94 | 10.27 |
| P2 | 1800 m | 0.55 | 0.70 | 0.62 | S2 | 125 m | 8.20 | 5.92 | 7.82 |
| (−)decr./(+)incr. | −20.30% | −11.25% | −40.46% | (−)decr./(+)incr. | −31.84% | −22.11% | −40.21% | ||
| NH4+-N | |||||||||
| Place | Distance | 1st year (mg L−1) | 2nd year (mg L−1) | 3rd year (mg L−1) | Place | Distance | 1st year (mg L−1) | 2nd year (mg L−1) | 3rd year (mg L−1) |
| P0 | Border | 5.35 | 4.98 | 4.78 | S0 | Border | 3.11 | 1.88 | 1.40 |
| P1 | 70 m | 5.67 | 4.64 | 3.75 | S1 | 62 m | 3.42 | 2.12 | 1.40 |
| P2 | 1800 m | 3.35 | 3.02 | 2.84 | S2 | 125 m | 3.67 | 2.15 | 1.45 |
| (−)decr./(+)incr. | −37.42% | −39.42% | −40.60% | (−)decr./(+)incr. | +18.01% | +14.36% | +3.57% | ||
| Organic N | |||||||||
| Place | Distance | 1st year (mg L−1) | 2nd year (mg L−1) | 3rd year (mg L−1) | Place | Distance | 1st year (mg L−1) | 2nd year (mg L−1) | 3rd year (mg L−1) |
| P0 | Border | 5.19 | 6.51 | 6.68 | S0 | Border | 5.66 | 1.53 | 1.00 |
| P1 | 700 m | 5.27 | 6.45 | 7.07 | S1 | 62 m | 3.22 | 0.83 | 0.48 |
| P2 | 1800 m | 6.47 | 6.64 | 6.75 | S2 | 125 m | 4.36 | 0.99 | 0.52 |
| (−)decr./(+)incr. | +24.78% | +2.01% | +1.01% | (−)decr./(+)incr. | −22.97% | −35.29% | −48.00% | ||
Publisher’s Note: MDPI stays neutral with regard to jurisdictional claims in published maps and institutional affiliations. |
© 2021 by the authors. Licensee MDPI, Basel, Switzerland. This article is an open access article distributed under the terms and conditions of the Creative Commons Attribution (CC BY) license (https://creativecommons.org/licenses/by/4.0/).
Share and Cite
Szczepański, M.; Szajdak, L.W.; Meysner, T. Impact of Shelterbelt and Peatland Barriers on Agricultural Landscape Groundwater: Carbon and Nitrogen Compounds Removal Efficiency. Agronomy 2021, 11, 1972. https://doi.org/10.3390/agronomy11101972
Szczepański M, Szajdak LW, Meysner T. Impact of Shelterbelt and Peatland Barriers on Agricultural Landscape Groundwater: Carbon and Nitrogen Compounds Removal Efficiency. Agronomy. 2021; 11(10):1972. https://doi.org/10.3390/agronomy11101972
Chicago/Turabian StyleSzczepański, Marek, Lech W. Szajdak, and Teresa Meysner. 2021. "Impact of Shelterbelt and Peatland Barriers on Agricultural Landscape Groundwater: Carbon and Nitrogen Compounds Removal Efficiency" Agronomy 11, no. 10: 1972. https://doi.org/10.3390/agronomy11101972
APA StyleSzczepański, M., Szajdak, L. W., & Meysner, T. (2021). Impact of Shelterbelt and Peatland Barriers on Agricultural Landscape Groundwater: Carbon and Nitrogen Compounds Removal Efficiency. Agronomy, 11(10), 1972. https://doi.org/10.3390/agronomy11101972