Article

Modeling of Phosphorus Nutrition to Obtain Maximum Yield, High P Use Efficiency and Low P-Loss Risk for Wheat Grown in Sandy Calcareous Soils

1
College of Forestry, Guizhou University, Guiyang 550025, China
2
Haikou Experimental Station, Chinese Academy of Tropical Agricultural Sciences (CATAS), Haikou 570000, China
3
Department of Biology, College of Science, Taif University, P.O. Box 11099, Taif 21944, Saudi Arabia
4
Department of Soils and Water, Faculty of Agriculture, Assiut University, Assiut 71526, Egypt
5
Agronomy Department, Faculty of Agriculture, Assiut University, Assiut 71526, Egypt
6
Agronomy Department, Faculty of Agriculture, Sohag University, Sohag 82511, Egypt
7
Department of Agronomy, Faculty of Agriculture, New Valley University, El-Kharga 72511, Egypt
*
Author to whom correspondence should be addressed.
Agronomy 2021, 11(10), 1950; https://doi.org/10.3390/agronomy11101950
Submission received: 31 August 2021 / Revised: 24 September 2021 / Accepted: 25 September 2021 / Published: 28 September 2021

Abstract

:
Fertilization with high levels of phosphorus increases the risk of environmental pollution. Identification of critical values of P in soil (SOP) and in plant tissues (PiP) is essential for achieving the maximum wheat yield without P loss. The critical value is the value of P which gives the optimum yield; the response of crop yield to P fertilization above this value is not predictable or nil. Here, a 4-year field experiment was conducted to identify the SOP and PiP for achieving maximum yield of bread wheat using 11 rates of P fertilization (0, 15, 30, 45, 60, 75, 90, 105, 120, 135, and 150 kg P2O5 ha−1). The linear–linear and Mitscherlich exponential models were employed to estimate the PiP and SOP. The degree of phosphorus saturation (DPS) was used to assess the potential environmental risk; furthermore, phosphorus use efficiency (PUE) was also calculated under the studied fertilization levels. Phosphorus in soil and wheat plant was affected by the application rates and growing seasons. Increasing P fertilization rates led to gradual increases in soil and plant P. The SOP ranged between 21 and 32 mg kg−1, while the PiP ranged between 6.40 and 7.49 g kg−1. The critical values of P calculated from the Mitscherlich exponential models were 20% higher than those calculated from the linear–linear models. Adding levels of P fertilization ≥90 kg P2O5 ha−1 leads to higher potentials of P runoff and leaching, in addition, PUE decreased sharply under high P fertilization levels. The response of wheat yield to P fertilization in sandy calcareous soil is predictable below Olsen P values of 21 mg kg−1. Identification of critical P values for wheat production is of great importance to help policy makers improve P use efficiency and attain optimum wheat yield under eco-friendly environmental conditions by eliminating the accumulation of excess P fertilizers in soil and water.

1. Introduction

Wheat is the one of the most strategic cereal crops for ensuring global food security and is a major source for human food and livestock feed [1]. High growth and yield of wheat depend mainly on suitable agriculture management, especially soil fertility [2]. Expansion of wheat cultivation in newly reclaimed soils, which are widespread in arid and semiarid regions, is necessary to meet the rapid increase in human population. However, these are mostly calcareous sandy soils of low quality due to high calcium carbonate content and low nutrient availability due to high pH and unfavorable soil characteristics [1,2,3,4,5]. Moreover, since the dominant soil particles are sand, the water-holding capacity of the upper soil surface is low to medium [6]. Poor soil properties, scarcity of irrigation water resources, and high daily evapotranspiration are the most troublesome issues facing any agricultural project proposed for such areas [1,5]. In order to maximize economic revenues from the degraded calcareous sandy soils, there is an urgent need to identify and adopt effective fertilization management strategies.
Phosphorus (P), a nonrenewable resource, is an essential plant nutrient in agricultural production and should be applied to the soil as inorganic and/or organic P to sustain cropping systems [4,7,8,9]. Therefore, the species of labile P influence the levels of soil P availability, which is affected by several soil characteristics, i.e., soil organic matter (SOM), pH, CaCO3, and Al, Fe, and Mn oxides [10,11,12,13]. Availability of P in calcareous soils is low due to chemical surface-precipitation and adsorption; nevertheless, distinguishing between the two mechanisms is not easy [1,10]. The fertilizers of P applied to soil react with the soil components to produce less soluble P forms [1,10]. Dicalcium or octacalcium phosphate is the main form of precipitated P in calcareous soils [10,11,13,14]. Under P deficient conditions, the application of P fertilizers is required to increase the availability of P to target levels, depending on soil properties [1,10]. During the last century, the rates of P application have been increased to raise the availability of P in soil, but raising availability of P in soils also increases the loss of P through run off, leaching, and erosion, causing water eutrophication [15,16]. Besides, the amount of rock phosphate for P manufacturing is limited, thus, management of P fertilization in a careful manner is mandatory [17,18,19]. Phosphorus fertilization practices need ideal management to reduce the loss of this non-renewable resource and minimize pollution of water, but current methods for measuring availability of soil P and plant P requirements are not adequately accurate to achieve this goal [20].
The critical value of soil P for potential yield of crop plants, which varies according to soil type, crop species, and environmental factors, is defined as the content of P in the soil above which an increase in potential yield is not expected [12,21,22]. To attain potential yields, farmers tend to apply excess amounts of P fertilizers beyond recommended doses leading to accumulation of P in the topsoil of farmlands and the formation of a large P pool [15,16]. The minimum level of available soil P for maximum crop production is referred to as the agronomically critical value of the available soil P which is the available soil P content used by researchers as a criterion for P fertilizing [12,21,23]. Phosphorus fertilization of wheat and soil testing calibrations for P fertilizer recommendations continue to be important topics [24,25,26]. However, since soil tests typically analyze the top 15 cm of the soil surface, which might not reflect the actual available soil P for plant uptake, these tests alone are a poor prediction tool for fertilization requirement. These difficulties have challenged agronomists and soil scientists to develop alternative tools to better judge soil fertility and identify where P fertilization is required for sustainably high crop production. Therefore, a combination of plant tissue analysis and soil tests may be a more powerful diagnostic tool for nutrient requirement prediction [26,27,28]. Nutrient concentrations in plant tissues have been widely reported to vary greatly, not only according to soil fertility but also according to growth stage of the plant, crop species and variety, the sampled plant organ, and environmental conditions [25,26,27,28]. Therefore, tissue analysis should be done with a wide range of genotypes and environmental conditions, and tissue tests results must clearly specify the sampled plant organs and the growth stage [24,25]. Plant-tissue analyses, which directly evaluate effects of nutrient management practices, help understanding the physiological roles of nutrients in plants, guide comprehensive fertilization recommendations for crops, and suggest additional diagnostic approaches [26,28,29].
Continuous additions of P fertilizer to supply the plant with its nutrient requirements may lead to environmental pollution because the plant is not able to absorb the excess quantities of the applied fertilizer [20]. Besides, the application of excess fertilizer does not increase the potential yield, but rather reduce profits [1,23]. Therefore, the critical threshold of the nutrient that yields the maximum crop yield under different environmental conditions must be determined to provide information to fertilizer policy makers. Tissue analysis in combination with soil testing, based on a 4-year field experiment, was investigated in the current study to assess the critical P value for maximum yield of wheat (Triticum aestivum L.) grown in sandy calcareous soils.

2. Material and Methods

2.1. Field Experiment

The present experiment was carried out in sandy calcareous soils located at Elharga Belquran village, Sohag, Egypt. The soil of the experimental site was classified as Calcisols [30], and Table 1 shows the physical and chemical properties. Table 2 shows the climatic conditions of the experimental site.
Wheat grains (Triticum aestivum vulgar, cv Solala 6) at rates of 150 kg ha−1 were sown by broadcasting on the first of December in the 2017–2020 growing seasons.
The experiment contained 11 rates of P fertilization i.e., 0, 15, 30, 45, 60, 75, 90, 105, 120, 135, and 150 kg P2O5 ha−1 per year. Phosphorus in the form of super phosphate (15.5% P2O5) was added directly to the soil in one dose before planting and mixing with the tillage layer. P fertilizer was added again once every year in November. The treatments were arranged in a randomized complete block design with four replicates each comprising an experimental unit of 20 m2.
All the agriculture practices were applied according to the recommendations of the Ministry of Agriculture and Land Reclamation (Egypt). Potassium fertilizer in the form of potassium sulphate (50% K2O) at a rate of 120 kg ha−1 was added in two equal portions (at cultivation and 30 days later). Nitrogen at the dose of 120 kg ha−1 was added as urea (46%N) in 5 equal doses, at the start and at 20, 50, 70, and 100 days after sowing. The rates and methods of fertilizer application followed the guidelines of the Ministry of Agriculture in Egypt. Wheat plants were harvested in May in all the studied growing seasons, and the grain, stover, and total yield were recorded.

2.2. Collection and Analysis of Soil Plant Samples

Soil and plant samples were collected after 60 days following sowing. Composite plant samples each representing 1/2 m2 of wheat plant from each experimental unit were taken from each experimental unit. The collected samples were used to determine the P concentrations. The plant samples were cleaned, washed with tap and distilled water, air dried, oven-dried at 70 °C until constant weight, ground, and stored for chemical analysis. Plant samples were digested with a mixture of 350 mL H2O2, 0.42 g Se powder, 14 g LiSO4∙H2O, and 420 mL concentrated H2SO4 [31]. P concentrations in the digest solution of each sample were determined by spectrophotometer as described by Burt [32]. Composite soil samples were collected by augur from 0–20 cm from each experimental unit. The collected soil samples were air-dried, crushed, and passed through a 2 mm sieve. This type of soil sample was used to determine soil Olsen P and other parameters.
Some physical and chemical properties of the soil were determined according to Burt [32]. The soil pH was measured in 1:2.5 soil to water suspension using a digital pH meter. Electrical conductivity (EC) was estimated using the salt bridge method [32]. Available soil nitrogen was extracted with 2 M potassium chloride and then the nitrogen in the extract was determined using the micro-Kjeldahl method [31]. The available soil P was extracted with 0.5 M sodium bicarbonate solution at pH 8.5 according to Olsen et al. [33] as described in Burt [31] and P was determined by spectrophotometer. Extraction of P using the Olsen method is recommended for these high pH soils [34,35]. The available potassium was extracted using ammonium acetate and was measured by flame photometry [31].
Phosphorus use efficiency was calculated using the following equation:
  PUE = ( Yp Yo ) / P )
where PUE is P use efficiency, Yp is the yield under a particular P level (kg), Yo is the yield of the control (kg), and P is the fertilization rate [35]. The degree of P saturation (DPS) was calculated for predicting P loss risk from the studied soil. The DPS was measured by the method of Jalali and Jalali [36] and calculated using the following equation:
DPS   ( % ) = Pox Al + Fe × 100
where Pox is the P extracted from soil with ammonium oxalate (pH = 3), and Al and Fe is aluminum and iron in the same extract. DPS is in %, while Al and Fe values are in mmol kg−1 of soil. Al and Fe in the oxalate extraction were measured using the ICP−OES thermo iCAP 6000 analyzer. The critical value of DPS is considered to be 25%, above which P loss risk is expected [36].

2.3. Data Analysis

The maximum yield which was used to calculate the critical P, was considered to be 90% of the maximum yield [12,37]. Relative yield (RY) was designed to avoid the seasonal variation in the wheat yield and was calculated using the following equation:
RY = Yf / Ym
where RY is the relative yield, Yf is the yield of a treatment (kg ha−1), and Ym is the maximum yield for each year (kg ha−1). The critical level of P in soil and plant tissue was calculated with linear and exponential models as described in the following equations:
RY = a + bX .  
RY = a × 10 1 e bX .  
where RY is the relative yield, X is the critical level of P, a and b are the constants of the equation. The critical soil P for degree of P saturation (DPS) was calculated by the same methods.
DPS = a + bX .  
DPS = a × 10 1 e bX .  
where DPS degree of P saturation, X is the critical level of P, a and b are the constants of the equation.
Analysis of Variance (ANOVA) and LSD tests at 5% level of probability were used to test significant difference between the treatments. Statistical analyses were performed using SPSS software, version 15 (SPSS, Chicago, IL, USA). The linear–linear and Mitscherlich exponential models were performed using SigmaPlot 14 Software (Systat Software, San Jose, CA, USA). The data that were processed in the mathematical models were the data from all seasons, replications, and P rates (n = 176, 4 years, 11 P rates, and 4 replicates).

3. Results

3.1. Effect of P Fertilization Rates on P in Soil and Plant

Increasing P fertilization rate increased P concentration in soil and plants. Olsen soil P concentrations as well as P in wheat shoot are shown in Table 3. The application of P fertilizer to the sandy calcareous soil caused remarkable changes in the availability of P in soil. Available Olsen P varied from 3.75 to 44.50 mg kg−1. The maximum Olsen P values were obtained from the soil fertilized with the highest P rate (150 kg P2O5 ha−1), while the lowest ones were recorded in the unfertilized soil. P in wheat tissue ranged from 3.18 to 9.49 g kg−1 dry weight. The highest significant P values in wheat tissue were recorded in wheat plants fertilized with 150 kg P2O5 ha−1, while the lowest ones were found in the control.
The rates of P fertilizer significantly (p < 0.05) affected P availability and uptake (Table 4).

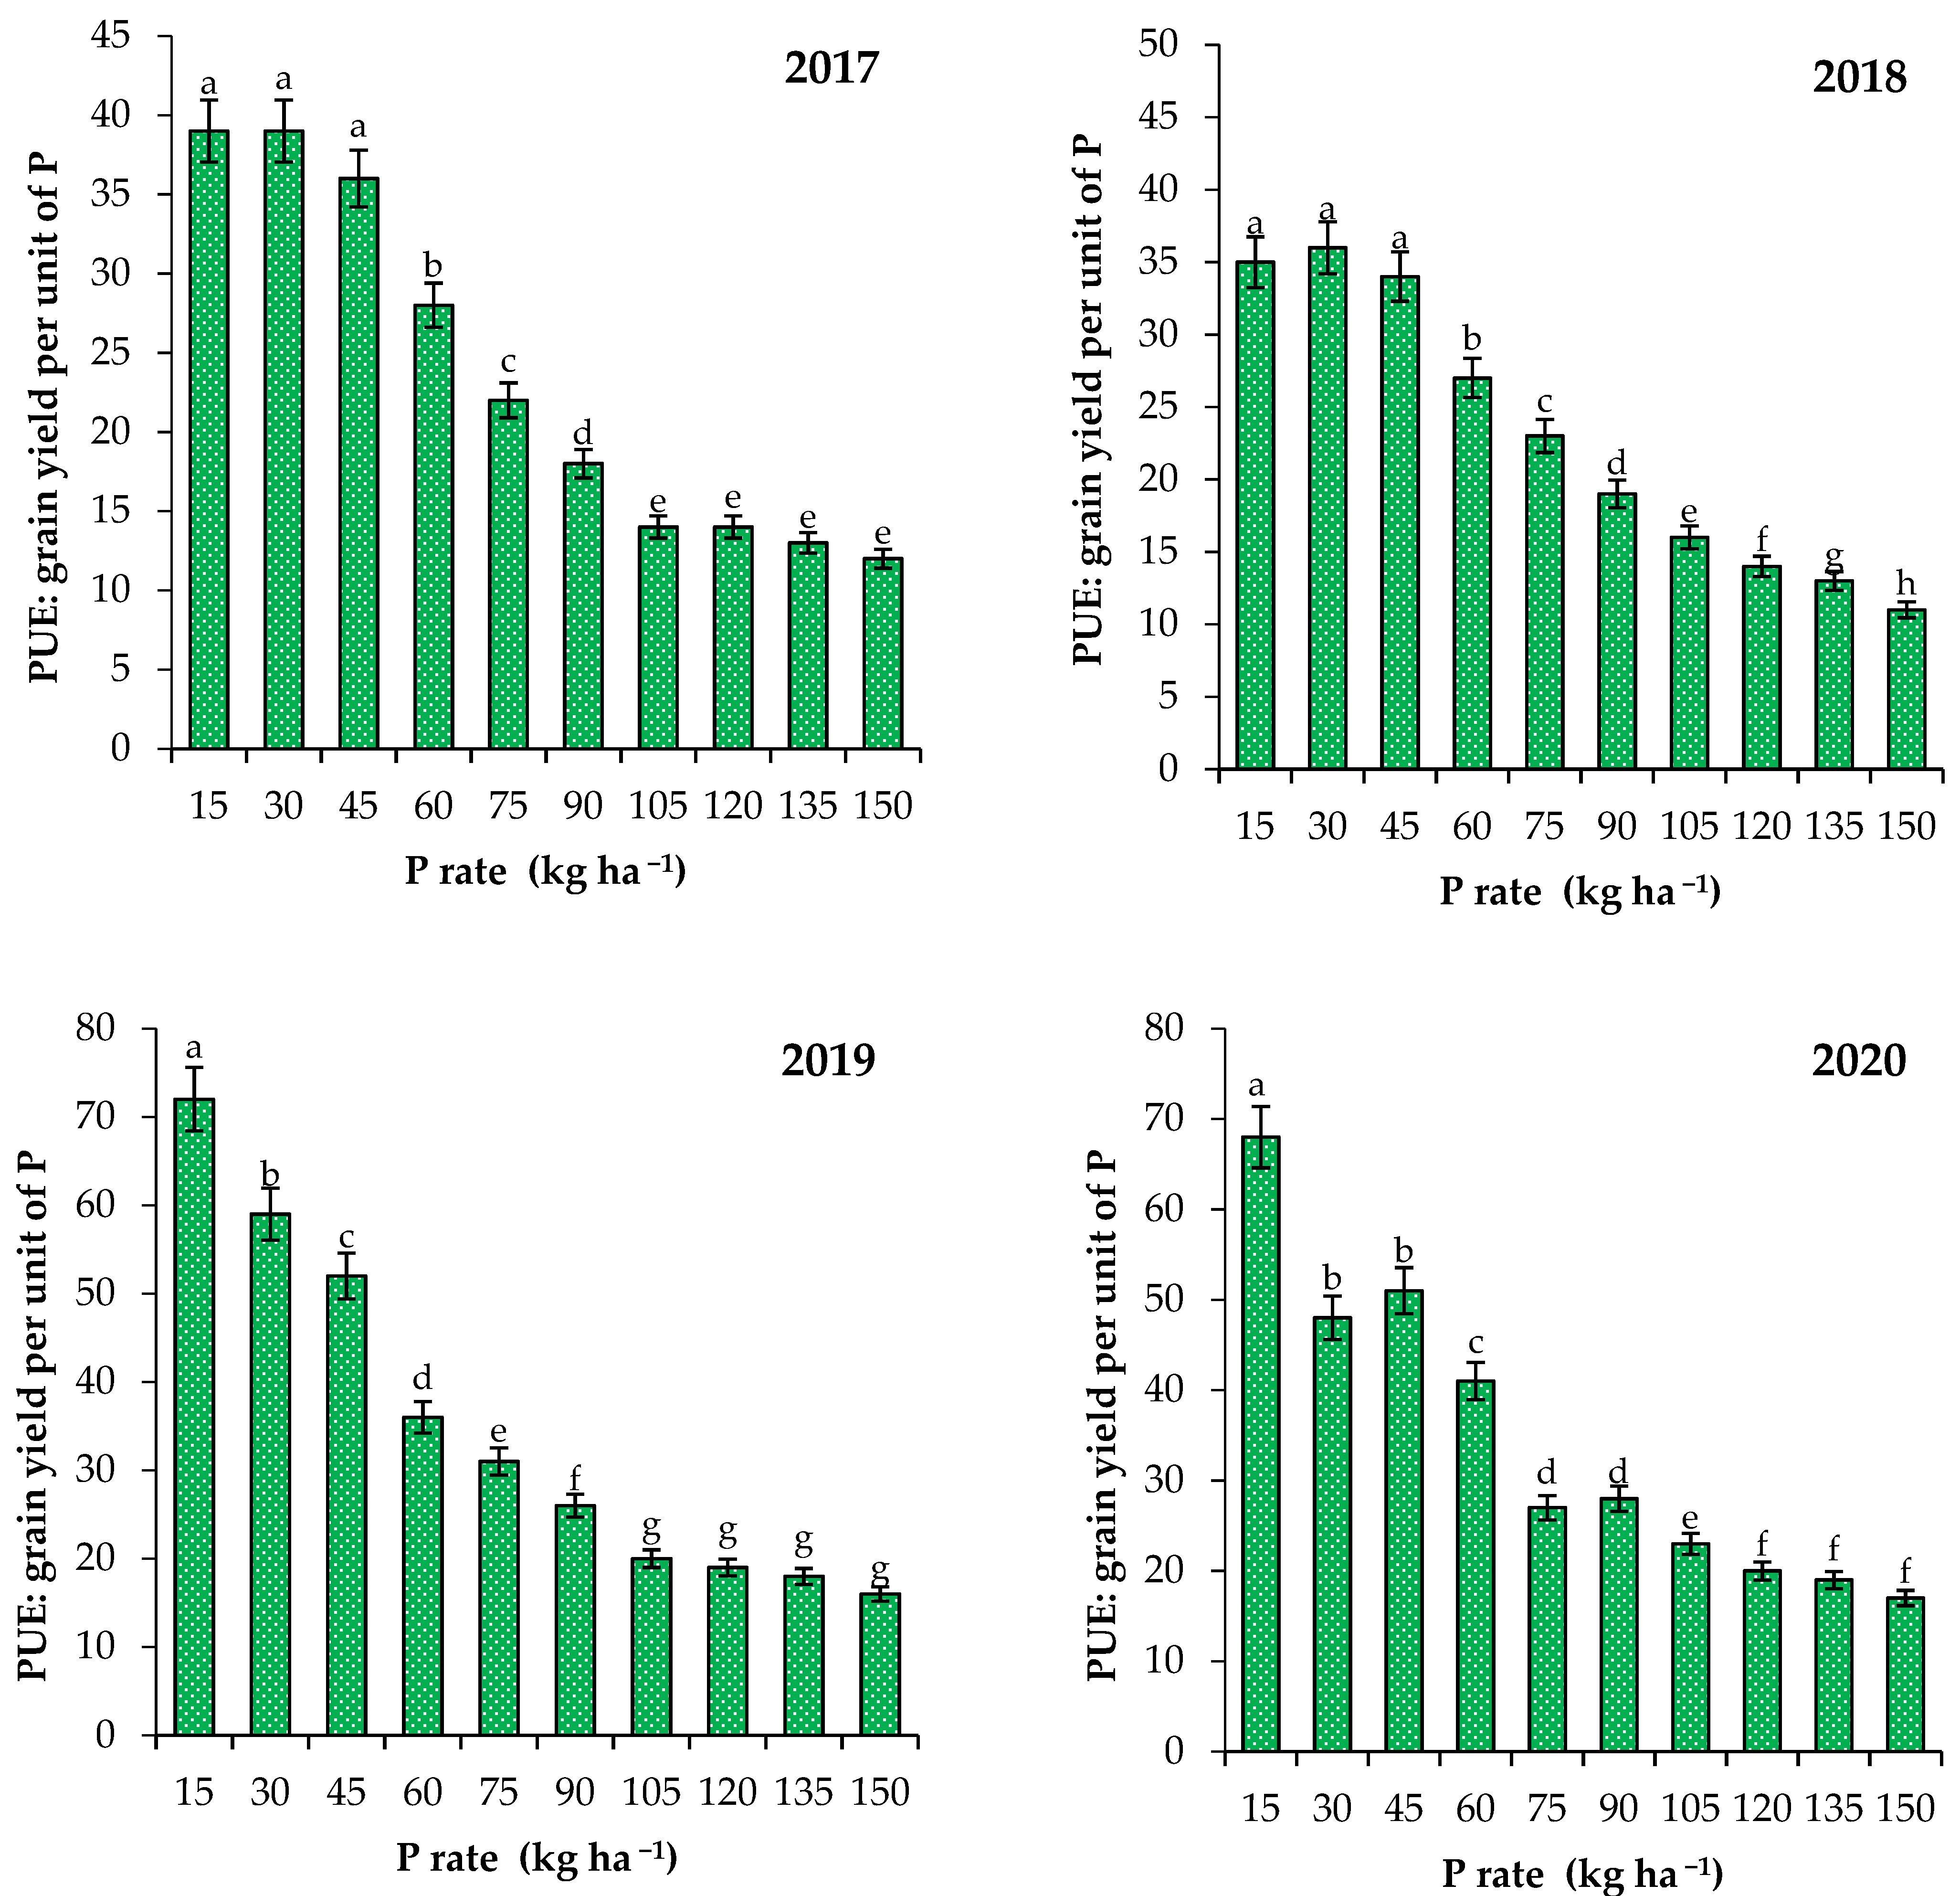
3.2. Effect of P Fertilizer Rates on Yield of Wheat and P Use Efficiency

The data in Table 3 show the effect of P fertilizer rates on wheat yield through the four growing seasons. The grain yield ranged from 3000 to 5632 kg ha−1, while the straw yield ranged from 3325 to 6850 kg ha−1. The highest grain and straw yield values were found in wheat plant fertilized with 150 kg P2O5 ha−1, while the lowest ones were found in the control. The grain and straw yield of wheat responded significantly to the application of P rates. The application of 15, 30, 45, 60, 75, 90, 105, 120, 135, and 150 kg P2O5 ha−1 caused increases in the grain yield by 22, 39, 56, 57, 55, 58, 56, 58, 61, and 60%, respectively, over the unfertilized soil, while in the case of straw yield these increases were 19, 33, 48, 46, 48, 49, 56, 54, 56, and 60%, respectively. Straw and grain yield of wheat were affected significantly by years (Table 4). The addition of P significantly affected the PUE through the four growing seasons (Figure 1). The maximum PUE was obtained under the low P rates, while increasing the P rates significantly reduced the value of PUE.

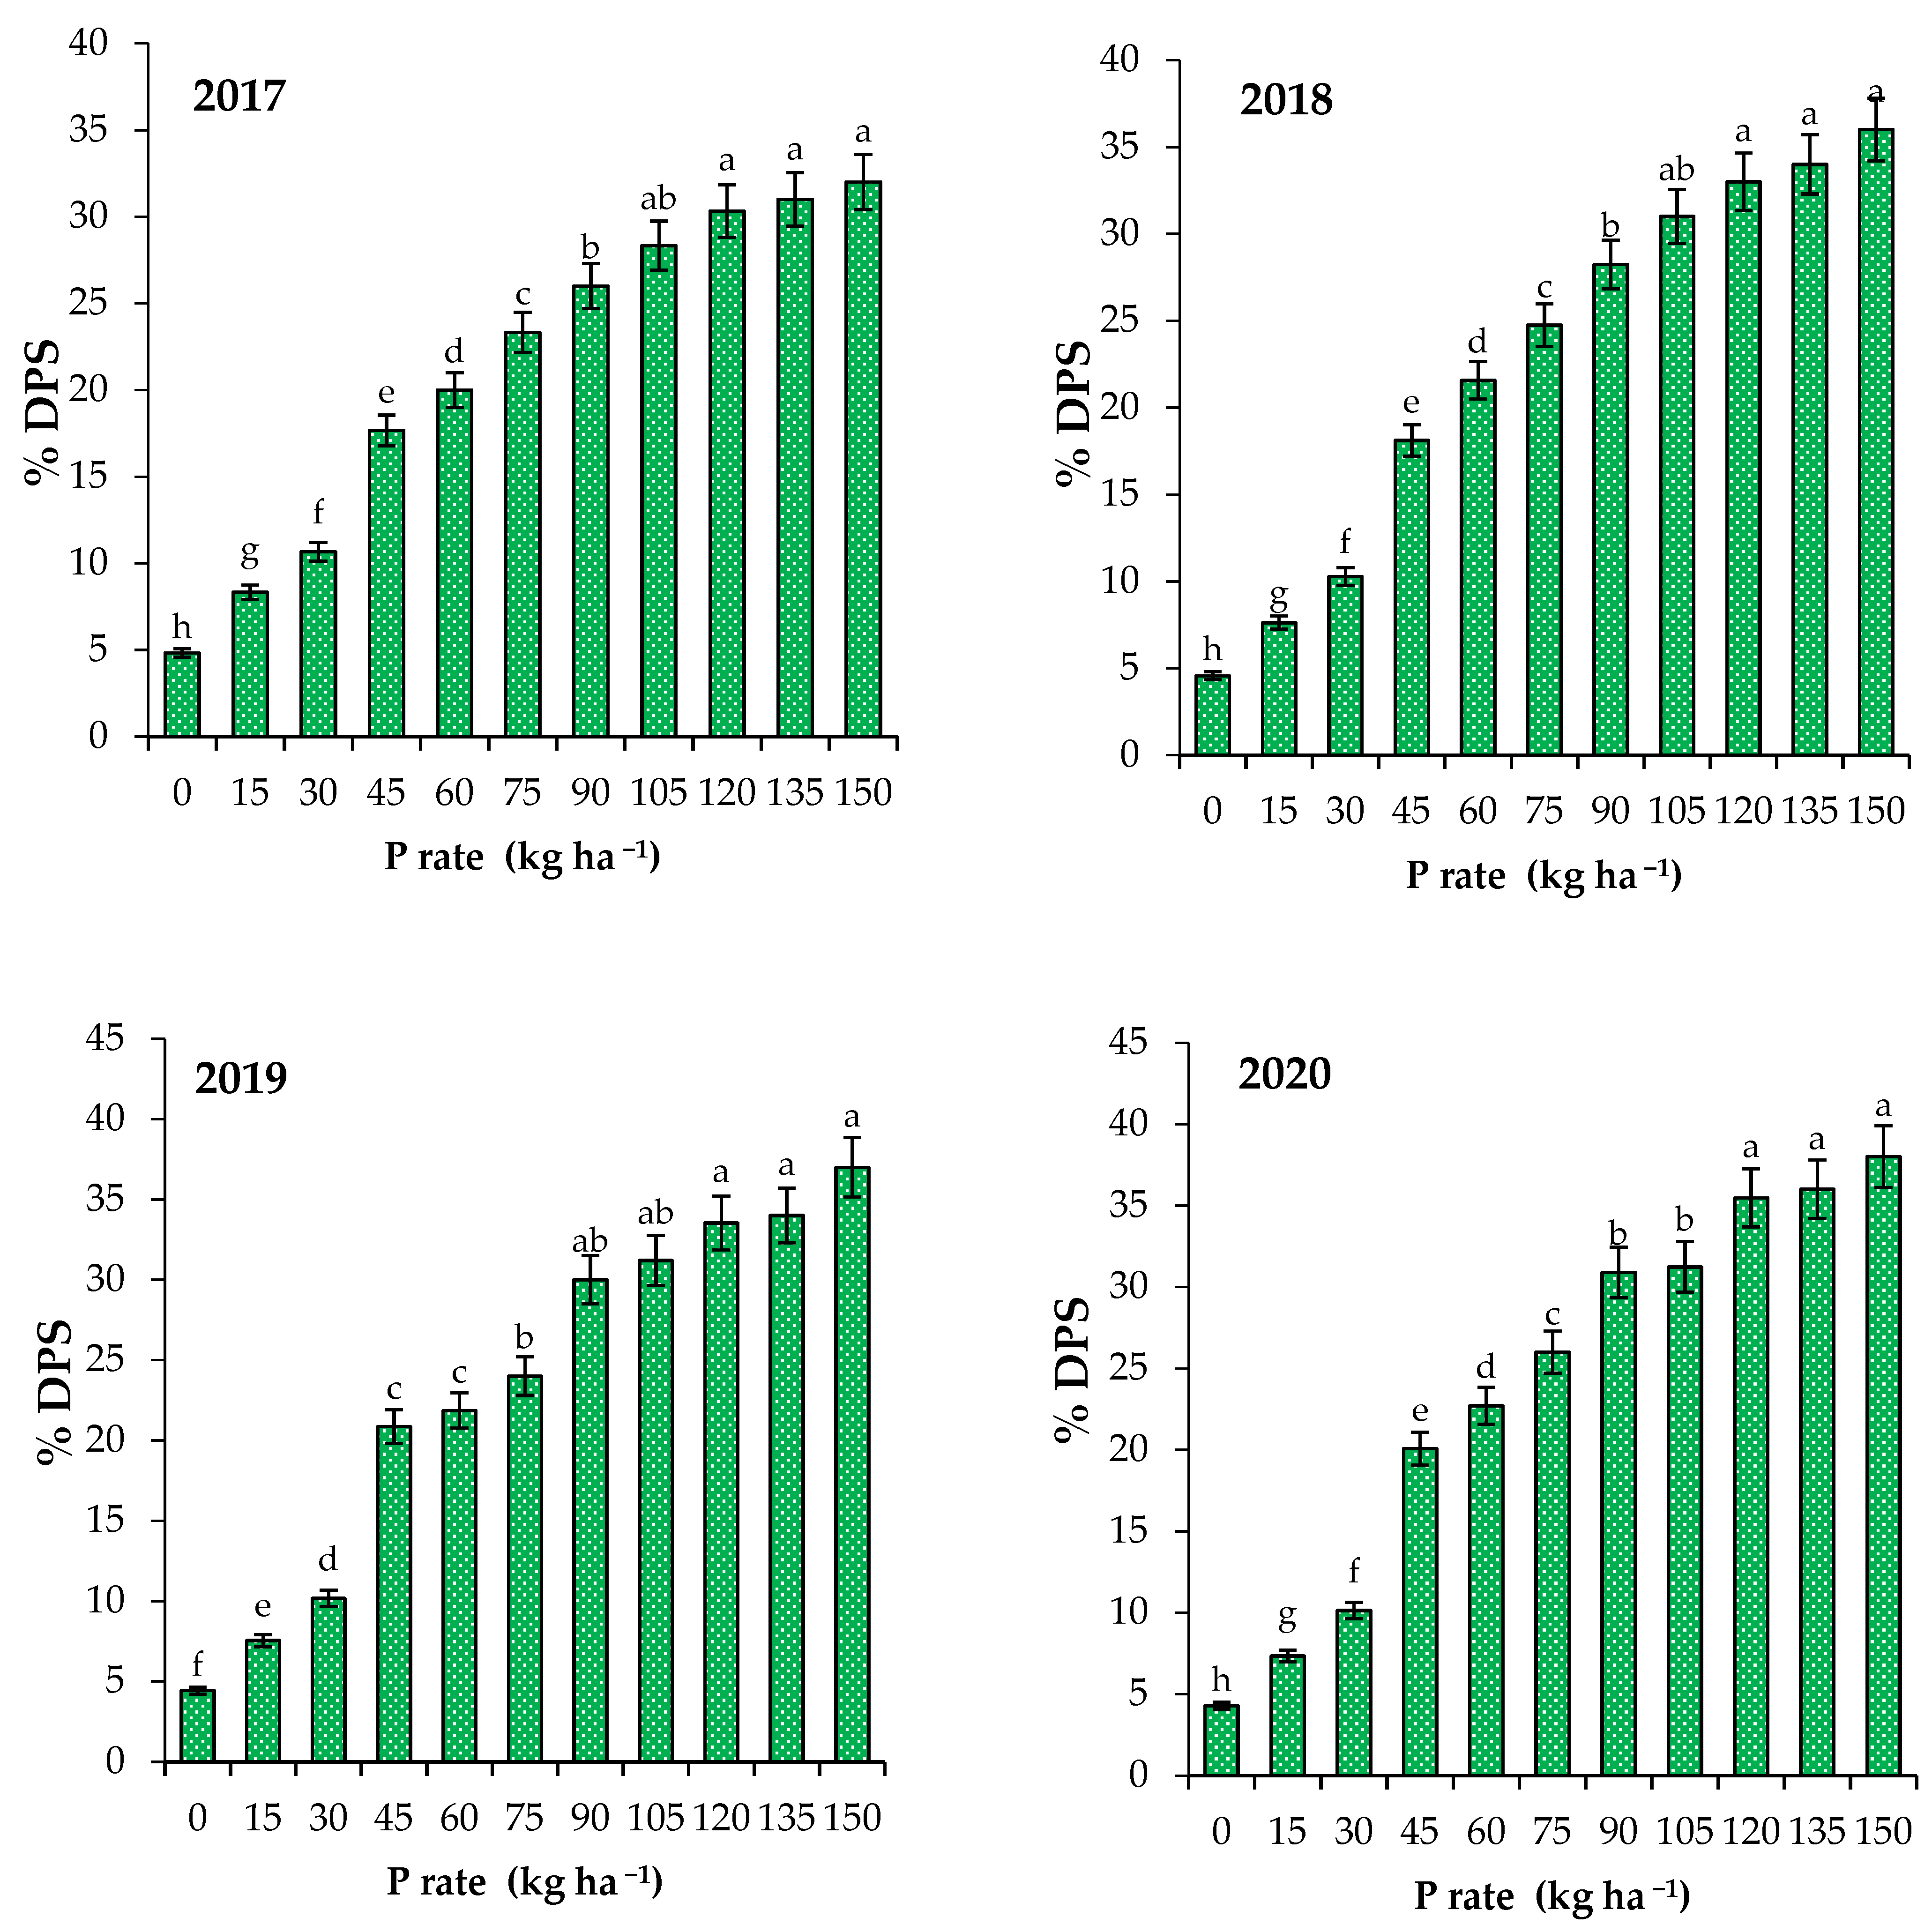
3.3. Critical P in Soil and Plant and P Loss Risk

The critical P in plant (PiP) and soil (SOP) was calculated based on the linear–linear and Mitscherlich exponential models and the data are shown in Table 5. The critical value of SOP ranged between 21.11–31.60 mg kg−1, while the critical value of PiP ranged between 6.40–7.49 g kg−1. The critical values of P calculated from the Mitscherlich exponential models were higher than that calculated from the linear–linear models. The critical SOP values from the Mitscherlich exponential models were higher by 18.6% and 22.9% than the linear–linear model in the case of grain and straw yield. The critical plant P (PiP) values calculated from the Mitscherlich exponential models were slightly higher than the linear–linear equations in the case of grain and straw yield. The critical P in plant (PiP) and soil (SOP) calculated from the linear–linear equation for straw yield were higher by 21.8% and 15.0%, respectively than grain yield. The critical P in plant (PiP) and soil (SOP) calculated from the Mitscherlich exponential models for straw yield were higher by 26.2% and 18.6%, respectively, than grain yield.
The degree of phosphorus saturation (DPS) was measured as an indicator to predict the occurrence of P run-off or leaching, and the results are presented in Figure 2. The values of DPS were affected significantly by the P rates and years. Increasing the P rates significantly increased DPS. DPS increased slightly with increasing years at P rates ≥45 kg P2O5 ha−1. The relationships between soil Olsen P and DPS were evaluated by linear–linear and Mitscherlich exponential models and the data are shown in Table 5. The two models adequately described the relationship between available soil P and DPS (R = 0.86 and 0.73 for the linear–linear and exponential models, respectively). The critical level of available soil P for P loss risk is 29.11 and 36.00 mg kg−1 according to the linear–linear and exponential models, respectively.

4. Discussion

The current study was carried out to identify the critical P concentrations either in the soil or plant tissue to maximize the potential grain and straw yield of wheat based on long-term field experiments. Phosphorus is a pivotal nutrient in wheat production playing a key role in plant physiological processes such as nutrients movement, nucleic acid synthesis, photosynthesis, energy transformation, structural development, and various metabolic processes; therefore, its deficiency adversely affects potential yield [38,39,40,41,42,43,44]. The obtained results revealed that wheat grown in sandy calcareous soils responded significantly (p < 0.05.) to the application of P fertilizer. The application of 15, 30, 45, 60, 75, 90, 105, 120, 135, and 150 kg P2O5 ha−1 increased the potential grain yield of wheat up to 22, 39, 56, 57, 55, 58, 56, 58, 61, and 60%, and the straw yield by 19, 33, 48, 46, 48, 49, 56, 54, 56, and 60%, respectively, compared to the non-fertilized treatment which is in accordance with the previous results observed by Agegnehu et al. [45] and Deng et al. [46]. All the treatments of P rates received the same amount of N (120 kg N ha−1) so it is not a limiting factor.
Critical soil P is the value of available P which gives the optimum yield; the response of crop yield to P fertilization above this value is not predictable or nil [22]. Determination of the critical value of available P in soil is crucial for fitting P fertilizing requirements [21]. If the soil-available P exceeds the critical value, further P application would not be justifiable and could increase the accumulation of P in soil and thereby increase the risk of environmental pollution with P [47,48]. The critical available P value is also dramatically influenced by soil type and structure, soil pH, sampling depth, and soil organic carbon content [49,50]. Based on Jordan-Meille et al. [51], the critical available P value was shown to range between 10 and 40 mg kg−1, depending on country, crop type, and soil type. Although there are great variations in the available P measurement procedures between investigated countries, critical P status calibration and estimation of recommended P doses there is little theoretical support for such wide ranges of P values. [52]. In our study, the critical available soil P values (21–32 mg kg−1) were within and/or similar to the reported range of 7–28 mg kg−1 reported in the literature for wheat production, the data of which are greatly affected by soil type, environmental conditions, and crop rotation [21,33,50,51,52,53]. Plant tissue analysis directly assesses the nutrient status in plants [26,28]. The results in our study reveal that critical P values in wheat tissue (PiP) ranged from 6.40 to 7.49 g kg−1, which are within the previously reported range of P in wheat plants (2 to 8.8 g kg−1) [27,54,55,56,57,58].
Several models have been employed to measure the critical available P values including the linear–linear, linear–plateau, the two linear split, exponential Mitscherlich, and quadratic polynomial models resulting in variations in the estimates [7,50,52,59,60]. Variations in critical P values calculation using different models indicate that employing the linear–linear model is more risky for farmers [33]. In the current study, the critical P values estimated from the exponential Mitscherlich model were higher than those estimated using the linear–linear model as also found in other reported results [21,50,53,61]. The estimated critical values from the linear–linear model are lower possibly due to these having a sharp discontinuance at the critical point of P value along with the linear component [21,50,53].
The risk of P loss from soil by leaching or run-off depends on the degree of P saturation (DPS) in soil [36,58]. When the soil is saturated with P, any additions above this level will lead to an increase in the environmental risks of P pollution [62,63]. Previous studies indicate that the critical DPS value is 25% and above this value, the P loss to surface and ground waters increases significantly [36,58,59,60,61,62,63,64]. The addition of P rates above 75 kg P2O5 ha−1 results in a DPS value above 25%. Based on the relationship between the available soil P and the DPS values the safe limit of soil Olsen P value must be below 29–36 mg kg−1; increasing the levels of Olsen P above this point leads to increased risk of P losses. Wang et al. [65] studied the P loss risk from agriculture soils and reported that the soil with Olsen P > 30 mg kg−1 leads to increase the risk of P leaching and run-off.

5. Conclusions

Identification of critical values of soil and plant P is essential for achieving the yield potential in crop plants. A powerful approach combined both plant tissue and soil analyses, employing both the linear–linear and the exponential Mitscherlich models. This was successfully implemented to identify the critical values of P in spring bread wheat grown in sandy calcareous soils. Mitscherlich exponential models gave higher critical P values than the linear–linear models. Based on a 4-year field experiment, the critical P value for maximum wheat yield ranged from 21 to 32 mg kg−1, while in wheat tissue it ranged from 6.40 to 7.49 g kg−1. Adding levels of P fertilization ≥90 kg P2O5 ha−1 leads to potential environmental risks and significantly reduces the P use efficiency. Identification of critical P values is of great importance to policy makers to improve the application efficiency of P fertilizers, maximize the yield potential of crop plants, reduce the inputs and the excess accumulation of P fertilizers in soil, and minimize the potential risks of water contamination.

Author Contributions

Conceptualization, Z.H. and Z.D.; methodology, S.F.A.-E., M.A.S., M.T.S., K.A.M.I., A.H., A.A.S. and M.A.E.; software, H.M.A.-Y.; validation, E.F.A., Z.D. and Z.H.; formal analysis, M.A.E.; investigation, A.H.; writing—original draft preparation, M.A.E.; writing—review and editing, Z.H., Z.D.; S.F.A.-E., M.A.S., M.T.S., K.A.M.I., A.H. and M.A.E.; funding acquisition, H.M.A.-Y. All authors have read and agreed to the published version of the manuscript.

Funding

This research was funded by Taif University Researchers Supporting Project, grant number TURSP-2020/199.

Acknowledgments

The authors are thankful to Taif University Researchers Supporting Project number (TURSP-2020/199), Taif University, Saudi Arabia, for the financial support and research facilities.

Conflicts of Interest

There were no conflicts of interest from the authors.

References

  1. Giraldo, P.; Benavente, E.; Manzano-Agugliaro, F.; Gimenez, E. Worldwide Research Trends on Wheat and Barley: A Bibliometric Comparative Analysis. Agronomy 2019, 9, 352. [Google Scholar] [CrossRef] [Green Version]
  2. Eissa, M.A. Nutrition of drip irrigated corn by phosphorus under sandy calcareous soils. J. Plant Nutr. 2016, 39, 1620–1626. [Google Scholar] [CrossRef]
  3. Kolahchi, Z.; Jalali, M. Phosphorus Movement and Retention by Two Calcareous Soils. Soil Sediment Contam. Int. J. 2013, 22, 21–38. [Google Scholar] [CrossRef]
  4. Gitari, H.I.; Shadrack, N.; Kamau, S.; Karanja, N.N.; Gachene, C.K.K.; Schulte-Geldermann, E. Agronomic assessment of phosphorus efficacy for potato (Solanum tuberosum L) under legume intercrops. J. Plant Nutr. 2020, 43, 864–878. [Google Scholar] [CrossRef]
  5. Silvertooth, C.J. Fertigation in Arid Regions and Saline Soils. In Proceedings of the IPINATESC-CAUCAAS international Symposium on Fertigation, Beijing, China, 20–24 September 2005. [Google Scholar]
  6. Badr, M.A.; El-Tohamy, W.A.; Zaghloul, A.M. Yield and water use efficiency of potato grown under different irrigation and nitrogen levels in an arid region. Agric. Water Manag. 2012, 110, 9–15. [Google Scholar] [CrossRef]
  7. Manghabati, H.; Kohlpaintner, M.; Ettl, R.; Mellert, K.; Blum, U.; Göttlein, A. Correlating phosphorus extracted by simple soil extraction methods with foliar phosphorus concentrations of Picea abies (L.) H. Karst. and Fagus sylvatica (L.). J. Plant Nutr. Soil Sci. 2018, 181, 547–556. [Google Scholar] [CrossRef]
  8. Gachene, C.K.K.; Nyawade, S.O.; Karanja, N.N. Soil and Water Conservation: An Overview. In Encyclopedia of the UN Sustainable Development Goals; Leal, F.W., Azul, A., Brandli, L., Ozuyar, P., Wall, T., Eds.; Springer: Cham, Switzerland, 2019. [Google Scholar]
  9. Lemming, C.; Oberson, A.; Magid, J.; Bruun, S.; Scheutz, C.; Frossard, E.; Jensen, L.S. Residual phosphorus availability after long-term soil application of organic waste. Agric. Ecosyst. Environ. 2019, 270–271, 65–75. [Google Scholar] [CrossRef]
  10. Al-Rohily, K.M.; Ghoneim, A.M.; Modaihsh, A.S.; Mahjoub, M.O. Phosphorus Availability in Calcareous Soil Amend with Chemical Phosphorus Fertilizer, Cattle Manure Compost and Sludge Manure. Int. J. Soil Sci. 2013, 8, 17–24. [Google Scholar] [CrossRef] [Green Version]
  11. Naeem, A.; Akhtar, M.; Ahmad, W. Optimizing available phosphorus in calcareous soils fertilized with diammonium phosphate and phosphoric acid using Freundlich adsorption isotherm. Sci. World J. 2013, 2013, 680257. [Google Scholar] [CrossRef]
  12. Shi, L.L.; Shen, M.X.; Lu, C.Y.; Wang, H.H.; Zhou, X.W.; Jin, M.J.; Wu, T.D. Soil phosphorus dynamic, balance and critical P values in long-term fertilization experiment in Taihu Lake region, China. J. Integr. Agric. 2015, 14, 2446–2455. [Google Scholar] [CrossRef]
  13. Antoniadis, V.; Koliniati, R.; Efstratiou, E.; Golia, E.; Petropoulos, S. Effect of soils with varying degree of weathering and pH values on phosphorus sorption. CATENA 2016, 139, 214–219. [Google Scholar] [CrossRef]
  14. Bell, L.C.; Black, C.A. Transformation of Dibasic Calcium Phosphate Dihydrate and Octacalcium Phosphate in Slightly Acid and Alkaline Soils1. Soil Sci. Soc. Am. J. 1970, 34, 583–587. [Google Scholar] [CrossRef]
  15. Li, J.M.; Gao, J.S.; Liu, J.; Xu, M.G.; Ma, Y.B. Predictive Model for Phosphorus Accumulation in Paddy Soils with Long-Term Inorganic Fertilization. Commun. Soil Sci. Plant Anal. 2012, 43, 1823–1832. [Google Scholar] [CrossRef]
  16. Wang, B.; Liu, H.; Wang, X.H.; Li, J.M.; Ma, Y.B.; Ma, X.W. Soil phosphorus accumulation model for an arid area of north-western China with 3-year rotation of wheat, maize and cotton. J. Agric. Sci. 2014, 153, 1247–1256. [Google Scholar] [CrossRef]
  17. Sims, J.T.; Sharpley, A.N. Phosphorus: Agriculture and the Environment; American Society of Agronomy: Madison, WI, USA, 2005. [Google Scholar]
  18. Johnston, A.E.; Syers, J.K. Changes in Understanding the Behaviour of Soil and Fertiliser Phoshorus: Implications for Their Efficient Use in Agriculture. In Proceedings of the International Fertiliser Society, York, UK, 14 December 2006. [Google Scholar]
  19. Rowe, H.; Withers, P.J.A.; Baas, P.; Chan, N.I.; Doody, D.; Holiman, J.; Jacobs, B.; Li, H.; MacDonald, G.K.; McDowell, R.; et al. Integrating legacy soil phosphorus into sustainable nutrient management strategies for future food, bioenergy and water security. Nutr. Cycl. Agroecosys. 2016, 104, 393–412. [Google Scholar] [CrossRef]
  20. Cadot, S.; Bélanger, G.; Ziadi, N.; Morel, C.; Sinaj, S. Critical plant and soil phosphorus for wheat, maize, and rapeseed after 44 years of P fertilization. Nutr. Cycl. Agroecosys. 2018, 112, 417–433. [Google Scholar] [CrossRef] [Green Version]
  21. Tang, X.; Ma, Y.; Hao, X.; Li, X.; Li, J.; Huang, S.; Yang, X. Determining critical values of soil Olsen-P for maize and winter wheat from long-term experiments in China. Plant Soil. 2009, 323, 143–151. [Google Scholar] [CrossRef]
  22. Mallarino, A.P.; Blackmer, A.M. Comparison of Methods for Determining Critical Concentrations of Soil Test Phosphorus for Corn. Agron. J. 1992, 84, 850–856. [Google Scholar] [CrossRef] [Green Version]
  23. Wang, B.; Liu, H.; Hao, X.Y.; Wang, X.H.; Sun, J.S.; Li, J.M.; Ma, Y.B. Agronomic threshold of soil available phosphorus in grey desert soils in Xinjiang, China. IOP Conf. Ser. Earth Environ. Sci. 2016, 41, 012010. [Google Scholar] [CrossRef] [Green Version]
  24. Brennan, R.F.; Bolland, M.D.A. Soil and tissue tests to predict the sulfur requirements of canola in south-western Australia. Aust. J. Exp. Agric. 2016, 46, 1061–1068. [Google Scholar] [CrossRef]
  25. Chen, W.; Bell, R.W.; Brennan, R.F.; Bowden, J.W.; Dobermann, A.; Rengel, Z.; Porter, W. Key crop nutrient management issues in the Western Australia grains industry: A review. Soil Res. 2009, 47, 1–18. [Google Scholar] [CrossRef]
  26. Silveira, M.L.; Obour, A.K.; Vendramini, J.M.; Sollenberger, L.E. Using tissue analysis as a tool to predict bahiagrass phoshorus fertilization requirement. J. Plant Nutr. 2011, 34, 2193–2205. [Google Scholar] [CrossRef]
  27. Campbell, R. Reference Sufficiency Ranges for Plant Analysis in the Southern Region of the United States; North Carolina Department of Agriculture and Consumer Services Agronomic Division: Raleigh, NC, USA, 2000. [Google Scholar]
  28. Stammer, A.J.; Antonio, P.M. Plant tissue analysis to assess phosphorus and potassium nutritional status of corn and soybean. Soil. Sci. Soc. Am. J. 2018, 82, 260–270. [Google Scholar] [CrossRef] [Green Version]
  29. Eissa, M.A.; Nafady, M.; Ragheb, H.; Attia, K. Effect of soil moisture and forms of phosphorus fertilizers on corn production under sandy calcareous soil. World Appl. Sci. J. 2013, 26, 540–547. [Google Scholar]
  30. FAO. Guidelines for Soil Description, 4th ed.; Viale delle Terme di Caracalla: Rome, Italy, 2006. [Google Scholar]
  31. Parkinson, J.A.; Allen, S.E. A wet oxidation procedure suitable for the determination of nitrogen andmineral nutrients in biological material. Commun. Soil Sci. Plant Anal. 1975, 6, 1–11. [Google Scholar] [CrossRef]
  32. Burt, R. Soil Survey Laboratory Methods Manual. Soil Survey Investigations Report No. 42, Version 4.0, Natural Esources Conservation Service; United States Department of Agriculture: Lincoln, NE, USA, 2004.
  33. Olsen, S.R. Estimation of Available Phosphorus in Soils by Extraction with Sodium Bicarbonate; US Department of Agriculture: New York, NY, USA, 1954.
  34. Blombäck, K.; Bolster, C.H.; Lindsjö, A.; Hesse, K.; Linefur, H.; Parvage, M.M. Comparing measures for determination of phosphorus saturation as a method to estimate dissolved P in soil solution. Geoderma 2021, 383, 114708. [Google Scholar] [CrossRef]
  35. Eissa, M.A. Efficiency of P fertigation for drip-irrigated potato grown on calcareous sandy soils. Potato Res. 2019, 62, 97–108. [Google Scholar] [CrossRef]
  36. Jalali, M.; Jalali, M. Relation between various soil phosphorus extraction methods and sorption parameters in calcareous soils with di_erent texture. Sci. Total Environ. 2016, 566, 1080–1093. [Google Scholar] [CrossRef]
  37. Colomb, B.; Debaeke, P.; Jouany, C.; Nolot, J.M. Phosphorus management in low input stockless cropping systems: Crop and soil responses to contrasting P regimes in a 36-year experiment in southern France. Eur. J. Agron. 2007, 26, 154–165. [Google Scholar] [CrossRef]
  38. Manschadi, A.M.; Kaul, H.P.; Vollmann, J.; Eitzinger, J.; Wenzel, W. Developing phosphorus-efficient crop varieties—An interdisciplinary research framework. Field Crop. Res. 2014, 162, 87–98. [Google Scholar] [CrossRef]
  39. Naumann, M.; Koch, M.; Thiel, H.; Gransee, A.; Pawelzik, E. The importance of nutrient management for potato production part II: Plant nutrition and tuber quality. Potato Res. 2020, 63, 121–137. [Google Scholar] [CrossRef] [Green Version]
  40. Ding, Z.; Zhou, Z.; Lin, X.; Zhao, F.; Wang, B.; Lin, F.; Ge, Y.; Eissa, M.A. Biochar impacts on NH3-volatilization kinetics and growth of sweet basil (Ocimum basilicum L.) under saline conditions. Ind. Crop. Prod. 2020, 157, 11290–12903. [Google Scholar] [CrossRef]
  41. Eissa, M.A.; Abeed, A.H. Growth and biochemical changes in quail bush (Atriplex lentiformis (Torr.) S.Wats) under Cd stress. Environ. Sci. Pollut. Res. 2019, 26, 628–635. [Google Scholar] [CrossRef]
  42. Abou-Zaid, E.A.; Eissa, M.A. Thompson seedless grapevines growth and quality as affected by glutamic acid, vitamin b, and algae. J. Soil Sci. Plant Nutr. 2019, 19, 725–733. [Google Scholar] [CrossRef]
  43. Ali, A.M.; Awad, M.Y.; Hegab, S.A.; Gawad, A.M.A.E.; Eissa, M.A. Effect of potassium solubilizing bacteria (Bacillus cereus) on growth and yield of potato. J. Plant Nutr. 2021, 44, 411–420. [Google Scholar] [CrossRef]
  44. Al-Sayed, H.; Hegab, S.A.; Youssef, M.; Khalafalla, M.; Almaroai, Y.A.; Ding, Z.; Eissa, M.A. Evaluation of quality and growth of roselle (Hibiscus sabdariffa L.) as affected by bio-fertilizers. J. Plant Nutr. 2021, 43, 1025–1035. [Google Scholar] [CrossRef]
  45. Agegnehu, G.; Ghizaw, A.; Sinebo, W. Yield potential and land-use efficiency of wheat and faba bean mixed intercropping. Agron. Sustain. Dev. 2008, 28, 257–263. [Google Scholar] [CrossRef] [Green Version]
  46. Deng, Y.; Teng, W.; Tong, Y.P.; Chen, X.P.; Zou, C.Q. Phosphorus Efficiency Mechanisms of Two Wheat Cultivars as Affected by a Range of Phosphorus Levels in the Field. Front. Plant Sci. 2018, 9, 1614. [Google Scholar] [CrossRef]
  47. Shepherd, M.A.; Withers, P.J. Applications of poultry litter and triple superphosphate fertilizer to a sandy soil: Effects on soil phosphorus status and profile distribution. Nutr. Cycl. Agroecosys. 1999, 54, 233–242. [Google Scholar] [CrossRef]
  48. Aulakh, M.S.; Garg, A.K.; Kabba, B.S. Phosphorus accumulation, leaching and residual effects on crop yields from long-term applications in the subtropics. Soil Use Manag. 2007, 23, 417–427. [Google Scholar] [CrossRef]
  49. Johnston, A.E.; Poulton, P.R.; White, R.P. Plant-available soil phosphorus. Part II: The response of arable crops to Olsen P on a sandy clay loam and a silty clay loam. Soil Use Manag. 2013, 29, 12–21. [Google Scholar] [CrossRef]
  50. Poulton, P.R.; Johnston, A.E.; White, R.P. Plant-available soil phosphorus. Part I: The response of winter wheat and spring barley to Olsen P on a silty clay loam. Soil Use Manag. 2013, 29, 4–11. [Google Scholar] [CrossRef]
  51. Jordan-Meille, L.; Rubæk, G.H.; Ehlert, P.A.I.; Genot, V.; Hofman, G.; Goulding, K.; Recknagel, J.; Provolo, G.; Barraclough, P. An overview of fertilizer-P recommendations in Europe: Soil testing, calibration and fertilizer recommendations. Soil Use Manag. 2012, 28, 419–435. [Google Scholar] [CrossRef]
  52. Bollons, H.M.; Barraclough, P.B. Assessing the phosphorus status of winter wheat crops: Inorganic orthophosphate in whole shoots. J. Agric. Sci. 1999, 133, 285–295. [Google Scholar] [CrossRef]
  53. Bai, Z.; Li, H.; Yang, X.; Zhou, B.; Shi, X.; Wang, B.; Li, D.; Shen, J.; Chen, Q.; Qin, W.; et al. The critical soil P levels for crop yield, soil fertility and environmental safety in different soil types. Plant Soil. 2013, 372, 27–37. [Google Scholar] [CrossRef]
  54. Holmes, M.R.J. Nutrition of the Oilseed Rape Crop; Applied Science Publishers: London, UK, 1980. [Google Scholar]
  55. Cate, R.B.; Nelson, L.A. A Simple Statistical Procedure for Partitioning Soil Test Correlation Data into Two Classes1. Soil Sci. Soc. Am. J. 1971, 35, 658–660. [Google Scholar] [CrossRef]
  56. Eissa, M.A.; Ghoneim, M.F.; Elgharably, G.A.; Abd El-Razek, M. Phytoextraction of nickel, lead and cadmium from metal contaminated soils using different field. World Appl. Sci. J. 2014, 32, 1045–1052. [Google Scholar]
  57. Eissa, M.A. Impact of compost on metals phytostabilization potential of two halophytes species. Int. J. Phytorem. 2015, 17, 662–668. [Google Scholar] [CrossRef]
  58. Eissa, M.A.; Roshdy, N.M. Nitrogen fertilization: Effect on Cd-phytoextraction by the halophytic plant quail bush [Atriplex lentiformis (Torr.) S. Wats]. S. Afr. Bot. 2018, 115, 126–131. [Google Scholar] [CrossRef]
  59. Eissa, M.A.; Ahmed, E.M. Nitrogen and phosphorus fertilization for some Atriplex plants grown on metal-contaminated soils. Soil Sediment Contam. 2016, 25, 431–442. [Google Scholar] [CrossRef]
  60. Johnston, A.E.; Lane, P.W.; Mattingly, G.E.G.; Poulton, P.R.; Hewitt, M.V. Effects of soil and fertilizer P on yields of potatoes, sugar beet, barley and winter wheat on a sandy clay loam soil at Saxmundham, Suffolk. J. Agric. Sci. 2009, 106, 155–167. [Google Scholar] [CrossRef]
  61. Cox, F.R. Range in soil phosphorus critical levels with time. Soil Sci. Soc. Am. J. 1992, 56, 1504–1509. [Google Scholar] [CrossRef]
  62. Jalali, M.; Jalali, M. Assessment risk of phosphorus leaching from calcareous soils using soil test phosphorus. Chemosphere 2017, 171, 106–117. [Google Scholar] [CrossRef]
  63. Abboud, F.Y.; Favaretto, N.; Motta, A.C.V.; Barth, G.; Goularte, G.D. Phosphorus mobility and degree of saturation in Oxisol under no-tillage after long-term dairy liquid manure application. Soil Tillage Res. 2018, 177, 45–53. [Google Scholar] [CrossRef]
  64. Pizzeghello, D.; Berti, A.; Nardi, S.; Morari, F. Phosphorus forms and P sorption in three alkaline soils after long-term mineral and manure applications. Agric. Ecosyst. Environ. 2011, 141, 58–66. [Google Scholar] [CrossRef]
  65. Wang, Y.T.; Zhang, T.Q.; O’Halloran, I.P.; Tan, C.S.; Hu, Q.C.; Reid, D.K. Soil tests as risk indicators for leaching of dissolved phosphorus from agricultural soils in Ontario. Soil Sci. Soc. Am. J. 2012, 76, 220–229. [Google Scholar] [CrossRef]
Figure 1. P use efficiency (PUE) as affected by fertilization rates during the four growing seasons (2017–2020). Means denoted by different letters indicate significant difference according to Duncan’s test at p < 0.05.
Agronomy 11 01950 g001
Figure 2. The degree of phosphorus saturation (DPS) as affected by fertilization rates during the four growing seasons (2017–2020). Means denoted by different letters indicate significant difference according to Duncan’s test at p < 0.05.
Agronomy 11 01950 g002
Table 1. Some physical and chemical soil properties (0–20 cm) of the studied soil.
Properties0–20 cm
Sand (%)86
Silt (%)10
Clay (%)4
TextureSandy
Field capacity (v%)16
Witling point (v%)10
CaCO3 (%)18
pH (1:2 suspension)8.1
ECe (dS m−1)3.5
Organic matter (g kg−1)4.0
Total N (mg kg−1)200
Available N (mg kg−1)20
Available Olsen P (mg kg−1)5.0
Available K (mg kg−1)200
Each value represents a mean of three replicates. ECe: Electric Conductivity of the saturated soil extract.
Table 2. Average monthly maximum (Tmax) and minimum (Tmin) temperature, relative humidity (RH), wind speed (WS), and reference evapotranspiration (ETo) during the 2016–2019 growing seasons.
MonthTmaxTminRH (%)WS (km h−1)ETo (mm)
December197403.82.9
January176455.23.2
February217506.64.0
March2614405.05.5
April3018454.47.0
Data were obtained from Central Laboratory for Agricultural Climate, Egypt.
Table 3. Average values of soil Olsen P, P in plant, grain yield, and straw yield of wheat in the four growing seasons (2017–2020).
SeasonP Rate
(kg ha−1)
Soil Olsen P
(mg kg−1)
P in Plant
(g kg−1)
Grain Yield
(kg ha−1)
Straw Yield
(kg ha−1)
201705.00 ± 1.41 G3.37 ± 0.07 I3842 ± 247 C5175 ± 354 A
158.75 ± 3.65 G4.08 ± 0.46 H4427 ± 126 B5750 ± 233 B
3013.50 ± 5.09 GF4.55 ± 0.42 GH5025 ± 483 B6300 ± 460 AB
4517.75 ± 6.69 F5.16 ± 0.31 FG5480 ± 656 A6425 ± 183 AB
6021.00 ± 7.36 EF5.63 ± 0.20 F5505 ± 678 A6150 ± 489 AB
7525.50 ± 8.54 ED6.40 ± 0.29 E5475 ± 779 A6525 ± 672 A
9027.25 ± 8.84 D7.20 ± 0.53 DE5485 ± 741 A6650 ± 638 A
10532.50 ± 11.91 CD7.94 ± 0.20 CD5335 ± 736 A6275 ± 720 A
12035.25 ± 10.76 BC8.48 ± 0.15 BC5547 ± 622 A6400 ± 820 A
13538.50 ± 14.33 B8.99 ± 0.18 AB5545 ± 758 A6150 ± 845 AB
15044.50 ± 15.77 A9.49 ± 0.16 A5632 ± 659 A6550 ± 620 A
201804.25 ± 0.50 H3.38 ± 0.12 G3875 ± 126 D4300 ± 141 DE
159.25 ± 0.96 G4.03 ± 0.26 FG4400 ± 141 C4625 ± 236 D
3014.25 ± 1.26 F4.29 ± 0.08 F4963 ± 281 B5375 ± 519 C
4518.00 ± 0.82 E5.08 ± 0.21 EF5385 ± 87 A6250 ± 289 AB
6024.25 ± 4.57 D5.87 ± 0.09 E5498 ± 87 A6100 ± 115 B
7527.25 ± 2.06 D6.48 ± 0.38 DE5592 ± 82 A6500 ± 141 AB
9027.50 ± 0.58 D7.10 ± 0.71 D5558 ± 128 A6375 ± 222 AB
10533.25 ± 2.87 C7.97 ± 0.70 BC5605 ± 110 A6675 ± 189 AB
12036.00 ± 1.83 C8.69 ± 0.18 AB5558 ± 51 A6600 ± 183 AB
13539.75 ± 4.50 B9.10 ± 0.09 A5610 ± 66 A6725 ± 206 A
15044.00 ± 2.83 A9.39 ± 0.09 A5573 ± 152 A6800 ± 141 A
201904.00 ± 1.15 I3.18 ± 0.24 F3175 ± 236 D3900 ± 115 E
1510.00 ± 1.63 H4.05 ± 0.74 E4250 ± 191 C5075 ± 96 D
3015.00 ± 2.94 G4.15 ± 0.66 E4950 ± 100 B5225 ± 330 D
4516.00 ± 3.77 G4.77 ± 0.94 E5533 ± 238 A5800 ± 50 BC
6018.75 ± 3.51 F5.34 ± 0.66 DE5308 ± 216 B5775 ± 100 BC
7524.75 ± 1.89 E5.75 ± 0.96 CD5475 ± 96 A5725 ± 50 BC
9031.25 ± 1.50 D7.35 ± 0.93 B5485 ± 60 A5475 ± 320 BD
10533.00 ± 2.16 CD7.53 ± 0.22 B5300 ± 115 A6225 ± 171 AC
12035.25 ± 1.71 BC8.23 ± 0.26 AB5450 ± 208 A6525 ± 310 AC
13538.75 ± 1.50 B8.55 ± 1.05 A5575 ± 96 A6400 ± 245 A
15043.25 ± 1.50 A8.90 ± 0.81 A5500 ± 141 A6500 ± 377 A
202003.75 ± 0.96 H3.20 ± 0.24 E3000 ± 141 E3325 ± 236 E
1510.50 ± 3.70 G4.35 ± 0.70 D4025 ± 330 D4450 ± 412 D
3013.00 ± 2.58 F4.43 ± 0.81 D4425 ± 386 C5350 ± 443 D
4518.50 ± 3.11 E4.88 ± 0.63 D5275 ± 411 A6175 ± 418 C
6024.75 ± 3.77 D5.38 ± 0.67 CD5475 ± 206 A6425 ± 386 C
7526.00 ± 4.08 D5.88 ± 0.81 C5000 ± 141 B5975 ± 314 C
9032.75 ± 2.06 C7.50 ± 0.71 B5475 ± 222 A6350 ± 243 A
10534.00 ± 1.41 C7.83 ± 0.17 B5450 ± 208 A6825 ± 126 A
12038.00 ± 3.56 B8.33 ± 0.41 AB5425 ± 310 A6250 ± 289 B
13541.25 ± 3.40 AB8.60 ± 1.43 AB5575 ± 96 A6825 ± 356 A
15042.25 ± 8.58 A8.95 ± 0.74 A5575 ± 386 A6850 ± 243 A
Means denoted by different letters indicate significant difference according to Duncan’s test at p < 0.05.
Table 4. Results of the statistical analysis of the obtained data.
Source of Variancep-Value (Significance Level)
Soil Olsen PP in PlantGrain YieldStraw YieldPUEDPS
Year*********
P rate************
PUE = Phosphorus use efficiency, DPS = Degree of phosphorus saturation. * = p < 0.05, ** = p < 0.01, and ns = non-significant differences (p ≥ 0.05).
Table 5. Critical P values in soil (SOP) and plant tissue (PiP) calculated for grain (RGY) and straw (RSY) yields and degree of phosphorus saturation (DPS) fitted by the linear–linear (LL) and exponential models (Exp) under the four growing seasons (n = 176). R2 correlates X (critical P value) and Y (relative yield). Critical P values are in mg kg−1 for soil and g kg−1 in plant.
ModelParameters FormulasR2Critical P Value
LLSOP—RGY y = 0.009 X + 0.710 0.8421.11
SOP—RSY y = 0.007 X + 0.720 0.7625.71
PiP—RGY y = 0.041 X + 0.637 0.716.40
PiP—RSY y = 0.042 X + 0.591 0.697.36
SOP—DPS D P S = 0.823 X + 1.0396 0.8629.11
sExpSOP—RGY y = 0.7327 e 8.213 × 10 3 x 0.5925.04
SOP—RSY y = 0.694 e 8.213 × 10 3 x 0.5731.60
PiP—RGY y = 0.6818 e 4.315 × 10 2 x 0.626.45
PiP—RSY y = 0.638 e 4.592 × 10 2 x 0.607.49
SOP—DPS D P S = 16.312 e 11.859 × 10 3 x 0.7336.00
Publisher’s Note: MDPI stays neutral with regard to jurisdictional claims in published maps and institutional affiliations.

