
Economic Feasibility of Agrivoltaic Systems in Food-Energy Nexus Context: Modelling and a Case Study in Niger


 ,
, 
Abstract
:1. Introduction
2. Study Frame
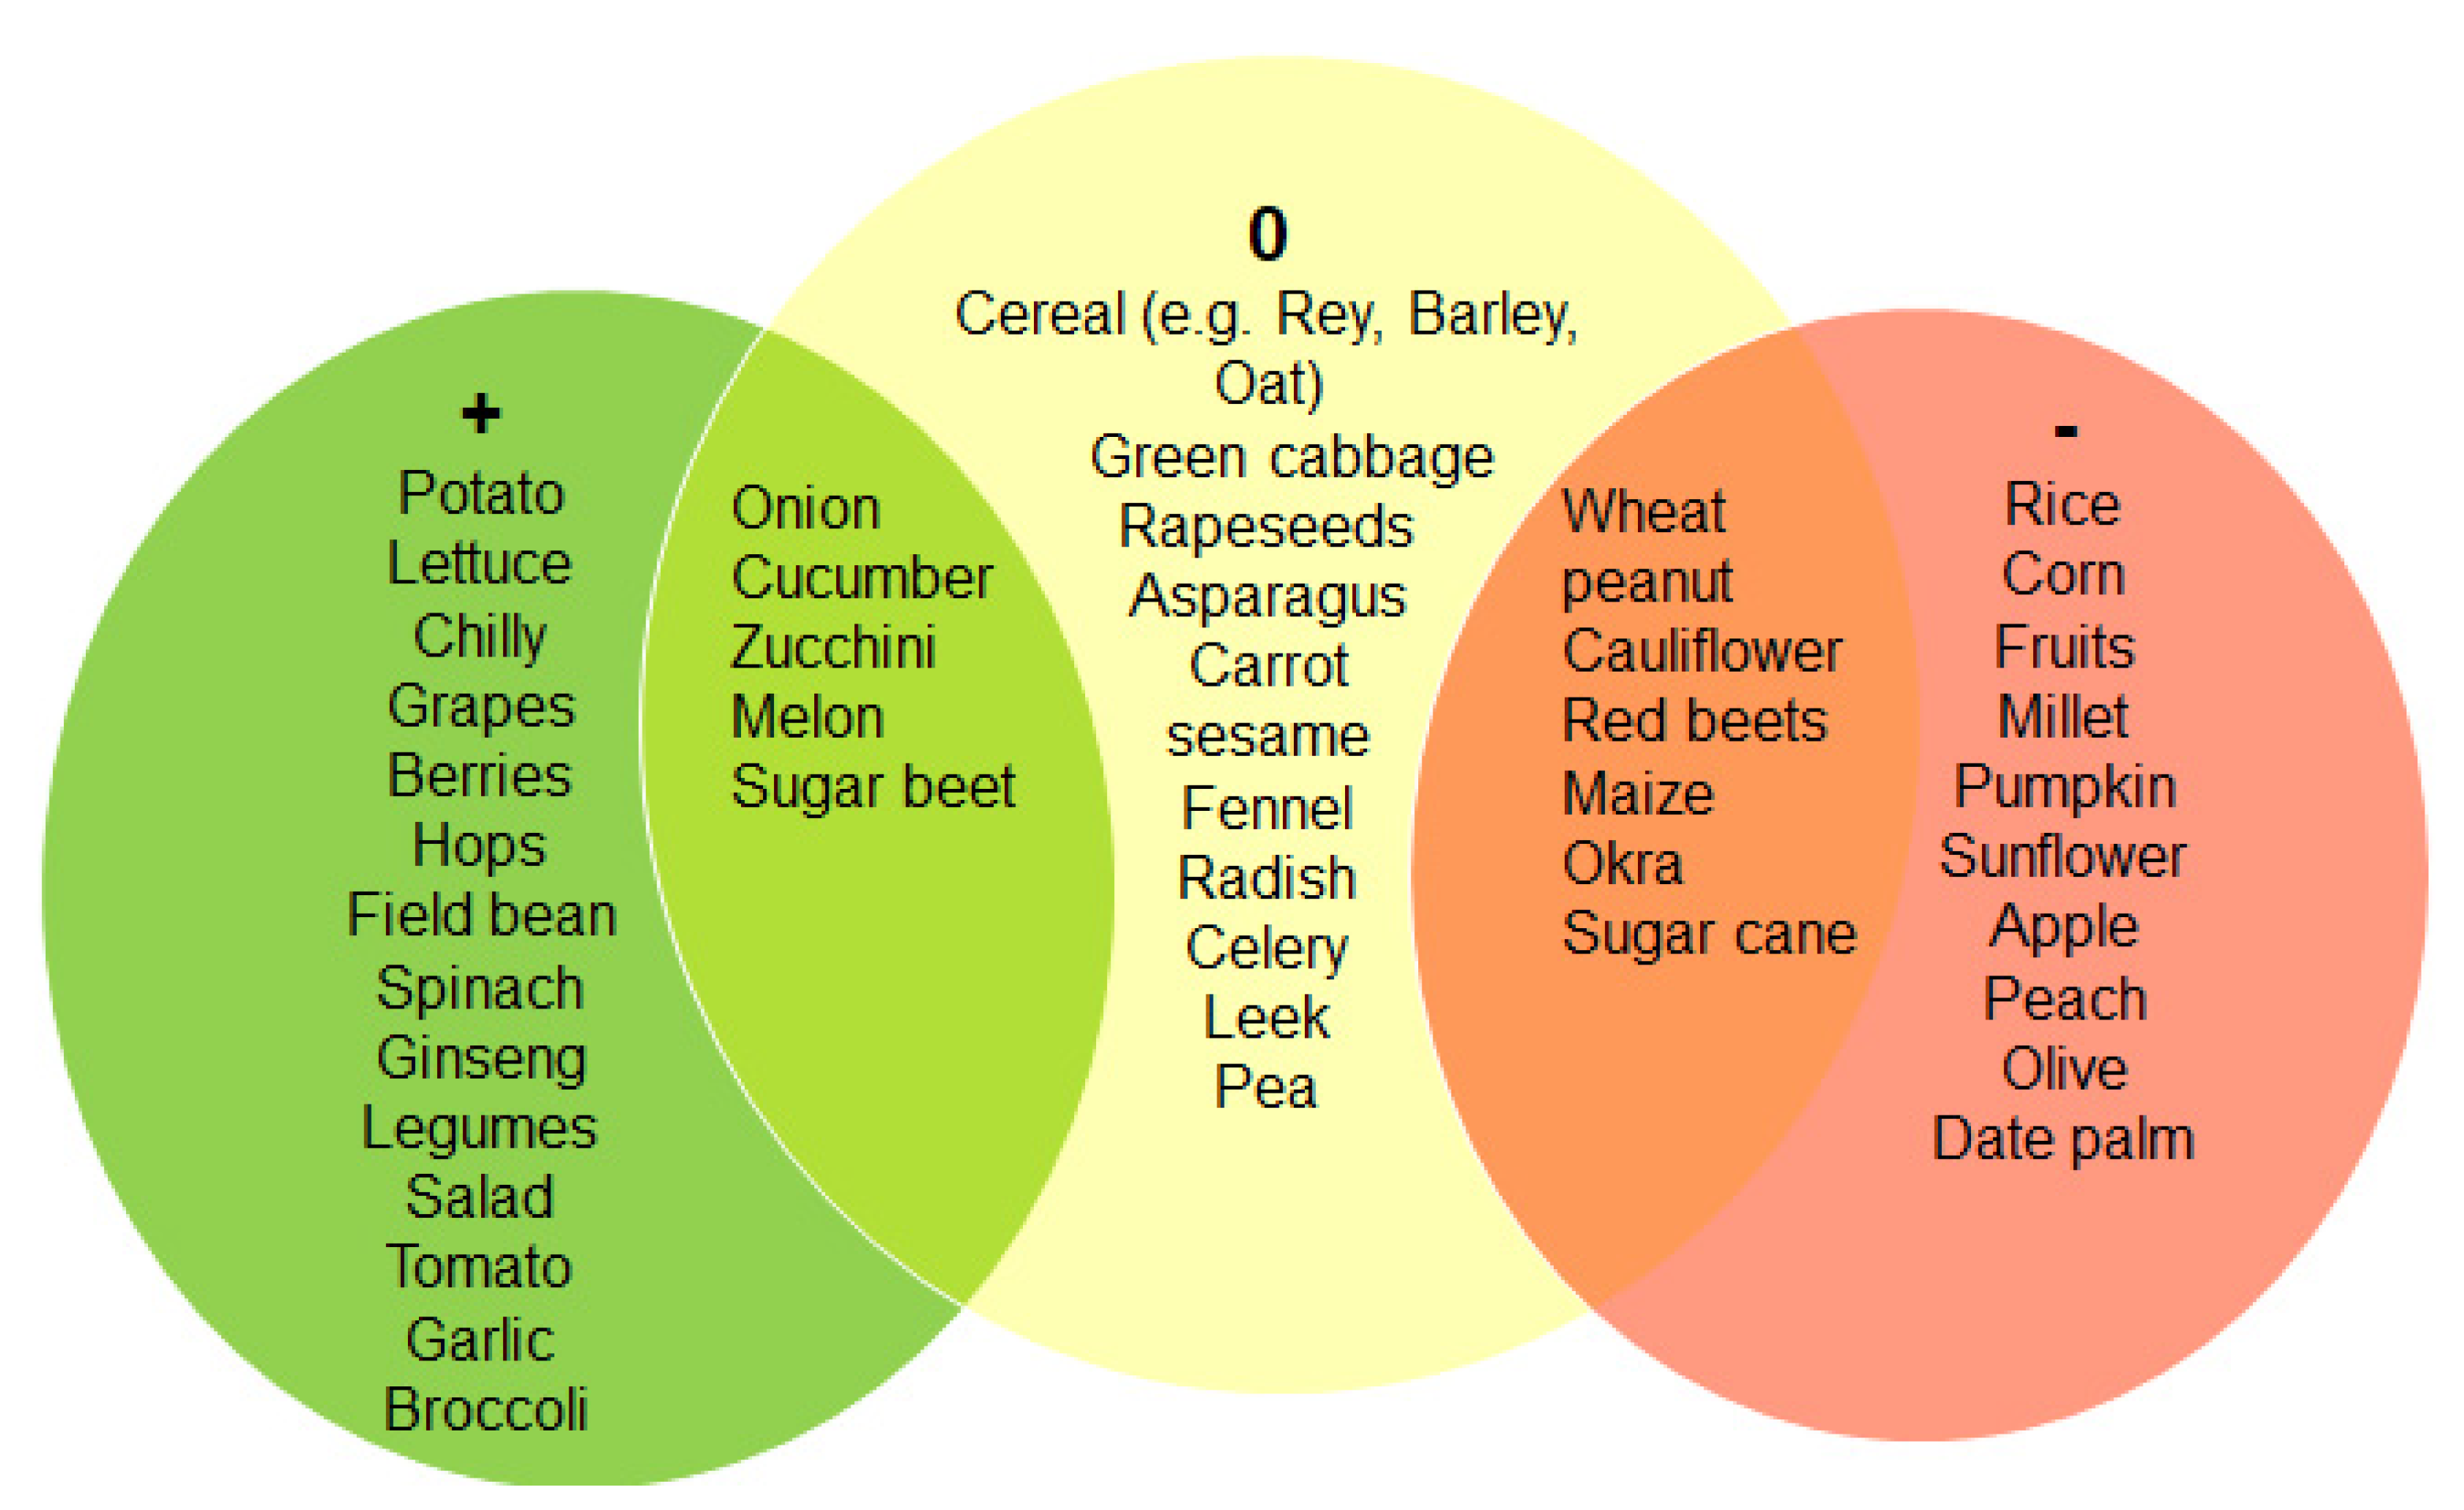
2.1. Agrivoltaic (APV) Systems
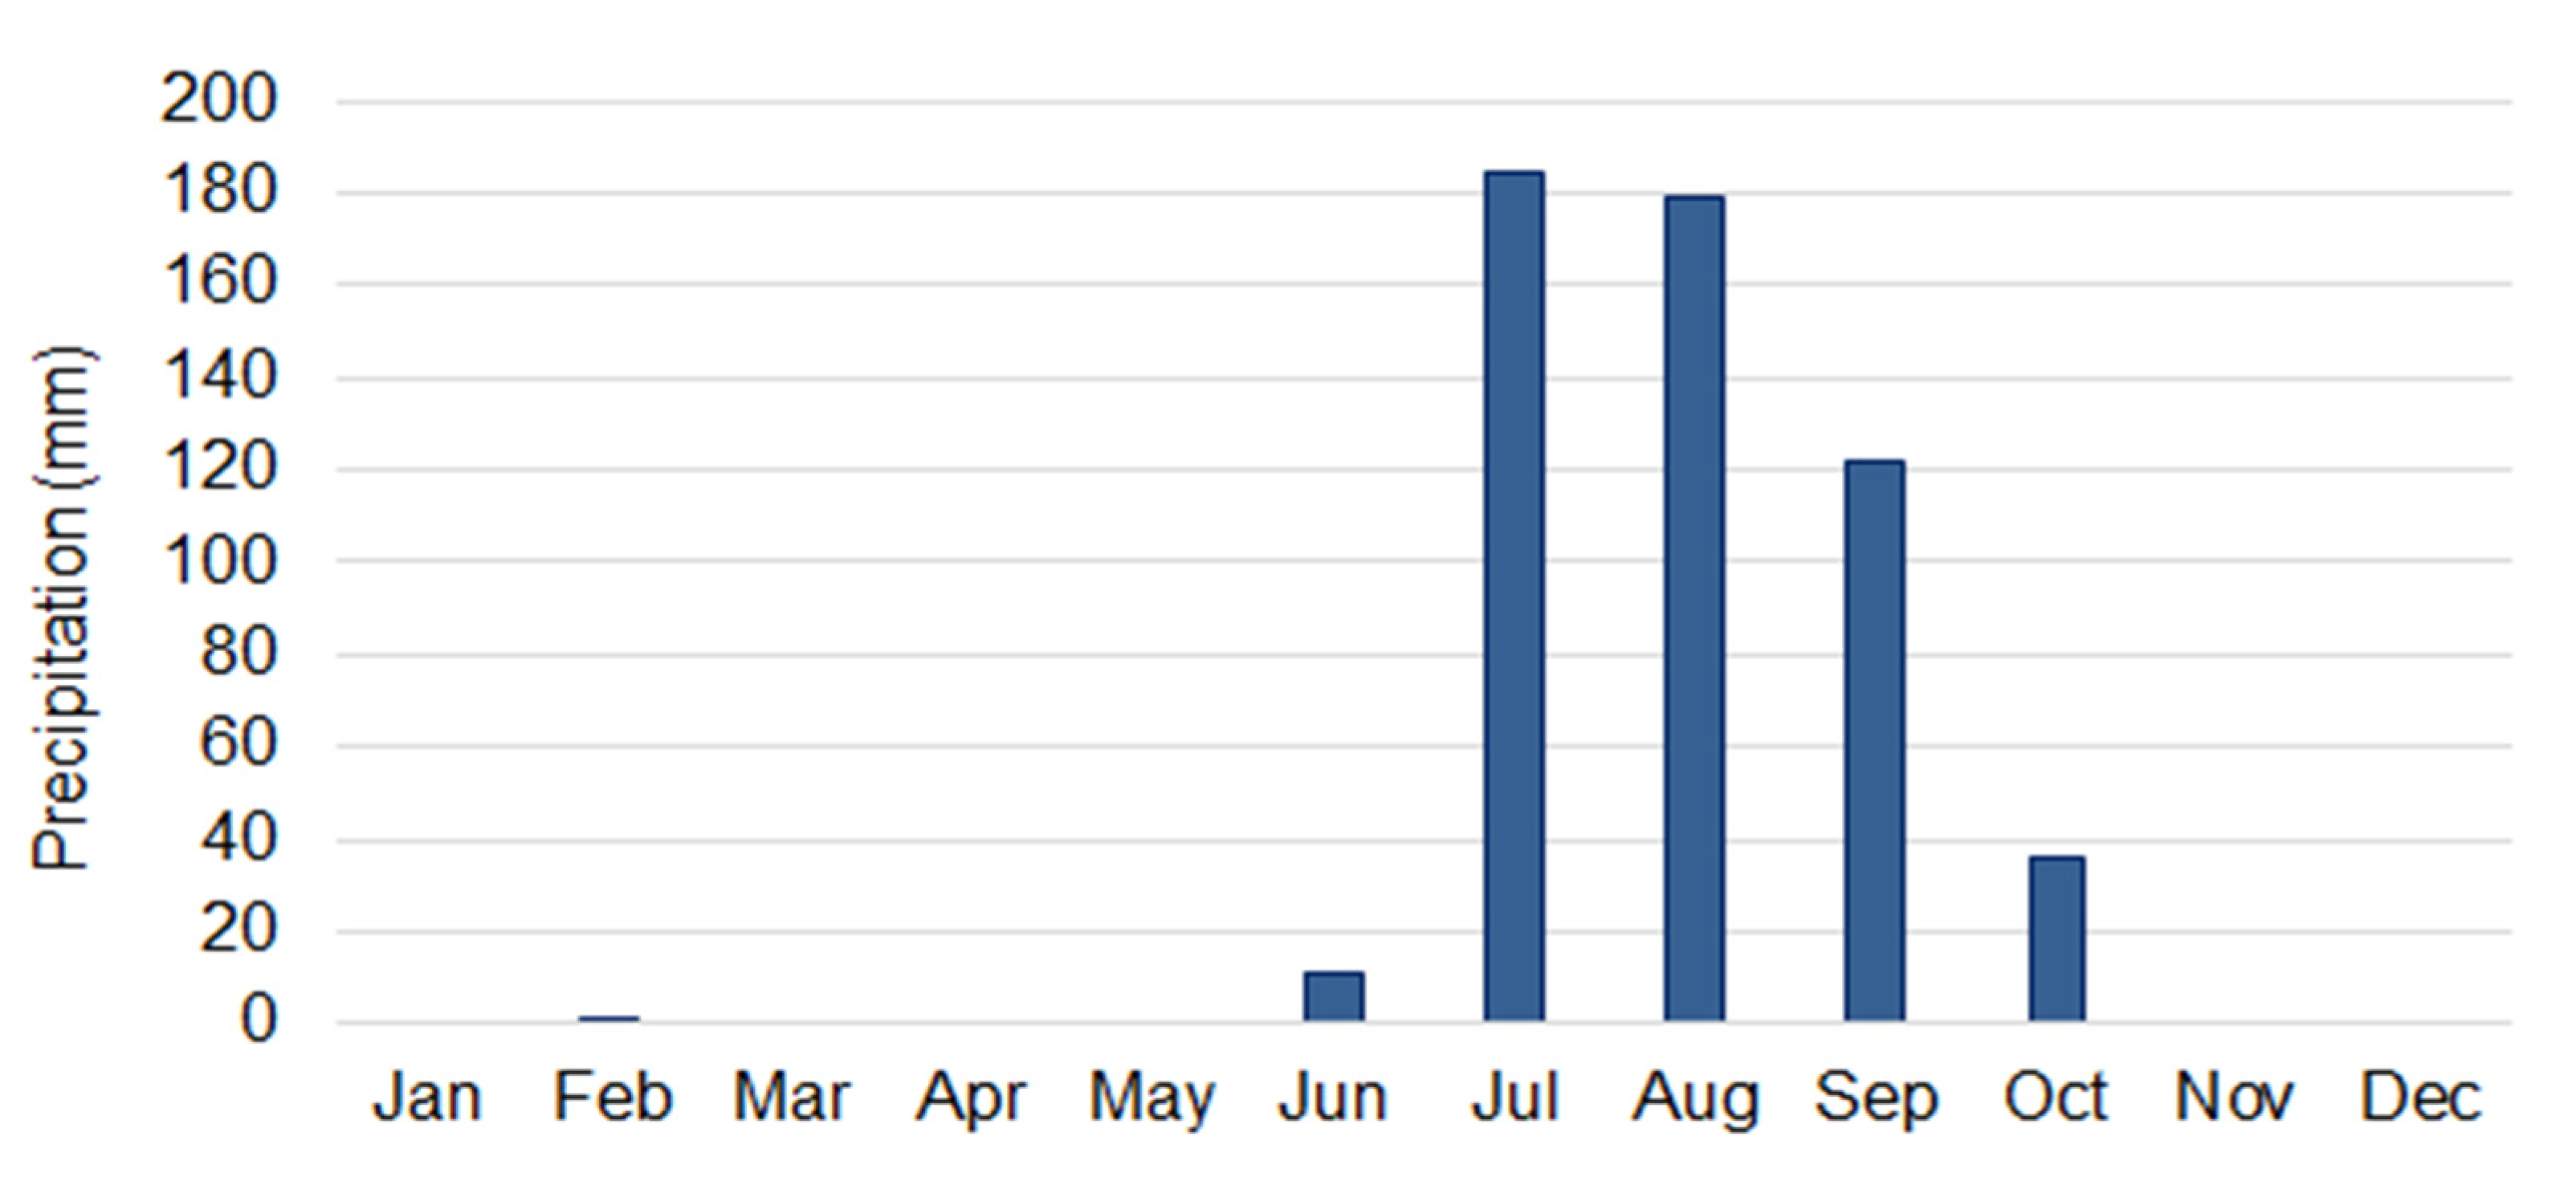
2.2. Niger—Country Profile
3. Materials and Methods
3.1. Data Collection
3.2. Crop Yield and Energy Production Combined
3.3. Indicators for Farming Side
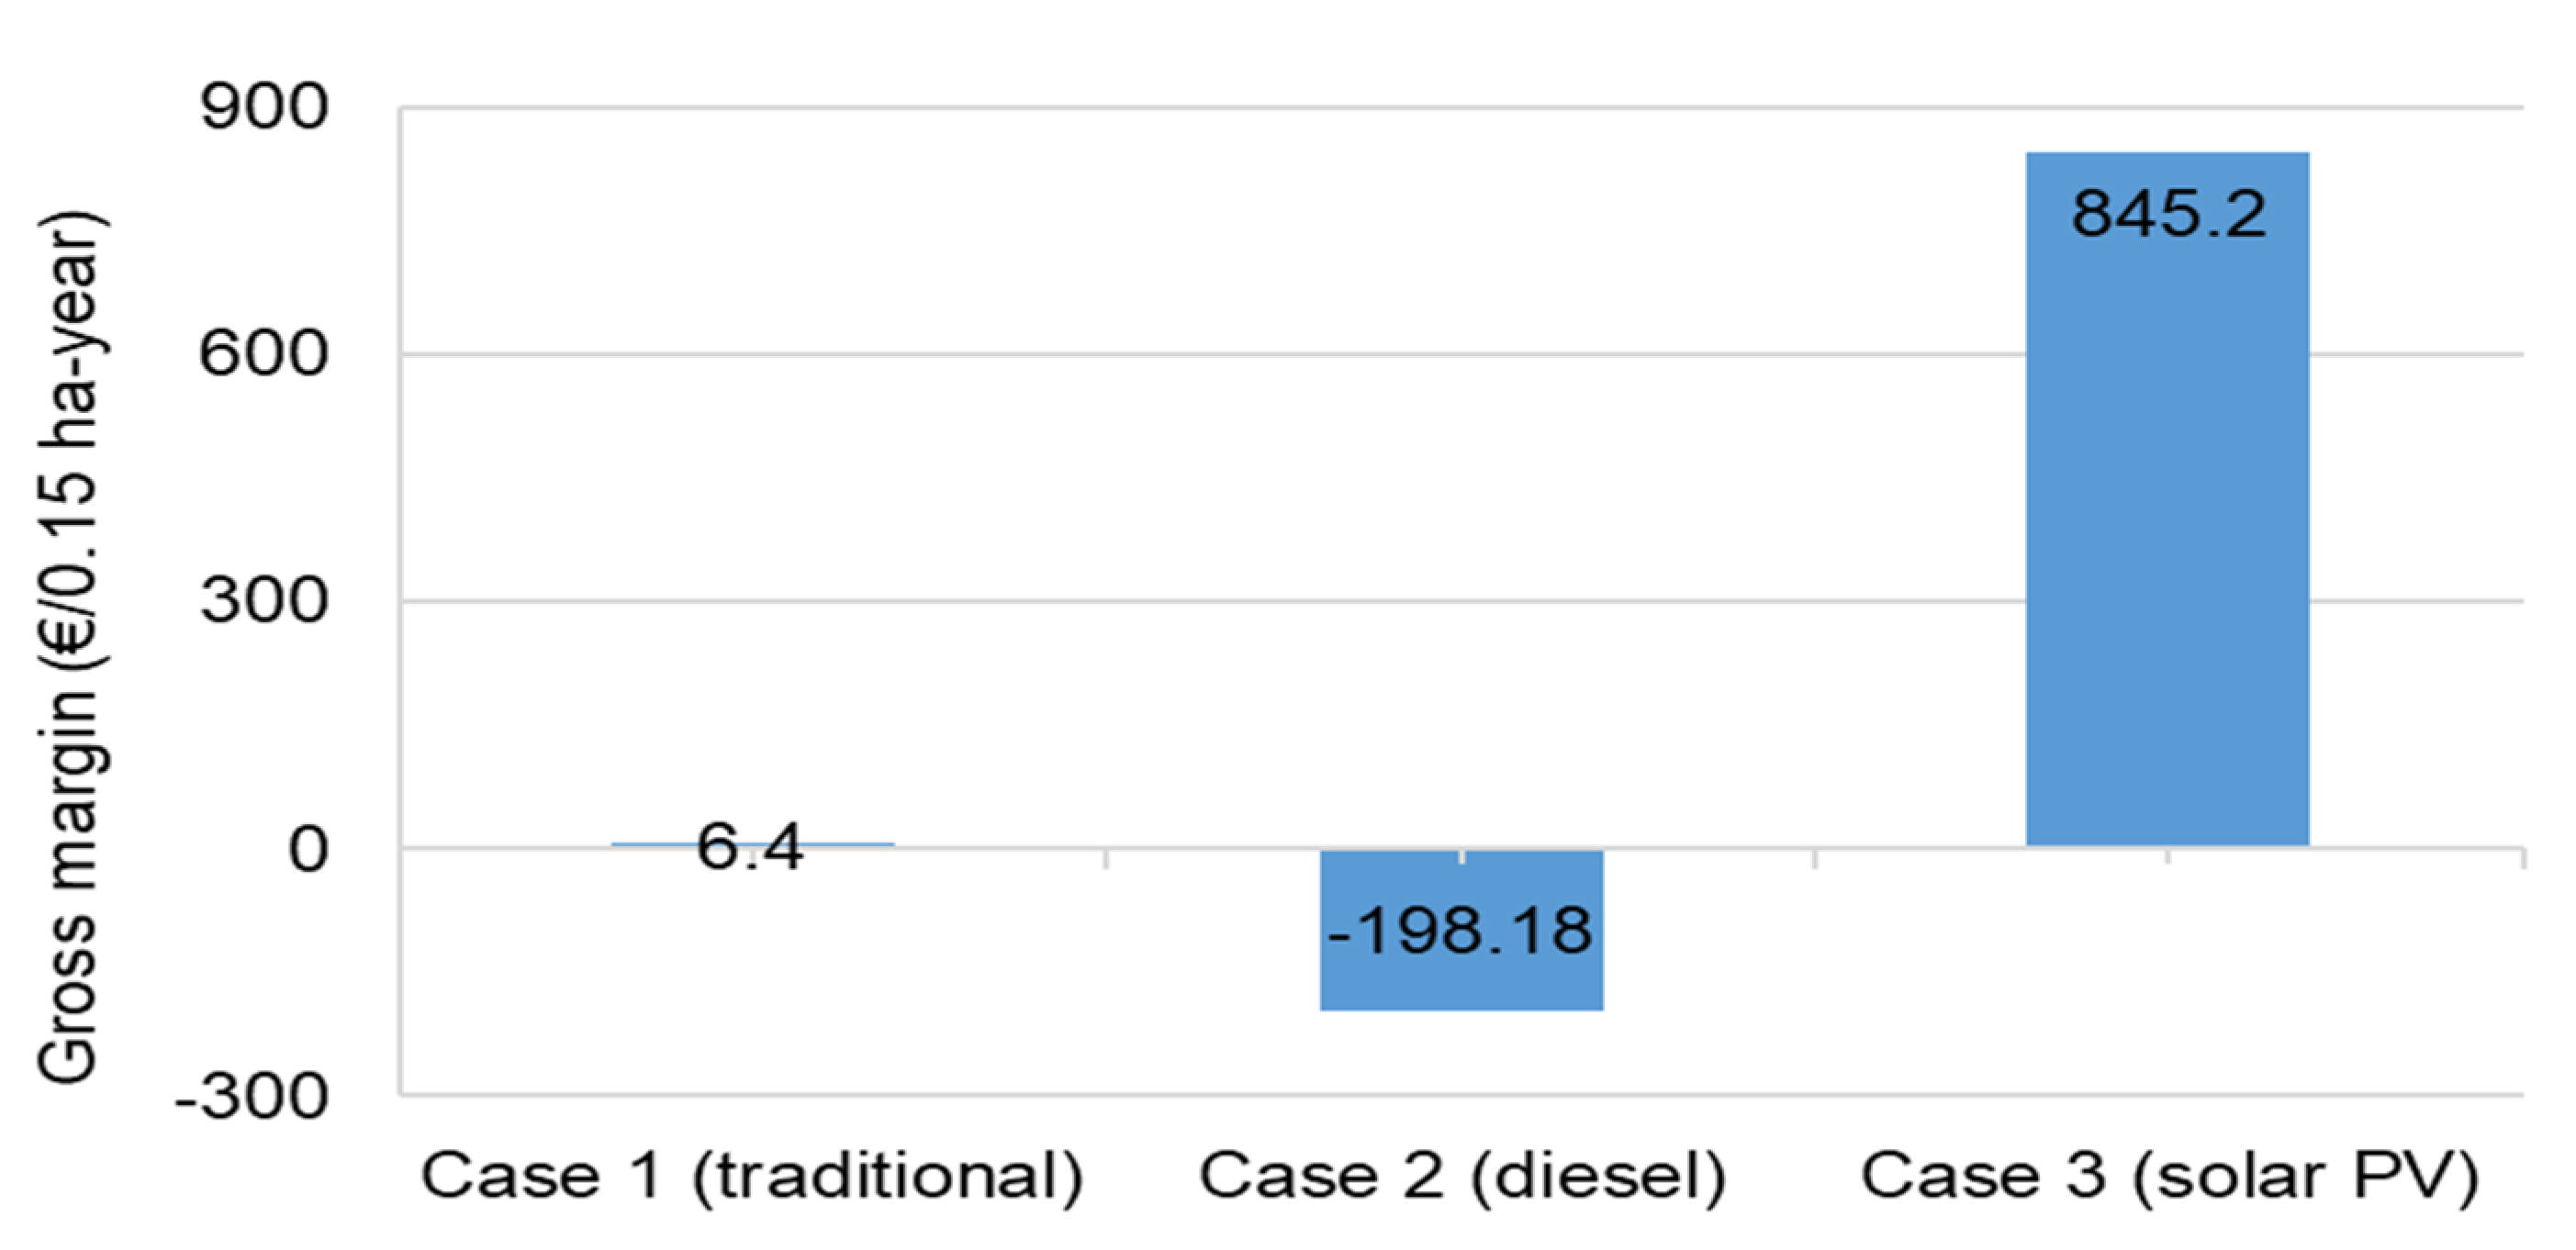
3.3.1. Gross Margin
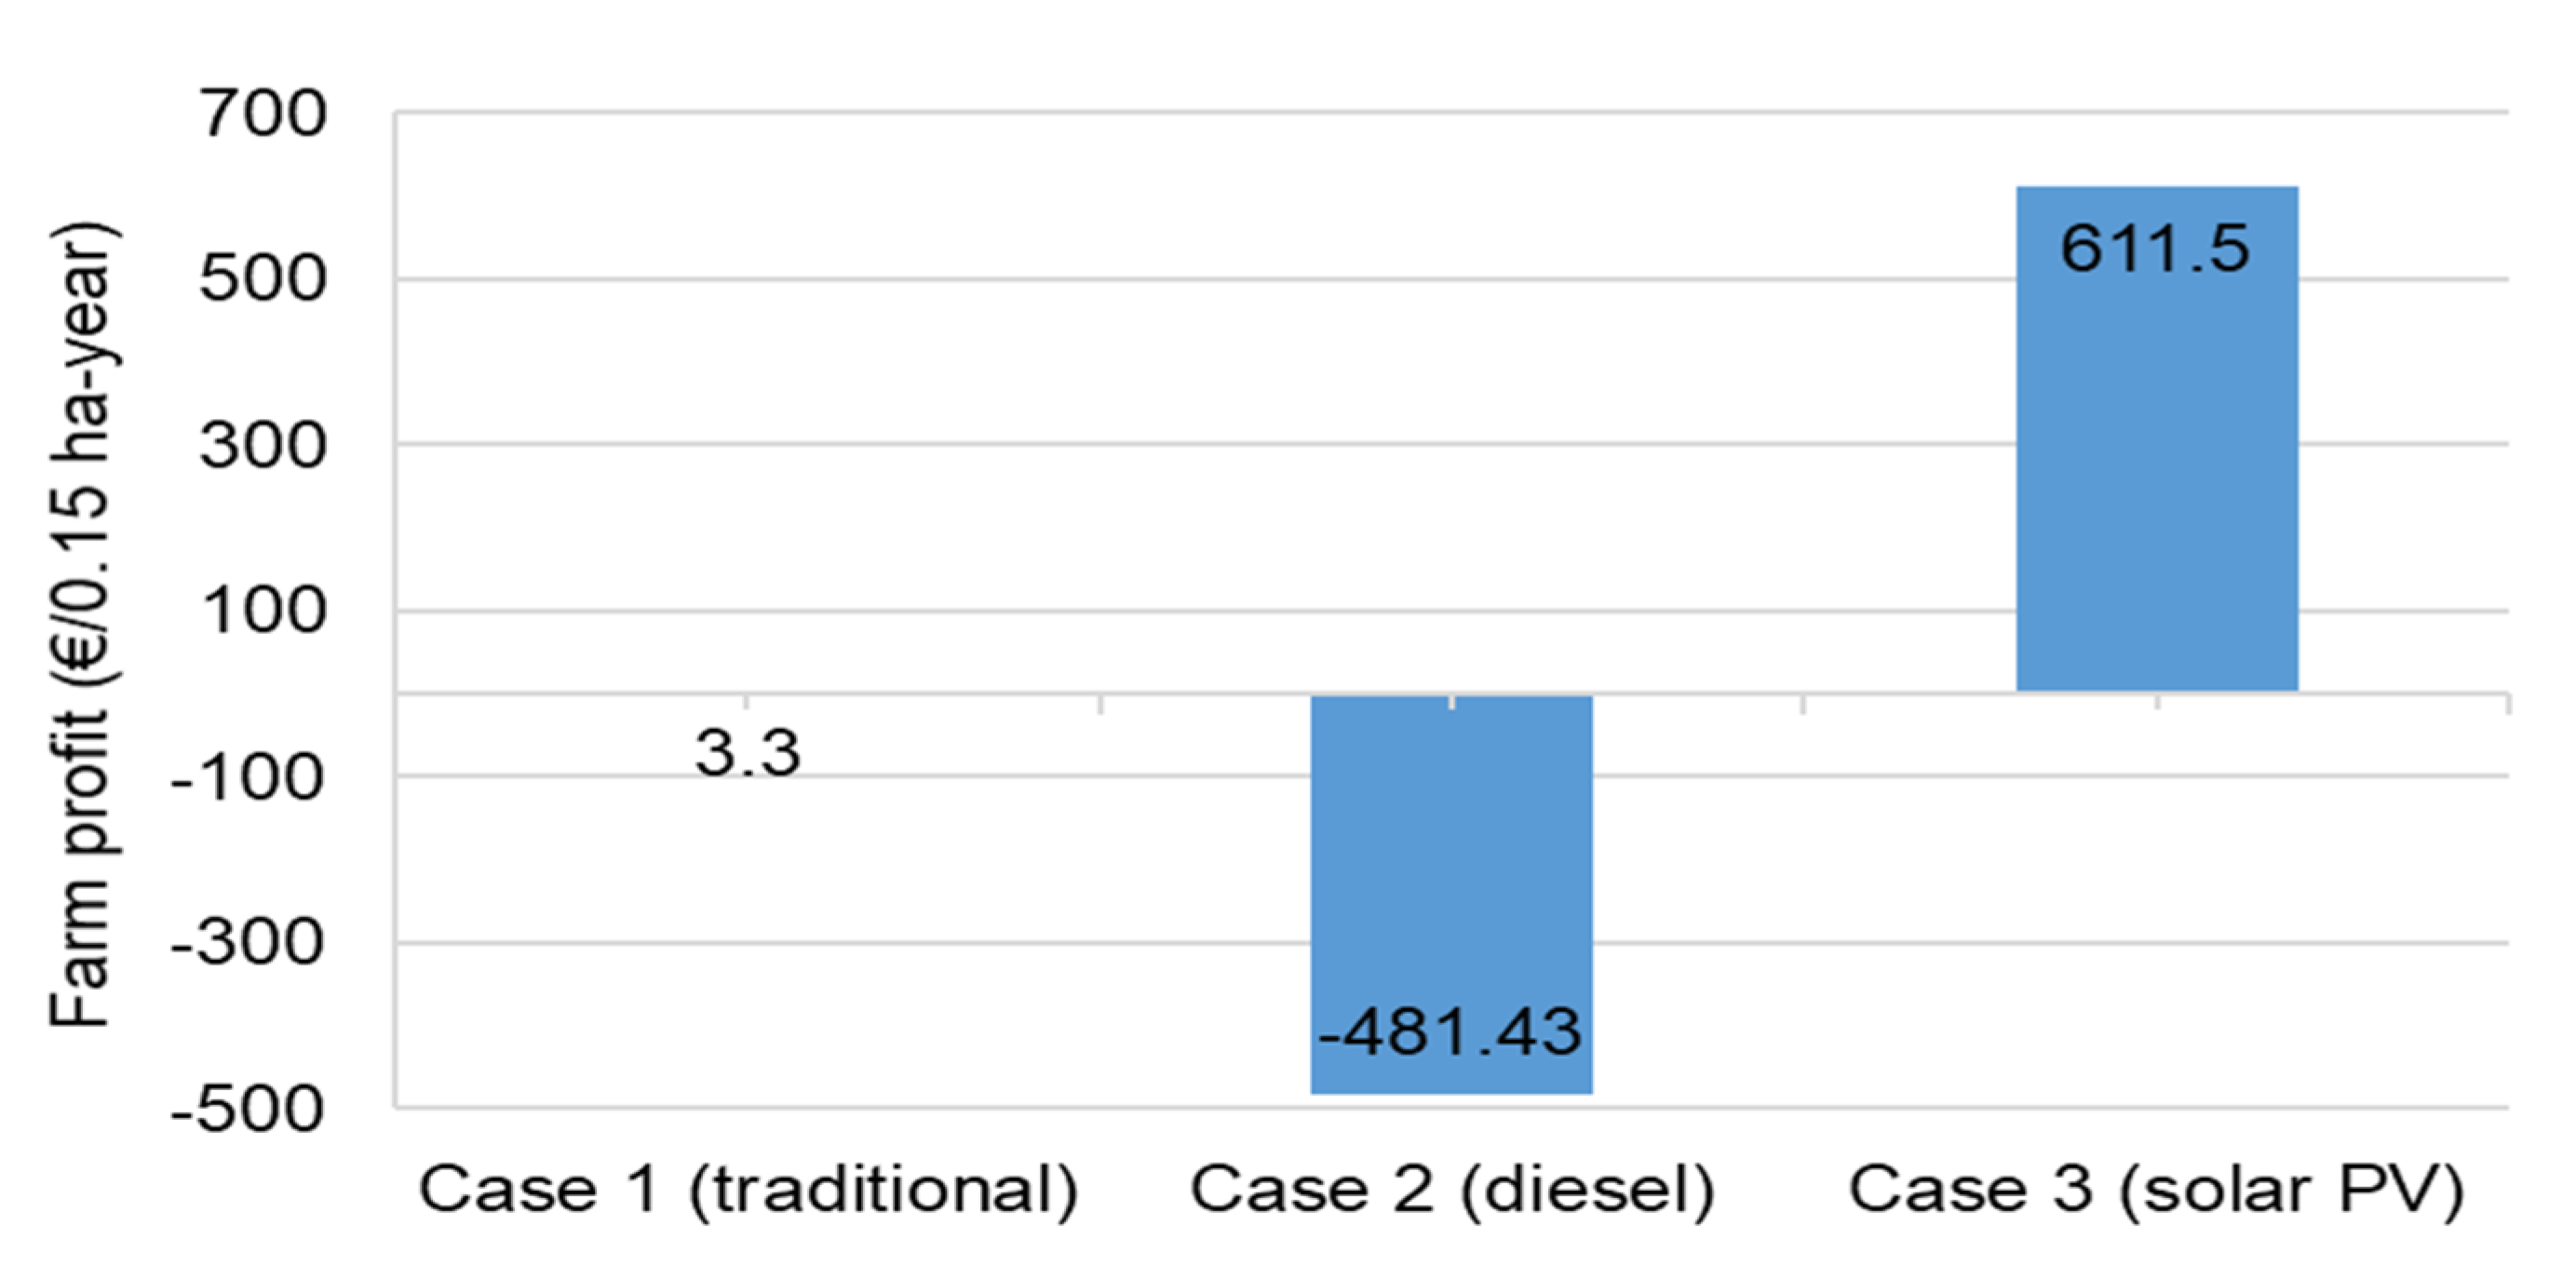
3.3.2. Farm Profit
3.3.3. Benefit-Cost Ratio (B/C Ratio)
3.4. Economic Indicators for APV Side
- d Discount rate (%)
- NPV Net present value (€)
- R Revenue (€)
- C Costs (€)
- n Numbers of years (0..to..N)
- CI Total initial costs for PV and APV structure in year 0 (€)
- COM Annual operation and maintenance (OM) cost (€)
- N Project lifetime, years
- dg Energy yield degradation rate (0.5% per year)
- Ppeak Installed solar capacity at APV plant (50 kW)
- Q Performance ratio (value of only 60% is considered, decentralized grid)
- ISTC Constant value (solar irradiance at standard test condition, i.e., 1 kW/m2)
- G Solar radiation falling on solar panels at the project site (kWh/m2.year)
3.5. Diesel Pumping System
- P Hydraulic power required for pumping (W)
- ρ Density of water (1000 kg/m3)
- g Acceleration due to gravity (9.81 m/s2)
- Q Flow rate of the pump (0.001 m3/s, assumed to be operated for about 3 h a day, available water for irrigation in a day will be about 7.2 L/m2)
- Tdh Total dynamic head (m)
- η Efficiency of the pump
3.6. Field Survey and Cases under Analysis
3.6.1. Case 1: Traditional Farming, Rain Fed Irrigation
3.6.2. Case 2: Irrigated Farming, Diesel Pump
3.6.3. Case 3: Irrigated Farming, Solar Pump
3.6.4. Case 4: APV for Irrigation and Electricity Supply
4. Results and Discussions
4.1. Cost Calculation
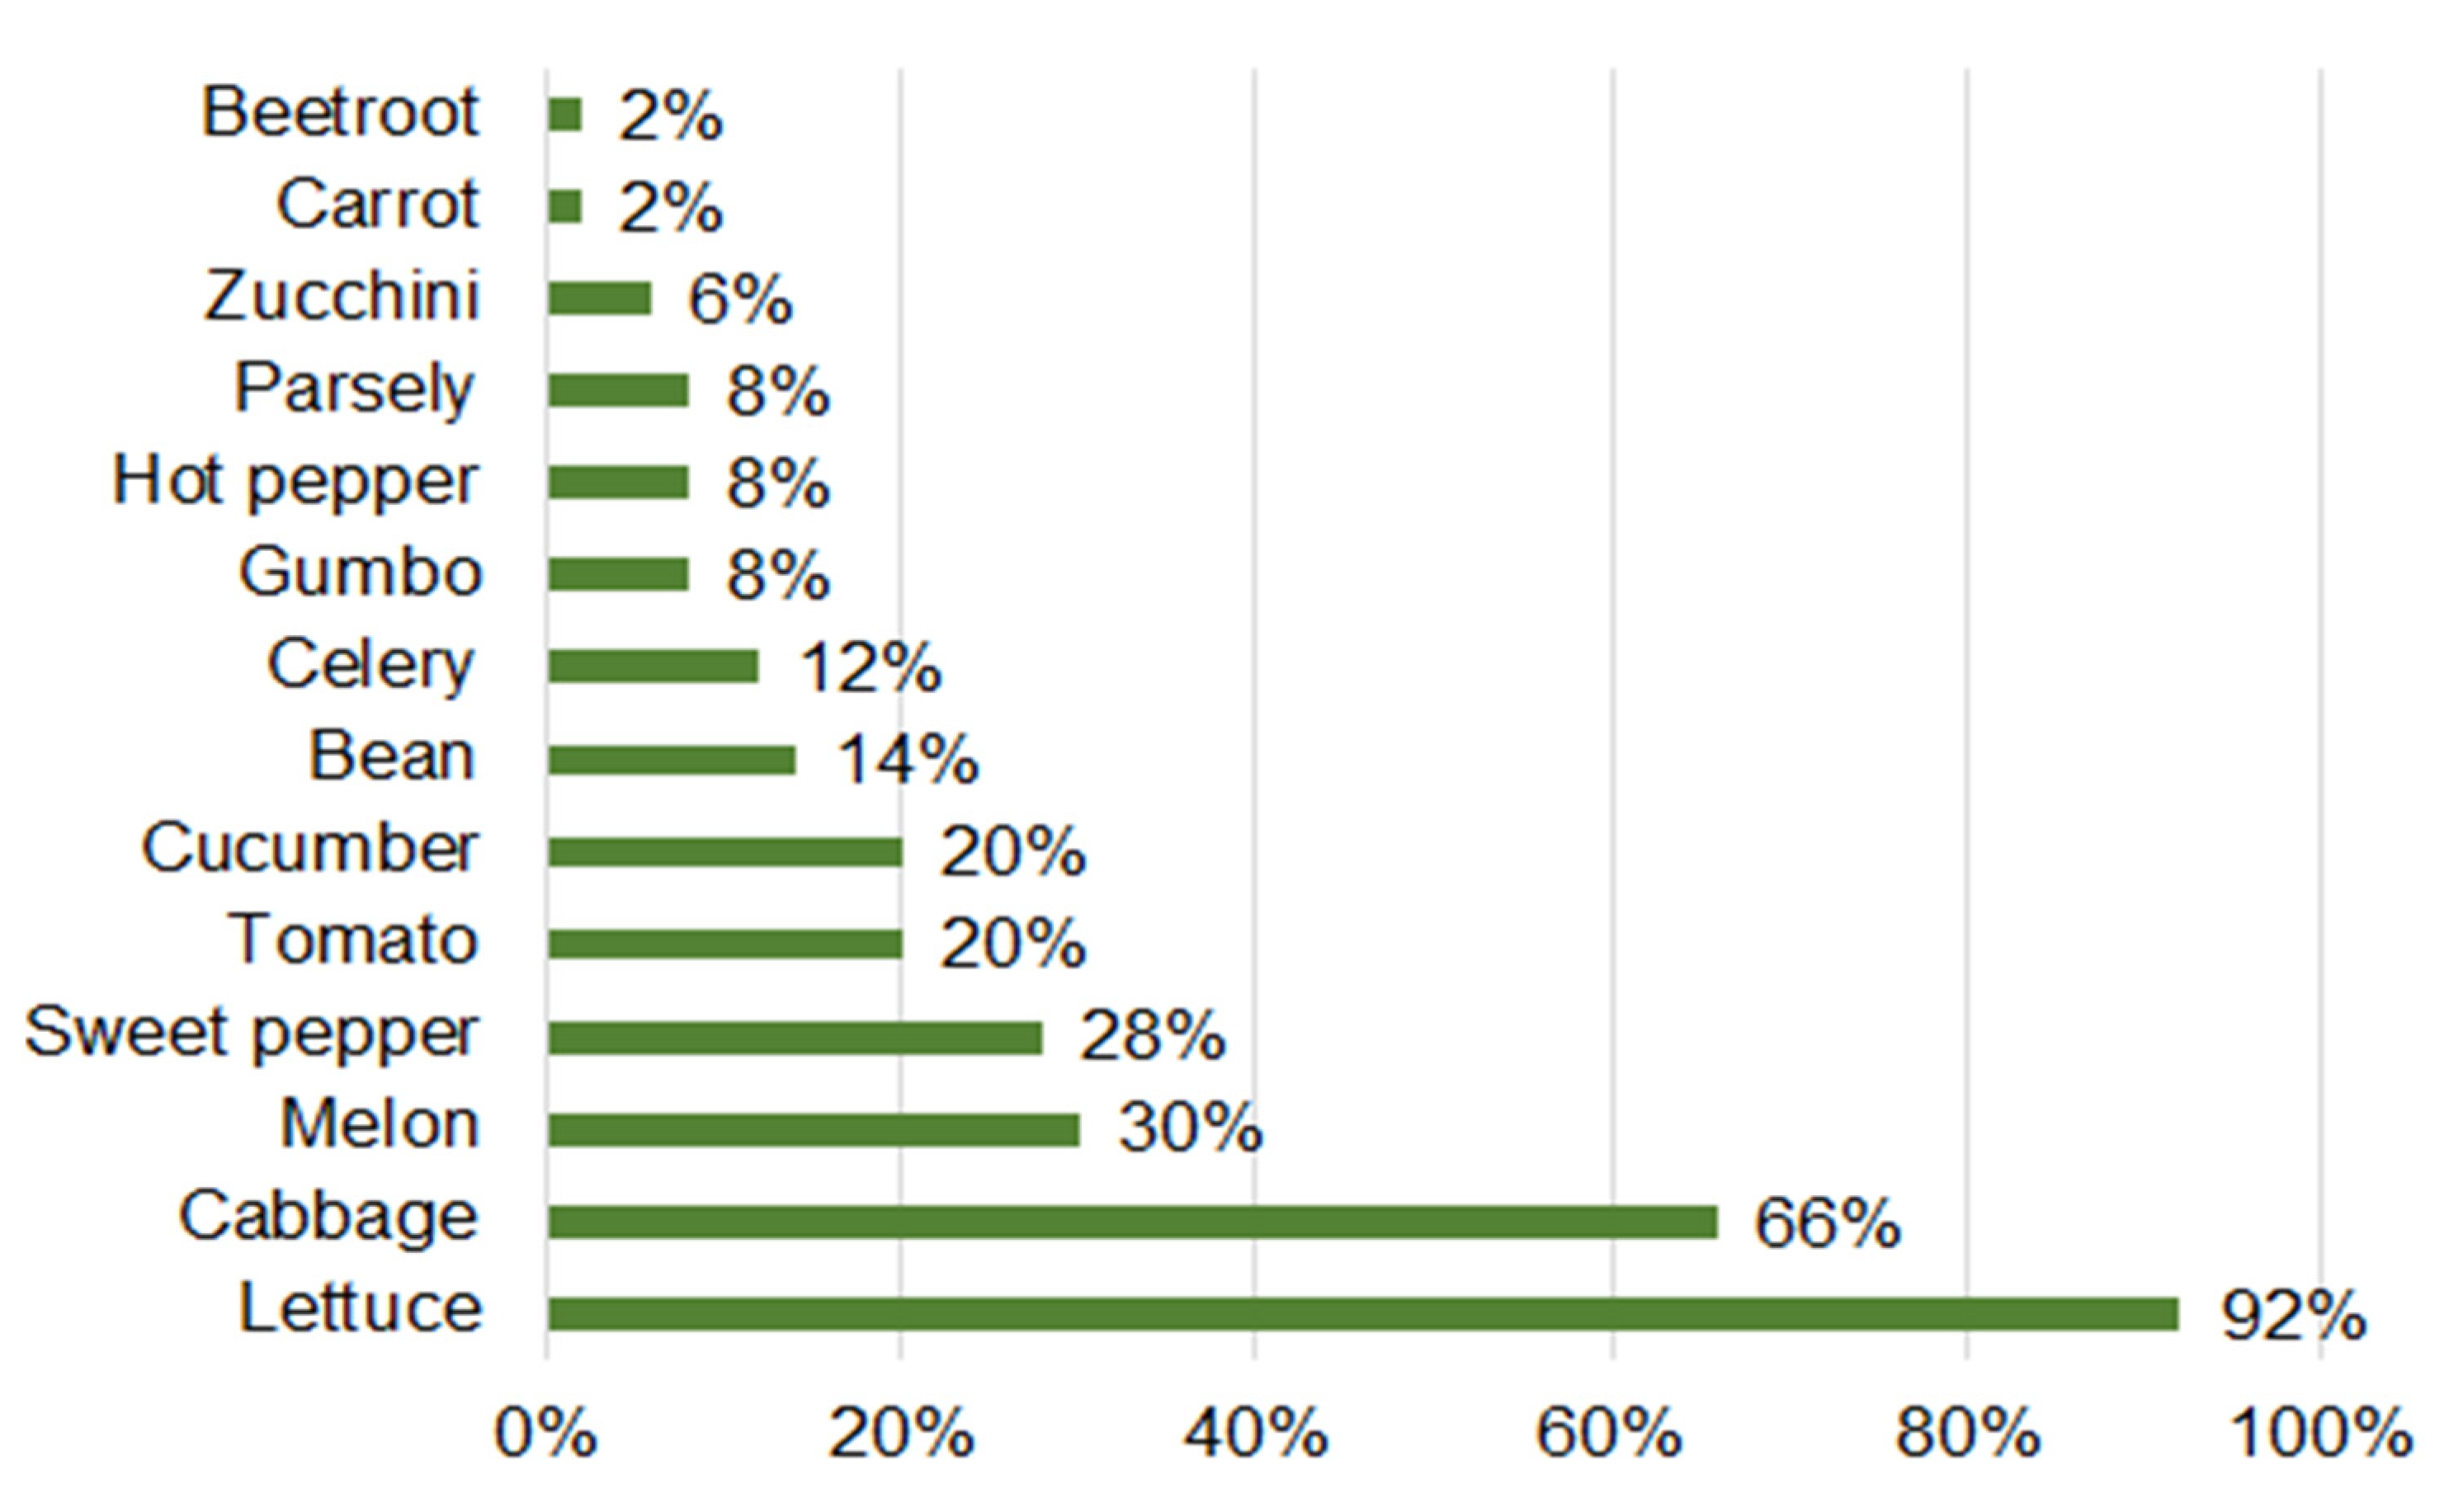
4.2. Revenue Calculation
- Salad: 3000 to 15000 CFA/plot (3.81 to 22.87 €/plot)
- Cabbage: 2500 to 3500 CFA/plot (3.81 to 5.34 €/plot)
- Tomato: 3000 to 6000 CFA/plot (4.57 to 9.15 €/plot)
- Mint: 4000 to 12000 CFA/plot (6.10 to 18.29 €/plot)
- Okra: 3000 to 5000 CFA/plot (4.57 to 7.62 €/plot)
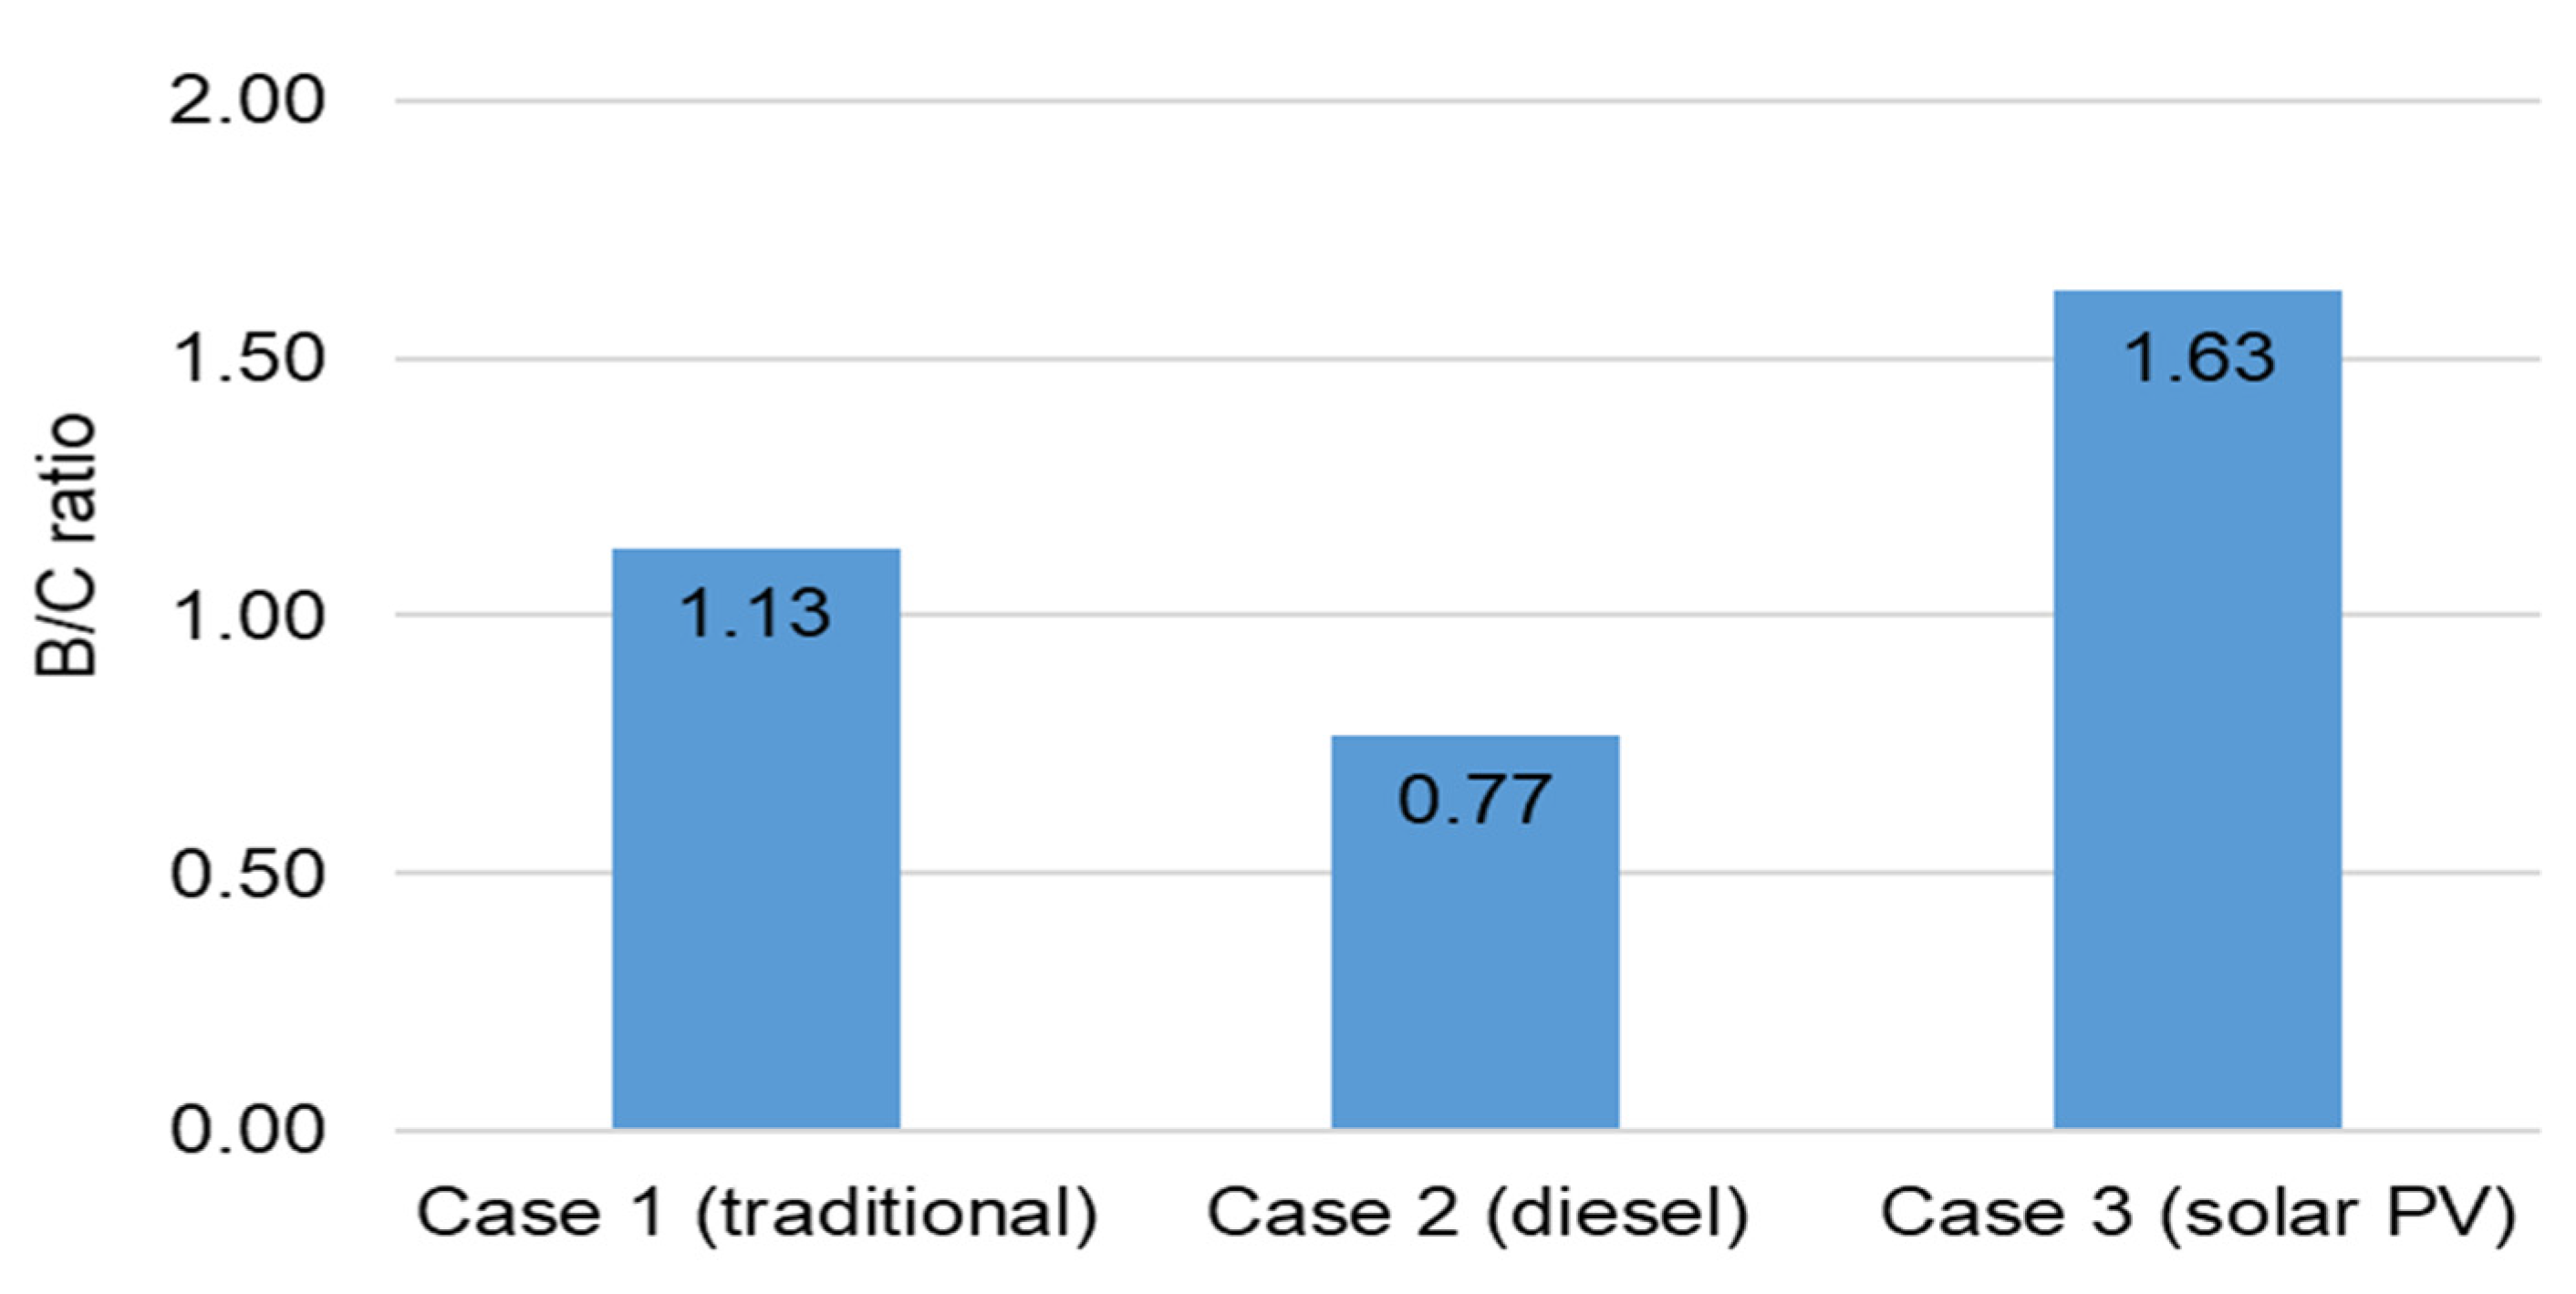
4.3. Financial Indicators for Cases 1–3
4.4. Case of Agrivoltaic (APV)
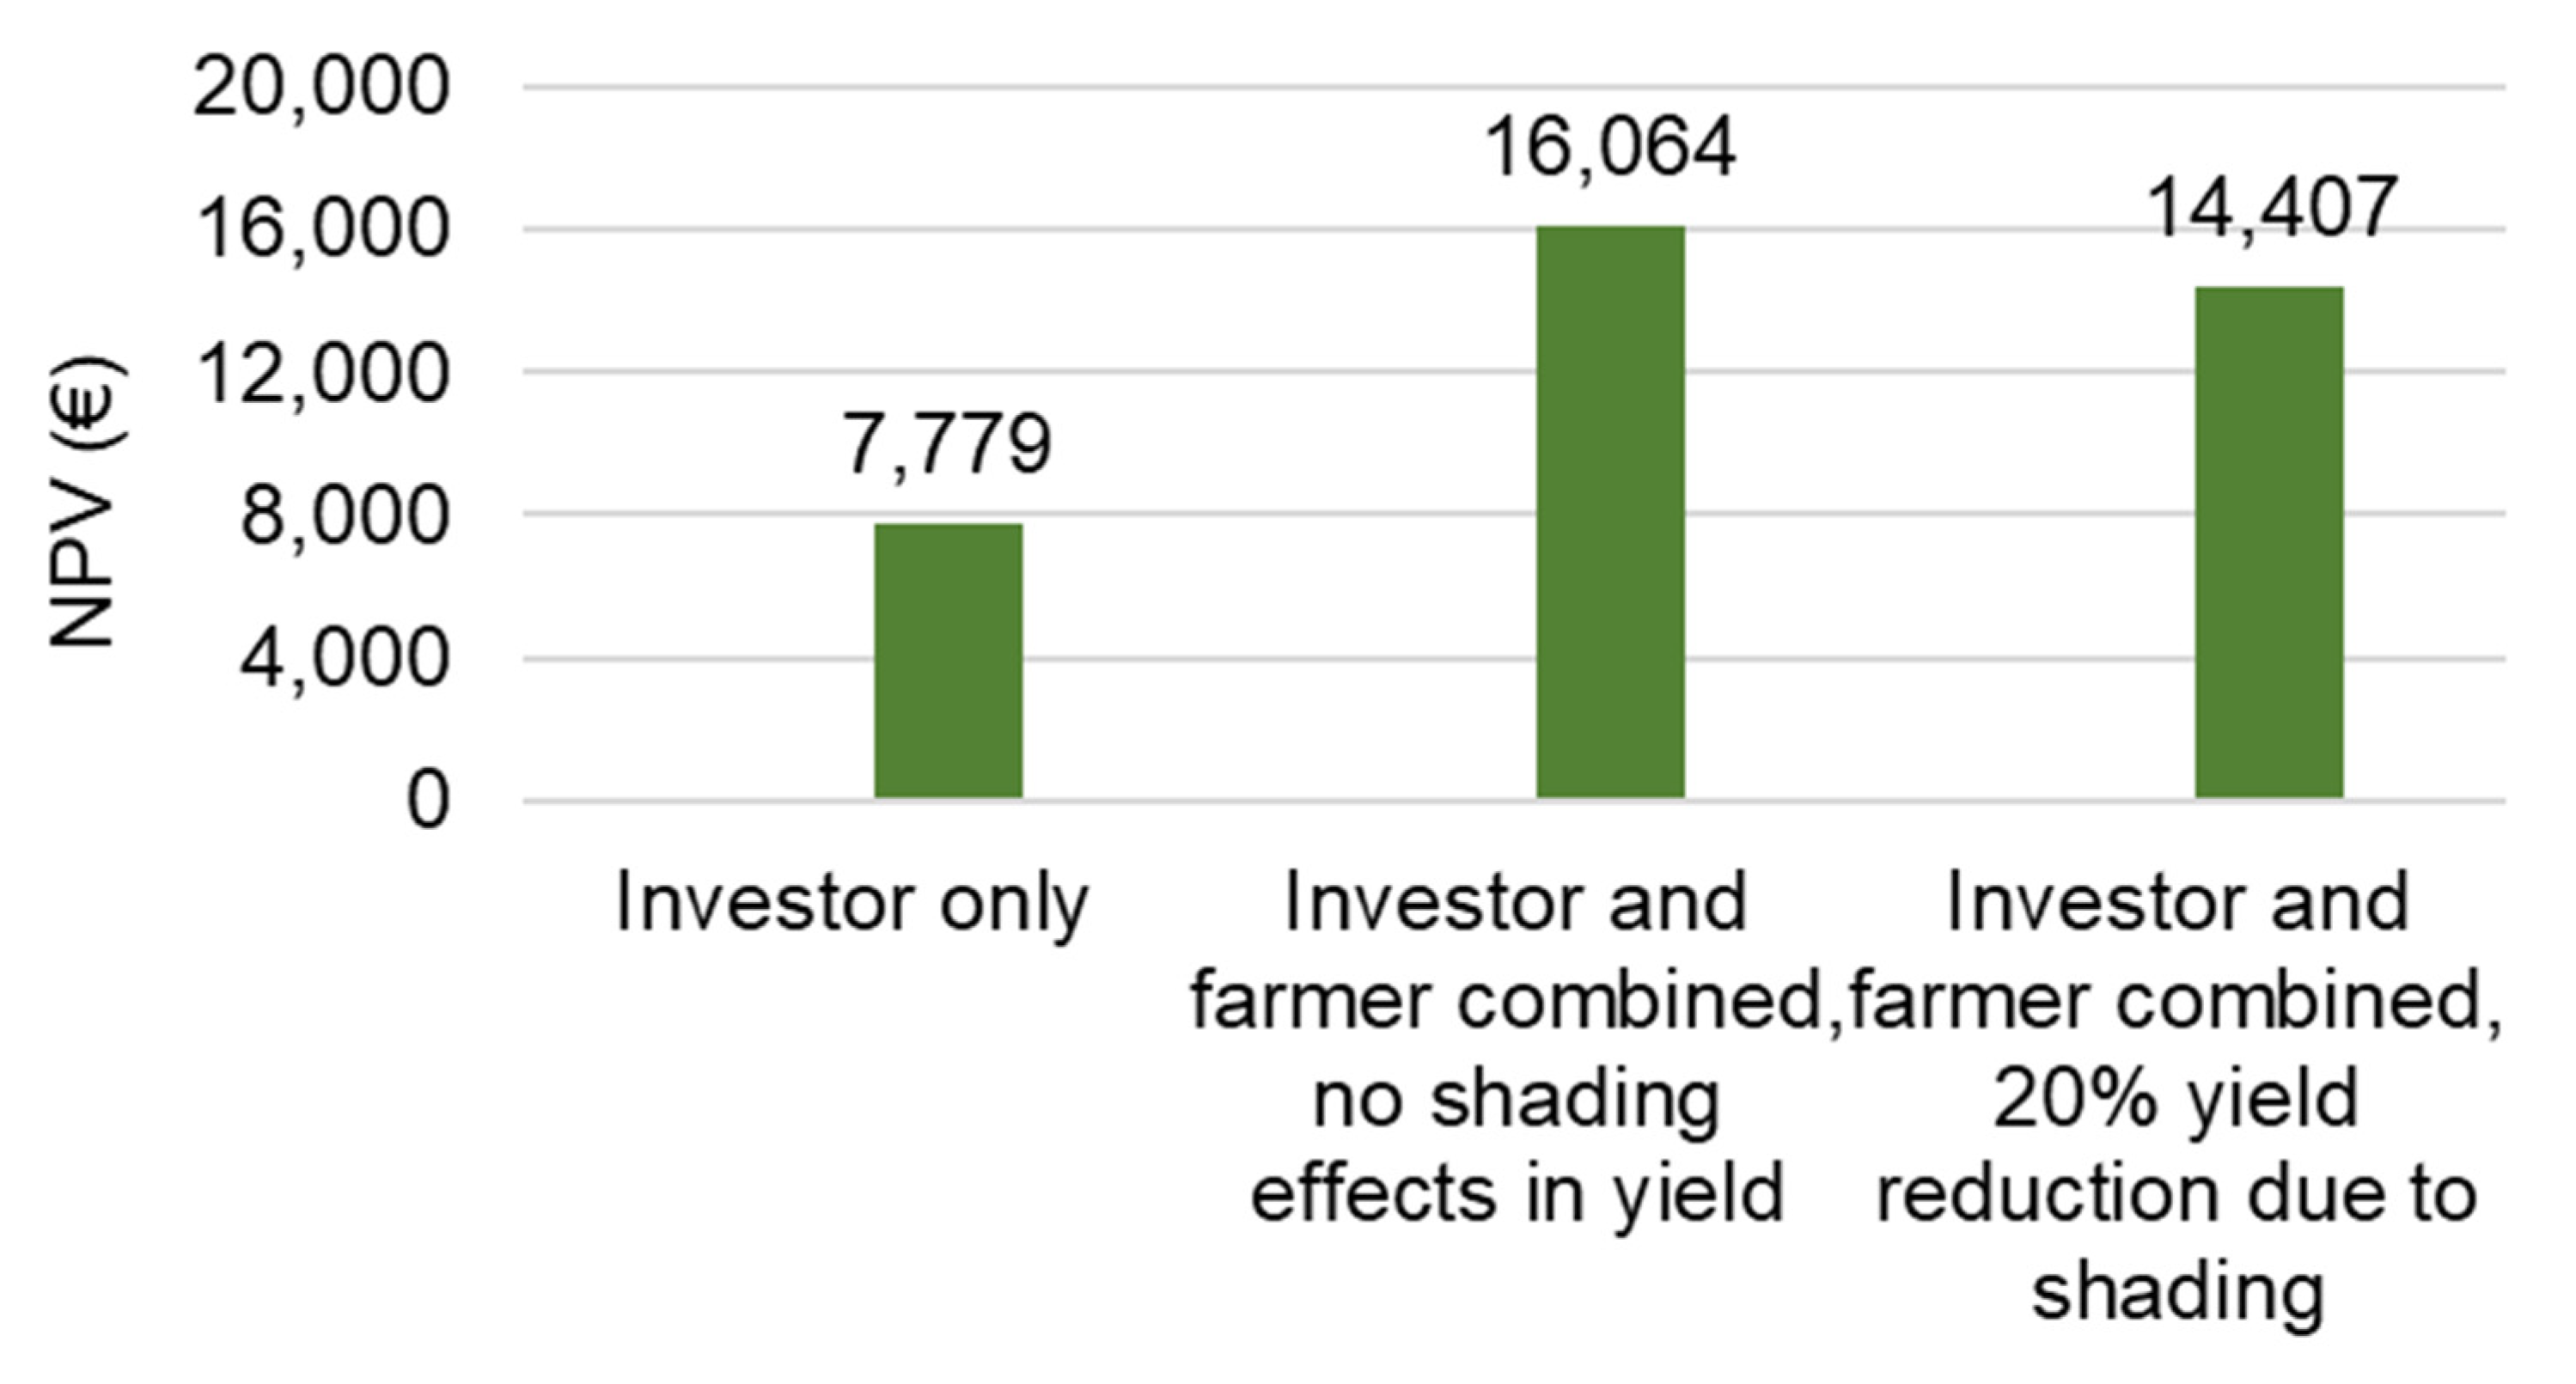
4.4.1. Scenario 1, Benefits to Investor
4.4.2. Scenario 2, Overall Benefits (Combined of Both Farmer and Investor)
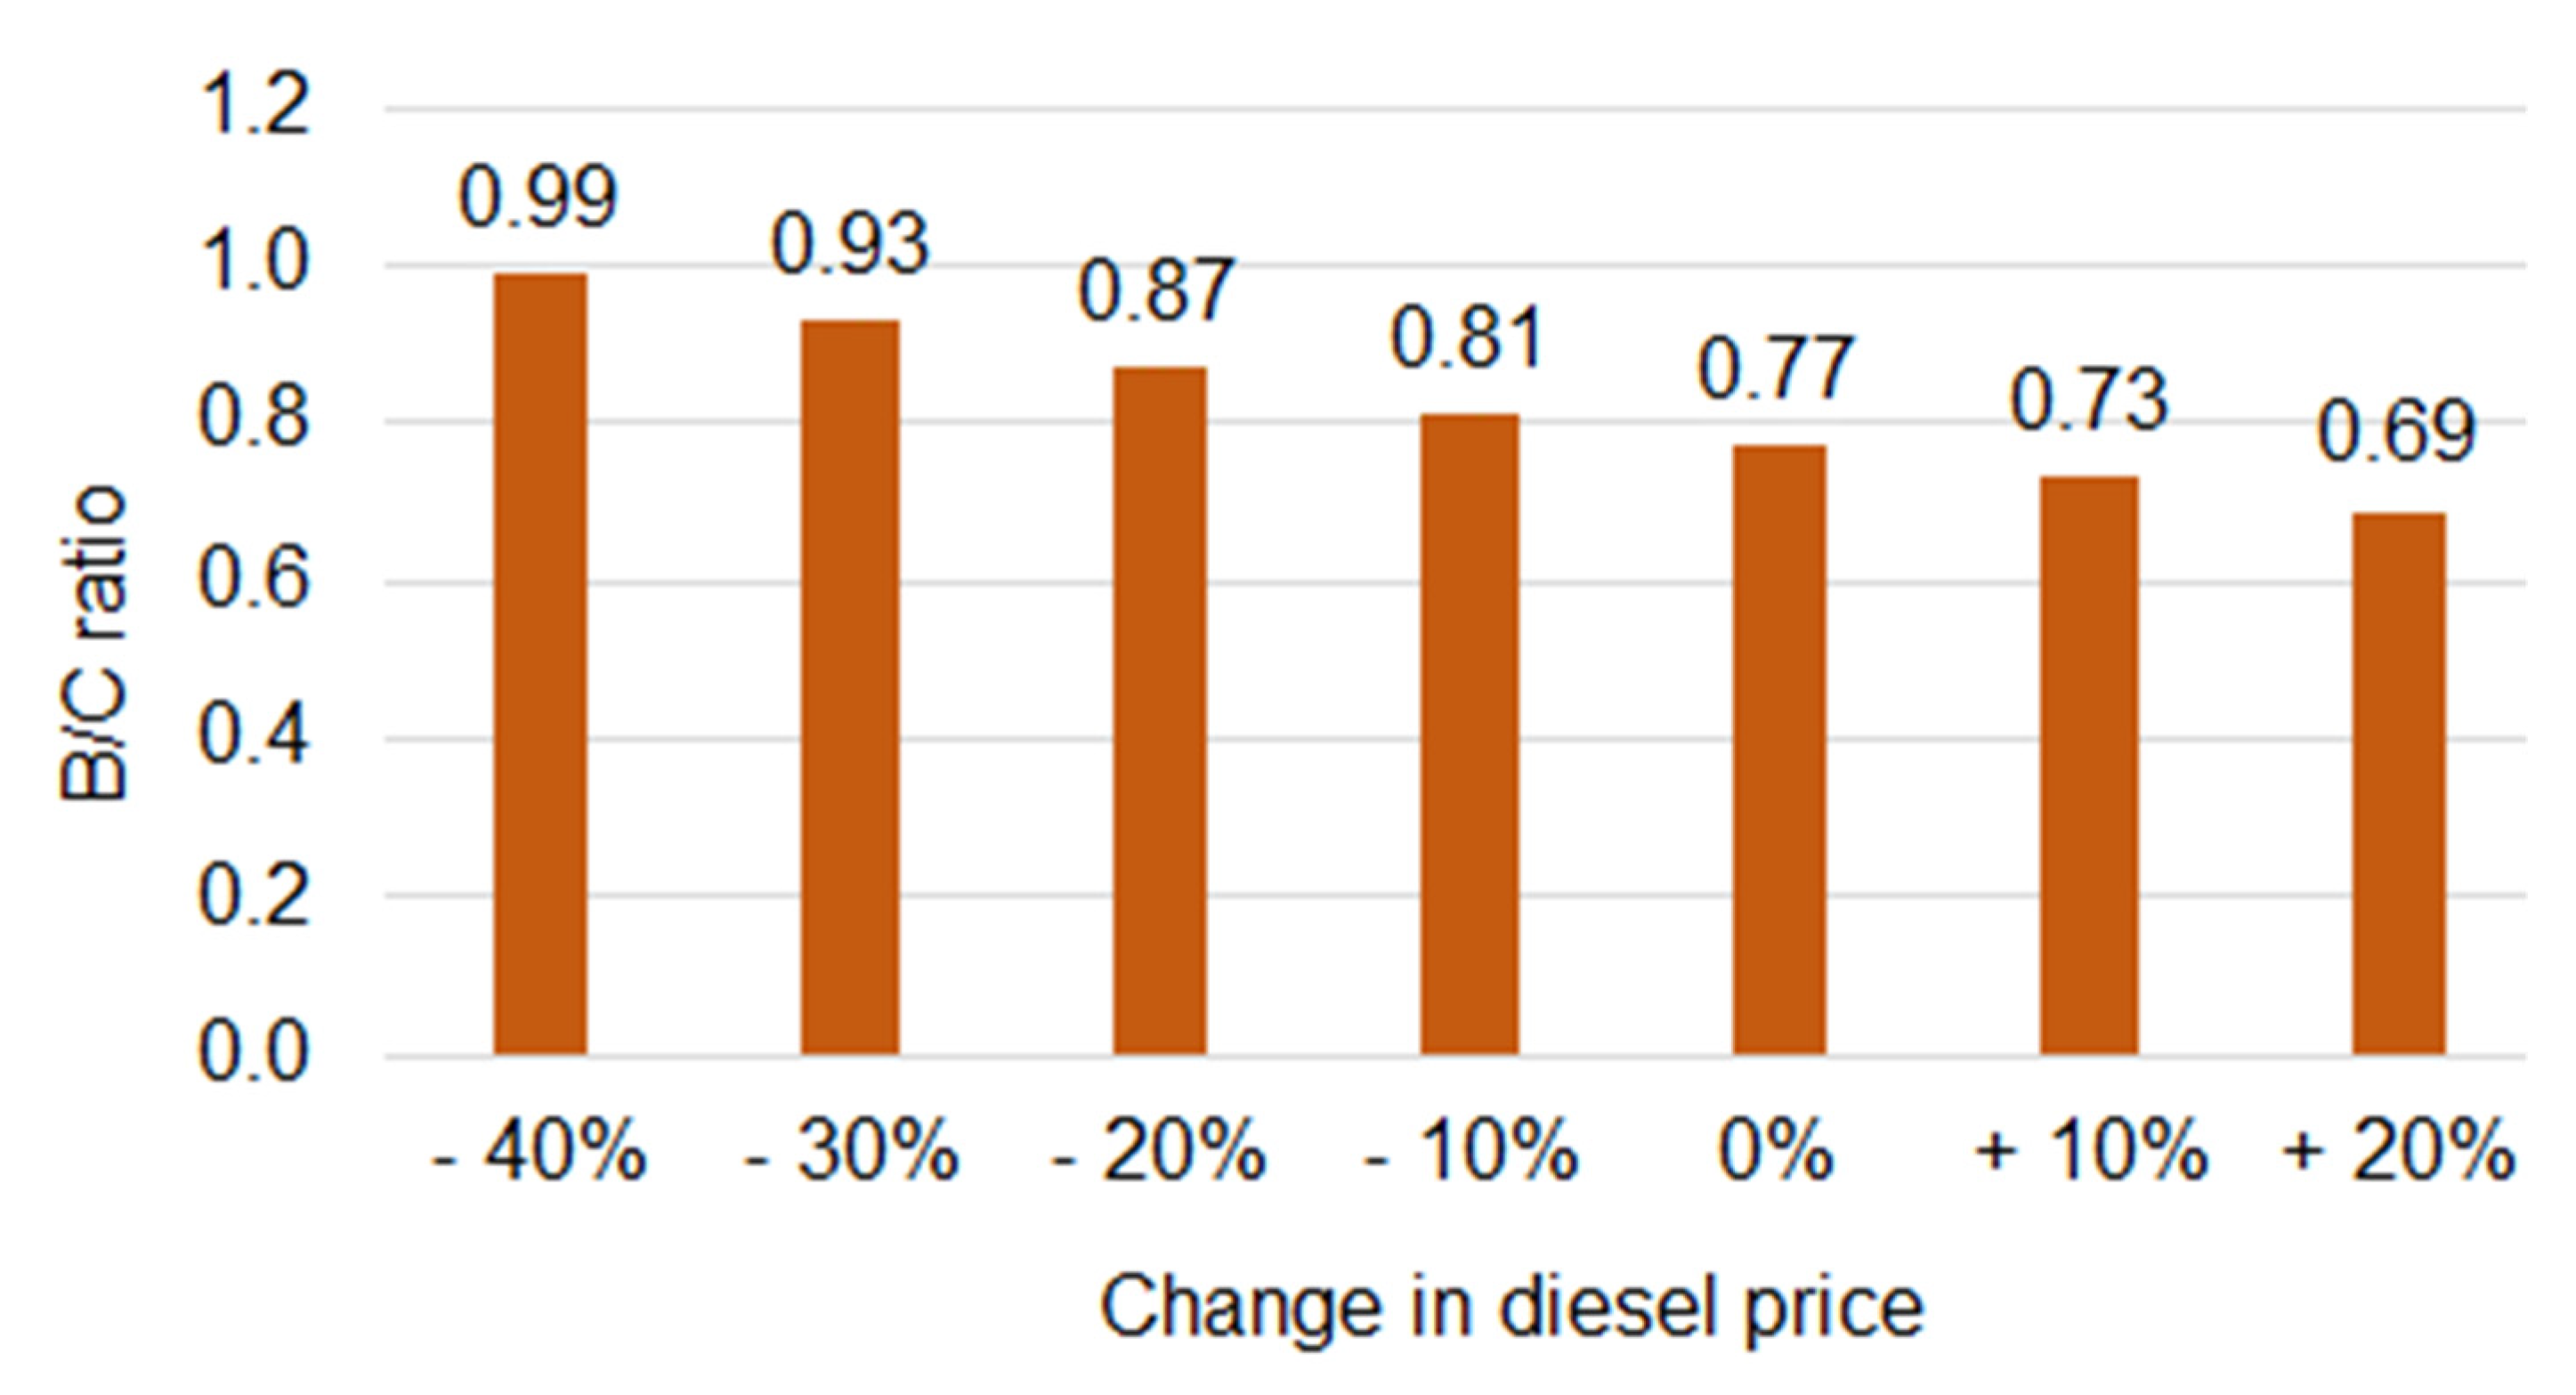
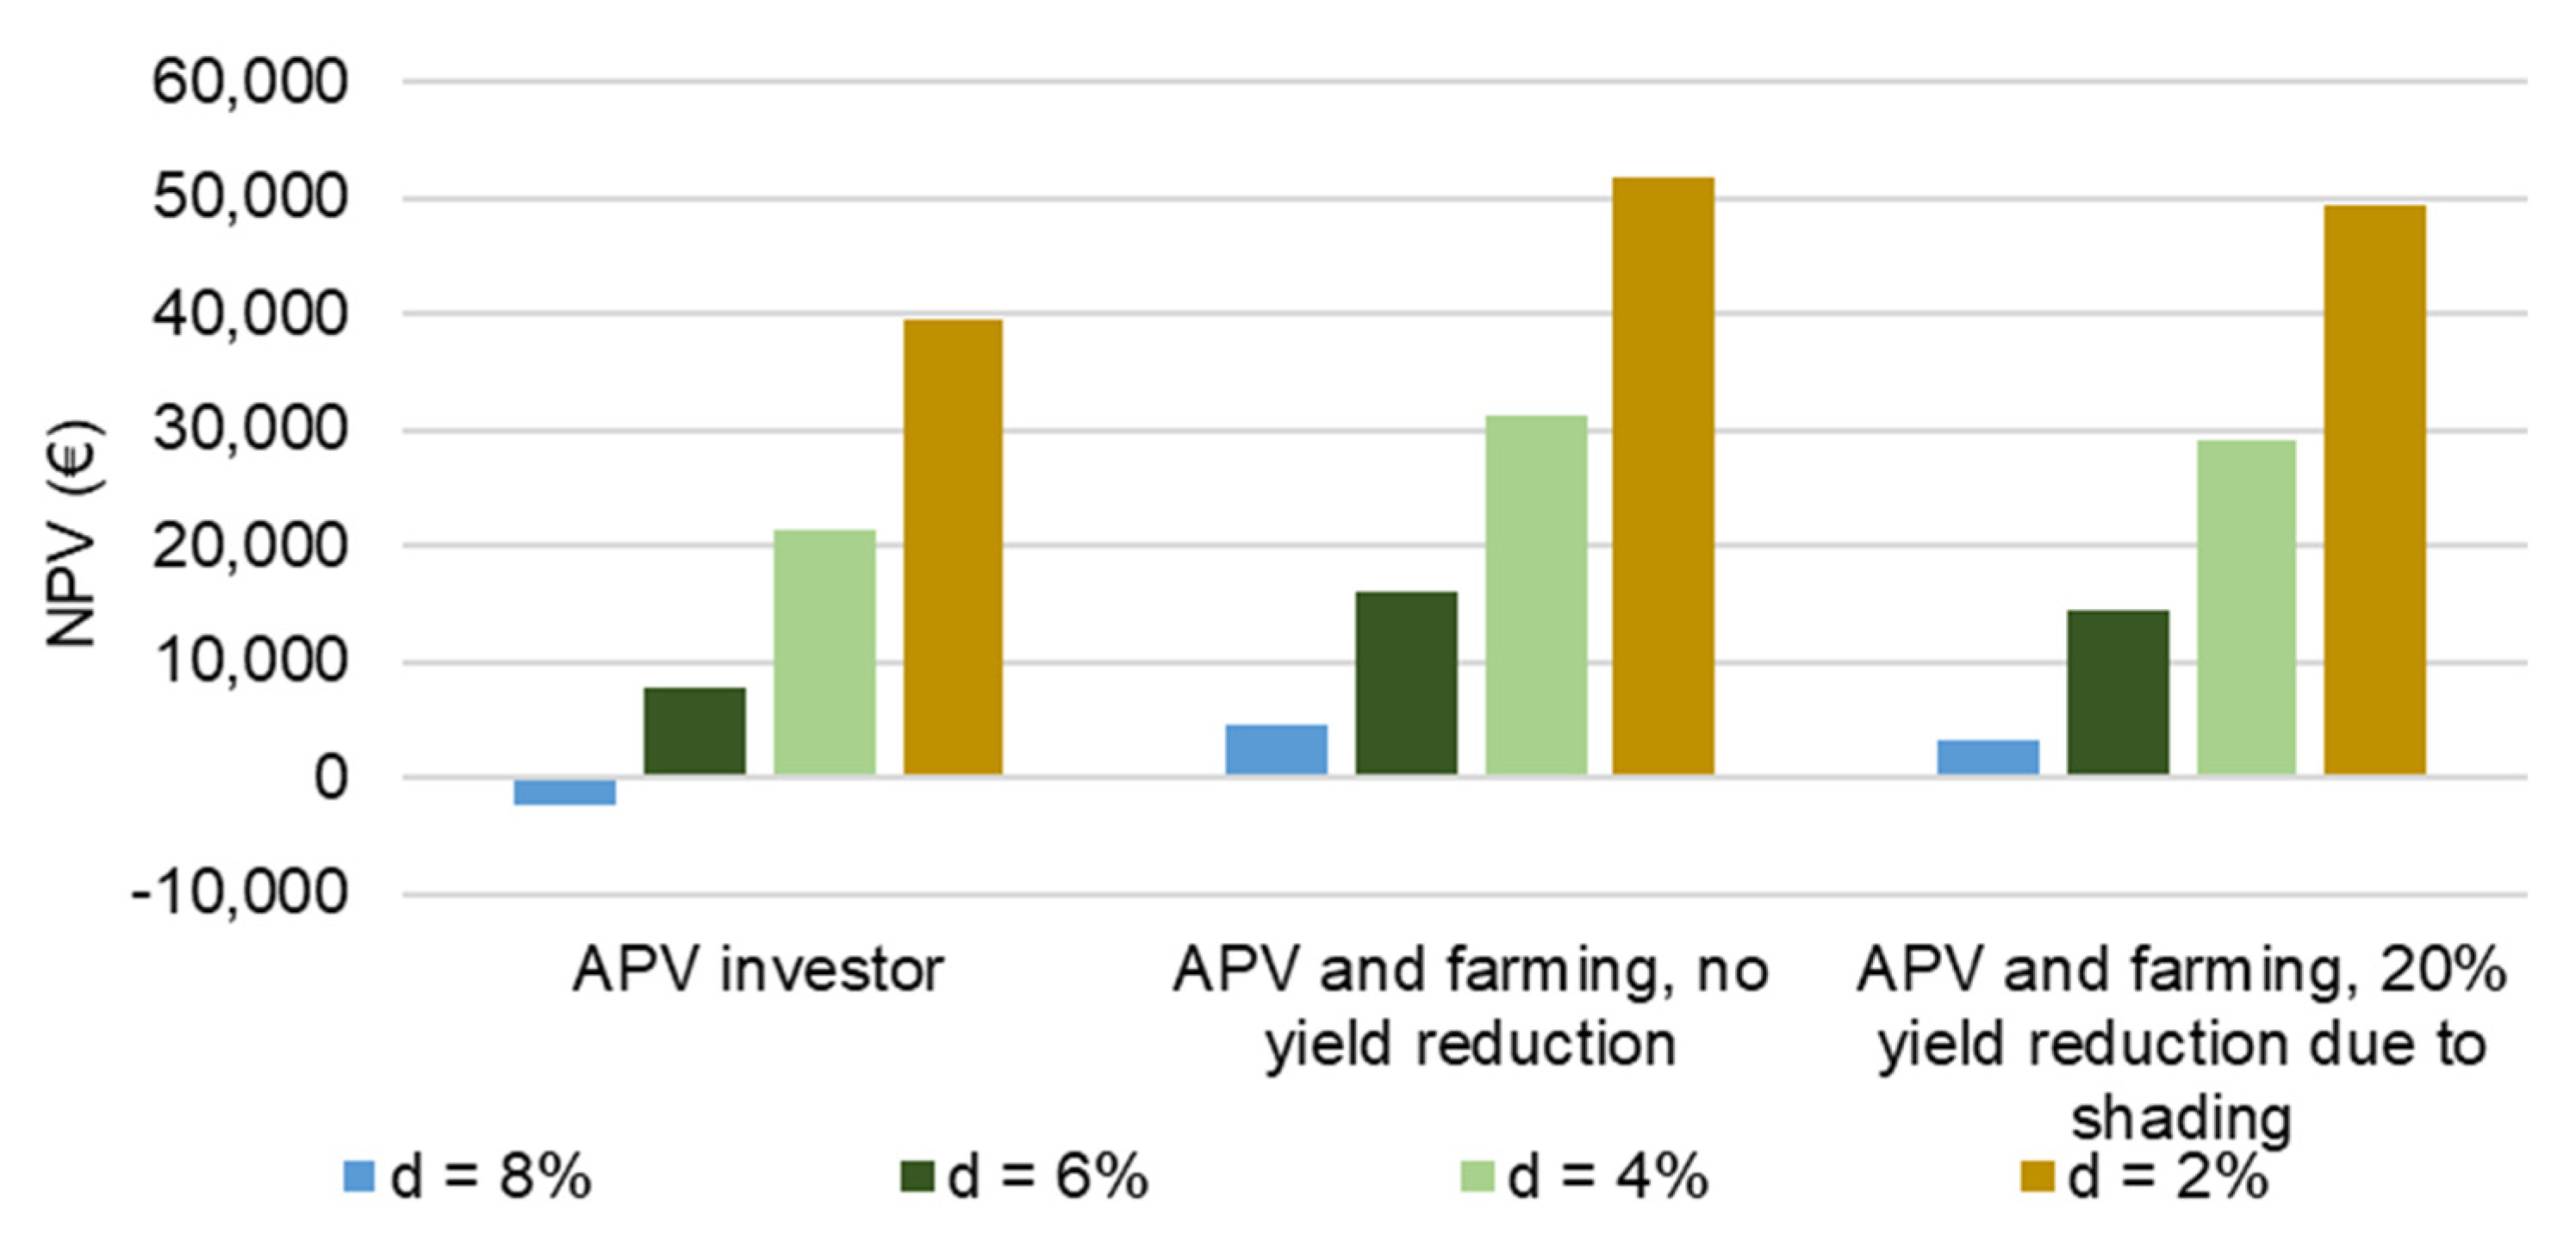
4.5. Sensitivity Analysis
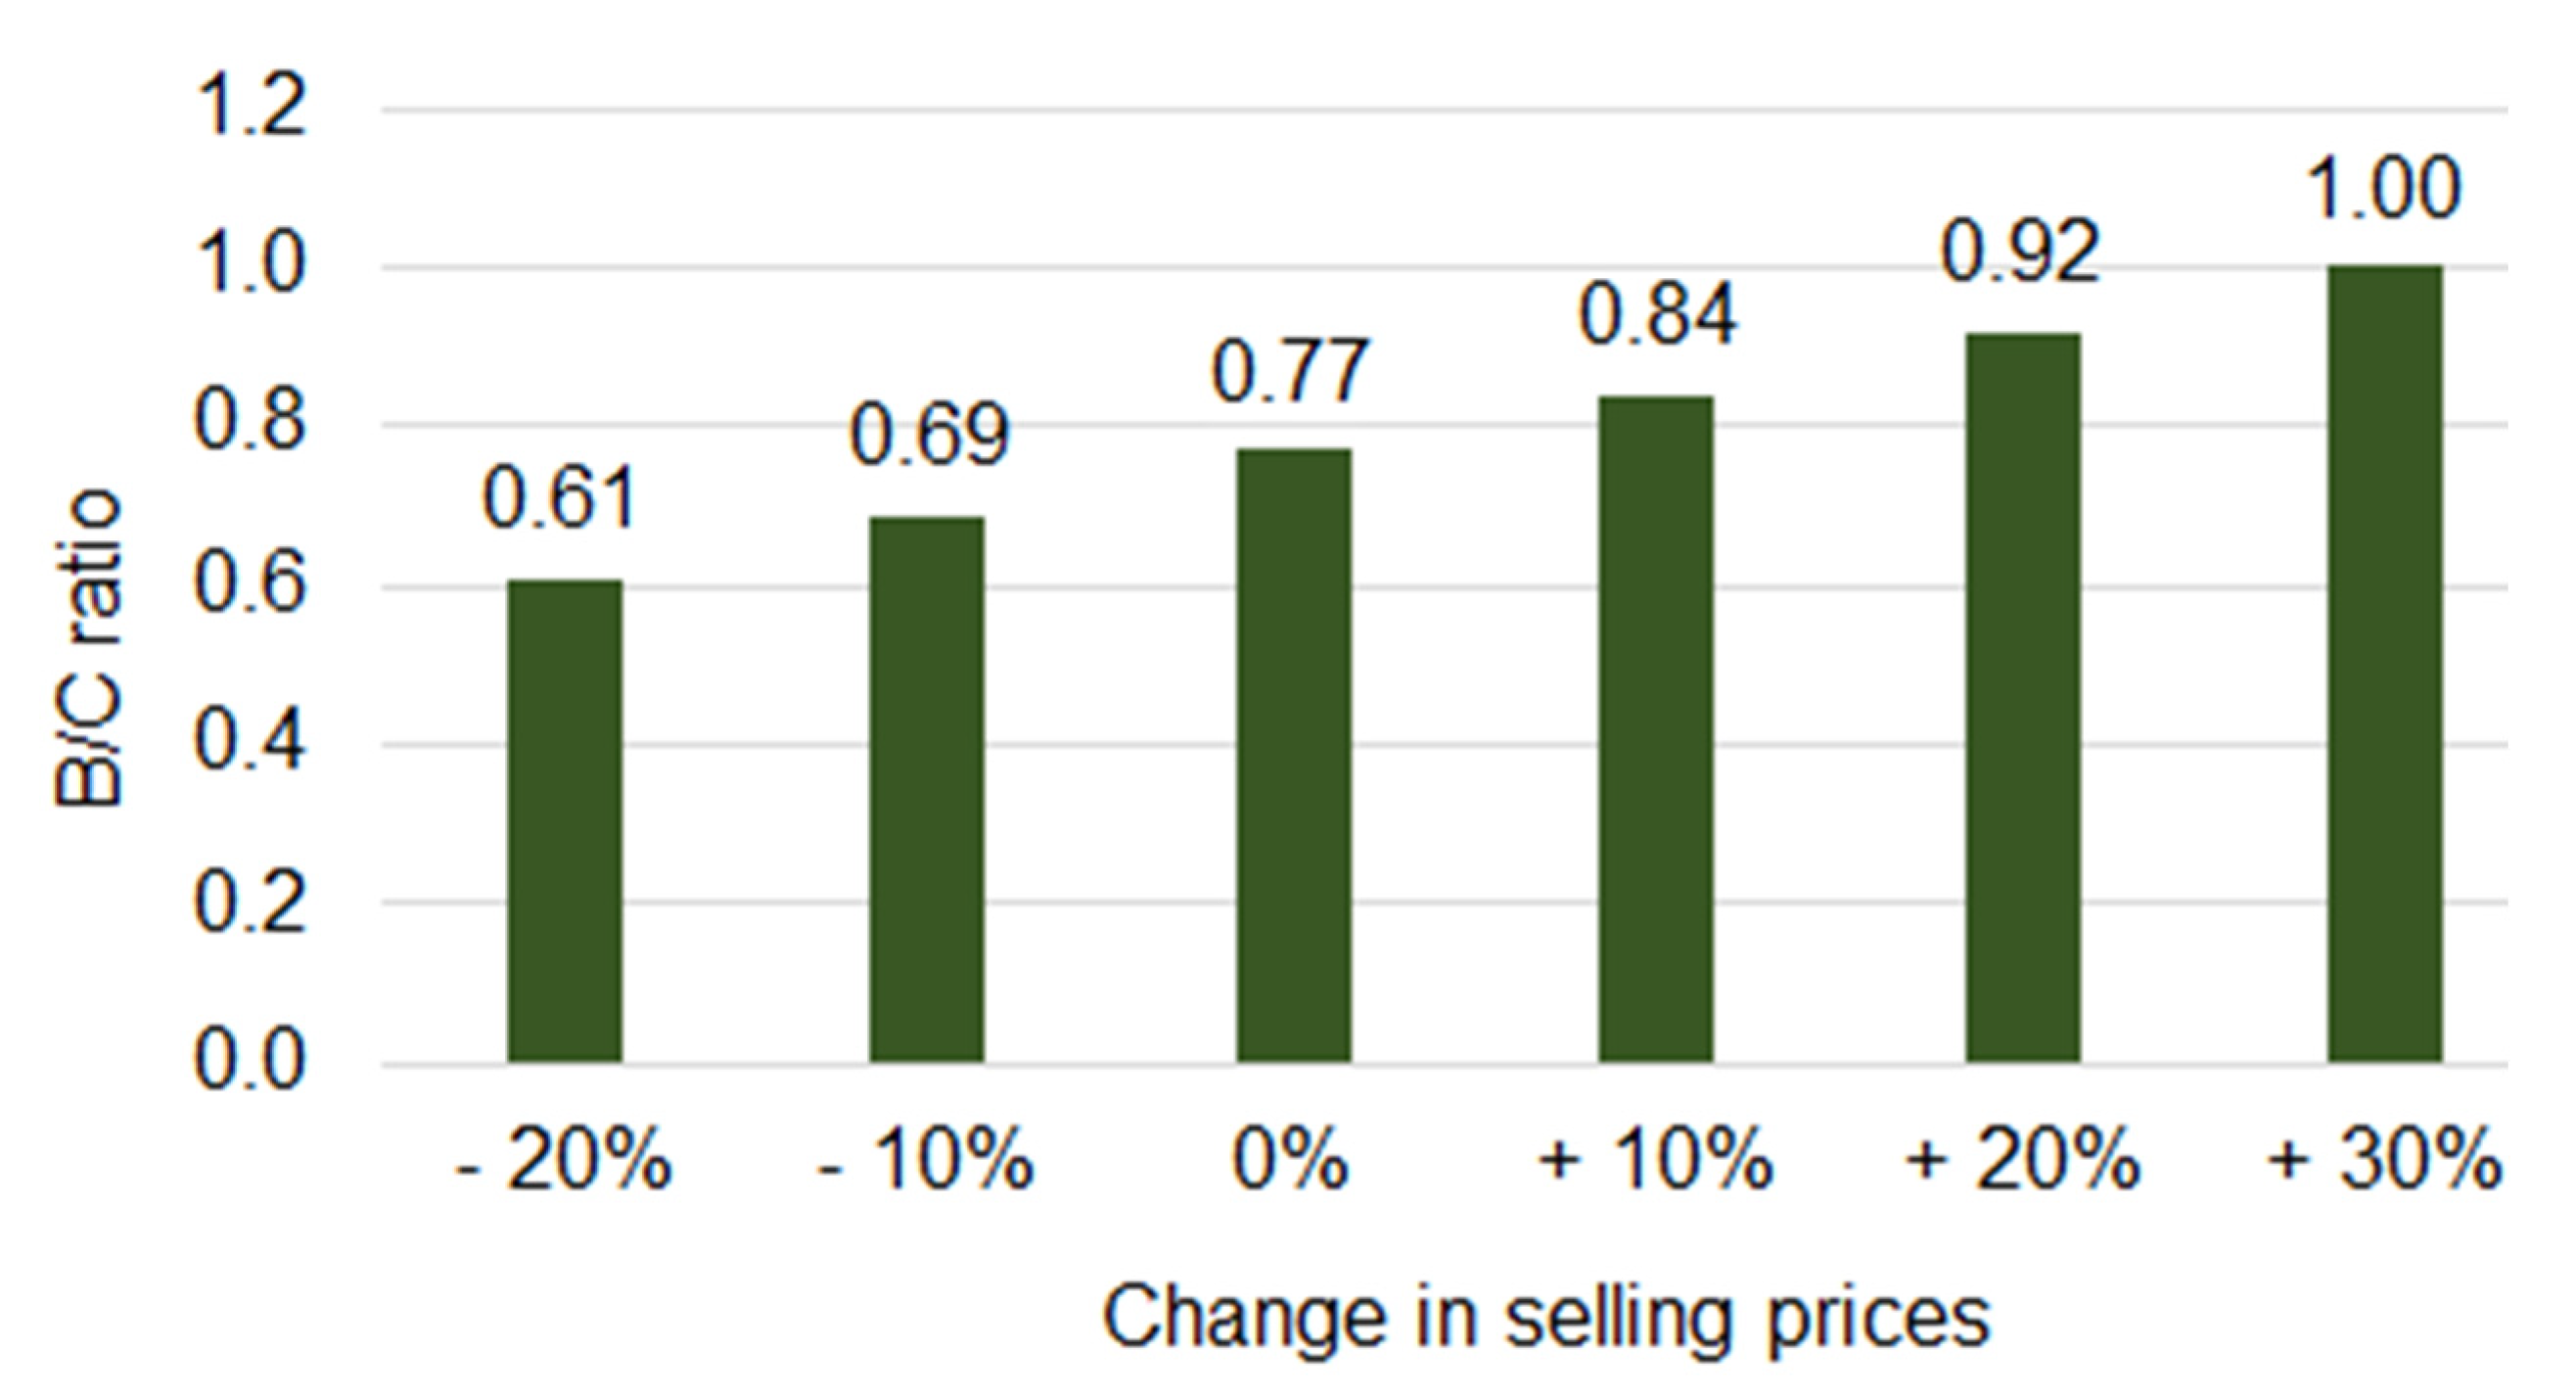
4.5.1. Diesel Based Irrigation System, Case for Farmers
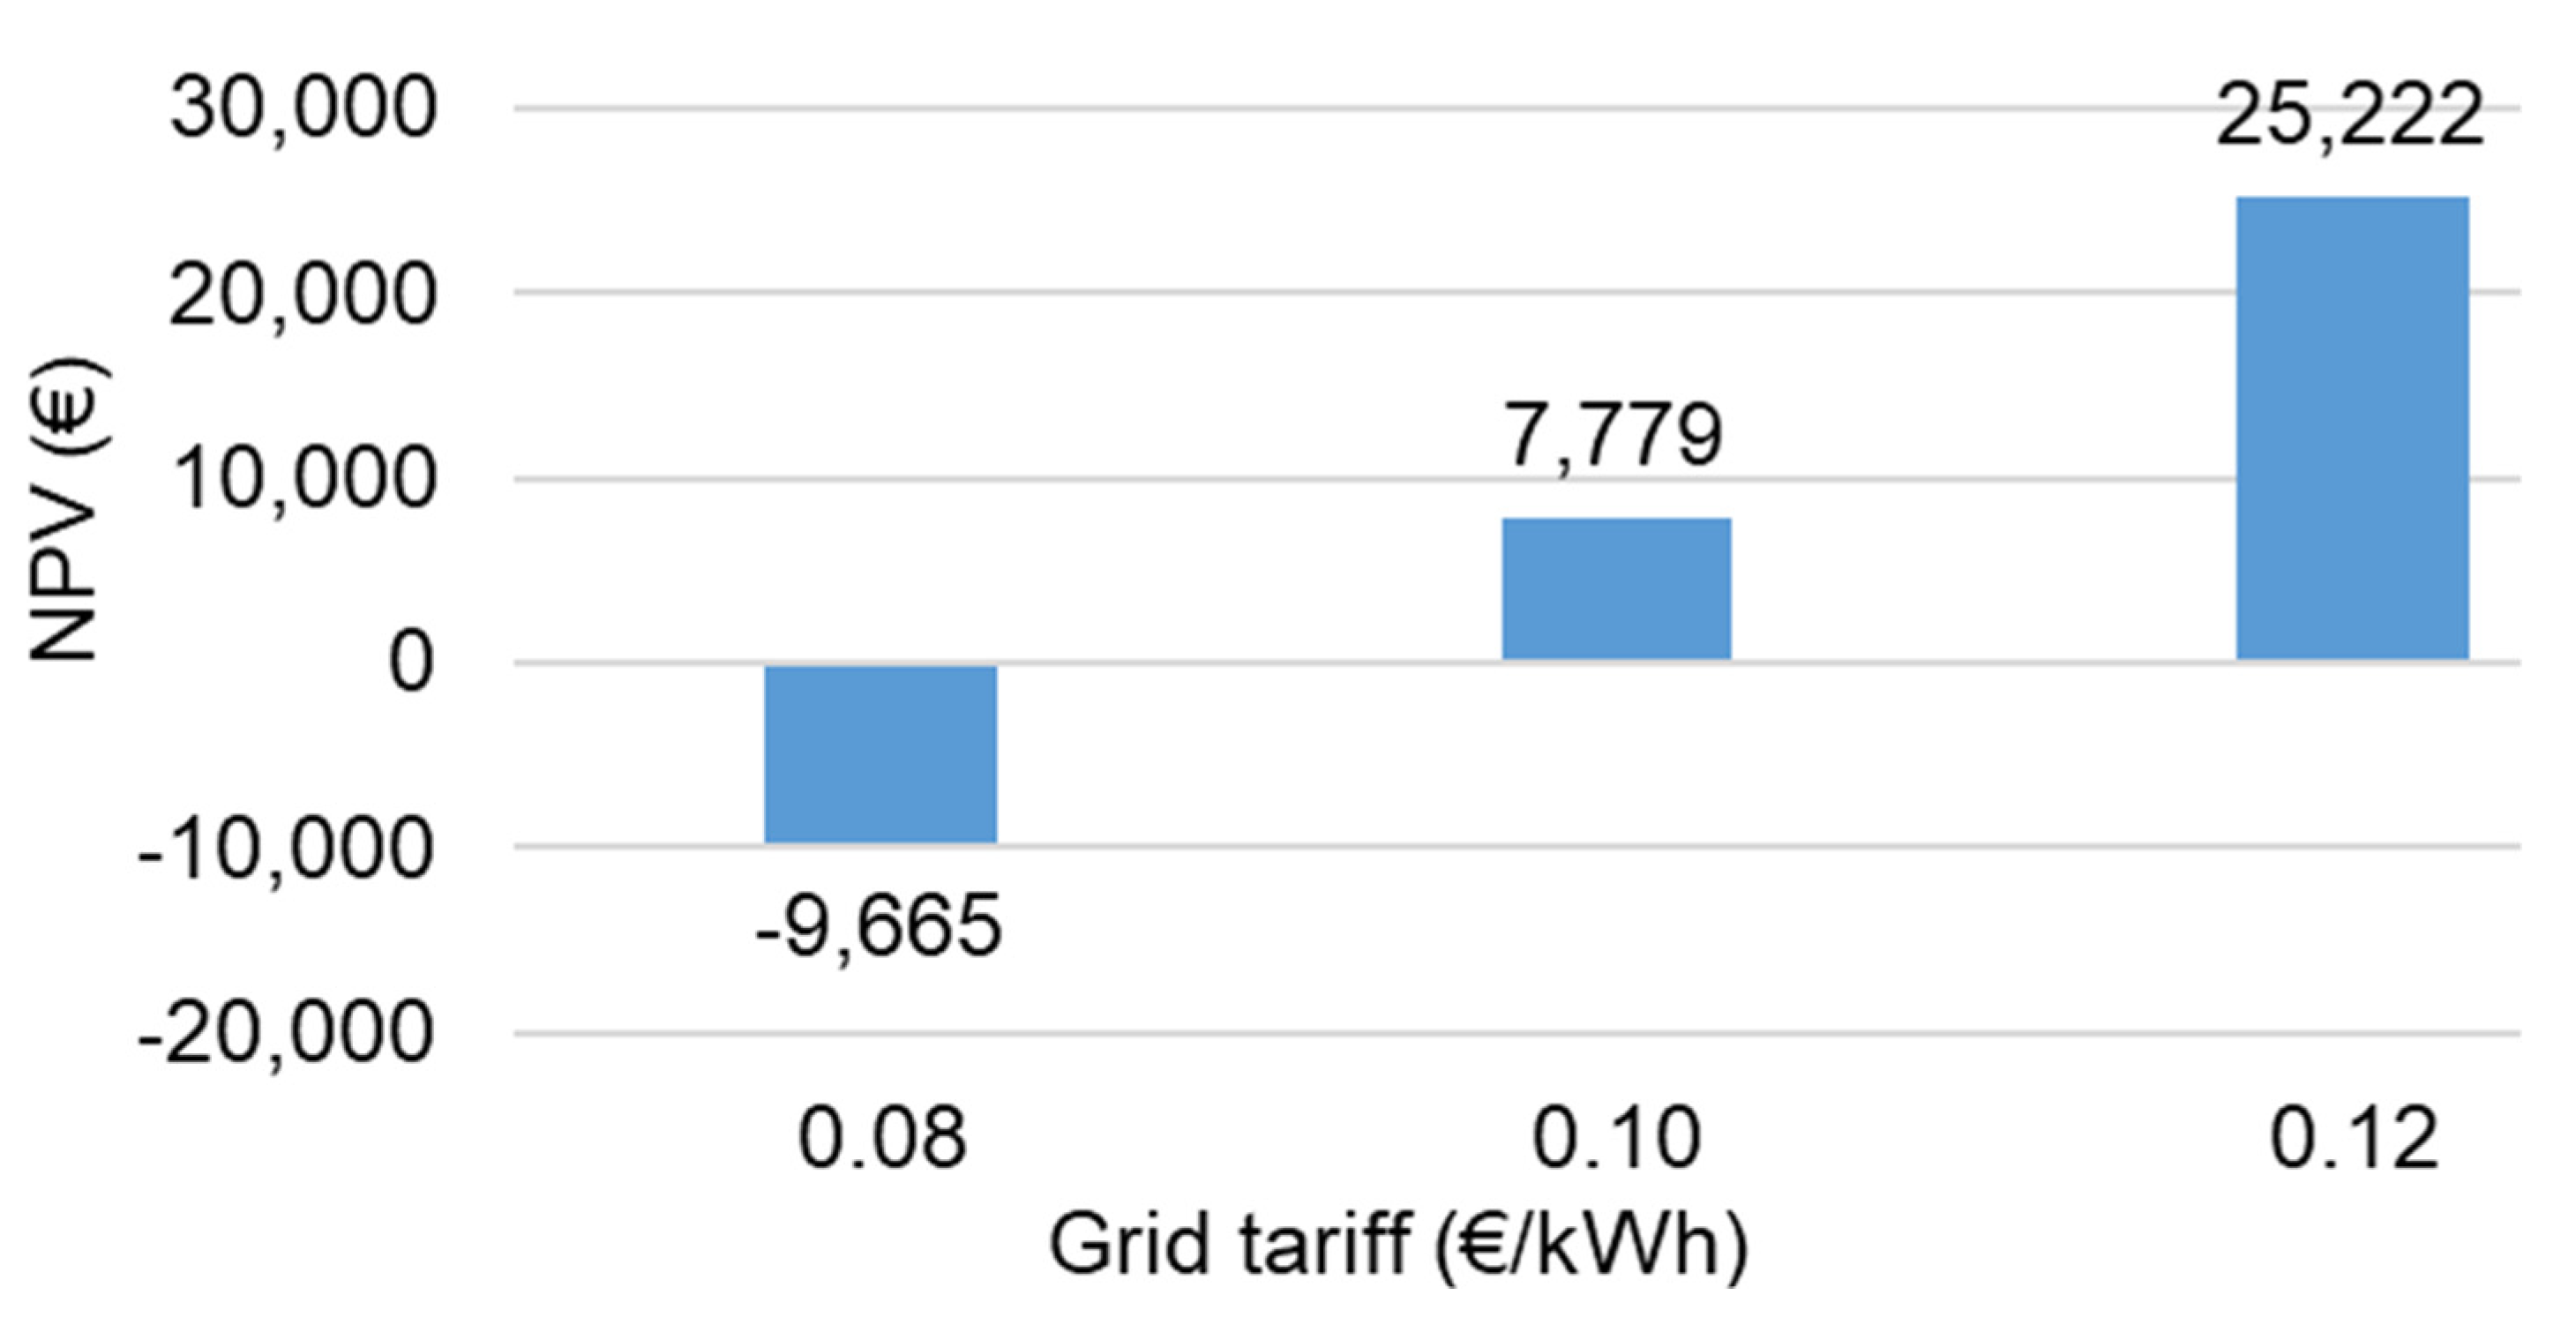
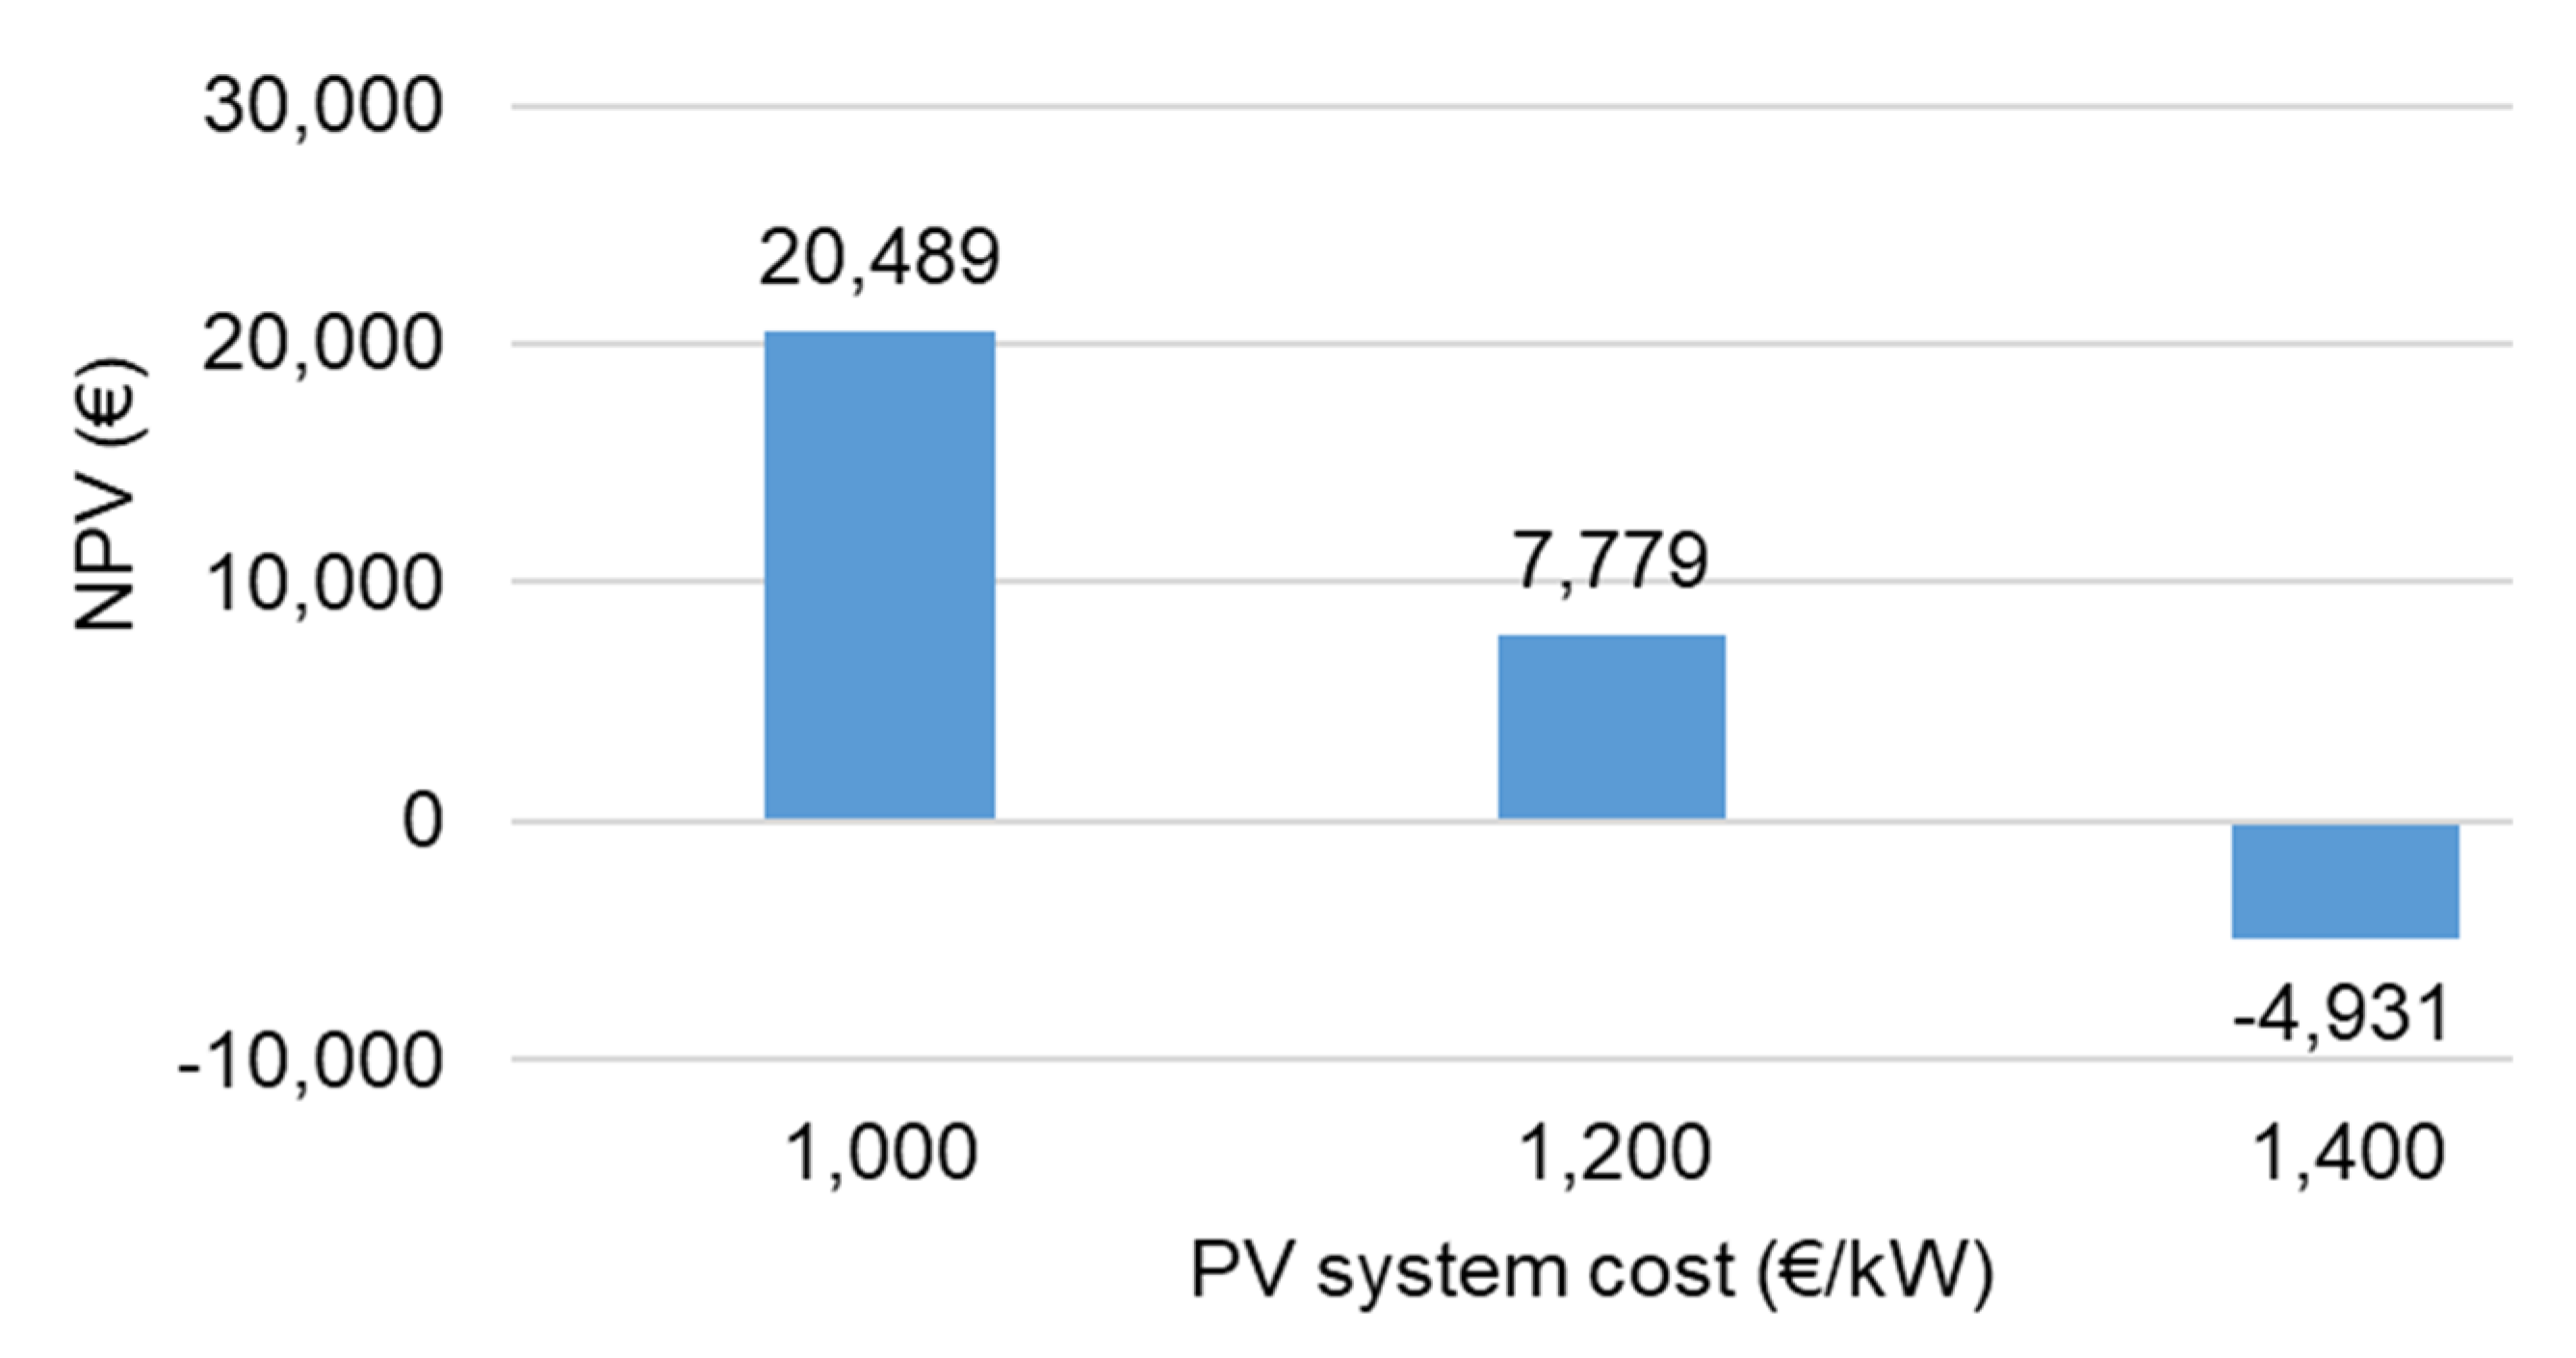
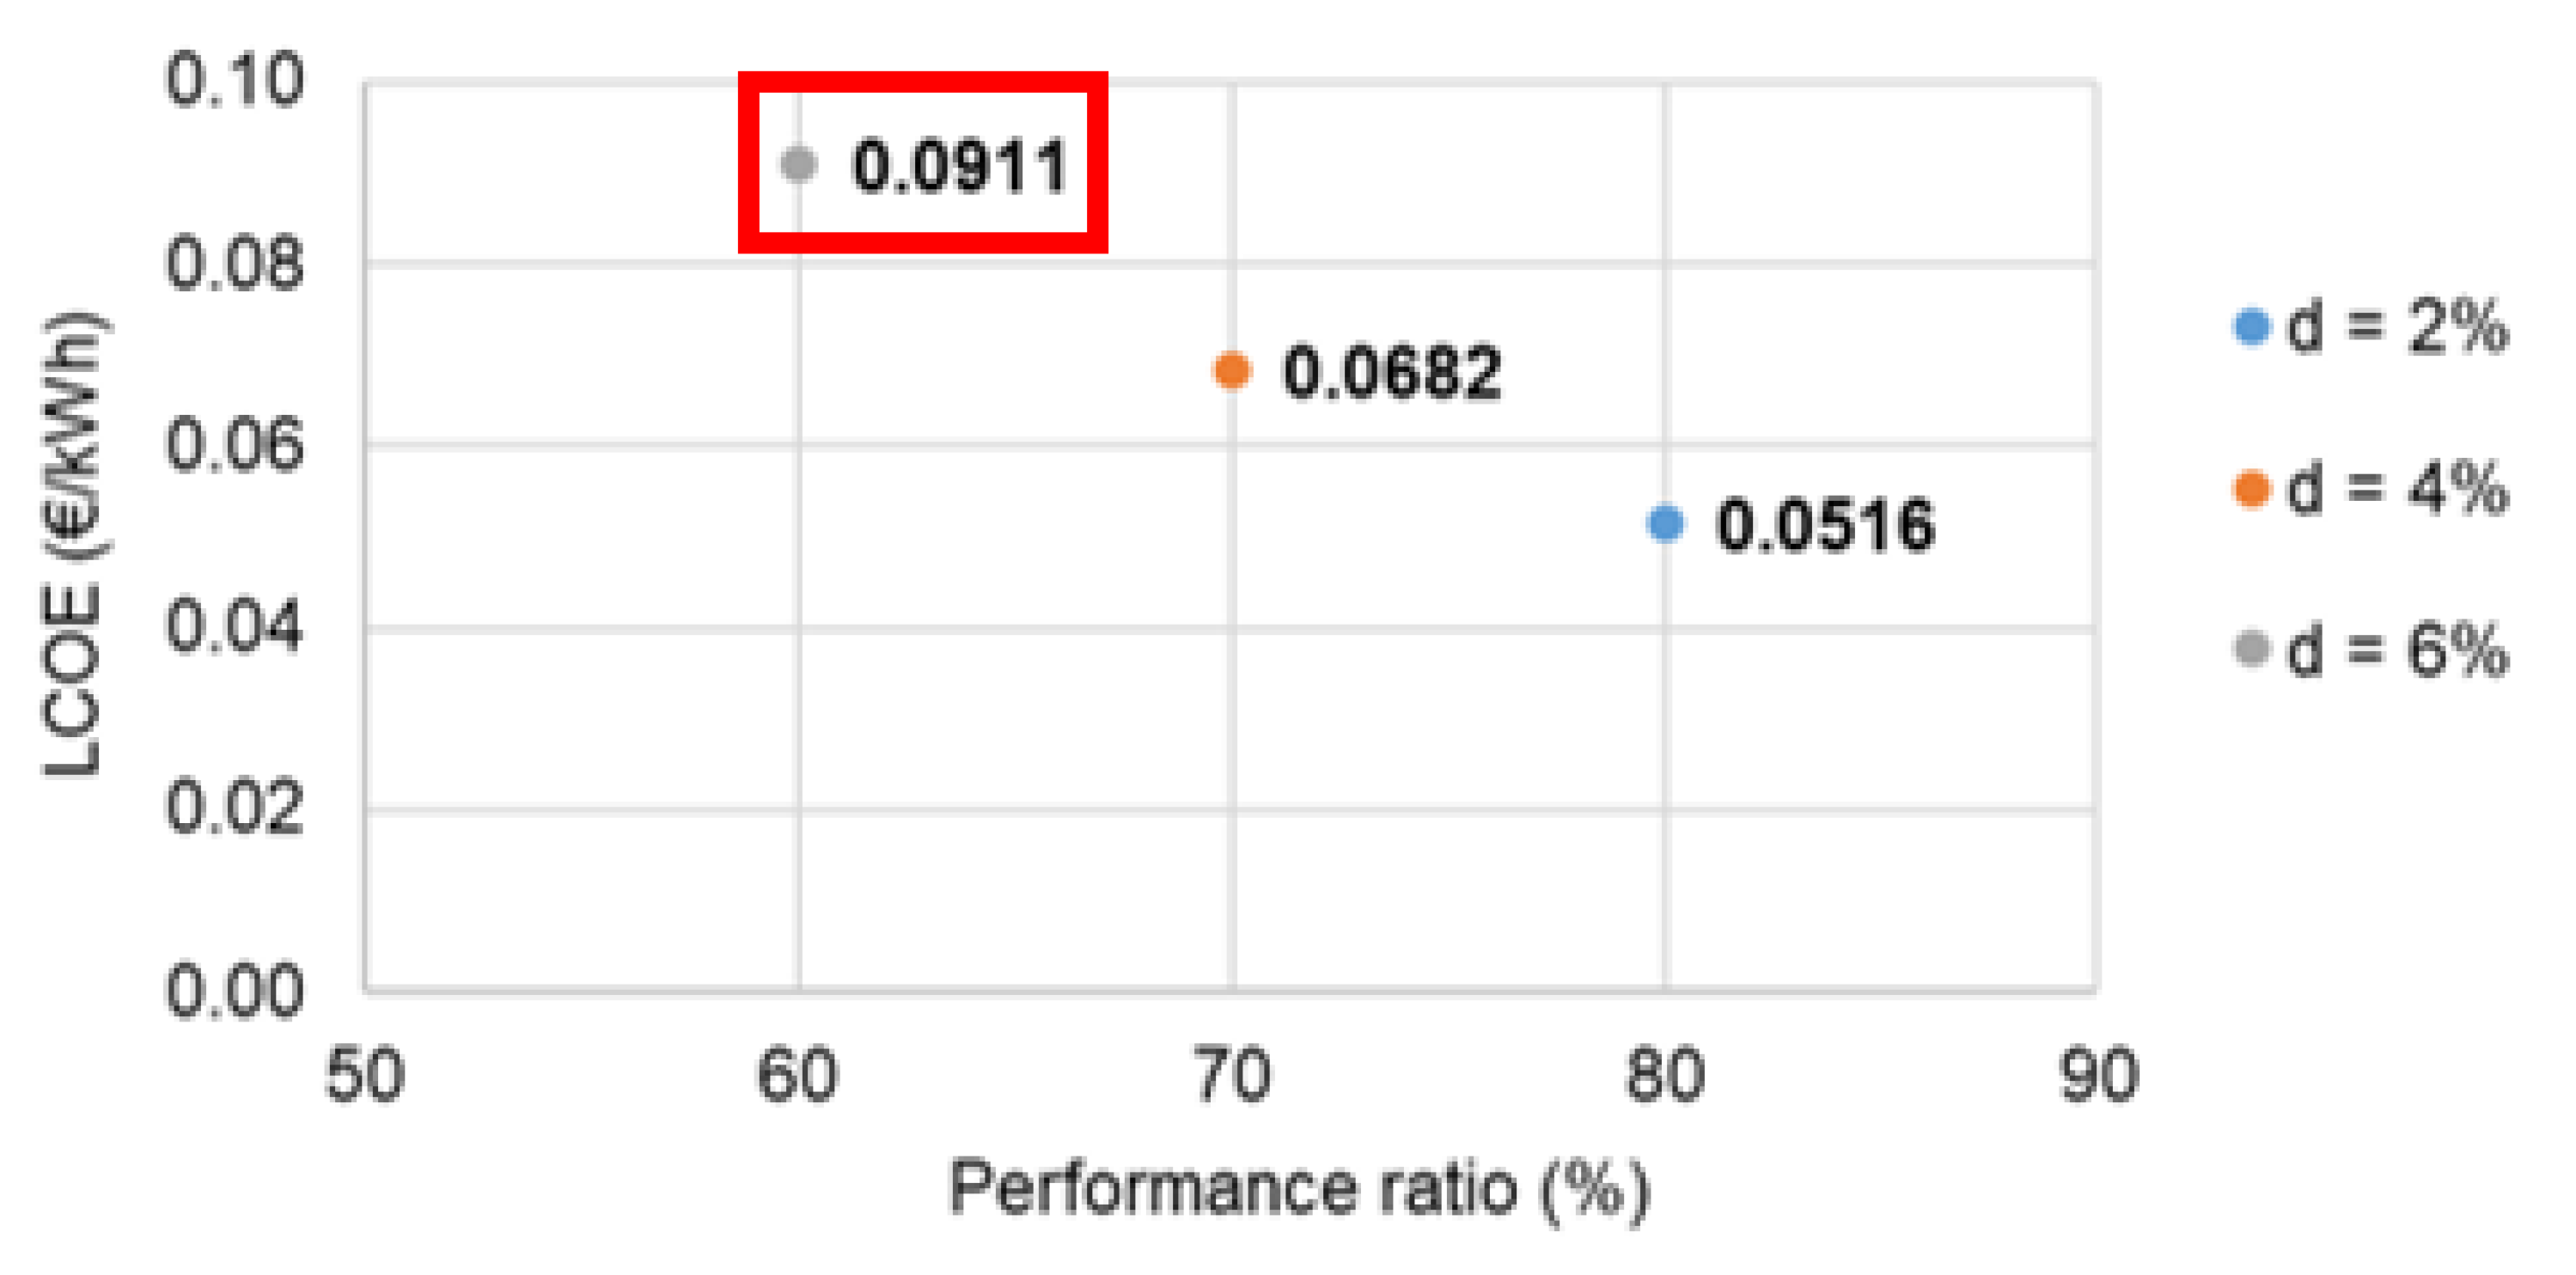
4.5.2. APV System, Case for Investors
4.5.3. APV System, Both Cases (Combined Benefits and Shading Effect)
5. Conclusions
Author Contributions
Funding
Institutional Review Board Statement
Informed Consent Statement
Data Availability Statement
Acknowledgments
Conflicts of Interest
References
- Fraunhofer ISE. Harvesting the Sun for Power and Produce—Agrophotovoltaics Increases the Land Use Efficiency by Over 60 Percent; Fraunhofer ISE: Freiburg, Germany, 2017. [Google Scholar]
- Goetzberger, A.; Zastrow, A. On the Coexistence of Solar-Energy Conversion and Plant Cultivation. Int. J. Sol. Energy 1982, 1, 55–69. [Google Scholar] [CrossRef]
- Brohm, R.; Khanh, N.Q. Dual Use Approaches for Solar Energy and Food Production—International Experience and Potentials for Vietnam; Green Innovation and Development Centre (GreenID): Hanoi, Vietnam, 2018. [Google Scholar]
- Mead, R.; Willey, R.W. The Concept of a ‘Land Equivalent Ratio’ and Advantages in Yields from Intercropping. Exp. Agric. 1980, 16, 217–228. [Google Scholar] [CrossRef] [Green Version]
- Dinesh, H.; Pearce, J.M. The potential of agrivoltaic systems. Renew. Sustain. Energy Rev. 2016, 54, 299–308. [Google Scholar] [CrossRef] [Green Version]
- Weselek, A.; Ehmann, A.; Zikeli, S.; Lewandowski, I.; Schindele, S.; Högy, P. Agrophotovoltaic systems: Applications, challenges, and opportunities. A review. Agron. Sustain. Dev. 2019, 39, 35. [Google Scholar] [CrossRef]
- Hernandez, R.R.; Armstrong, A.; Burney, J.; Ryan, G.; Moore-O’Leary, K.; Diédhiou, I.; Grodsky, S.M.; Saul-Gershenz, L.; Davis, R.; Macknick, J.; et al. Techno–ecological synergies of solar energy for global sustainability. Nat. Sustain. 2019, 2, 560–568. [Google Scholar] [CrossRef]
- Barron-Gafford, G.A.; Pavao-Zuckerman, M.A.; Minor, R.L.; Sutter, L.F.; Barnett-Moreno, I.; Blackett, D.T.; Thompson, M.; Dimond, K.; Gerlak, A.K.; Nabhan, G.P.; et al. Agrivoltaics provide mutual benefits across the food–energy–water nexus in drylands. Nat. Sustain. 2019, 2, 848–855. [Google Scholar] [CrossRef]
- Majumdar, D.; Pasqualetti, M.J. Dual use of agricultural land: Introducing ‘agrivoltaics’ in Phoenix Metropolitan Statistical Area, USA. Landsc. Urban Plan 2018, 170, 150–168. [Google Scholar] [CrossRef]
- Dupraz, C.; Marrou, H.; Talbot, G.; Dufour, L.; Nogier, A.; Ferard, Y. Combining solar photovoltaic panels and food crops for optimising land use: Towards new agrivoltaic schemes. Renew. Energy 2011, 36, 2725–2732. [Google Scholar] [CrossRef]
- Marrou, H.; Guilioni, L.; Dufour, L.; Dupraz, C.; Wery, J. Microclimate under agrivoltaic systems: Is crop growth rate affected in the partial shade of solar panels? Agric. For. Meteorol. 2013, 177, 117–132. [Google Scholar] [CrossRef]
- Beck, M.; Bopp, G.; Goetzberger, A.; Obergfell, T.; Reise, C.; Schindele, S. Combining PV and food crops to agrophotovoltaic—Optimization of orientation and harvest. In Proceedings of the 27th European Photovoltaic Solar Energy Conference and Exhibition, EU PVSEC, Frankfurt, Germany, 24–28 September 2012. [Google Scholar]
- Sekiyama, T.; Nagashima, A. Solar Sharing for Both Food and Clean Energy Production: Performance of Agrivoltaic Systems for Corn, A Typical Shade-Intolerant Crop. Environments 2019, 6, 65. [Google Scholar] [CrossRef] [Green Version]
- Neupane Bhandari, S. Feasibility Analysis of Agrivoltaic Systems: Case Study of Food Energy Nexus in Niger; TH Köln—University of Applied Sciences: Cologne, Germany, 2020. [Google Scholar]
- Vyas, K. Solar Farming with Agricultural Land. Acta Sci. Agric. 2019, 3, 23–25. [Google Scholar] [CrossRef]
- Santra, P.; Singh, R.K.; Meena, H.M.; Kumawat, R.N.; Mishra, D.; Jain, D.; Yadav, O.P. Agrivoltaic system: Crop production and photovoltaic-based electricity generation from a single land unit. Indian Farming 2018, 68, 20–23. [Google Scholar]
- Malu, P.R.; Sharma, U.S.; Pearce, J.M. Agrivoltaic potential on grape farms in India. Sustain. Energy Technol. Assess. 2017, 23, 104–110. [Google Scholar] [CrossRef] [Green Version]
- Valle, B.; Simonneau, T.; Sourd, F.; Pechier, P.; Hamard, P.; Frisson, T.; Ryckewaert, M.; Christophe, A. Increasing the total productivity of a land by combining mobile photovoltaic panels and food crops. Appl. Energy 2017, 206, 1495–1507. [Google Scholar] [CrossRef]
- Ravi, S.; Macknick, J.; Lobell, D.; Field, C.; Ganesan, K.; Jain, R.; Elchinger, M.; Stoltenberg, B. Colocation opportunities for large solar infrastructures and agriculture in drylands. Appl. Energy 2016, 165, 383–392. [Google Scholar] [CrossRef] [Green Version]
- Amaducci, S.; Yin, X.; Colauzzi, M. Agrivoltaic systems to optimise land use for electric energy production. Appl. Energy 2018, 220, 545–561. [Google Scholar] [CrossRef]
- Harinarayana, T.; Vasavi, K. Solar Energy Generation Using Agriculture Cultivated Lands. Smart Grid Renew. Energy 2014, 5, 31–42. [Google Scholar] [CrossRef] [Green Version]
- Movellan, J. Japan Next-Generation Farmers Cultivate Crops and Solar Energy. 2013. Available online: https://www.renewableenergyworld.com/2013/10/10/japan-next-generation-farmers-cultivate-agriculture-and-solar-energy/ (accessed on 17 October 2020).
- Moreda, G.P.; Muñoz-García, M.A.; Alonso-García, M.C.; Hernández-Callejo, L. Techno-Economic Viability of Agro-Photovoltaic Irrigated Arable Lands in the EU-Med Region: A Case-Study in Southwestern Spain. Agronomy 2021, 11, 593. [Google Scholar] [CrossRef]
- Ibrik, I. Micro-Grid Solar Photovoltaic Systems for Rural Development and Sustainable Agriculture in Palestine. Agronomy 2020, 10, 1474. [Google Scholar] [CrossRef]
- Pascaris, A.S.; Schelly, C.; Pearce, J.M. A First Investigation of Agriculture Sector Perspectives on the Opportunities and Barriers for Agrivoltaics. Agronomy 2020, 10, 1885. [Google Scholar] [CrossRef]
- Hassanien, R.H.E.; Li, M.; Dong Lin, W. Advanced applications of solar energy in agricultural greenhouses. Renew. Sustain. Energy Rev. 2016, 54, 989–1001. [Google Scholar] [CrossRef]
- NREL. Benefits of Agrivoltaics across the Food-Energy-Water Nexus. 2019. Available online: https://www.nrel.gov/news/program/2019/benefits-of-agrivoltaics-across-the-food-energy-water-nexus.html (accessed on 12 July 2020).
- Njita, N.F. Increasing Agricultural Land Use Efficiency and Generating Electricity Using Solar Modules; Lappeenranta University of Technology: Lappeenranta, Finland, 2018. [Google Scholar]
- Patel, B.; Gami, B.; Baria, V.; Patel, A.; Patel, P. Co-Generation of Solar Electricity and Agriculture Produce by Photovoltaic and Photosynthesis—Dual Model by Abellon, India. J. Sol. Energy Eng. 2019, 141, 031014. [Google Scholar] [CrossRef]
- EERE. Farmer’s Guide to Going Solar. 2020. Available online: https://www.energy.gov/eere/solar/farmers-guide-going-solar (accessed on 21 September 2020).
- Ketzer, D.; Schlyter, P.; Weinberger, N.; Rösch, C. Driving and restraining forces for the implementation of the Agrophotovoltaics system technology—A system dynamics analysis. J. Environ. Manag. 2020, 270, 110864. [Google Scholar] [CrossRef] [PubMed]
- CIA. The World Factbook—Niger. 2020. Available online: https://www.cia.gov/library/publications/the-world-factbook/geos/ng.html (accessed on 18 September 2020).
- Knoema. Niger—Total Population. 2020. Available online: https://knoema.com/atlas/Niger/Population (accessed on 10 September 2020).
- FAO. Aquastat: Country Statistics 2017—Niger. 2021. Available online: http://www.fao.org/aquastat/statistics/query/index.html?lang=en (accessed on 23 June 2021).
- ICRISAT. Niger: Facts and Figures. 2020. Available online: http://exploreit.icrisat.org/profile/Niger/334 (accessed on 26 August 2020).
- USAID. Off-Grid Solar Market Assessment; United States Agency for International Development (USAID): 2019. Available online: https://www.usaid.gov/sites/default/files/documents/1860/PAOP-Niger-MarketAssessment-Final_508.pdf (accessed on 14 August 2020).
- Andres, L.; Lebailly, P. Peri-urban Agriculture: The Case of Market Gardening in Niamey, Niger. Afr. Rev. Econ. Financ. 2011, 3, 69–85. [Google Scholar]
- Bhandari, R.; Sessa, V.; Adamou, R. Rural electrification in Africa—A willingness to pay assessment in Niger. Renew. Energy 2020, 161, 20–29. [Google Scholar] [CrossRef]
- Tilahun, F.B.; Bhandari, R.; Mamo, M. Supply optimization based on society’s cost of electricity and a calibrated demand model for future renewable energy transition in Niger. Energy Sustain. Soc. 2019, 9, 31. [Google Scholar] [CrossRef] [Green Version]
- Bhandari, R.; Arce, B.E.; Sessa, V.; Adamou, R. Sustainability Assessment of Electricity Generation in Niger Using a Weighted Multi-criteria Decision Approach. Sustainability 2021, 13, 385. [Google Scholar] [CrossRef]
- Kahan, D. Economics for Market Oriented Farming; Food and Agriculture Organization (FAO) of the United Nations: Rome, Italy, 2008. [Google Scholar]
- World Bank. Solar Pumping—The Basics; The World Bank (WB): Washington, DC, USA, 2018. [Google Scholar]
- ITT. Final Report on the Project RARSUS; TH Köln—University of Applied Sciences: Cologne, Germany, 2020. [Google Scholar]
- ECG. Feasibility Assessment for the Replacement of Diesel Water Pumps with Solar Water Pumps; Emcon Consulting Group (ECG): Windhoek, Namibia, 2006. [Google Scholar]
- World Bank. International Development Association Project Paper on a Proposed Additional Credit and Grant to the Republic of Niger for the Electricity Access Expansion Project. The World Bank: 2018. Available online: https://documents1.worldbank.org/curated/en/630161534524243997/pdf/NIGER-ELECTRICITY-PAD-08142018.pdf (accessed on 23 November 2020).


| Parameters | Case 1, Traditional | Case 2, Diesel Powered Irrigation | Case 3, Solar PV Irrigation |
|---|---|---|---|
| Land area | 0.15 ha | 0.15 ha | 0.15 ha |
| Irrigation type | Rainfed | Diesel pumps for groundwater pumping from the well | Solar PV powered pumps for groundwater pumping from the well |
| Farming method | Traditional, human labor and animals use, 1 crop cycle per year | Cash crops (green vegetables), 4 crop cycles per year | Cash crops (green vegetables), 4 crop cycles per year |
| Main produces considered | Sorghum, millet, cowpea, and peanut | Salad, cabbage, tomato, mint, and okra | Salad, cabbage, tomato, mint, and okra |
| Other items not considered in revenue | - | Possible electricity generation and sale using the same diesel engine. Theoretically, it will be possible to schedule water pumping during the daytime and electricity generation in the evening. | - |
| Cost parameters | Farming land preparation, seeds, planting, fertilizers, harvest, etc. | Farming land preparation, seeds, planting, fertilizers, harvest, etc. Additionally, investment for diesel pump (depreciation of the first year), operating costs due to diesel consumption per year. | Farming land preparation, seeds, planting, fertilizers, harvest, etc. Additionally, investment for solar pump (depreciation of the first year), a small operating/maintenance (O/M) costs per year. |
| Cooperative or community loan share | 50% of total cost | 50% of the total cost | 50% of the total cost |
| Loan interest rate | 10% for a period of 8 months | 10% for a period of 8 months | 10% for a period of 8 months |
| Revenue | Self-consumption (market value set as pseudo selling price) | Selling the harvested cash crops to the market (e.g., in Kodo) or sales to local traders who re-sale the produce to the city of Niamey | Selling the harvested cash crops to the market (e.g., in Kodo) or sales to local traders who re-sale the produce to the city of Niamey |
| Target economic indicator | Gross margin, farm profit, and B/C ratio | Gross margin, farm profit, and B/C ratio | Gross margin, farm profit, and B/C ratio |
| Environmental indicator | - | CO2 emission in a year from the diesel pump | - |
| Case 1, Traditional | Case 2, Diesel Powered Irrigation | Case 3, Solar PV Irrigation | ||||
|---|---|---|---|---|---|---|
| CFA/ha-Year | (€/ha-Year) | CFA/ha-Year | (€/ha-Year) | CFA/ha-Year | (€/ha-Year) | |
| Variable costs | ||||||
| Human labor for different activities | 60,000 | 91.50 | 1,000,000 | 1524.50 | 1,000,000 | 1524.50 |
| Machinery use (hand tractor, plowing) | 20,000 | 30.50 | 200,000 | 304.90 | 200,000 | 304.90 |
| Seed | 4000 | 6.10 | 600,000 | 914.70 | 600,000 | 914.70 |
| Fertilizer | 9000 | 13.70 | 700,000 | 1067.10 | 700,000 | 1067.10 |
| Pesticides | 1000 | 1.50 | 100,000 | 152.40 | 100,000 | 152.40 |
| Miscellaneous (packaging, etc.) | 3000 | 4.60 | 200,000 | 304.90 | 200,000 | 304.90 |
| Irrigation use | 0 | 0.00 | 5,000,000 | 7,622.40 | 437,307 | 666.67 |
| Subtotal variable costs | 97,000 | 147.90 | 7,800,000 | 11,891.0 | 3,237,307 | 4935.2 |
| Fixed costs | ||||||
| Depreciation of hand-made agro tools (for human labor) | 10,000 | 15.20 | 10,000 | 15.20 | 10,000 | 15.20 |
| Depreciation of diesel or solar-powered pump | 0 | 0 | 937,086 | 1428.57 | 874,613.33 | 1333.33 |
| Subtotal fixed costs | 10,000 | 15.20 | 947,086 | 1443.80 | 884,613 | 1348.60 |
| Financial costs | 3567 | 5.00 | 291,570 | 444.00 | 137,397 | 209.46 |
| Total costs | 110,567 | 169.00 | 9,038,655 | 13,779.00 | 4,259,317 | 6493.26 |
| Crop Types | Average Production (kg/ha) | Average Selling Price (€/kg) |
|---|---|---|
| Millet | 449 | 0.38 |
| Sorghum | 305 | 0.35 |
| Cowpea | 186 | 0.40 |
| Peanut | 414 | 0.37 |
| Crop Types | No. of Plots (25 m2) | CFA/Plot | €/Plot |
|---|---|---|---|
| Salad | 20 | 5000 | 7.62 |
| Cabbage | 10 | 3000 | 4.57 |
| Tomato | 10 | 3500 | 5.34 |
| Mint | 10 | 6000 | 9.15 |
| Okra | 10 | 3500 | 5.34 |
| Description | Value | Unit |
|---|---|---|
| Radiation at standard test condition, Istc | 1 | kW/m2 |
| Solar yield degradation rate, dg | 0.5 | % |
| Peak power of PV system, Pp | 50 | kW |
| Performance ratio, Q | 60 | % |
| PV size for irrigation pump, Pirrigation | 2 | kW |
| Discount rate in Niger, d | 6 [45] | % |
| Grid tariff for electricity selling, Pel | 0.10 | €/kWh |
| Number of households | 400 | numbers |
| Annual electricity demand per household | 300 | kWh/year |
| Solar PV system cost | 1200 | €/kW |
| APV structure costs | 50 | €/kW |
| Repair, operation, maintenance costs | 2 | % of initial cost |
| Solar radiation data on an inclined surface (tilt at 15°) | 2244 (Meteonorm V. 8) | kWh/m2-year |
Publisher’s Note: MDPI stays neutral with regard to jurisdictional claims in published maps and institutional affiliations. |
© 2021 by the authors. Licensee MDPI, Basel, Switzerland. This article is an open access article distributed under the terms and conditions of the Creative Commons Attribution (CC BY) license (https://creativecommons.org/licenses/by/4.0/).
Share and Cite
Neupane Bhandari, S.; Schlüter, S.; Kuckshinrichs, W.; Schlör, H.; Adamou, R.; Bhandari, R. Economic Feasibility of Agrivoltaic Systems in Food-Energy Nexus Context: Modelling and a Case Study in Niger. Agronomy 2021, 11, 1906. https://doi.org/10.3390/agronomy11101906
Neupane Bhandari S, Schlüter S, Kuckshinrichs W, Schlör H, Adamou R, Bhandari R. Economic Feasibility of Agrivoltaic Systems in Food-Energy Nexus Context: Modelling and a Case Study in Niger. Agronomy. 2021; 11(10):1906. https://doi.org/10.3390/agronomy11101906
Chicago/Turabian StyleNeupane Bhandari, Srijana, Sabine Schlüter, Wilhelm Kuckshinrichs, Holger Schlör, Rabani Adamou, and Ramchandra Bhandari. 2021. "Economic Feasibility of Agrivoltaic Systems in Food-Energy Nexus Context: Modelling and a Case Study in Niger" Agronomy 11, no. 10: 1906. https://doi.org/10.3390/agronomy11101906
APA StyleNeupane Bhandari, S., Schlüter, S., Kuckshinrichs, W., Schlör, H., Adamou, R., & Bhandari, R. (2021). Economic Feasibility of Agrivoltaic Systems in Food-Energy Nexus Context: Modelling and a Case Study in Niger. Agronomy, 11(10), 1906. https://doi.org/10.3390/agronomy11101906