Article

Optimisation of Weed Control in Organic Processing Spinach (Spinacia oleracea L.): Impacts of Cultivar, Seeding Rate, Plant Spacing and Integrated Weed Management Strategy

1
Faculty of Bioscience Engineering, Ghent University, Coupure Links 653, 9000 Gent, Belgium
2
Research and Advice Centre for Agriculture and Horticulture (INAGRO VZW), Department of Organic Agriculture, Ieperseweg 87, 8800 Rumbeke-Beitem, Belgium
*
Author to whom correspondence should be addressed.
Agronomy 2021, 11(1), 53; https://doi.org/10.3390/agronomy11010053
Submission received: 30 November 2020 / Revised: 18 December 2020 / Accepted: 25 December 2020 / Published: 29 December 2020
(This article belongs to the Special Issue Integrated Weed Management Approaches and Decision Support Systems)

Abstract

:
Weed control in organic spinach for the processing market is challenging because of the low tolerance of weed contamination in the harvested produce and the limited physical weeding options. Optimisation of weed control systems is therefore urgently needed. Three field experiments with autumn spinach were carried out in organic fields to evaluate the impact of cultivar choice, seeding rate (300 and 400 seeds m−2), plant spacing management (10.5-cm-wide single rows and 21-cm-wide single or twin rows) and integrated weed management strategy (combinations of pre-sowing, pre-emergence and post-emergence tactics) on weed biomass and spinach yield and quality. Spinach cultivars with a planophile growth habit and a high growth rate were more weed suppressive than the cultivar with an erectophile growth habit and a slower growth rate. Spinach density was significantly negatively correlated with weed biomass and weed biomass fraction in the harvested produce, but significantly positively correlated with (marketable) spinach biomass and petiole fraction in the harvested produce. Narrow row spacing systems with post-emergence broadcast harrowing had the lowest weed biomass and weed biomass fraction but also the lowest (marketable) spinach biomass as a result of the thinning action of harrowing. Post-emergence harrowing is of key importance for reducing weed biomass in any integrated weed control strategy. Weediness was lowest in systems comprising flaming on false seedbed or in pre-emergence followed by post-emergence harrowing. To mitigate the risk of crop failure, the field should preferably be cropped with quickly growing spinach plants arranged in narrow spaced rows at high plant density and weeded by pre-sowing or pre-emergence flaming followed by post-emergence harrowing.

1. Introduction

Spinach is a quick-maturing, cool-season vegetable crop grown for both fresh and processing markets. In Belgium, spinach is grown on about 6000 ha annually. Only 1% of this total acreage is organically grown. Approximately 98% of total acreage is used for the processing industry where spinach is processed in “whole leaf” (leaf spinach) and chopped styles (chopped spinach) and afterwards frozen or canned. Despite the increasing demand for organic spinach, processing industry is curtailed by shortage in the supply chain. According to the Belgian processing industry, one out of two organic spinach cultures fails, mostly because of unacceptable levels of weed incidence at harvest. Indeed, spinach is a relatively poor competitor against weeds and heavily relies on weed control [1]. Many organic growers are reluctant to grow spinach as they fear unacceptable high production and labour costs for weed control: weed control accounts for more than half of total man-hour requirements, with from 10 [2] to 100 h ha−1 [3] spent on hand weeding.
Weeds in processing spinach crops are problematic because they contaminate the mown produce and cannot be mechanically separated from the spinach leaves [4]. Spinach processed in whole leaf has zero tolerance for weed contamination, as weeds remain visible in the end product. For chopped spinach, some weeds are permitted in small quantities, provided they do not affect appearance, or the processing or edible quality (taste/flavor, odor, health) of the produce. Not allowed are toxic weeds such as Solanum nigrum L. (black nightshade), Solanum tuberosum L. (potato) volunteers, Datura stramonium L. (Jimson weed) and Mercurialis annua L. (annual mercury), and weeds or weed parts that give chopped spinach a stringy appearance such as seed stems of Capsella bursa-pastoris (L.) Medik (shepherd’s purse) or stems of Convolvulus (bindweed) spp. and Persicaria amphibia (L.) Gray (water smartweed). Mown spinach should not contain more than 1% of Urtica (nettle) spp. (gives a black discoloration following blanching) and/or Stellaria media L. (common chickweed), by weight.
Weed control in spinach is challenging. Post-emergence weed control in organic spinach is delicate, as broadcast flex-tine harrowing, the most commonly applied method in post-emergence, should be undertaken no earlier than the 2-leaf stage (to avoid unacceptable crop uprooting) and end no later than the 5- to 6-leaf stage (to avoid unacceptable leaf damage). Usually this means a window of opportunity of only 2 weeks. Within this period, inter-row hoeing is also possible provided row spacing is greater than 20 cm. At the 4- to 6-leaf stage, hoe blades that enable slight ridging of the crop can be chosen to suppress intra-row weeds [3]. After the 6-leaf stage, hand weeding is the ultimate weed control option left to remove surviving weeds. Due to the narrow time window available for mechanical weed control and the narrow toolbox, weed control in post-emergence is barely flexible, and success heavily relies on dry weather conditions and phenological growth stages of weeds. Therefore, to decrease the need for hand weeding and enhance profitability, spinach growers are looking for indirect (preventive) and direct (cultural and curative) control strategies that may reduce the number and size of weeds to be controlled post-emergence. One of the more effective and widely adopted preventive strategies is the false seedbed technique. False seedbeds with spring tine harrowing, rolling harrowing [5] and flame weeding [5,6] all reduced weed numbers in fresh market spinach considerably, leading to substantial savings in labour time. To date, cultural measures such as cultivar choice and spatial arrangement (seeding rate, row spacing) have been poorly studied for weed suppressiveness. According to Fischer and Miles [7] and Schnieders [8], wider row spacing may allow hoeing, but tends to give the crop a more planophile appearance (considered less suitable for mechanical harvesting) and may lower the weed suppressiveness of the crop. Tei et al. [4] showed a 40% decrease in weed suppressiveness when spinach row spacing was widened from 12.5 cm to 25 cm. Living mulches showed a poor effect in direct weed control [9]. Studies on physical methods stressed the high weed control potential of pre-emergence flaming [10], post-emergence mechanical weeding with split-hoe, finger weeder [4] or precision hoes with torsion weeders [10] and post-emergence thermal inter-row weeding [4] in wide (20–25 cm) row spacing systems. Unfortunately, most studies except [4] dealt with fresh market spinach sown at a six-fold lower seeding rate relative to processing spinach and wider row spacing, or did not keep the seeding rate constant across treatments (e.g., [4,9]). None of the studies investigated the impact of control strategies on spinach quality (e.g., petiole fraction and spinach waste).
The objective of this study was to quantify the impact of cultivar, seeding rate, plant spacing management and various integrated weed management strategies on weediness, biomass and quality of organically grown processing spinach. Hereto, three complementary field experiments with autumn spinach (planted in late summer and harvested in autumn), being the most popular spinach type in Belgium, were performed. These experiments were designed to study the effects of different combinations of cultivars, seeding rates, plant spacing patterns, application timing of control measures (pre-sowing, pre-emergence, post-emergence) and type of treatment (flaming, harrowing, hoeing). Experiments were conducted under optimal conditions for spinach growth, e.g., proper fertilization, irrigation and insect and disease control.

2. Materials and Methods

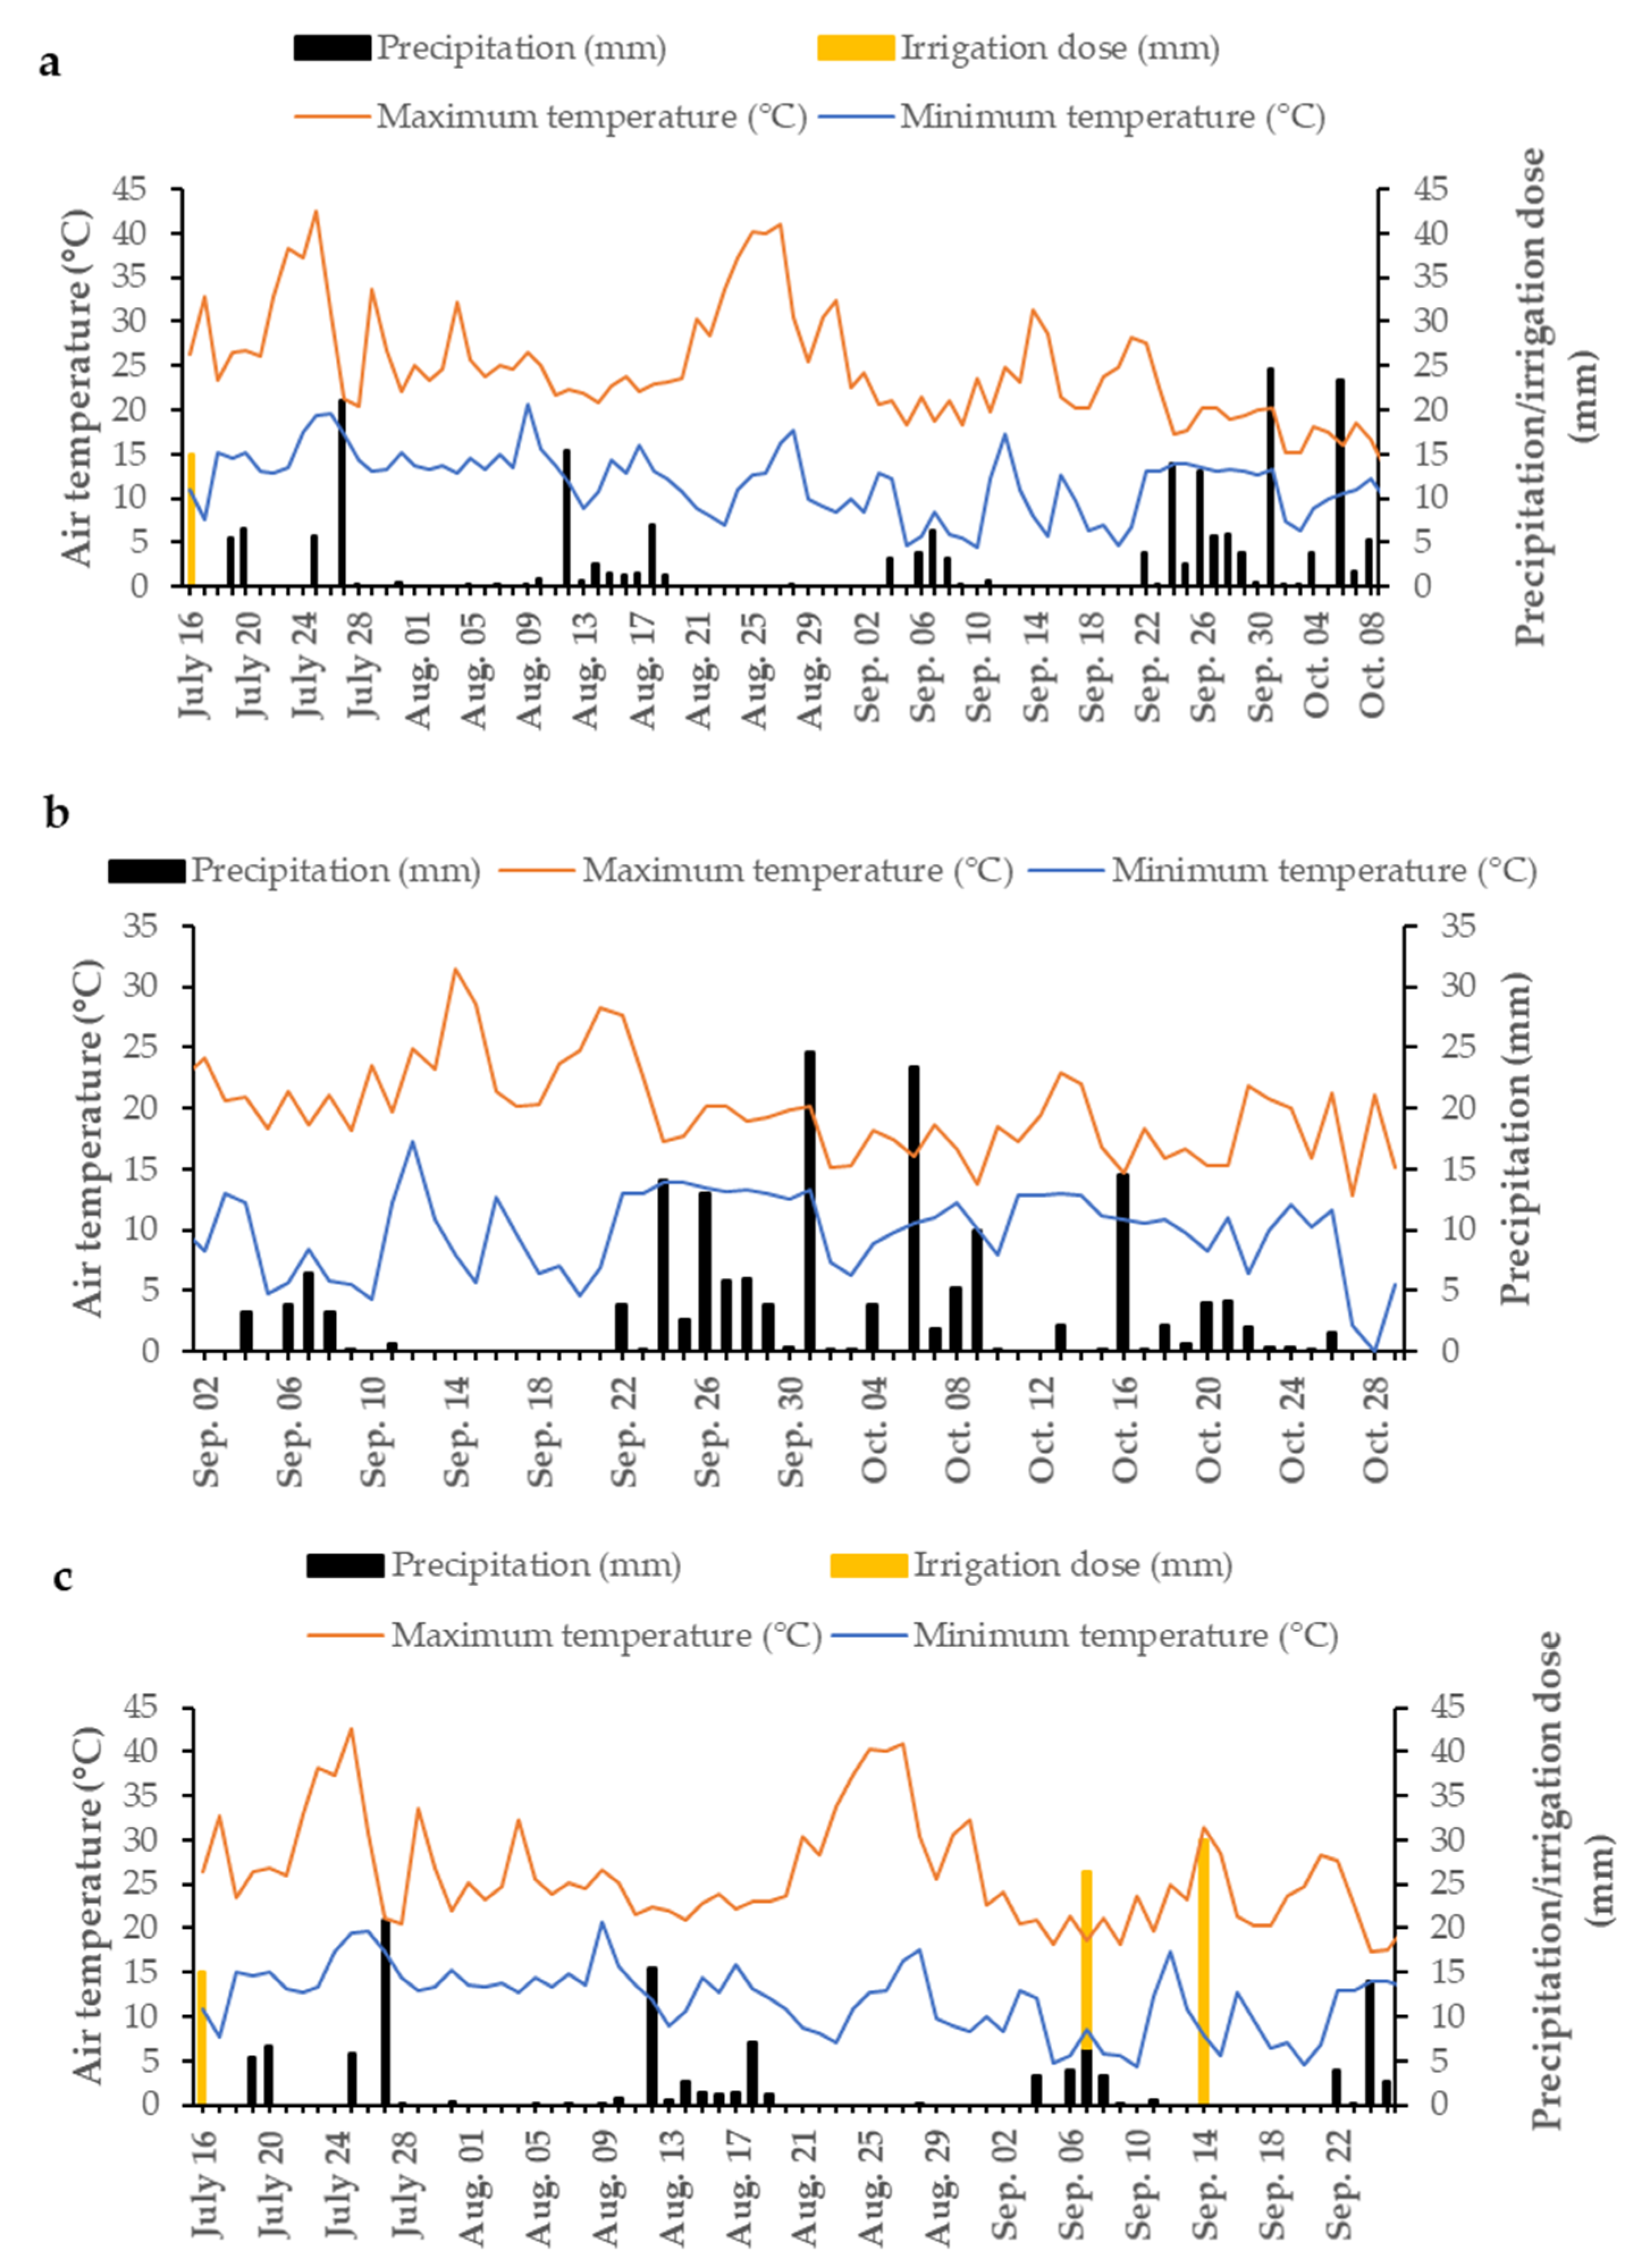
2.1. Field Experiments

Three experiments were conducted in the summer of 2019 on three certified organic fields of the Provincial Research and Advice Centre for Agriculture and Horticulture (Inagro vzw) in Beitem, Belgium (50°54′ N, 03°07′ E). The field experiments were established on sandy loam soil comprising 12.3% clay, 56.6% loam and 31.1% sand, with pH (KCl) and organic carbon content of 6.5 and 1.3% in experiment 1, 6.2 and 1.3% in experiment 2, and 6.3 and 1.2% in experiment 3. Experimental plots were not fertilized, since the experimental fields were cropped with grass-clover in 2018 and 2019. On 18 April 2019, the grass-clover ley was incorporated into the soil using a rotary tiller, and then the fields of experiments 1, 2 and 3 were cropped with pak choi (Brassica rapa var. chinensis (L.) Hanelt), left fallow (kept weed free using shallow cultivations) or cropped with Phacelia (Phacelia tanacetifolia L.), respectively, until the beginning of the experiment.
Prior to the installation of the false seedbeds (experiments 1 and 3), the soil was tilled to a depth of 35 cm using a subsoiler (Carré Neolab, Saint Martin des Noyers, France), and rotary (Kuhn HR, Höpfinger, Germany) harrowed to a depth of 10 cm. Immediately after the final false seedbed machinery pass (20 August in experiment 1, 7 August in experiment 3) (Table 1), spinach seeds were drilled in 1.5-m-wide beds at a sowing depth of 4 cm using a precision seed drill (Zürn D82PN, Schöntal-Westerhausen, Germany). In experiment 2, spinach was seeded on 3 September immediately following seedbed preparation (Table 1). One day after (false) seedbed preparation, the seedbank density in the 0–5 cm topsoil of experiments 1, 2 and 3 was 1421, 1207 and 2665 live seeds m−2, respectively, and was dominated by Poa annua L. (annual bluegrass) and U. urens with relative densities of 24.6% and 7.2% in experiment 1, 71.4% and 5.4% in experiment 2, and 26.7 and 29.5% in experiment 3. The seedling emergence method [11] was used to quantify seed density and followed the protocol described by De Cauwer et al. [12].
Daily rainfall, irrigation and average minimum and maximum air temperatures during the experimental periods were recorded (Figure 1). In the absence of adequate rainfall, experiments were irrigated to initiate weed flushes on false seedbed or promote crop emergence and growth.
Experiment 1 evaluated the effect of spinach cultivar and seeding rate on weed emergence and biomass, and spinach yield and quality using three F1 hybrid spinach cultivars (the fast planophile growing cultivar ‘Baboon’, the fast erectophile growing cultivar ‘Bufflehead’, and the slow planophile growing cultivar ‘Sonoma’) each seeded in 11-row beds at two seeding rates (300 germinable seeds m−2, the standard seeding rate in organic spinach production, and 400 germinable seeds m−2). At 100% germination, inter-row spacing was 10.5 cm and intra-row spacing 2.38 cm (rate of 300 seeds m−2) and 1.85 cm (rate of 400 seeds m−2) (Table 1). These distances were modified taking into account the actual germination percentage of the seedlots (77%, 89% and 95% for ‘Baboon’, ‘Bufflehead’ and ‘Sonoma’, respectively). Factorial combinations of cultivars and seeding rates were laid out in a randomised complete block design with six replicates. The experimental plot size was a bed of 10 m long and 1.5 m wide, comprising 11 rows. Spinach cultivars were resistant to mildew and bolting and particularly suitable for summer planting for autumn harvest.
Experiment 2 evaluated the effect of plant spacing management, i.e., the combination of row spacing pattern and associated weed control, on weed emergence and biomass and spinach yield and quality. Seeding rate (300 germinable seeds m−2) and spinach cultivar (‘Bufflehead’) were kept constant in this experiment (Table 1). Four plant spacing management systems were tested: (i) 10.5-cm-wide single rows without weed control, (ii) 10.5-cm-wide single rows with harrowing, (iii) 21-cm-wide single rows with inter-row hoeing, and (iv) 21-cm-wide twin rows with inter-row hoeing. Therefore, row spacing was either narrow (10.5 cm, the standard row spacing in organic processing spinach) or wide (21 cm). In contrast to narrow rows, wider rows allow post-emergence hoeing operations. The wide spacing comprised two alternatives: single rows 21 cm apart or twin rows. In the twin-row configuration, spinach was sown in paired rows, 10.5 cm apart, on 31.5 cm centres. We studied two alternative weed controls in each row spacing. In the narrow row spacing the options were (i) no post-emergence weed control and (ii) two post-emergence spring-tine harrow operations. In the wide row spacing the weeding was (i) one post-emergence inter-row hoeing operation in the single row configuration, and (ii) one in the twin-row configuration (21-cm-wide inter-row zone between twin rows only). Plant spacing management systems were arranged in a randomised complete block design with five replicates. The experimental plot size was a bed of 13 m long and 1.5 m wide, comprising 11 (10.5-cm-wide single rows), 6 (21-cm-wide single rows) or 8 (twin-row configuration) rows. As sufficient weed occurrence in post-emergence was needed for assessing weed suppressiveness of the cultivar, no false seedbed was included.
Experiment 3 investigated the effect of a false seedbed, pre-emergence weed control and post-emergence weed control on weed emergence and biomass, and spinach yield and quality using 12 integrated weed management strategies that comprised all factorial combinations of three false seedbed treatments (single flex-tine harrowing, single flaming and untreated), two pre-emergence flaming treatments (single flaming just before spinach cotyledons break through soil surface (BBCH 09), and no flaming) and two post-emergence harrowing treatments (two broadcast harrowing operations at 2- and 4-leaf stage of spinach, and no harrowing) (Table 1). In Belgium, standard weed control in organic spinach is based on consecutive harrowing in false seedbed, in pre-emergence and post-emergence. In soils with high weed pressure, pre-emergence harrowing is sometimes replaced by pre-emergence flaming. The experiment was designed as a split-split-plot layout with five replications, with the two post-emergence harrowing treatments in the main plots, the three false seedbed treatments in the subplots and the two pre-emergence flaming treatments in the subsubplots, for a total of 60 subsubplots. The experimental plot size was a bed 13 m long and 1.5 m wide, comprising 11 rows.

2.2. Weeding Equipment

Physical weed control machinery used after the initial seedbed preparation comprised non-soil disturbing thermal machines and soil disturbing mechanical machines. All machines were tractor-driven and operated at a driving speed of 5 km h−1, except for the flame weeders that operated at 1.2 km h−1. Hoeing operations in experiment 2 were conducted manually using a farm handtool stirrup hoe with a working width of 17 cm and working depth of 2 cm. Harrowing operations in experiments 2 and 3 were performed using a Treffler precision tined harrow TS.960.M35 from Treffler Maschinenbau (Treffler, Pottmes-Echsheim, Germany: http://www.treffler.net) with a working width of 3 m, a tine length of 50 cm and stroke width of 28 mm. Working depth was 2 cm and operating speed 4–5 km h−1 in false seedbed and pre-emergence, and 2–2.5 km h−1 in post-emergence. Flaming in experiment 3 was performed with a 3-m-wide propane flamer (T.H.BR. 3000; Vanhoucke Machine Engineering, Moorslede, Belgium; https://vanhoucke.engineering). Driving speed was 1.2 km h−1 (18.2 L propane per ha) in false seedbed and 3 km h−1 (6.7 L propane per ha) in pre-emergence.

2.3. Measurements

Plant responses to management strategies imposed in the three experiments were assessed by determining weed and crop densities, weed biomass parameters (on fresh weight basis) and spinach yield and quality parameters (on fresh weight basis). All measurements were taken from the central 3.65 m2 area of each plot, i.e., 0.73 × 5.0 m, 0.84 × 4.34 m and 0.63 × 5.79 m in plots with single rows at 10.5 cm (experiments 1, 2 and 3), single rows at 21 cm (experiment 2) and twin rows at 21 cm (experiment 2), respectively.
Weed density (plants m−2) was assessed by regular counting of all emerged live weeds present in ten 10.5 dm2 rectangles laid down in a 0.5 × 1.0 m grid within the central area of each plot. Rectangle dimensions were adjusted to the row spacing system: 21 cm by 50 cm in plots with single rows with inter-row distance of 10.5 or 21 cm (experiments 1, 2 and 3), and 31.5 cm by 33 cm in plots with twin rows at 21 cm (centre to centre) (experiment 2). Rectangles were centred over one row (wide-row system with single rows), or two rows (narrow-row system with single rows, wide-row system with twin rows). To study the relationship between intra-row spinach density (plants m−1) and intra-row weed density (plants m−1), weed countings in experiment 2 were separated into intra-row seedling (i.e., seedlings growing in the 5-cm-wide intra-row zone) and inter-row seedlings. Weed density was recorded on false seedbed prior to the first weed control operation to check uniformity of emergence (all experiments), in pre-emergence before any treatment (experiments 2 and 3), in post-emergence prior to the first weed control pass (experiments 2 and 3), and after the first post-emergence weed control pass (experiment 3). Thereafter, countings were stopped to avoid substantial crop damage.
Crop density (plants m−2) was determined 6–9 days after sowing, prior to any post-emergence weed control pass (experiments 1, 2 and 3) and on 26 August, 3 days after the second harrowing pass in experiment 3, by counting numbers of plants along 50 cm of row at 10 randomly chosen sites within the central measuring zone of each plot.
When the crop height reached 25 cm (i.e., harvest maturity), all spinach and weed plants within the central area were manually cut off at ground level in order to study the relationship between crop biomass and weed biomass. This cutting height is a deviation of the cutting height of spinach harvesters that mow spinach plants at 5–7 cm above ground level to reduce the fraction of petioles and weeds in the harvested produce.
Immediately after manual harvest, fresh cut biomass was manually sorted into marketable spinach (green spinach leaves), non-marketable spinach (cotyledons, petiole parts disconnected from blades, yellow leaves, leaves infested with downy mildew Peronospora farinosa f. sp. spinaciae, leaves clearly damaged by leaf-feeding insects), and weeds. Spinach biomass is the combined weight of marketable and non-marketable spinach. The weed biomass fraction (%) is the ratio of weed biomass to total biomass, multiplied by 100. To determine the share of petioles in the total weight of marketable spinach (hereafter called petiole fraction), a representative sample of 1 kg was taken from the marketable spinach. Leaf petioles were detached from the leaf blades with scissors and weighed. The weight of petiole material divided by the total combined weights (blades plus petioles) multiplied by 100 is the percentage, by fresh weight, of petiole material. The share of spinach waste (%) is the ratio of the non-marketable spinach biomass to spinach biomass, multiplied by 100.

2.4. Statistical Analysis

Spinach and weed data were analysed in R (version 3.4.3.; R Core Team, Vienna, Austria) [13]. Normality and homoscedasticity were checked using a Q-Q plot and Levene test, respectively. No data transformation was needed. Data were analysed formally with analysis of variance as a randomised complete block design with one (experiment 2: plant spacing management system) or two factors (experiment 1: cultivar and seeding rate) or as a split-split-plot design, with main factor post-emergence harrowing treatment, subfactor false seedbed treatment and subsubfactor pre-emergence flaming treatment (experiment 3) according to Gomez and Gomez [14]. Linear regression analyses were performed on the data of experiment 1 to study relationships among spinach parameters and between spinach parameters and weed biomass. Differences between treatment means were analysed using Fisher’s Least Significant Difference (LSD) test at p < 0.05, according to Gomez and Gomez [14]. Reductions in spinach density as a result of harrowing was analysed using paired t-tests and by calculating Cohen’s d effect sizes.

3. Results

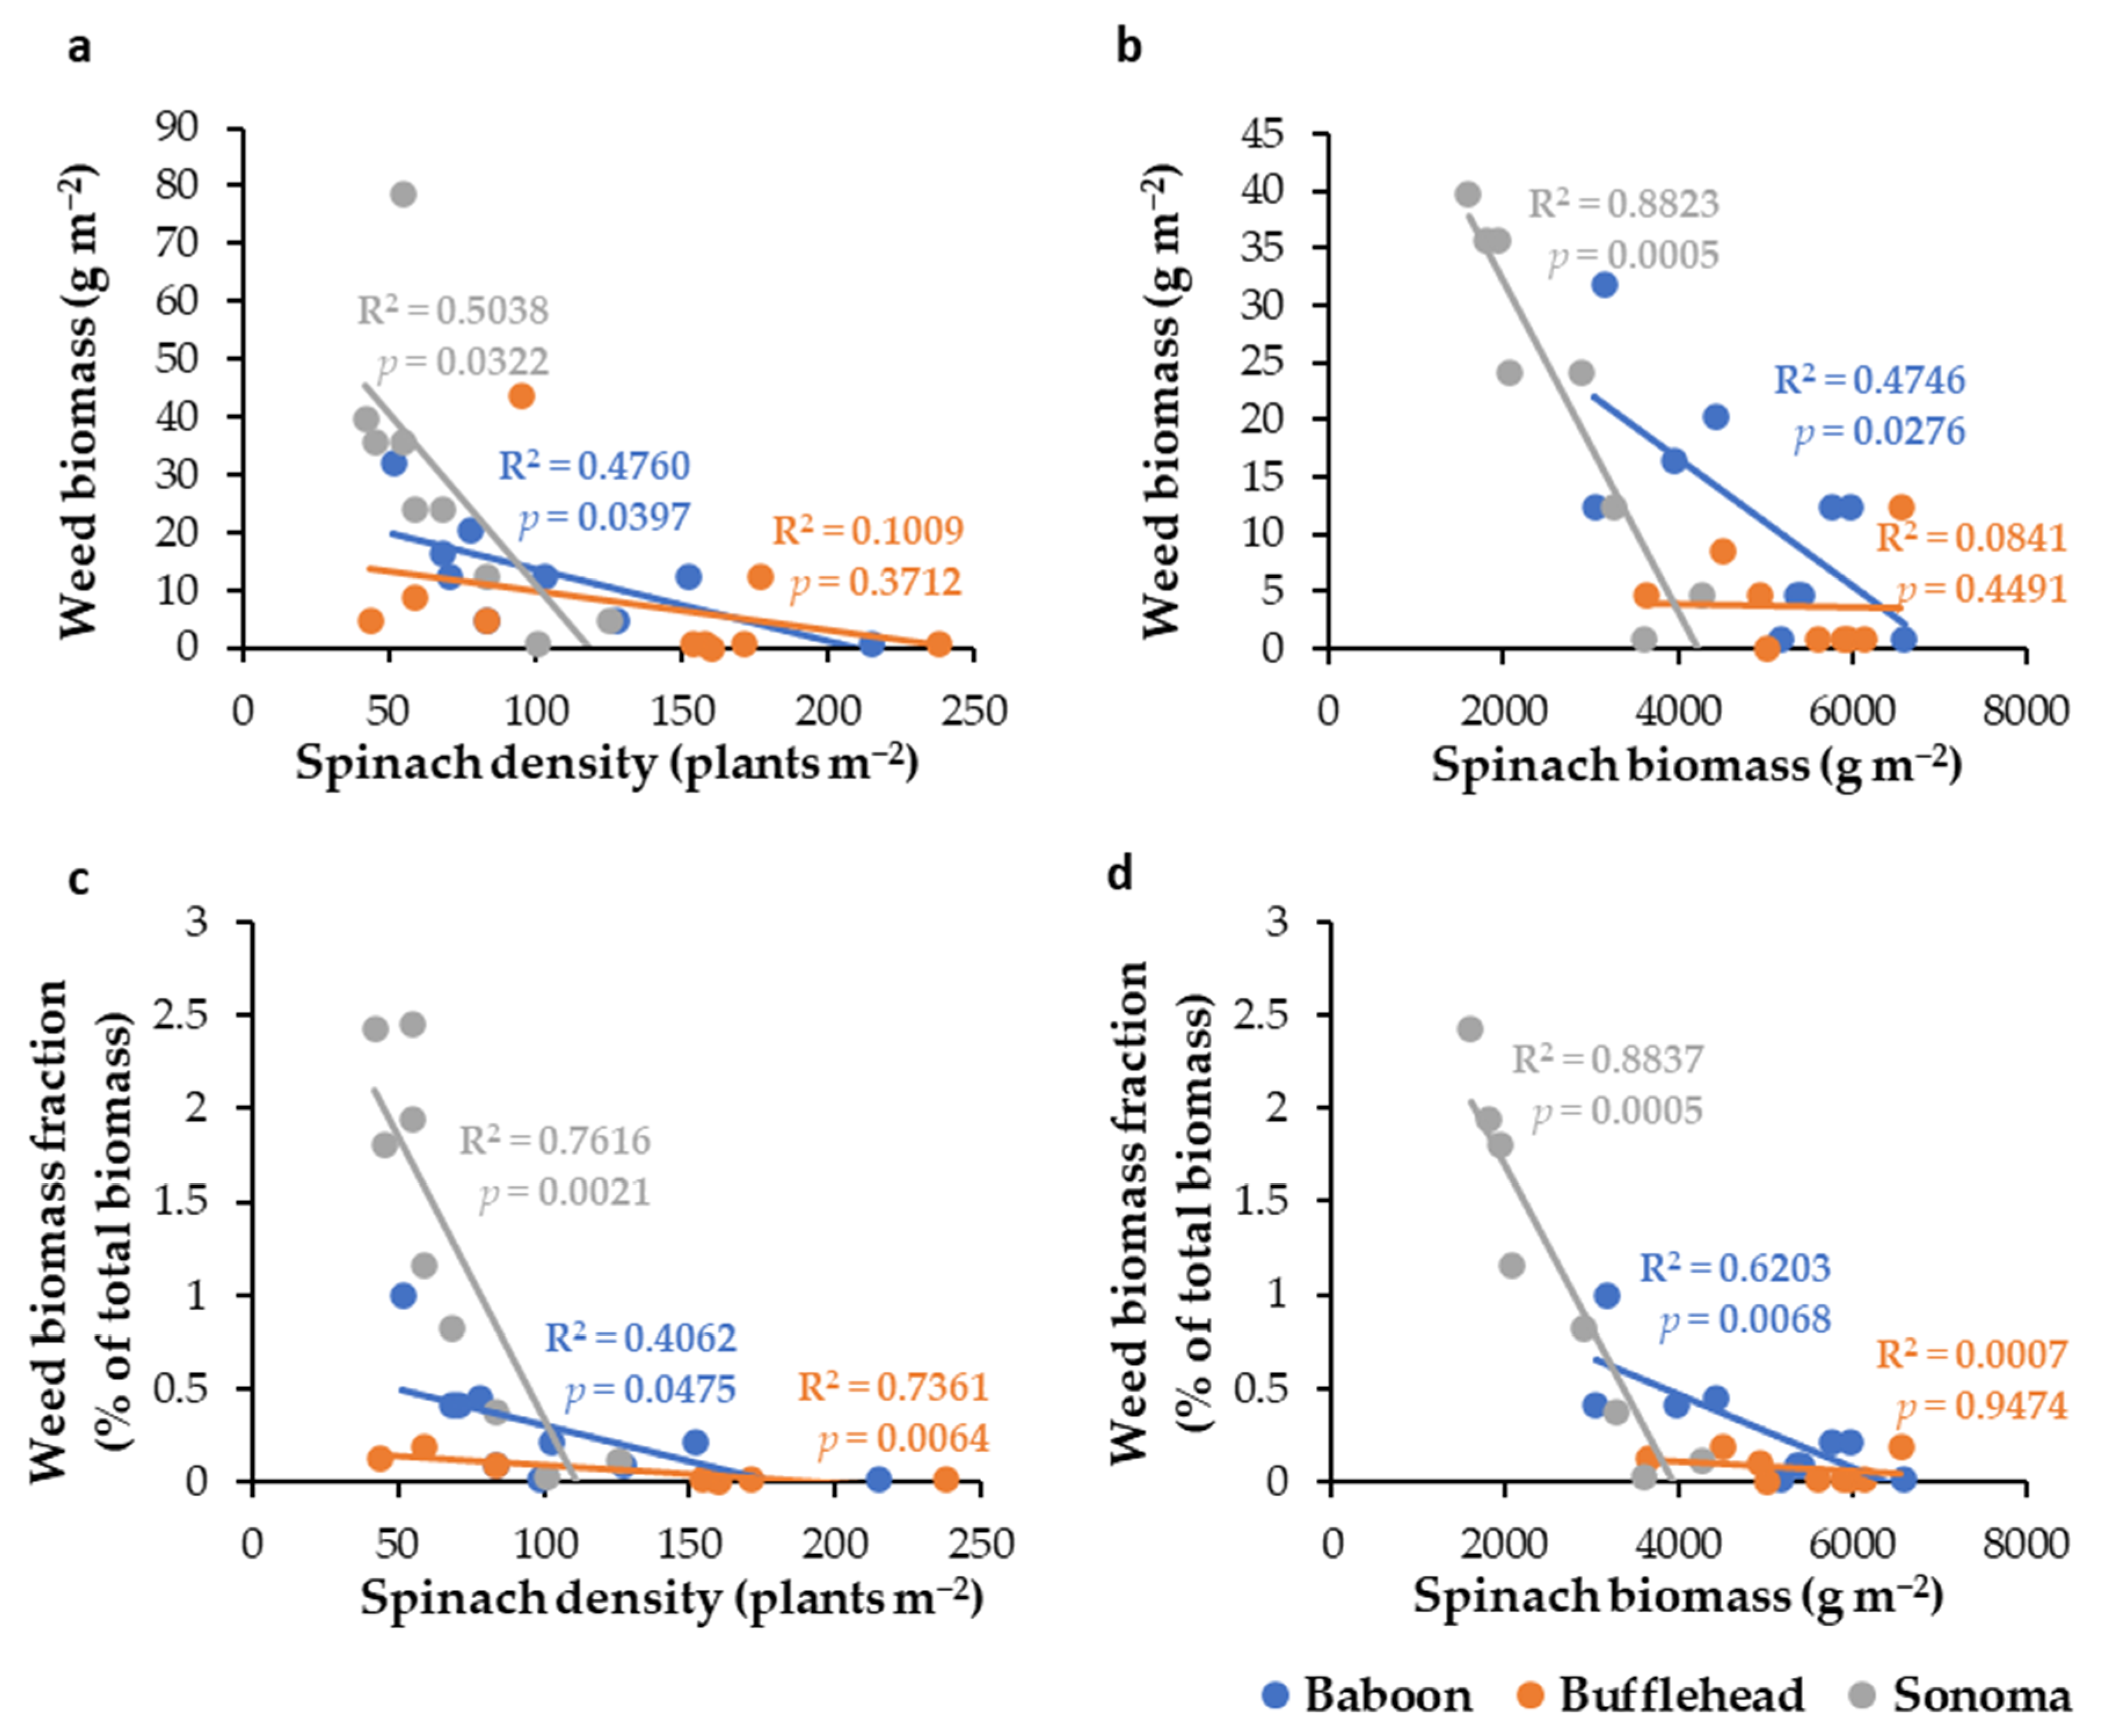
3.1. Impact of Spinach Cultivar and Seeding Rate (Experiment 1)

Weed biomass, weed biomass fraction, spinach biomass, marketable spinach biomass, spinach waste and petiole fraction were significantly affected by cultivar but not by seeding rate (Table 2). Relative to the cultivars ‘Bufflehead’ and ‘Baboon’, the cultivar ‘Sonoma’ had 3- to 5-fold higher weed biomass, 5- to 15-fold higher weed biomass fraction, but 1.7- to 2.1-fold lower spinach biomass, marketable spinach biomass, spinach waste and petiole fraction.
At plot level, weed biomass and weed biomass fraction significantly (p < 0.05) decreased with increasing spinach density and total spinach biomass, irrespective of spinach cultivar except for Bufflehead (Figure 2). The highest reduction rates in weed biomass and weed biomass fraction were obtained with cultivar ‘Sonoma’, showing 6.0 g and 0.3 percentage points decreases with every 10 additional spinach plants within the range of 42–125 plants m−2, respectively. The cultivar ‘Bufflehead’ showed the lowest reduction rates, with respective decreases of 0.6 g (not significant) and 0.01 percentage points with every additional 10 spinach plants within the range of 44–238 plants m−2. The cultivar ‘Baboon’ showed intermediate values, with 1.3 g and 0.04 percentage points decrease per 10 plants within the range of 55–215 plants m−2. Every 100 additional grams of spinach biomass reduced total weed biomass and weed biomass fraction by 0.01 (‘Bufflehead’, not significant) to 1.4 (‘Sonoma’) g m−2 and by 0.02 (‘Bufflehead’, not significant) to 0.09 (‘Sonoma’) percentage points, respectively.
Spinach biomass, marketable spinach biomass and petiole fraction were significantly increased by increasing spinach density, irrespective of cultivar (Figure 3). Every 10 additional spinach plants, increased spinach biomass by 107–294 g m−2, marketable spinach biomass by 86–198 g m−2 and petiole fraction by 0.7–1.0 percentage points, with the lowest values for ‘Bufflehead’ and the highest values for ‘Sonoma’. Spinach waste fraction was not affected by spinach density (Figure 3).

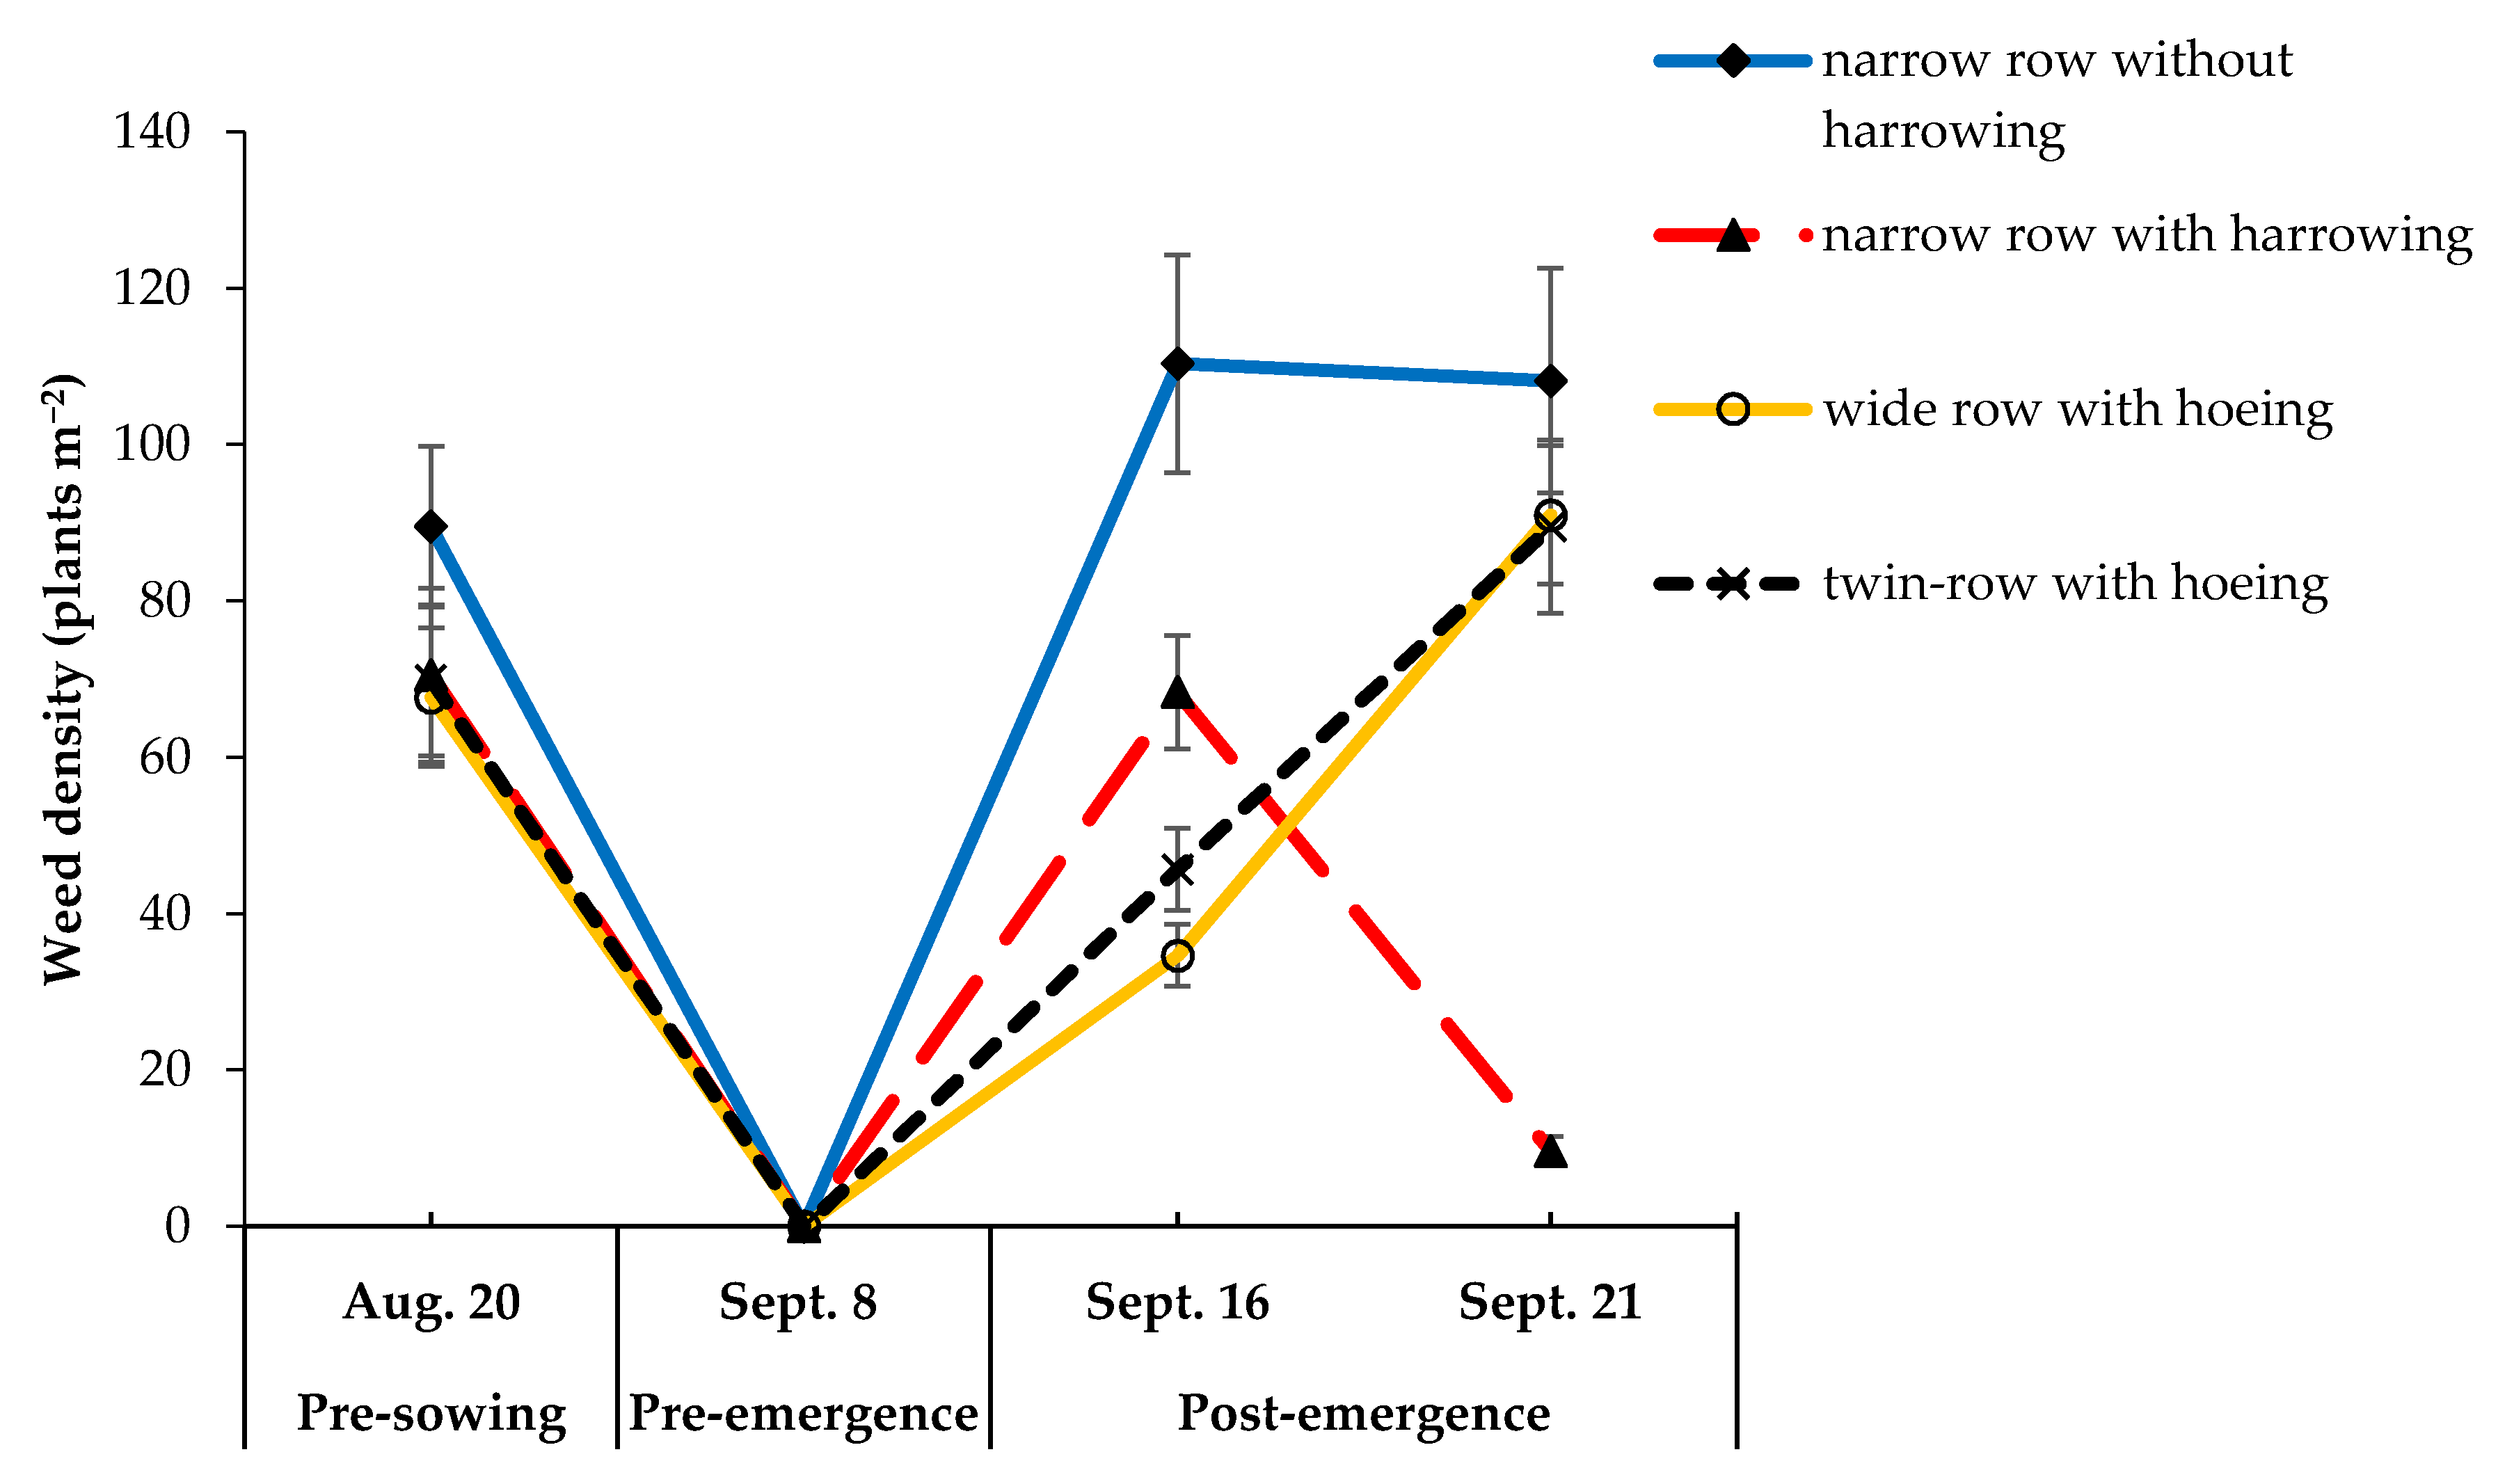
3.2. Impact of Plant Spacing Management Systems (Experiment 2)

As seeding rate was kept constant across plant spacing management systems, spinach densities (165–192 plants m−2) prior to first post-emergence treatment were not significantly different across plant spacing management systems.
Plant spacing management significantly (p < 0.001) affected weed biomass and weed biomass fraction (Table 3). Weed biomass and weed fraction was significantly lowest in a narrow-row system with post-emergence harrowing and significantly highest in narrow-row systems without harrowing (Table 3). Wide-row systems with single or twin rows with post-emergence hoeing showed intermediate values and did not differ in weed biomass and weed biomass fraction. The narrow-row system with harrowing in post-emergence showed a 3- to 4-fold lower weed biomass and a 2.5- to 4.8-fold lower weed biomass fraction relative to other row spacing systems. Intra-row weed density of systems lacking intra-row weed control (all systems except the harrowed narrow-row system) significantly reduced with increasing intra-row spinach density within the range of 21–35 spinach plants per meter (Figure 4). At higher intra-row spinach densities (35 to 47 plants per meter), no further decrease in intra-row weed density was observed.
On 21 September, five days after the first harrowing pass, harrowing significantly reduced weed density by 85% relative to weed density on 16 September (Figure 5).
Apart from weed biomass parameters, plant spacing management also significantly affected all spinach yield and quality parameters (Table 3). Total spinach biomass and marketable spinach biomass were, respectively, 18.5–22.6% and 31.3–39.2% higher in a narrow-row system without harrowing and wide-row systems with hoeing than in a narrow-row system with harrowing (Table 3). Spinach waste and spinach waste fraction were respectively 3.6–20.5% and 11.9–18.12% (significant) lower in hoed wide-row systems with single or twin rows than in narrow-row systems. Petiole fraction was significantly 15.8–28.8% lower in a harrowed narrow-row system than in all the other plant spacing management systems. Wide-row management systems (single and twin rows) revealed no significant differences in spinach biomass, marketable spinach biomass, spinach waste, spinach waste fraction and petiole fraction. Compared to an unharrowed narrow-row system, a harrowed narrow-row system had significantly lower spinach biomass (−18.4%), marketable spinach biomass (−23.9%) and petiole fraction (−22.3%), but significantly lower weed biomass (−83.6%) and weed biomass fraction (−79.3%). Spinach waste and spinach waste fraction were not affected by harrowing.

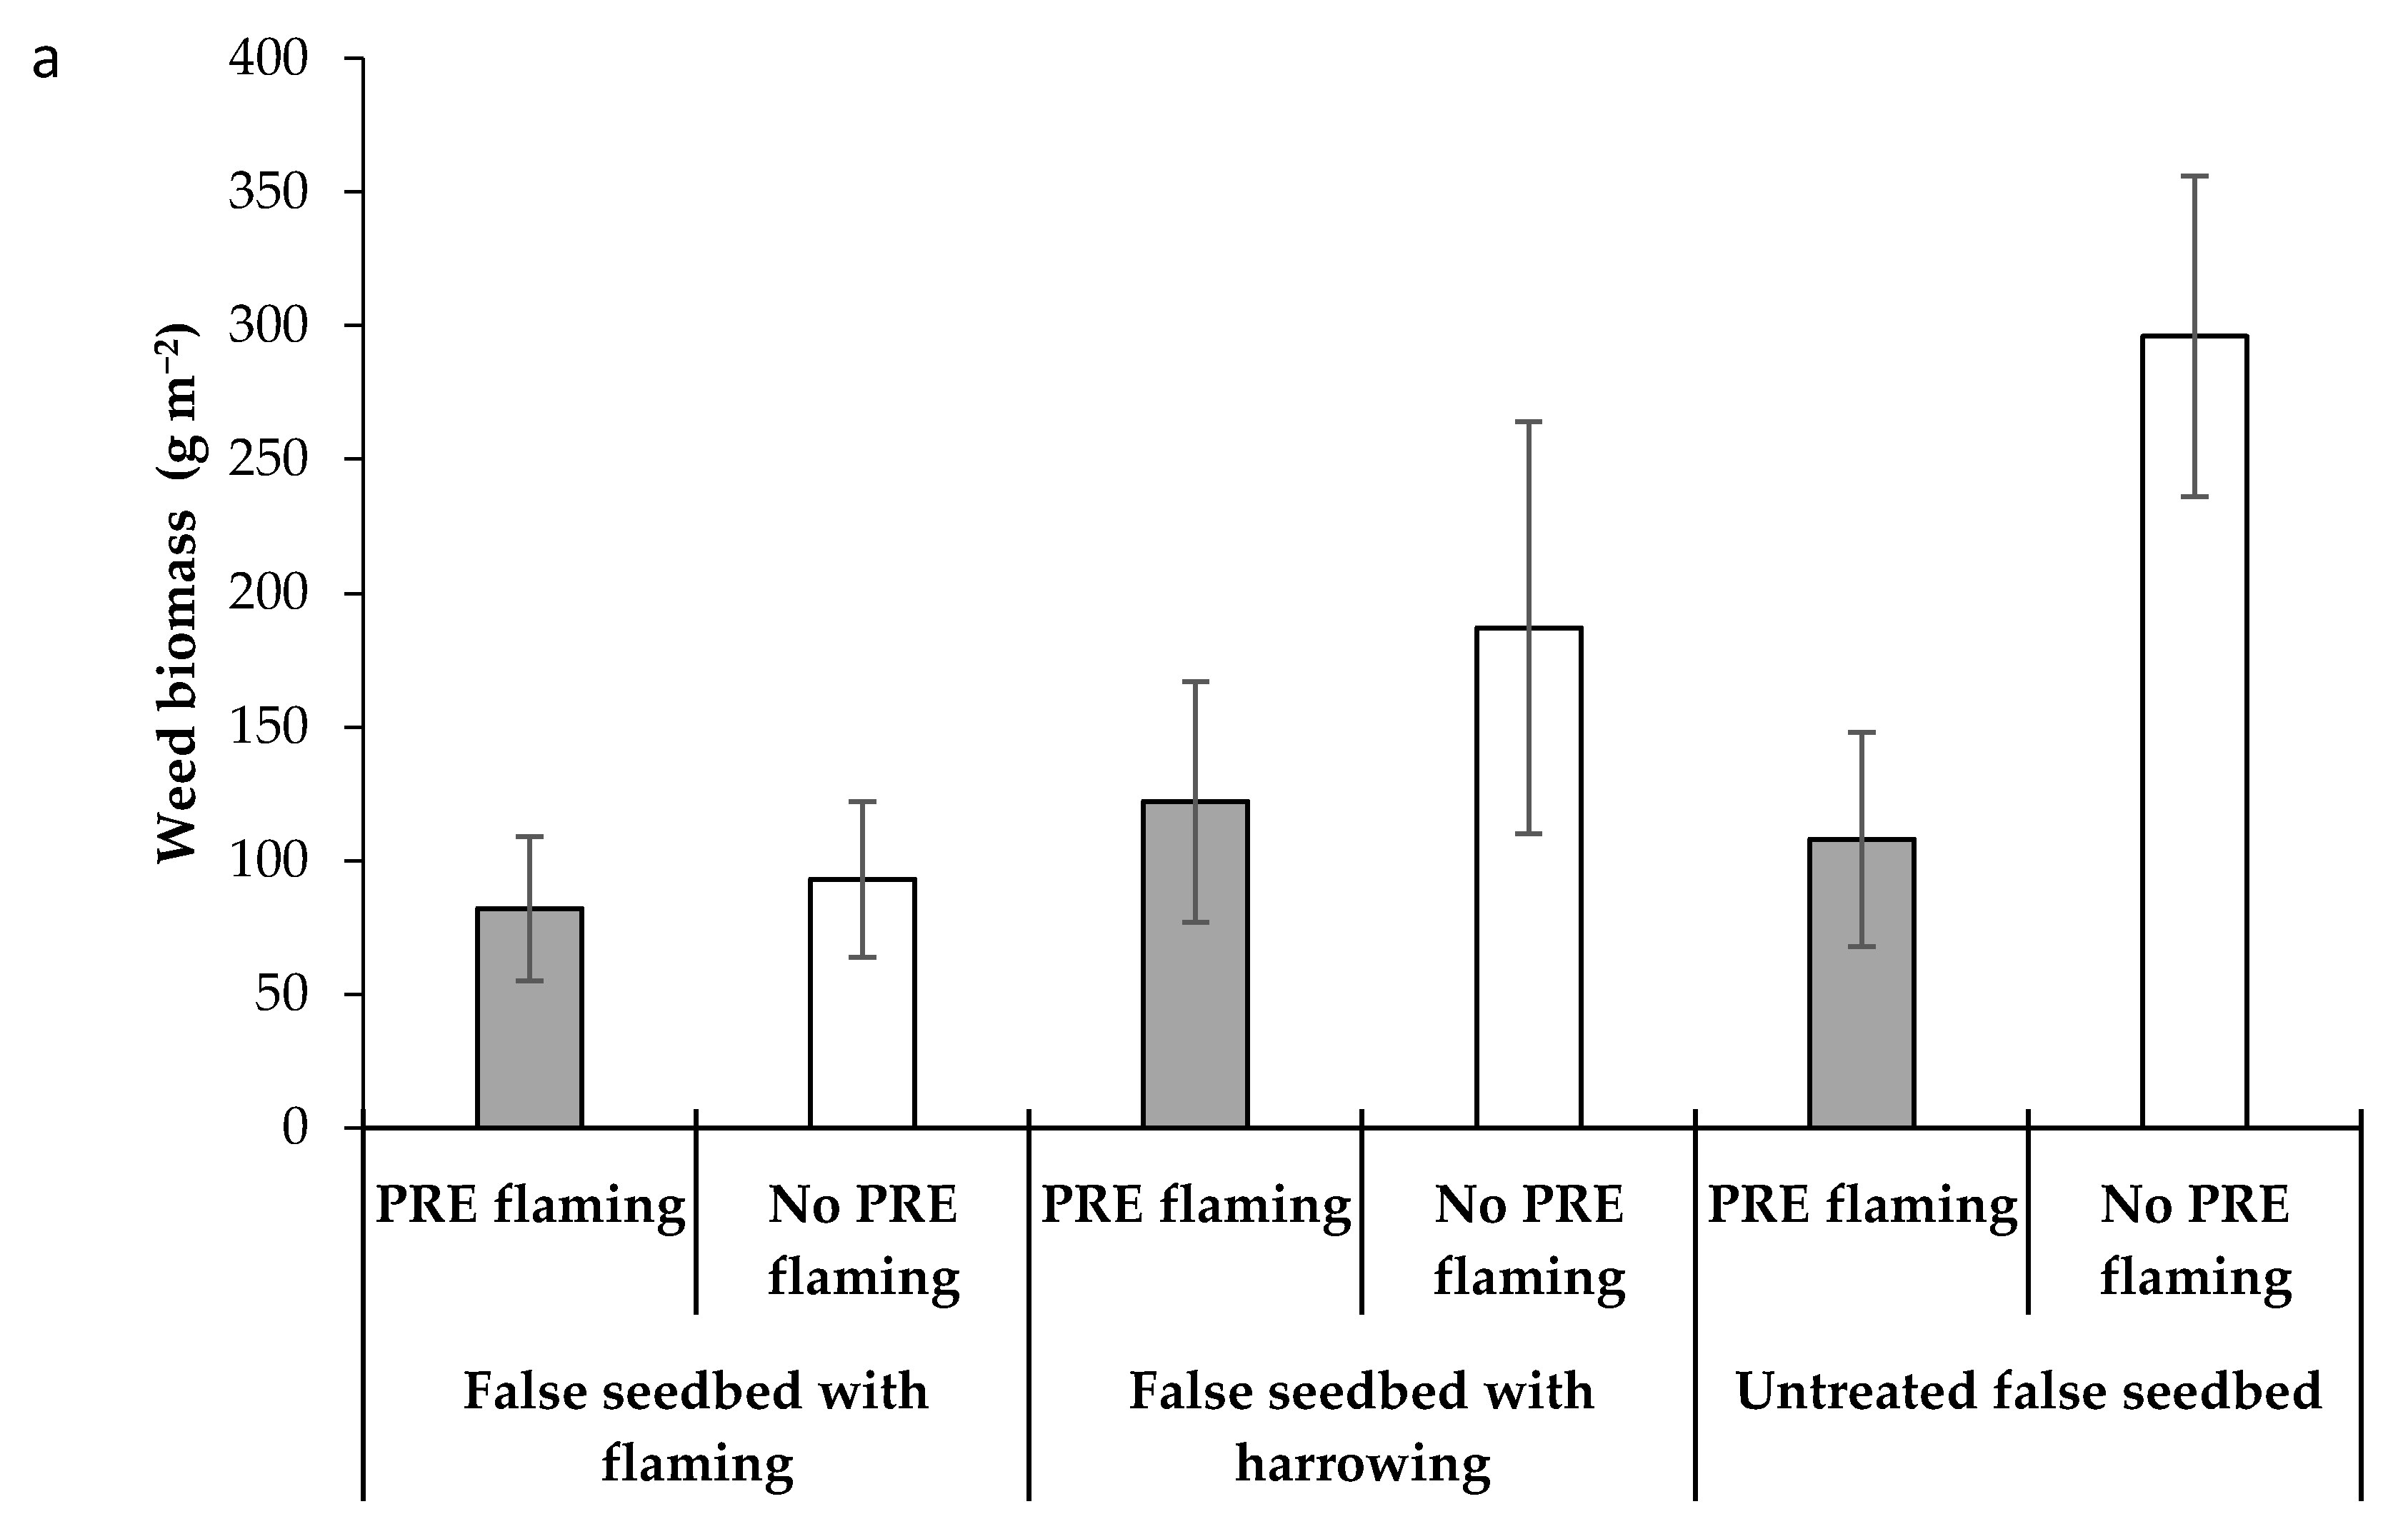
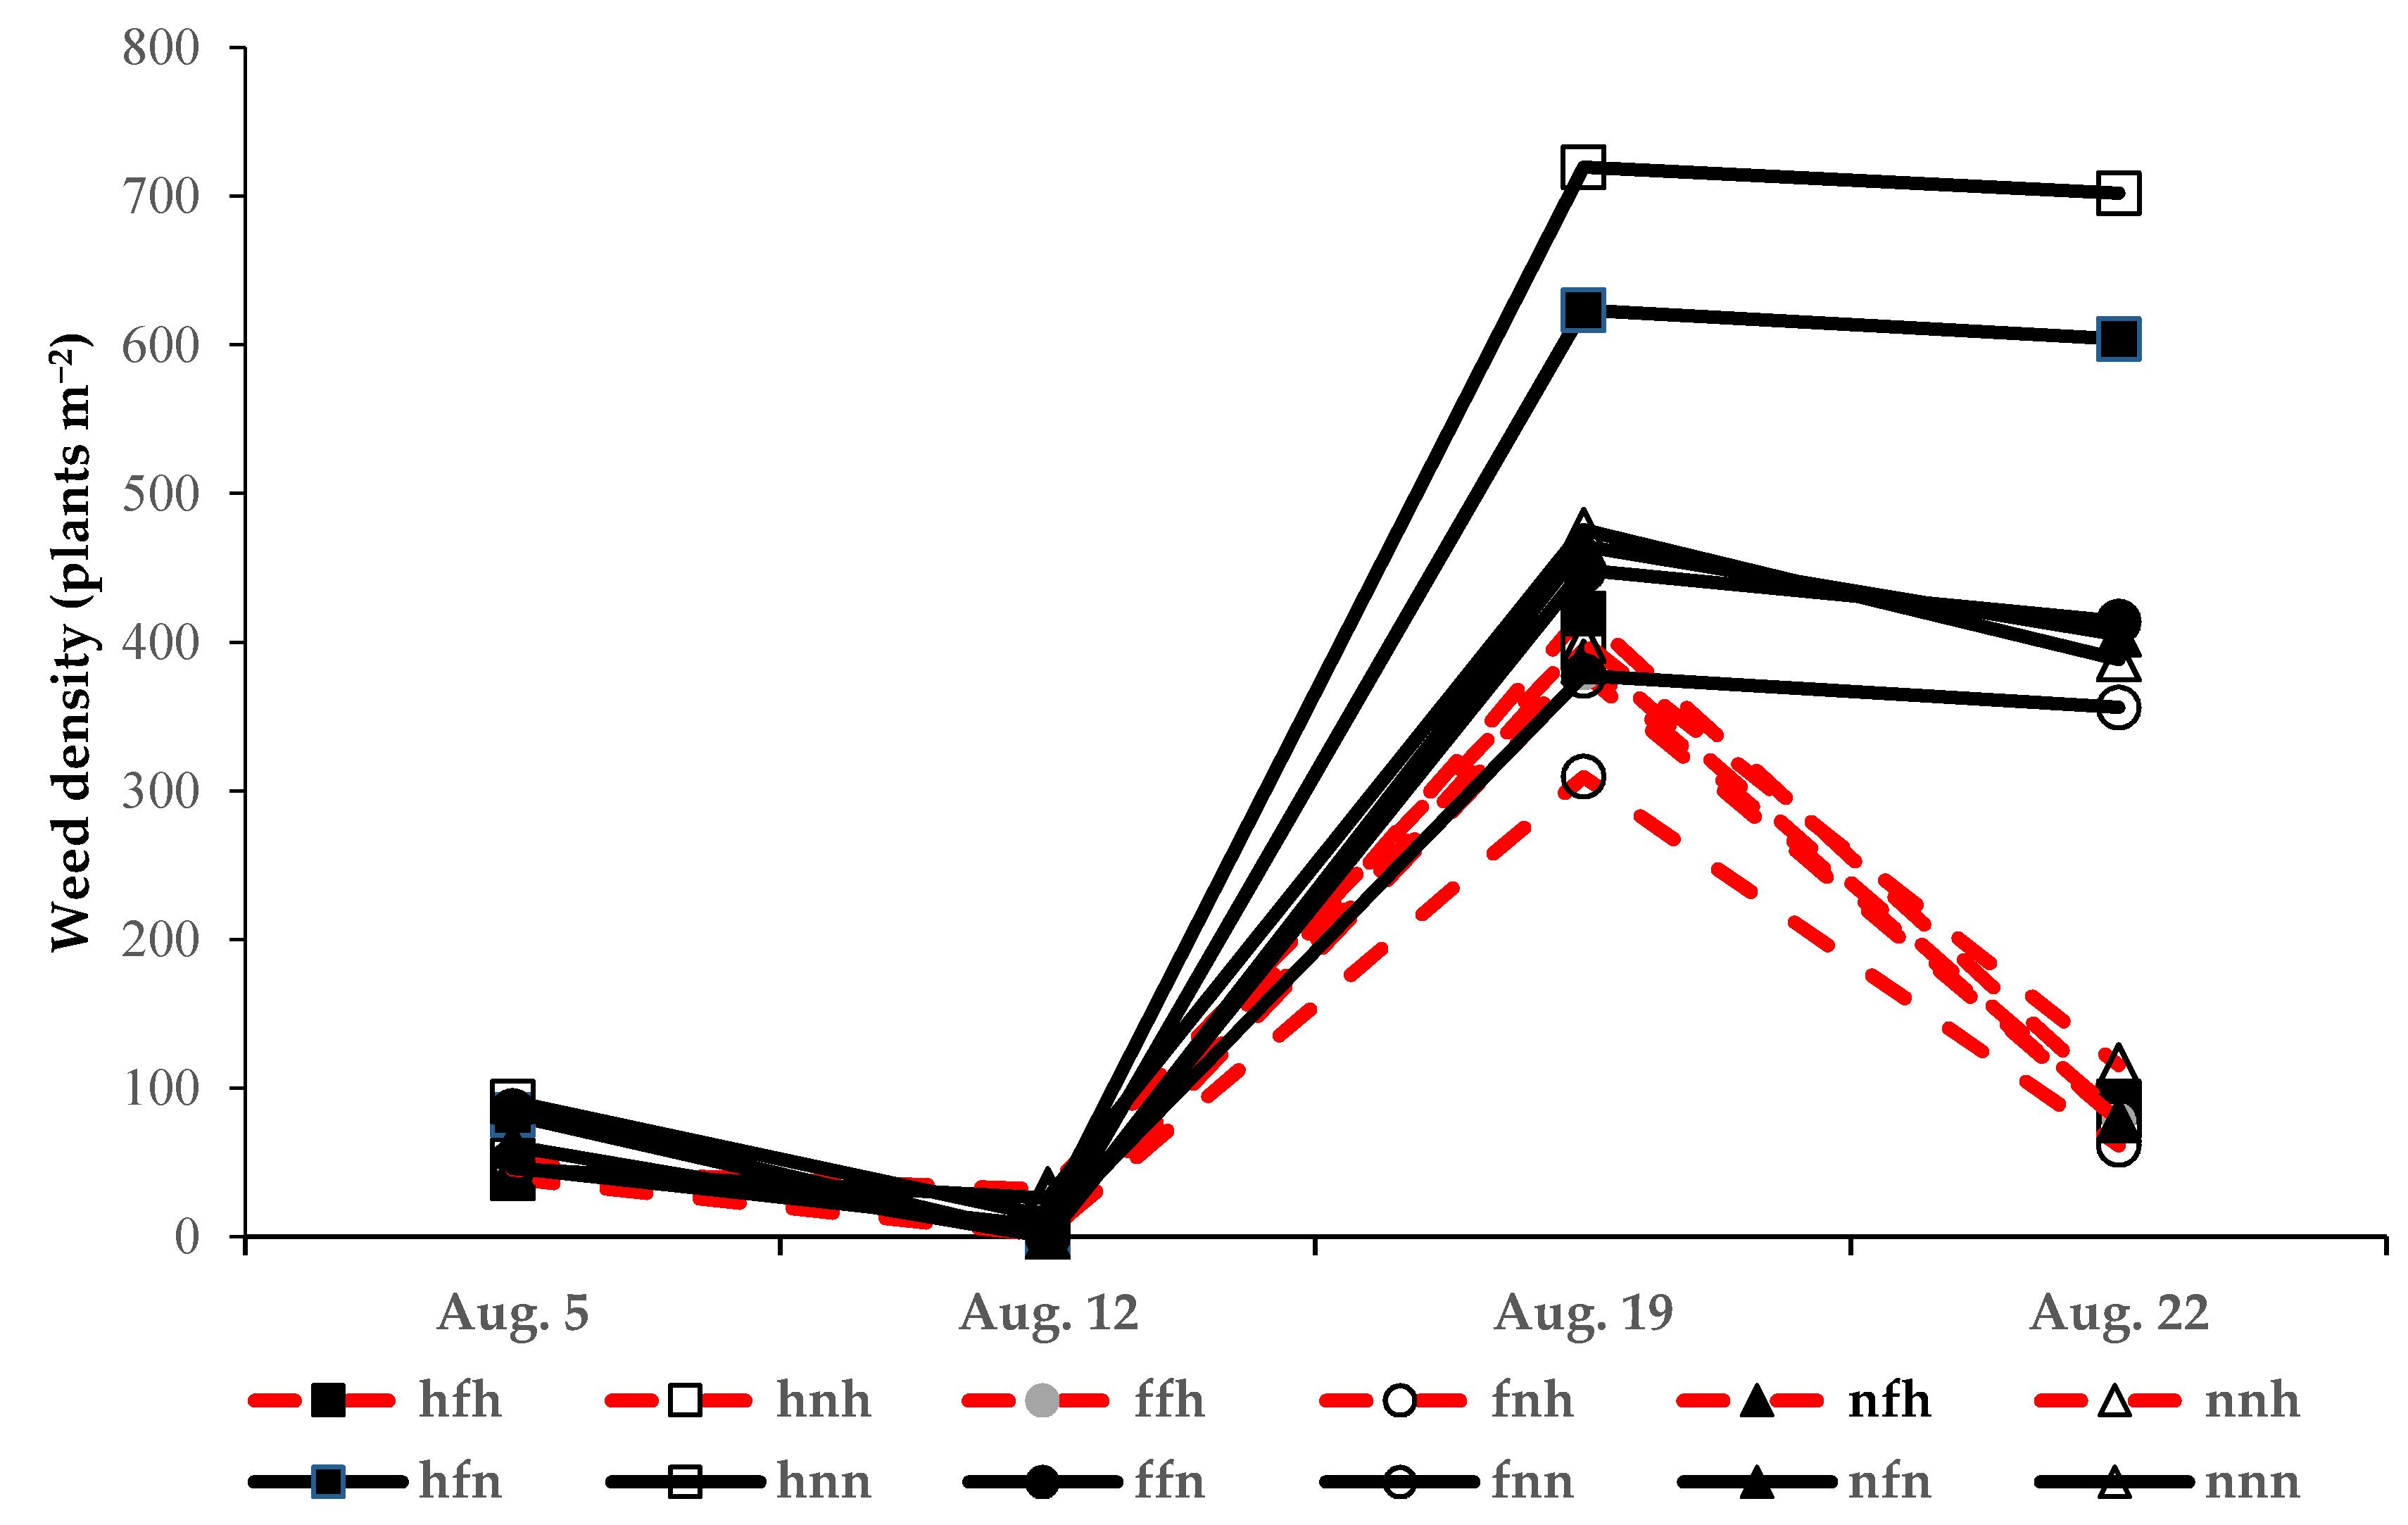
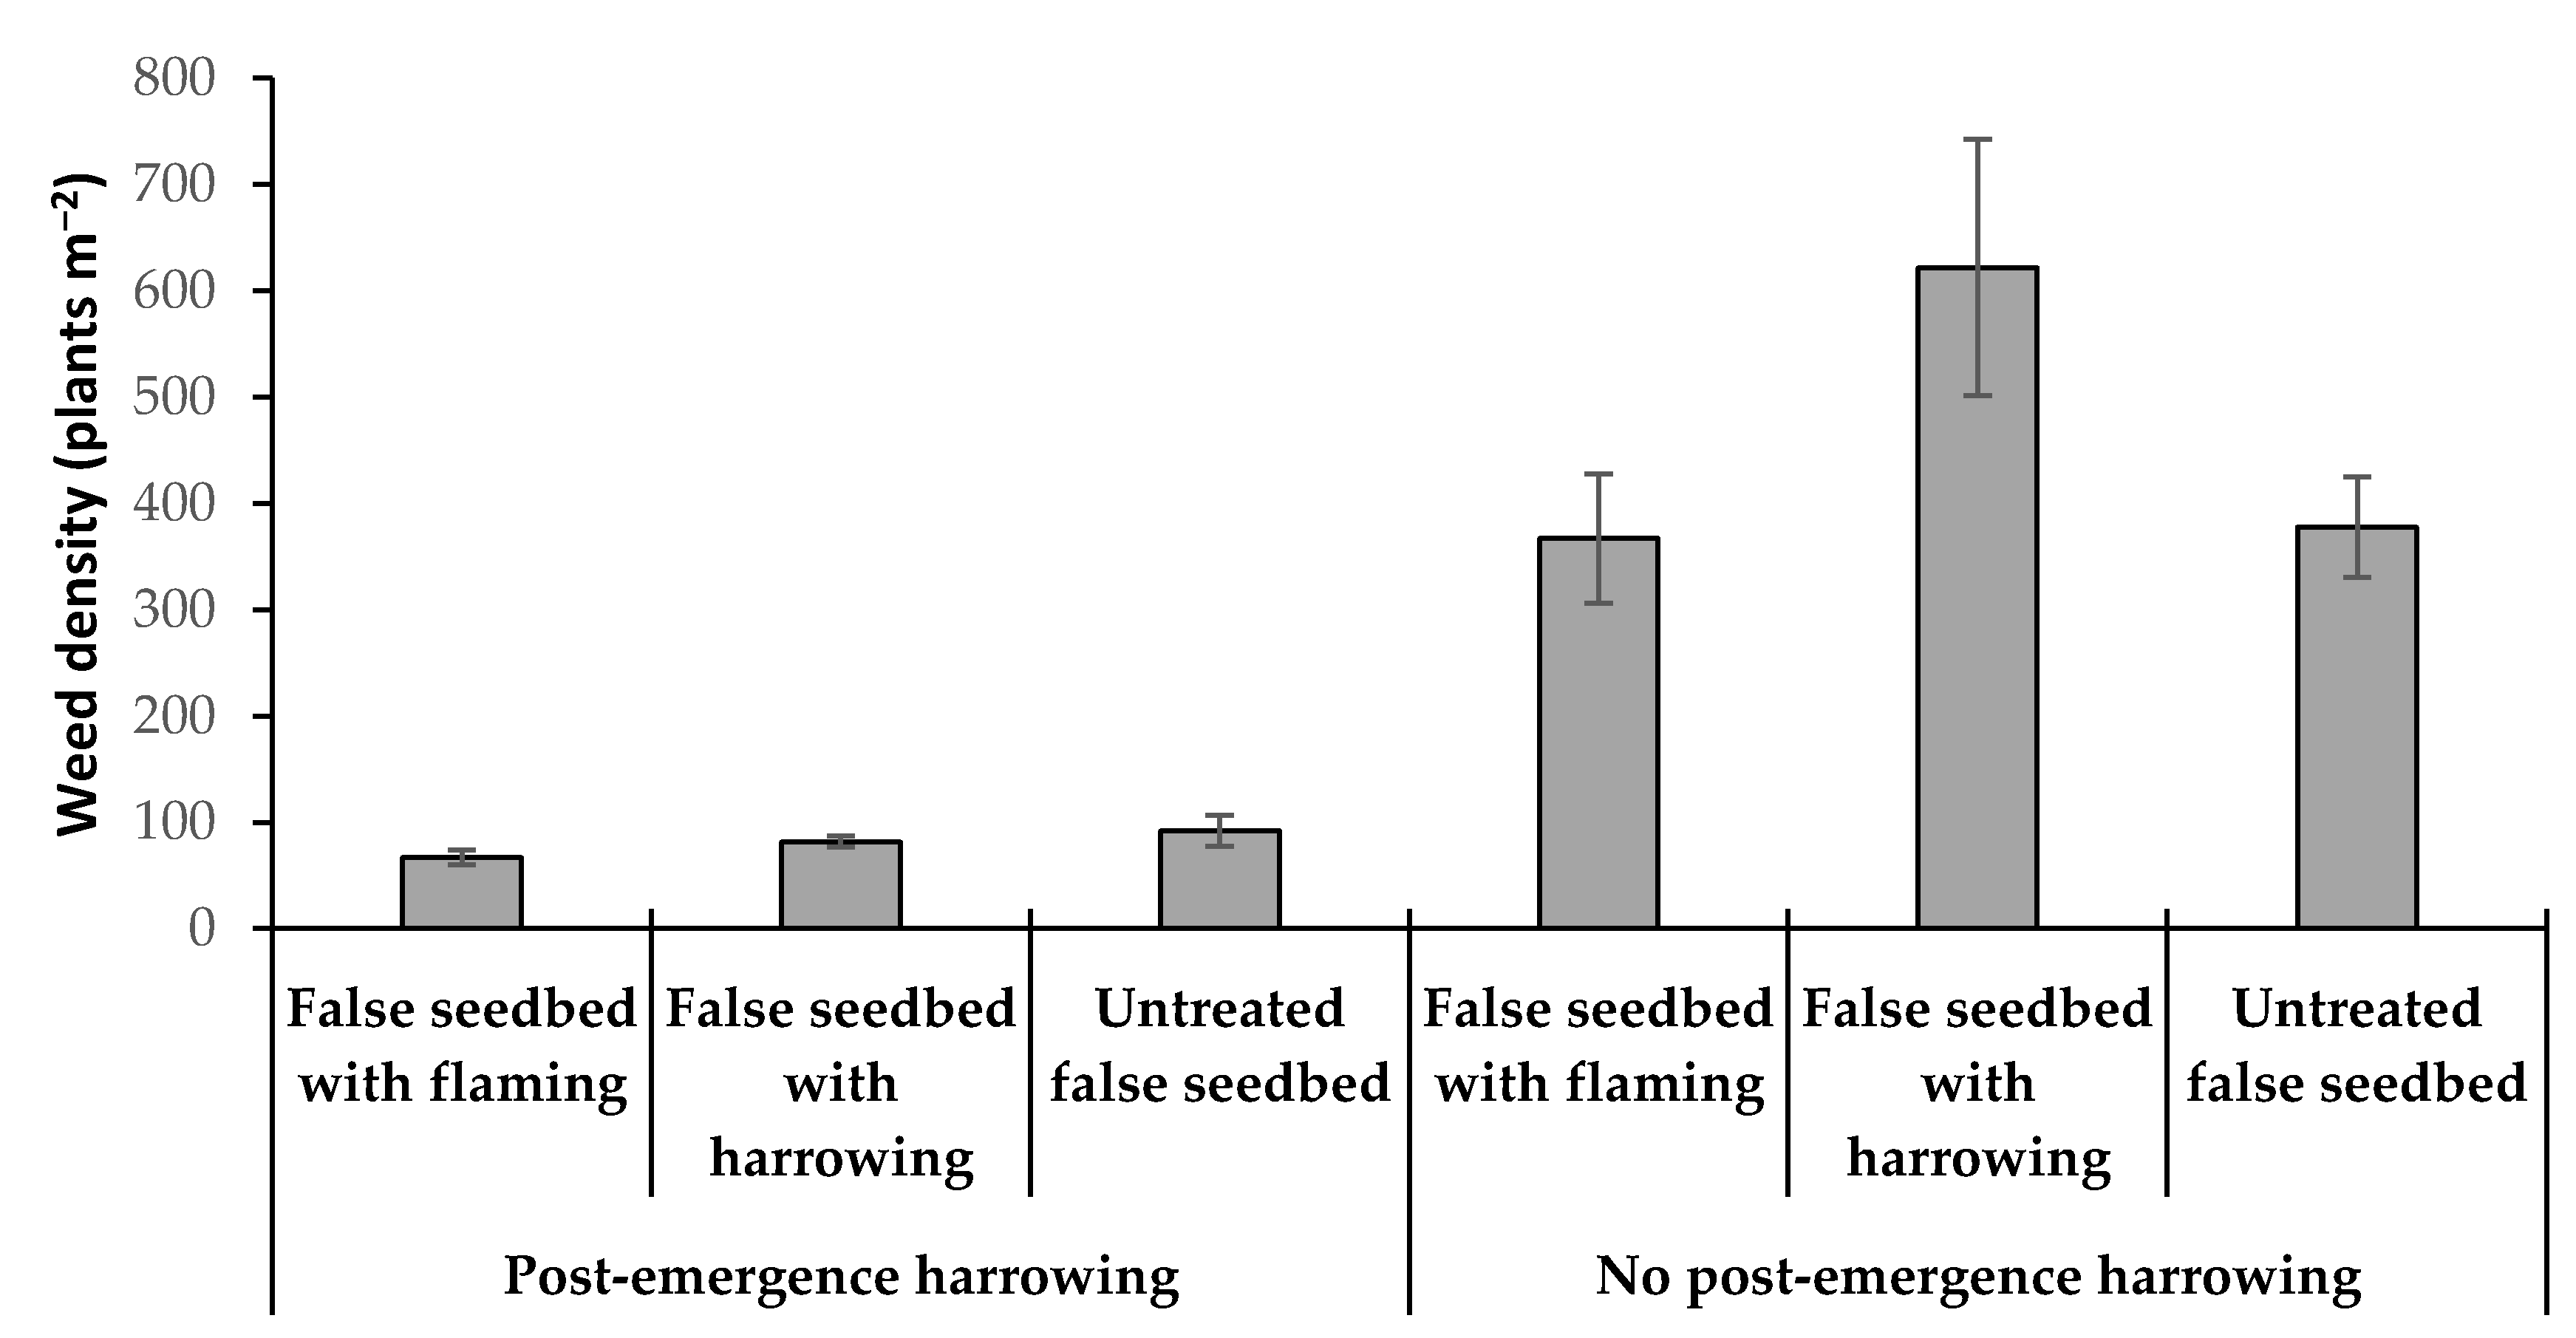
3.3. Impact of False Seedbed, Pre-Emergence and Post-Emergence Treatments (Experiment 3)

Three-way-ANOVAs performed for weed biomass and weed biomass fraction revealed a significant main effect of post-emergence treatment and a significant interaction between false seedbed treatment and pre-emergence treatment (Table 4).
Plots harrowed in post-emergence showed 5.7-fold lower weed biomass and 5.2-fold lower weed biomass fraction relative to plots without post-emergence harrowing (weed biomass: 44 ± 16 versus 251 ± 30 g m−2, LSD = 110 g m−2; weed biomass fraction: 1.65 ± 0.61% versus 8.61 ± 1.15 %, LSD = 3.65 %).
Among false seedbed treatments, flaming on false seedbed resulted in lowest weed biomass and weed biomass fraction, irrespective of pre-emergence weed control treatment (Figure 6). Within the pre-emergence flaming treatment, weed biomass and weed biomass fraction were both 33% lower (not significant) after flaming on false seedbed than after harrowing, the treatment that was least effective. Without pre-emergence flaming, flaming on false seedbed showed 69% lower (significant) weed biomass and weed biomass fraction compared to no treatment on false seedbed, the least effective treatment.
Compared to no flaming in pre-emergence, plots with pre-emergence flaming within the false seedbed treatments flaming, harrowing and no treatment showed 12 (not significant), 35 (not significant) and 64% (significant) lower weed biomass, and 13 (not significant), 40 (not significant) and 61% (significant) lower weed biomass fraction, respectively (Figure 6).
Overall, lowest weed biomass and weed biomass fractions were obtained in plots with flaming applied on false seedbed and/or pre-emergence followed by two harrowing passes in post-emergence (Table 5).
On 5 and 12 August, prior to pre-emergence flaming, there were no differences in weed density among integrated weed control strategies (Figure 7). Following rainfall on 12 and 19 August, weed densities increased. On 22 August, 5 days after the first harrowing pass, post-emergence treatment and false seedbed treatment significantly interacted in explaining weed density (Table 4). Within every false seedbed treatment, post-emergence harrowing significantly reduced weed density with 82 (significant), 87 (significant) and 76% (not significant) relative to flaming, harrowing and no treatment, respectively (Figure 8). Among false seedbed treatments, flaming showed lowest weed densities (not always in a significant way), irrespective of post-emergence strategy (Figure 8). However, differences across false seedbed strategies were more pronounced in plots that were not harrowed. Highest densities were obtained in plots with harrowing on false seedbed combined with no harrowing in post-emergence, irrespective pre-emergence strategy (205–298 weed plants more compared to a strategy without any intervention on false seedbed, in pre-emergence and post-emergence) (Figure 7). Lowest densities were obtained in a strategy with flaming on false seedbed and/or pre-emergence combined with post-emergence harrowing, although not significantly different from other strategies with post-emergence harrowing (Figure 7).
Total spinach biomass at harvest and spinach density on 16 August (prior to the first harrowing pass) were not affected by any of the experimental factors; nor were there significant interactions (Table 4). However, on 26 August, three days after the second harrowing pass, false seedbed, pre-emergence and post-emergence treatment significantly interacted in explaining spinach density (Table 4). Pairwise comparison between spinach density on 6 and 26 August revealed significant reduction (between 23–36%) in spinach density within all strategies that were harrowed twice in post-emergence, except for the strategy without any treatment on false seedbed and in pre-emergence (Table 5). Reductions (likely caused by pests) in spinach density were small (<20%) for strategies without post-emergence harrowing.

4. Discussion

Effects reported hereafter were not influenced by initial weed pressure and spinach density, as weed densities prior to the first false seedbed operation and spinach densities prior to the first post-emergence weed control operation were uniform across treatments, except for experiment 1, in which seeding rate was one of the experimental factors. The weed flora of the autumn spinach was mainly composed of S. media, U. urens, P. annua and Lamium purpureum L. (purple deadnettle).

4.1. Impact of Spinach Cultivar and Seeding Rate

At the same spinach density, the fast-growing cultivars ‘Bufflehead’ and ‘Baboon’ showed higher spinach biomass (at least 1 kg m−2 more) and petiole fraction (at least 10 percentage points higher) than the slow growing cultivar ‘Sonoma’ (Figure 3). Below a spinach density of 100 plants per m2, weed biomass and weed biomass fraction at harvest were also higher for ‘Sonoma’ (Figure 2). Hence, to sufficiently suppress weed biomass, cultivar ‘Sonoma’ should at least be installed at a spinach density above 100 plants.
Weed biomass per m2 significantly linearly decreased with increasing spinach density per m2, irrespective of spinach cultivar. However, rate of decrease was greater for spinach cultivars with planophile canopies (‘Baboon’ and ‘Sonoma’), particularly for the slow-growing cultivar ‘Sonoma’, than for the cultivar with an erectophile canopy (‘Bufflehead’). These results are in line with Drews et al. [15] who showed that winter wheat (Triticum aestivum L.) cultivars with high leaf area index and planophile leaf inclination were most weed suppressive. However, increasing spinach density within a spinach density range of 42–238 plants per m−2, and hence decreasing intra-row plant spacing as row spacing was constant in experiment 1, significantly increased the petiole fraction in marketable spinach biomass but had no effect on spinach waste fraction. Hence, increasing spinach density to foster spinach yield and suppress weed biomass cannot be done unlimited but should take into account maximum allowances (20% for leaf spinach and 35% for chopped spinach) for petiole fraction imposed by the processing industry. Ultimately, petiole fraction can be reduced by increasing mowing height of the spinach harvester. In addition, as bolting rate is much greater in water-deficient plants [16] increasing intra-row plant spacing may also stimulate early bolting before spinach plants reach marketable size (personal observation).
The majority of spinach samples cut at soil level exceeded maximum allowance (1% by weight) for presence of S. media and Urtica spp. in spinach for chopping. It is expected that increasing mowing height to standard mowing height will reduce these fractions.

4.2. Impact of Plant Spacing Management

Management systems with narrow (10.5 cm) spaced single rows with harrowing had significant lower weed biomass and weed biomass fraction in harvested produce but significant lower spinach biomass and marketable spinach biomass compared to unharrowed narrow spaced single rows and hoed wide (21 cm) spaced single rows. This is not in line with Tei et al. [4], who found 2.4-fold higher weed biomass in harrowed single rows spaced 12.5 cm apart relative to untreated check and highest weed biomass compared to other strategies tested (e.g., inter-row flaming, broadcast pre-emergence cycloate application). However, in contrast to our study, Tei et al. only harrowed between the rows and used a harrow with one single row of tines. The yield loss in the harrowed narrow-row system is most likely caused by the thinning action of harrowing (up to 36% after two harrowing passes). This thinning effect may also explain the significantly lower petiole fraction of harrowed narrow spaced single rows relative to all other row spacing systems without harrowing. As shown in experiment 1, a drop in spinach density (plants m−2) leads to a reduction in petiole fraction.
Among narrow- and wide-row systems without intra-row weeding, the system with narrow row spacing showed significantly highest weed biomass. At the same seeding rate, a narrow-row system has a lower intra-row spinach density and lower intra-row weed suppressive ability, as intra-row weed numbers significantly decreased with increasing intra-row spinach density (Figure 4). Hence, decreasing intra-row spacing is important for reducing weed biomass in systems without intra-row weeding. For systems without intra-row weeding, spinach biomass was not affected by row spacing system. Tei et al. [4] also found no effect on spinach yield when row spacing was doubled from 12.5 to 25 cm while keeping seeding rate constant (460 seeds m−2). In contrast, Peruzzi et al. [1] obtained significantly higher spinach yield in a single-row system with 20 cm row spacing than in a single-row system with 25 cm row spacing; but here, spinach density was 50% greater in the narrow-row system.
Compared to a system with broadcast harrowing, systems without intra-row weeding, namely narrow-row system without harrowing and wide-row systems with hoeing, had respectively significantly 6- and 3- to 3.8-fold higher weed biomass in the harvested produce. Among hoed wide-spaced row systems, twin rows showed 1.25-fold higher weed biomass (although not significantly different) relative to single rows, most likely as a result of the higher portion of unhoed surface (46% versus 19%), as the 10.5-cm-wide within twin-row zone was not hoed. Hoeing closer to the crop row using precision hoes with RTK-GPS tracking technology may further reduce weed biomass. Maybe a system combining row widening (to increase intra-row weed suppressiveness of spinach plants) and a sequence of broadcast harrowing and inter-row hoeing (to maximise weed control efficacy) can outperform harrowed systems with narrow row spacing. In spring barley (Hordeum vulgare L.) at a density of 325 plants m−2, McCollough et al. [17] indeed found lower weed biomass per m2 in systems with band seeding (12.7 cm bands spaced 15.2 cm apart) or 22.8-cm-wide single rows managed with harrowing and inter-row hoeing with 12.7 cm knives than in single-row systems with narrow (16.5 cm) row spacing managed with harrowing.

4.3. Impact of False Seedbed, Pre-Emergence and Post-Emergence Tactics

Lowest weed biomass and biomass fractions (below 1% allowance level imposed for chopped spinach) at harvest were obtained by implementing integrated systems combining flaming on false seedbed or in pre-emergence and two post-emergence harrowing passes.
The effect of false seedbed treatment was significantly mediated by pre-emergence flaming treatment. Flaming on false seedbed always outperformed 2 cm deep tine harrowing on false seedbed in weed biomass reduction at harvest. Differences, although not significant, were twofold greater in absence of pre-emergence flaming. In a study of Peruzzi et al. [5], flaming on false seedbed resulted in a significant lower weed biomass at harvest relative to 3 cm deep spring tine harrowing and rolling harrowing on false seedbed. In plots with pre-emergence flaming, harrowing on false seedbed entrained 14 g m−2 additional weed biomass and 0.17 percentage points more weed biomass fraction relative to a false seedbed with no curative treatment, although not in a significant way. This points to the stimulatory effect of soil tillage on weed germination as shown in the false seedbed experiments of De Cauwer et al. [12].
Inversely, the effect of pre-emergence flaming on weed biomass and weed biomass fraction was mediated by false seedbed treatment. Pre-emergence flaming reduced weed biomass and weed biomass fraction, irrespective of false seedbed treatment. However, reductions were most pronounced and only significant when no treatment was performed on false seedbed. Hence, pre-emergence flaming is considered a valuable strategy to mitigate the risk of product contamination particularly under high anticipated weed pressure or poor performance of a false seedbed as a result of poor weed germination provoked by low soil temperatures or dry soil conditions. Weeds that survive a false seedbed or emerge early in the pre-emergence period of spinach may otherwise become too well developed and anchored in the soil to be controlled by post-emergence harrowing passes.
Averaged over all pre-emergence or false seedbed treatments, harrowing twice in post-emergence significantly reduced weed biomass with 82% relative to no harrowing. Without post-emergence harrowing, late germination weeds triggered by rainfall in the period 13–19 August will end up in the harvested produce. As for harrowed narrow-row systems in experiment 2, harrowing significantly reduced spinach density with up to 36%. Despite this thinning effect, spinach biomass was not affected by harrowing in contrast to experiment 2. Most likely, yield penalties due to thinning may largely depend on spinach density. In experiment 3, spinach densities after harrowing (216 plants m−2 averaged over harrowed plots) were close to 200 plants m−2, considered ideal for optimal yield. In experiment 2, spinach density dropped to 177 plants m−2 after a thinning effect of 29%.
In experiment 3, harrowing twice in post-emergence was only able to keep weed fraction below the allowance (1%) permitted by industry when preceded by flaming on false seedbed or in pre-emergence. In contrast, in experiment 2, harrowing twice was sufficient to keep the weed fraction below this maximum allowance. A more complex weed control strategy was probably needed in experiment 3, as weed burden was greater as a result of the 2-fold richer total weed seedbank of the topsoil (0–5 cm) and 10- to 12-fold richer seedbank of S. media (402 versus 43 seeds m−2) and U. urens (785 versus 65 seeds m−2).

5. Conclusions

To obtain the lowest possible weed contamination in harvested produce from organic summer sown (processing) spinach and to mitigate the risk of product rejection, it is recommended to (1) choose a highly weed suppressive hybrid spinach cultivar preferably with planophile leaves and quick growth rate; (2) sow it in single rows with narrow row spacing at a targeted density of about 250 plant m−2 to compensate for future thinning action by post-emergence harrowing operations; and (3) control weeds by implementing an integrated weed control strategy based on flaming on false seedbed and/or in pre-emergence and two post-emergence harrowing passes. Spinach fields should preferably be installed on fields with small weed seedbanks.

Author Contributions

Conceptualization: B.D.C., L.D., M.D., S.D.R. and D.R.; methodology: B.D.C., L.D. and M.D.; formal analysis: B.D.C. and M.D.; investigation: B.D.C., L.D., M.D., S.D.R. and D.R.; resources: B.D.C., L.D., M.D., S.D.R. and D.R.; data curation: B.D.C. and M.D.; writing—original draft preparation: B.D.C. and M.D.; writing—review and editing: B.D.C., L.D., M.D., S.D.R. and D.R.; visualization: B.D.C., L.D., M.D., S.D.R. and D.R.; supervision: D.R.; project administration: B.D.C. and L.D.; funding acquisition: B.D.C. and L.D. All authors have read and agreed to the published version of the manuscript.

Funding

This research received no external funding.

Acknowledgments

We thank Joran Barbry, Kevin De Ceuleners and Francesca Petrucci for tech.

Conflicts of Interest

The authors declare no conflict of interest.

References

  1. Peruzzi, A.; Ginanni, M.; Raffaelli, M.; Borelli, M. Physical weed control in organic spinach production. In Proceedings of the 6th EWRS Symposium on Physical and Cultural Weed Control, Lillehamer, Norway, 8–10 March 2004; pp. 15–23. [Google Scholar]
  2. Spruijt, J.; van der Voort, M. Kwalitatieve Informatie Akkerbouw en Vollegrondsgroenteteelt, 29th ed.; Praktijkonderzoek Plant & Omgeving: Lelystad, The Nederlands, 2015. (In Dutch) [Google Scholar]
  3. Lichtenhahn, M.; Koller, M.; Dierauer, H.; Baumann, D. Biogemüsebau: Unkrautregulierung—Termingerecht und Schlagkräftig, 2nd ed.; Forschungsinstitut für Biologischen Landbau (FiBL): Frankfurt am Main, Germany, 2002; Available online: https://shop.fibl.org/chde/1027-gemuese-unkraut.html (accessed on 17 November 2020).
  4. Tei, F.; Stagnari, F.; Granier, A. Preliminary results on physical weed control in processing spinach. In Proceedings of the 5th EWRS Workshop on Physical and Cultural Weed Control, Pisa, Italy, 11–13 March 2002; pp. 164–171. [Google Scholar]
  5. Peruzzi, A.; Ginanni, M.; Raffaelli, M.; Fontanelli, M. Physical weed control in organic spinach in the Serchio Valley, Italy. In Proceedings of the 13th EWRS Symposium on Physical and Cultural Weed Control, Bari, Italy, 19–23 June 2005. [Google Scholar]
  6. Boyd, N.S.; Brennan, E.B.; Fennimore, S.A. Stale seedbed techniques for organic vegetable production. Weed Tech. 2006, 20, 1052–1057. [Google Scholar] [CrossRef]
  7. Fischer, R.A.; Miles, R.E. The role of spatial pattern in the competition between crop plants and weeds. A theoretical analysis. Math. Biosci. 1973, 18, 335–350. [Google Scholar] [CrossRef]
  8. Schnieders, B.J. A Quantitative Analysis of Inter-Specific Competition in Crops with a Row Structure. Ph.D. Thesis, Agricultural University Wageningen, Wageningen, The Netherlands, 1999. [Google Scholar]
  9. Bàrberi, P.; Bigongiali, F.; Antichi, D.; Carlesi, S.; Fontanelli, M.; Frasconi, C.; Lulli, L. Innovative crop and weed management strategies for organic spinach: Crop yield and weed suppression. In Cultivating the Future Based on Science, Proceedings of the 2nd Conference of the International Society of Organic Agriculture Research ISOFAR, Modena, Italy, 18–20 June 2008; Research Institute of Organic Agriculture FiBL: Frick, Switzerland, 2008; Available online: https://orgprints.org/12314/ (accessed on 17 November 2020).
  10. Fontanelli, M.; Martelloni, L.; Raffaelli, M.; Frasconi, C.; Ginanni, M.; Peruzzi, A. Weed management in autumn fresh market spinach: A nonchemical alternative. HortTechnology 2015, 25, 177–184. [Google Scholar] [CrossRef] [Green Version]
  11. Thompson, K.; Bakker, J.P.; Bekker, R.M. The Soil Seed Banks of North West Europe: Methodology, Density and Longevity; Cambridge University Press: Cambridge, UK, 1997. [Google Scholar]
  12. De Cauwer, B.; De Cuypere, T.; De Ryck, S.; Delanote, L.; Dewaele, K.; Willekens, K.; Reheul, D. Reduction in field emergence and seedbank density of Galinsoga quadriradiata and other weeds after contrasting false seedbed strategies in organic vegetable fields. Weed Res. 2019, 59, 265–278. [Google Scholar] [CrossRef]
  13. R Core Team. R: A Language and Environment for Statistical Computing; R Foundation for Statistical Computing: Vienna, Austria, 2016; Available online: https://www.R-project.org/ (accessed on 7 March 2020).
  14. Gomez, K.; Gomez, A. Statistical Procedures for Agricultural Research, 2nd ed.; John Wiley & Sons: New York, NY, USA, 1984; pp. 139–207. [Google Scholar]
  15. Drews, S.; Neufoff, D.; Köpke, U. Weed suppression ability of three winter wheat varieties at different row spacing under organic farming conditions. Weed Res. 2009, 49, 526–533. [Google Scholar] [CrossRef]
  16. Yoshida, Y.; Fujiwara, T.; Kumakura, H. Effects of plug transplanting on growth and bolting of spinach. Acta Hort. 2008, 771, 145–149. [Google Scholar] [CrossRef]
  17. McCollough, M.; Gallandt, E.; Darby, H.; Molloy, T. Band sowing with hoeing in organic grains: I. Comparisons with alternative weed management practices in spring barley. Weed Sci. 2019, 68, 285–293. [Google Scholar] [CrossRef]
Figure 1. Daily rainfall, irrigation and average minimum and maximum air temperatures during the experimental period of experiments 1 (18 July–8 October 2019) (a), 2 (2 September–29 October 2019) (b) and 3 (18 July–24 September 2019) (c).
Agronomy 11 00053 g001
Figure 2. Linear relationships between (a) weed biomass and spinach density (b) weed biomass and spinach biomass, (c) weed biomass fraction and spinach density, and (d) weed biomass fraction and spinach biomass for hybrid spinach cultivars ‘Sonoma’ (solid grey line), ‘Bufflehead’ (solid orange line) and ‘Baboon’ (solid blue line) (experiment 1).
Agronomy 11 00053 g002
Figure 3. Linear relationships between (a) spinach biomass, (b) marketable spinach biomass, (c) spinach petiole fraction and (d) spinach waste fraction on the one hand and spinach density on the other for hybrid spinach cultivars ‘Sonoma’ (solid grey line), ‘Bufflehead’ (solid orange line) and ‘Baboon’ (solid blue line) (experiment 1).
Agronomy 11 00053 g003
Figure 4. Relation between intra-row spinach density (Y) and intra-row weed density (X) based on data from systems without intra-row weeding: non-harrowed single-row system with narrow (10.5 cm) row spacing (solid dots), hoed single-row system with wide (21 cm) row spacing (open squares), and hoed twin-row system with row spacing of 21 cm between twin rows (crosses) (experiment 2).
Agronomy 11 00053 g004
Figure 5. Time course of weed density (mean ± SE) in four plant spacing management systems (experiment 2). Counting dates: 20 August, before seedbed preparation; 8 September, before pre-emergence flaming; 16 September, before first harrowing pass; 21 September, before second harrowing pass.
Agronomy 11 00053 g005
Figure 6. Impact of false seedbed and pre-emergence flaming treatments on weed biomass (a) and weed biomass fraction (b) in harvested produce with LSD’s of 110 g m−2 and 4.2% for comparison of pre-emergence treatment means within false seedbed treatment, 77 g m−2 and 3.1% for comparison of false seedbed treatment means within pre-emergence treatment (experiment 3).
Agronomy 11 00053 g006aAgronomy 11 00053 g006b
Figure 7. Time course of weed density (mean) in 12 weed control strategies in a single-row system with 10.5 cm row spacing (experiment 3). Counting dates: 5 August, before the first false seedbed operation; 12 August, before pre-emergence flaming; 19 August, before the first harrowing pass; 22 August, before the second harrowing pass. Strategies are given by a three-digit code: first digit for false seedbed treatment, second digit for pre-emergence treatment and third digit for post-emergence treatment. Treatments comprised harrowing (h), flaming (f) and no treatment (n).
Agronomy 11 00053 g007
Figure 8. Impact of false seedbed and post-emergence harrowing treatments on weed density on August 22 (experiment 3). LSD is 295.9 plants m−2 for comparison of post-emergence treatment means within false seedbed treatment, and 151.2 plants m−2 for comparison of false seedbed treatment means within post-emergence treatment.
Agronomy 11 00053 g008
Table 1. Sowing characteristics, weed control timings and harvest dates (2019) for experiments 1, 2 and 3.
Experiment 1Experiment 2Experiment 3
False seedbed period:
Seedbed preparationJuly 18 July 18
Harrowing passJuly 30 August 7 *
Flaming passAugust 12 August 7 *
Harrowing passAugust 20
Pre-emergence period:
Sowing dateAugust 20September 3 (+ seedbed preparation)August 7
Spinach cultivarBufflehead, Baboon, SonomaBuffleheadLa Paz
Seeding rate (seeds m−2)300, 400300300
Row spacing (cm)10.510.5 (narrow row), 21 (wide row), 10.5/21 (twin-row)10.5
Weed control treatmentAugust 23 (harrowing)September 8 (flaming)August 12 (flaming) *
Post-emergence period:
Crop emergenceAugust 26 (Bufflehead), August 27 (Baboon), August 28 (Sonoma)September 10August 13
First harrowing pass September 17 (10.5 cm inter-row zone)August 20 *
Hoeing pass September 21 (21 cm inter-row zone)
Second harrowing pass September 23 (10.5 cm inter-row zone)August 23 *
Harvest dateOctober 10October 29September 24–25
* Strategy-dependent option.
Table 2. Summary of two-factorial ANOVAs for the randomised complete block design of experiment 1 and associated cultivar means (±SEs) for weed and spinach response parameters.
ANOVA 1Spinach Cultivar 2
BlockSeeding RateCultivarSeeding Rate × CultivarBaboonBuffleheadSonoma
Spinach parameters:
Spinach biomass (g m−2)NSNS***NS4 893 ± 379.1 a5 445 ± 285.1 a2 751 ± 275.8 b
Marketable spinach biomass(g m−2)NSNS***NS3 469 ± 302.3 a4 047 ± 235.6 a1 929 ± 201.7 b
Spinach waste (g m−2)**NS***NS1 424 ± 124.4 a1 398 ± 99.6 a0 823 ± 130.4 b
Spinach waste fraction(% of spinach biomass)*NSNSNS29.5 ± 2.25 a25.7 ± 1.48 a29.8 ± 4.11 a
Petiole fraction(% of marketable spinach)NSNS***NS30.5 ± 1.54 a35.6 ± 1.52 a17.0 ± 0.98 b
Weed parameters:
Weed biomass (g m−2)NSNS*NS0 012 ± 3.1 b0 00 8 ± 4.2 b0 038 ± 11.6 a
Weed biomass fraction(% of total biomass)NSNS***NS00.3 ± 0.09 b0 0.1 ± 0.06 b01.5 ± 0.40 a
1 Significance: ***, p < 0.001; **, p < 0.01; *, p < 0.05 and NS, not significant. 2 Means with common letter within the same row are not significantly different according to Fisher’s LSD test.
Table 3. Summary of one-factorial ANOVAs for the randomised complete block design of experiment 2 and means (±SEs) of plant spacing management systems for weed and spinach response parameters.
ANOVA 1Plant Spacing Management Systems 2
BlockPlant Spacing ManagementNarrow-Row without HarrowingNarrow-Row with HarrowingWide-Row with HoeingTwin Row with Hoeing
Spinach parameters:
Spinach biomass (g m−2)NS*2 902 ± 117 a2 368 ± 117 b2 807 ± 117 a2 623 ± 64 ab
Marketable spinach biomass (g m−2)NS**1 609 ± 118 a1 225 ± 57 b1 705 ± 112 a1 595 ± 91 a
Spinach waste (g m−2)NS*1 293 ± 44 a1 143 ± 87 ab1 102 ± 34 b1 028 ± 58 b
Spinach waste fraction(% of spinach biomass)NS**44.9 ± 2.35 a48.0 ± 2.02 a39.6 ± 1.93 b39.3 ± 2.44 b
Petiole fraction(% of marketable spinach biomass)NS** c38.9 ± 1.17 a30.2 ± 1.56 c35.0 ± 0.85 b35.6 ± 0.97 ab
Weed parameters:
Weed biomass (g m−2)**** c0 73 ± 11 a0 12 ± 2 c0 36 ± 5 b0 45 ± 5 b
Weed biomass fraction(% of total biomass)**** c2.5 ± 0.39 a0.5 ± 0.09 c1.3 ± 0.23 b1.7 ± 0.20 b
1 Significance: ***, p < 0.001; **, p < 0.01; *, p < 0.05 and NS, not significant. 2 Means within a row without a common letter are significantly different (p < 0.05) according to Fischer’s LSD test.
Table 4. Significance (***, p < 0.001; **, p < 0.01; *, p < 0.05 and NS, not significant) of post-emergence harrowing treatment (POST, main factor), false seedbed treatment (FS, subplot factor), pre-emergence flaming treatment (PRE, subsubplot factor) and interactions for weed and spinach parameters according to ANOVA for a split-split-plot design (experiment 3).
BLOCKPOSTFSPREPOST × FSPOST × PREFS × PREPOST × FS × PRE
Weed parameters:
Weed biomass (g m−2)NS******NSNS**NS
Weed biomass fractionNS**NS**NSNS*NS
(% of total biomass)
Weed density (plants m−2):
August 5NSNSNSNSNSNSNSNS
August 22NS**NS*NSNSNS
Spinach parameters:
Spinach biomass (g m−2)NSNSNSNSNSNSNSNS
Spinach density (plants m−2):
August 16NSNSNSNSNSNSNSNS
August 26NS***NSNS*NS*
Table 5. Weed biomass, weed biomass fraction, spinach biomass and spinach density as a function of weed control strategy in a single-row system with 10.5 cm row spacing (experiment 3). Strategies are given by a three-digit code: first digit for false seedbed treatment, second digit for pre-emergence treatment and third digit for post-emergence treatment. Treatments comprised harrowing (h), flaming (f) and no treatment (n).
hfhhnhffhfnhnfhnnhhfnhnnffnfnnnfnnnn
Weed biomass (g m−2):
mean13.237.39.312.415.5178.8230.1337.4153.9172.6199.8413.6
SE2.3119.120.693.813.3763.0350.67109.424.6721.8447.2157.31
Weed biomass fraction
(% of total biomass):
mean0.51.40.30.40.66.77.712.25.15.87.313.6
SE0.070.770.030.120.132.762.265.160.950.631.792.59
Spinach biomass (g m−2):
mean2 6252 7722 9432 9212 8562 6332 9652 6172 9282 7992 5642 735
SE338.7249.0231.8378.3262.0258.8234.5286.9188.2306.1148.9251.9
Spinach density
(plants m−2):
August 16;
mean309318288292245417326280272278334307
SE3633.231.59.47.444.640.720.226.229.830.57.5
August 26;
mean197213221202165300285287262229295247
SE22.225.823.313.95.327.425.417.625.54.023.07.9
Significance *********NSNSNSNSNS***
Cohen’s d effect size for a paired t-test−1.5−1.41−0.96−3.03−4.99−1.26−0.490.15−0.15−0.92−0.58−3.11
Comparison between spinach densities on 16 and 26 August: **, p < 0.01; *, p < 0.05 and NS, not significant.
Publisher’s Note: MDPI stays neutral with regard to jurisdictional claims in published maps and institutional affiliations.

