1. Introduction
Old durum wheat cultivars have been proposed as a sustainable management option for low input cultural systems in the less fertile areas of the Mediterranean region where the combination of poor soils and the parsimonious use of fertilizer make old durum wheat cultivars sustainable [
1]. The main advantage of old cultivars in these systems is represented by their high grain protein content [
2] and by the high income they guarantee to farmers, due to the continuously increasing demand by consumers for traditional products.
From a morpho-physiological point of view, old cultivars combine a late anthesis [
3] and a high maximum grain filling rate [
4,
5] two interesting traits proposed by [
6] to overcome the antagonism between grain yield and grain protein concentration under future climate scenarios. Their high grain filling rate often results in high final grain weights [
5] that can counterbalance the low grain number per m
−2 associated with the low grain yield generally attainable in marginal areas and low input systems [
1]. In these cultural systems, the grain yield achieved by some old cultivars is, thus, comparable to that of modern durum wheat cultivars characterized by high grain protein content, but the grain protein content of old cultivars is even higher than that of modern ones [
1,
2].
The reasons for this high grain protein content can be analyzed using a framework in which the role of both N sink and N source are considered. Wheat grain nitrogen is mostly derived from the non-structural nitrogen accumulated by the crop by anthesis, although a significant contribution can also be derived from the uptake of soil nitrogen during grain filling [
7]. The amount of nitrogen absorbed by the crop is related to its biomass [
8]; therefore, differences in biomass at anthesis could be responsible for differences in the quantity of nitrogen source available to the grains.
The grain number per unit area (GNO) establishes a link between the supply of nitrogen and dry matter, and the grains’ demand for them [
9]. The GNO depends on the amount of biomass produced by anthesis, the fraction of this biomass allocated to the ear and the number of grains per unit of biomass of the ear at anthesis, or fruiting efficiency [
10,
11,
12]. Old, tall wheat cultivars partition a lower amount of biomass to the growing spike compared with the short modern ones [
13]. Consequently, they have the potential to set a lower grain number per ear than modern ones. Differences in partitioning at anthesis could also be relevant in creating a different balance between the number of grains and the amount of nitrogen available for each grain.
In this study, we analyzed the nitrogen economy of old durum wheat cultivars to understand whether their high grain protein content derives from their ability to uptake and remobilize nitrogen to the grain, or is driven by their low grain number per unit surface. The large genetic variability of the old durum wheat Italian germplasm was represented by 14 cultivars grown in Italy from the beginning of the 20th century until the 1970s. A nitrogen treatment was also imposed.
2. Materials and Methods
2.1. Site, Treatments and Experimental Design
The experiment was carried out during seasons 2015/16 (‘2016’) and 2016/17 (‘2017’) at the experimental station of the University of Sassari located at Ottava (41° N; 8° E; 80 m above sea level). The environment is typically Mediterranean, with a long-term mean annual rainfall of 539 mm–the majority of which occurs between October and April.
A total of 14 cultivars of durum wheat (
Triticum turgidum L. ssp.
durum Desf.) were compared (
Table 1). Most of them were old tall and late cultivars belonging to the
mediterraneum type [
14] which were diffuse in Italy in the first half of the 20th century. Two cultivars, Ichnusa and Maristella, widely grown in the 1960s, are shorter and earlier than the other old cultivars because they were derived from crosses between
mediterraneum and
syriacum types [
14].
Cultivars were sown on 10 December 2015 (2016 season), and 15 November 2016 (2017 season), at a sowing rate of 250 viable seeds m−2 and at two fertilization rates: a low N level (‘N46’) with a single nitrogen application at the time of sowing (46 kg ha−1 in the form of urea); and a high N level (‘N86’), which benefited from a second application of 40 kg ha-1 at the onset of stem elongation in the form of ammonium nitrate. Two fields with low fertility soils were chosen for the experiment. They were just 0.4–0.5 m deep due to an underlying layer of limestone, had an organic matter content of 1.4 ± 0.3%, 45 kg ha−1 of mineral nitrogen, 8.4 ± 0.5 ppm of available phosphorus and high total CaCO3 (40 ± 4.4%). The soil available water amounted to 61 mm. In both seasons, the preceding crop was faba bean and the sowing bed was prepared by ploughing to a depth of 0.25 m followed by surface cultivation. Weeds, pests and diseases were chemically controlled.
Each plot consisted of six 1.2 m rows with an inter-row distance of 0.18 m. The plots were set out as a split-plot design with 3 replications. Cultivars were assigned to the main plots and nitrogen rates to the sub-plots.
2.2. Measurements and Derived Data
The time to anthesis and to physiological maturity were determined by the periodical inspections of plots and attributed to the plot when more than 50% of plants had reached these phenological stages. Grain filling duration was roughly estimated as the difference between the time to anthesis and time to maturity. Plant height, defined as the distance from the ground to the tip of the spike (awn excluded) was assessed pre-harvest for four randomly chosen plants per plot.
Dry matter production was evaluated at both anthesis and maturity on samples of 0.21 m2 of uprooted plants per plot, roots excluded. Ears were separated from the rest of the sample at anthesis, whereas at maturity samples were subdivided into grains, chaff and the remaining culms plus leaves (straw). All biomass samples were oven-dried at 80 °C for 48 h before weighing. Nitrogen percentage was determined on each sub-sample by means of a Carbon/Hydrogen/Nitrogen Analyzer (628 Series, LECO Corporation, St. Joseph, MI, USA).
The harvest index (HI), i.e., the ratio between the grain yield and the total biomass, determined on the maturity sample by dividing grain weight by the total sample biomass was used to estimate the plot total biomass from the mechanically harvested grain. Grain moisture content and grain weight were obtained from four 250 grain sub-samples per plot. The number of grains per m
2 (GNO) was calculated by dividing grain yield by grain weight. Fruiting efficiency was calculated as the ratio of GNO to ear dry matter at anthesis. Grain yield and grain weight were expressed on a dry basis (0% moisture). Nitrogen data were used to calculate: grain protein percentage as N percentage × 5.7; the amount of nitrogen (in µg) per each grain as grain weight at dry basis × N percentage; the amount of N allocated to ears and vegetative tissues at anthesis and to grains, chaff and vegetative tissues at maturity. The Nitrogen Harvest Index (NHI) was obtained as the ratio between N in the grains and total N in the above-ground biomass. The amount of N taken up after anthesis was evaluated as the difference between total N per unit surface at maturity and total N per unit surface at anthesis. Critical N was calculated using the critical N dilution curve for wheat described by [
15] and used to determine the Nitrogen Nutrition Index (NNI) as the ratio between the actual above-ground crop N percentage at anthesis and critical N [
16]. Nitrogen relocation efficiency from the ears (NREears) and from the vegetative tissues (stems plus leaves) (NREveg) were calculated as the difference between the amount of N present in ears/vegetative tissues at anthesis minus that present at maturity and expressed as percentage of the N content at anthesis [
16]. According to [
17], the structural nitrogen of the vegetative tissues is assumed to correspond to the minimum N percentage observed at maturity in the straw multiplied by the straw biomass.
Weather data (maximum and minimum temperatures, rainfall, solar radiation, wind speed and air humidity) were recorded at the agro-meteorological station on the experimental farm where the fields were located and used to calculate mean temperature, reference evapotranspiration (ETo) [
18] and the rainfall deficit as the difference between rainfall and ETo.
2.3. Statistical Analysis
Agronomic data were analysed by a combined ANOVA, using R software [
19], package Agricolae, according to a split-split plot design where years were assigned to the main plot, cultivars to the sub plots and nitrogen treatment to the sub-sub plots. The appropriate error terms for each type of mean comparison [
20] were used to calculate the Least Significant Difference at the 0.05 probability level. The Pearson correlation coefficient was used to evaluate the existence of causal relationships between couples of traits.
3. Results
Due to the many significant interactions detected by ANOVA (
Table S1), interaction means are generally presented in graphs and tables.
3.1. Weather Conditions
In 2017, the rainfall recorded between October and May was only 60% of the long-term mean (a 40-year mean for the period spanning 1970 to 2010) (
Table 2).
In 2016, the rainfall was higher than that of 2017, but still lower than the long-term mean. When rainfall was combined with ET0 to quantify the rainfall deficit, the 2017 season was confirmed as having been extremely dry (the rainfall deficit was more than 2-fold the long-term reference value), whereas 2016 was wetter than the long-term mean.
Rainfall was particularly scarce in the springs of both seasons, and 2017 was even worse than 2016 (a total of only 8 mm of rain fell in April and May in 2017). 2017 was also characterised by higher maximum temperatures compared with 2016 and the long-term mean (a 40-year mean for the period spanning 1970 to 2010), as well as a greater number of days in which the maximum temperature exceeded 25 °C in May–the period in which most of the grain filling occurs.
3.2. Height and Phenology
According
Table S1, the Cultivar × Year interaction is discussed for plant height and phenological traits.
The severe environmental stress of 2017 resulted in a reduction in average plant height by 22 cm and a shortening of the grain filling period by an average of 3 days (
Table 3). In both years, two distinct groups for plant heights were evident. The group comprising the tall cultivars displayed an average plant height of 154 cm in 2016 and 131 cm in 2017, whereas Ichnusa and Maristella, released in the 1960s, reached 117–120 cm in 2016, but only 103–105 cm in 2017.
Clear differences in phenology were observed between the groups. The oldest, tall, cultivars flowered on average at the beginning of May, and no later than the 7 May 2017, the only exceptions being Timilia (anthesis on 26 April 2016 and 24 April 2017). The short Ichnusa and Maristella, displayed an anthesis date between the 17 and the 20 April 2017. The earlier anthesis of these cultivars resulted in a longer grain filling period compared with the older varieties, which, in some cases, had less than one month to fill their grains in 2017.
These differences in phenology resulted in different thermal conditions during grain filling: the latest cultivars were exposed to higher maximum temperatures compared with Ichnusa and Maristella (24.5 °C versus. 22.3 °C in 2017 and 21.7 °C vs. 20.4 °C in 2016) and had more days in which the maximum temperature exceeded 25 °C, especially in 2017 (14 days vs. 10 in 2016).
3.3. Grain Yield and Grain Yield Components
Mean grain yield was less than 3 t ha
−1. The unfavourable weather conditions of 2017 caused an average 28% reduction in grain yield (
Table 4), compared with 2016, deriving from a corresponding decrease in GNO (number of grains per m
2) and total dry matter, whereas the HI (harvest index) and grain weight were unaffected in spite of the more severe terminal water stress observed in 2017.
The N treatments did not affect grain yield because the slight increase in total dry matter observed at N86 was compensated by a reduced HI. Grain weight was negatively affected by the additional N treatment applied to N86.
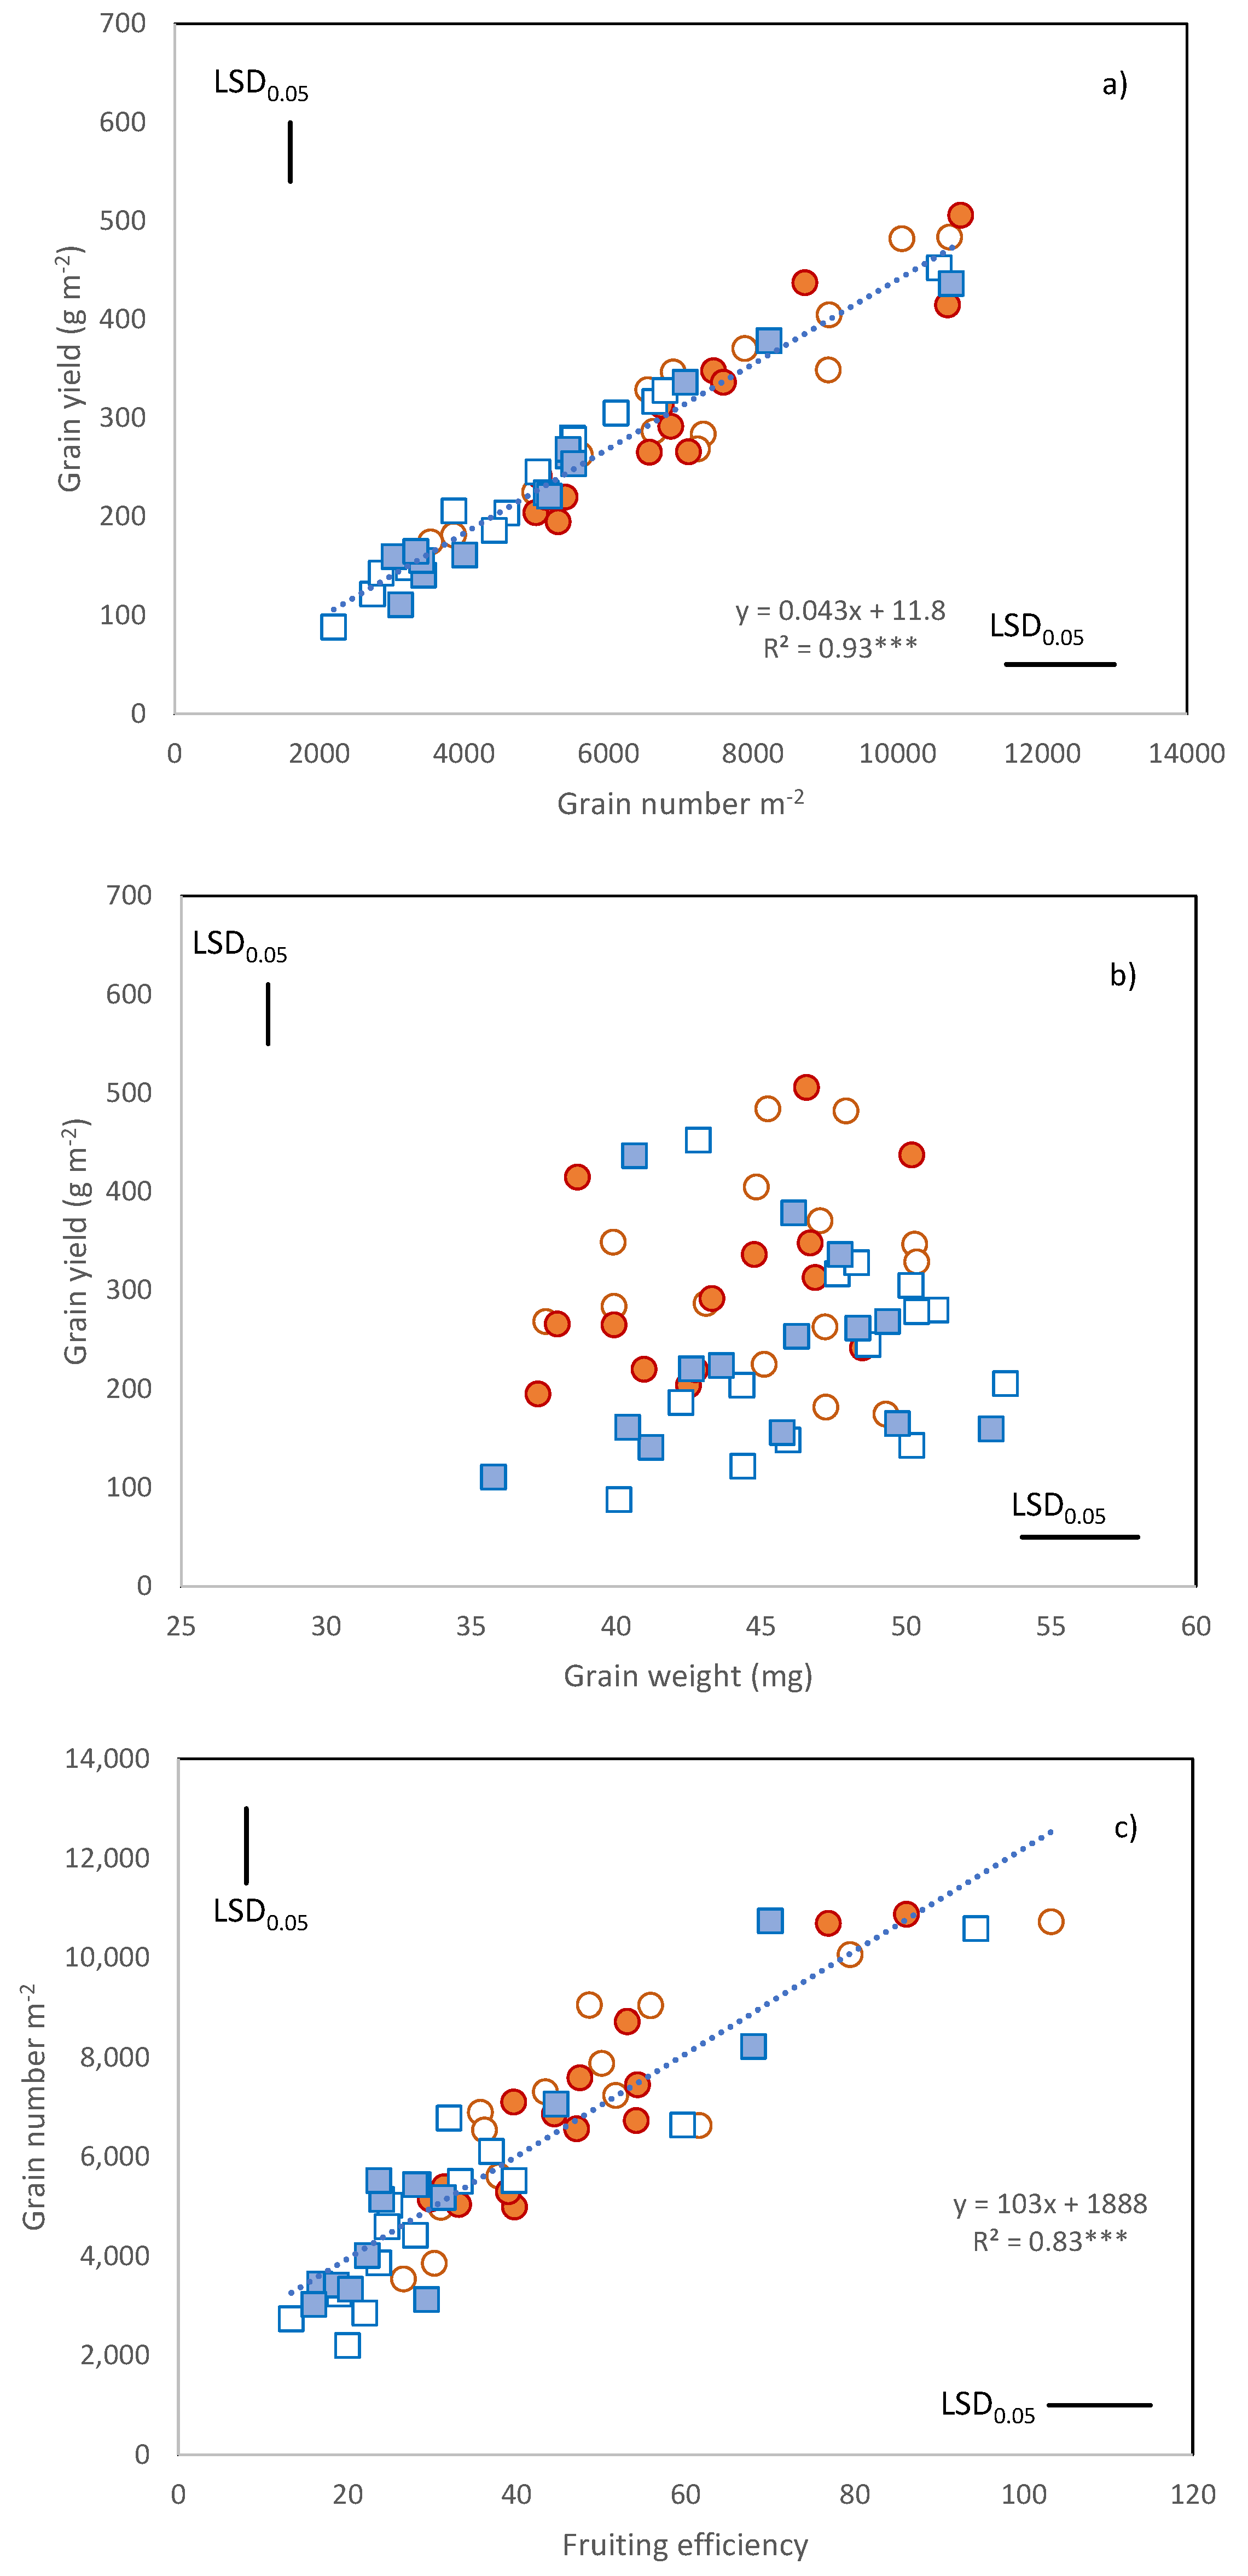
When the Cultivar × Year × N treatment means were considered, grain yield ranged from about 90 to about 500 g m
−2 (
Figure 1a).
The unfavorable weather conditions of 2017 generated significant cultivar × year and cultivar × N interactions (
Table S1). While some cultivars produced a higher grain yield under N86 (Trigu murru and Ichnusa), the grain yield produced by others (Calabria and Trigu biancu) was lower than that achieved under the lower nitrogen rate.
GNO ranged from 2196 to 10,800 grains m
−2, and its variation was strongly associated with the variation in grain yield (
Figure 1a,
r = 0.96 ***). By contrast, grain weight was not associated with grain yield (
Figure 1b). No negative relationship was found between GNO and grain weight. Grain weight varied from 35 to 53 mg and despite the severe terminal drought of 2017, and the late flowering of most cultivars, it was almost unaffected by year (
Table S1 and
Table 4). Grain weight did not show any cultivar × year or cultivar × N interaction as assessed by ANOVA (
Table S1).
The variation in GNO was strongly associated with the variation in fruiting efficiency (
r = 0.83 ***,
Figure 1c). The most recent cultivars, namely, Ichnusa and Maristella showed the greatest fruiting efficiencies (means of 86 and 73 grains per g of ear, respectively).
3.4. Nitrogen Uptake and Allocation
3.4.1. Anthesis
The NNI (Nitrogen Nutrition Index) calculated at anthesis (
Table 5) was used in this experiment to evaluate the crop N stress incurred by the cultivars. As expected, the mean NNI was higher at the higher N rate (0.93 vs. 0.75,
Table 4), but only C × Y data are presented in the Table because C × N interaction was not significant (
Table S1). A large genotypic variation was observed in the mean NNI with Ichnusa and Maristella exhibiting the lowest NNIs, ranging between 0.70 and 0.76 on the average of the two years, whereas the other cultivars had an average NNI ranging from 0.73 to 1.05. Some cultivars showed a higher NNI in 2016, others in 2017.
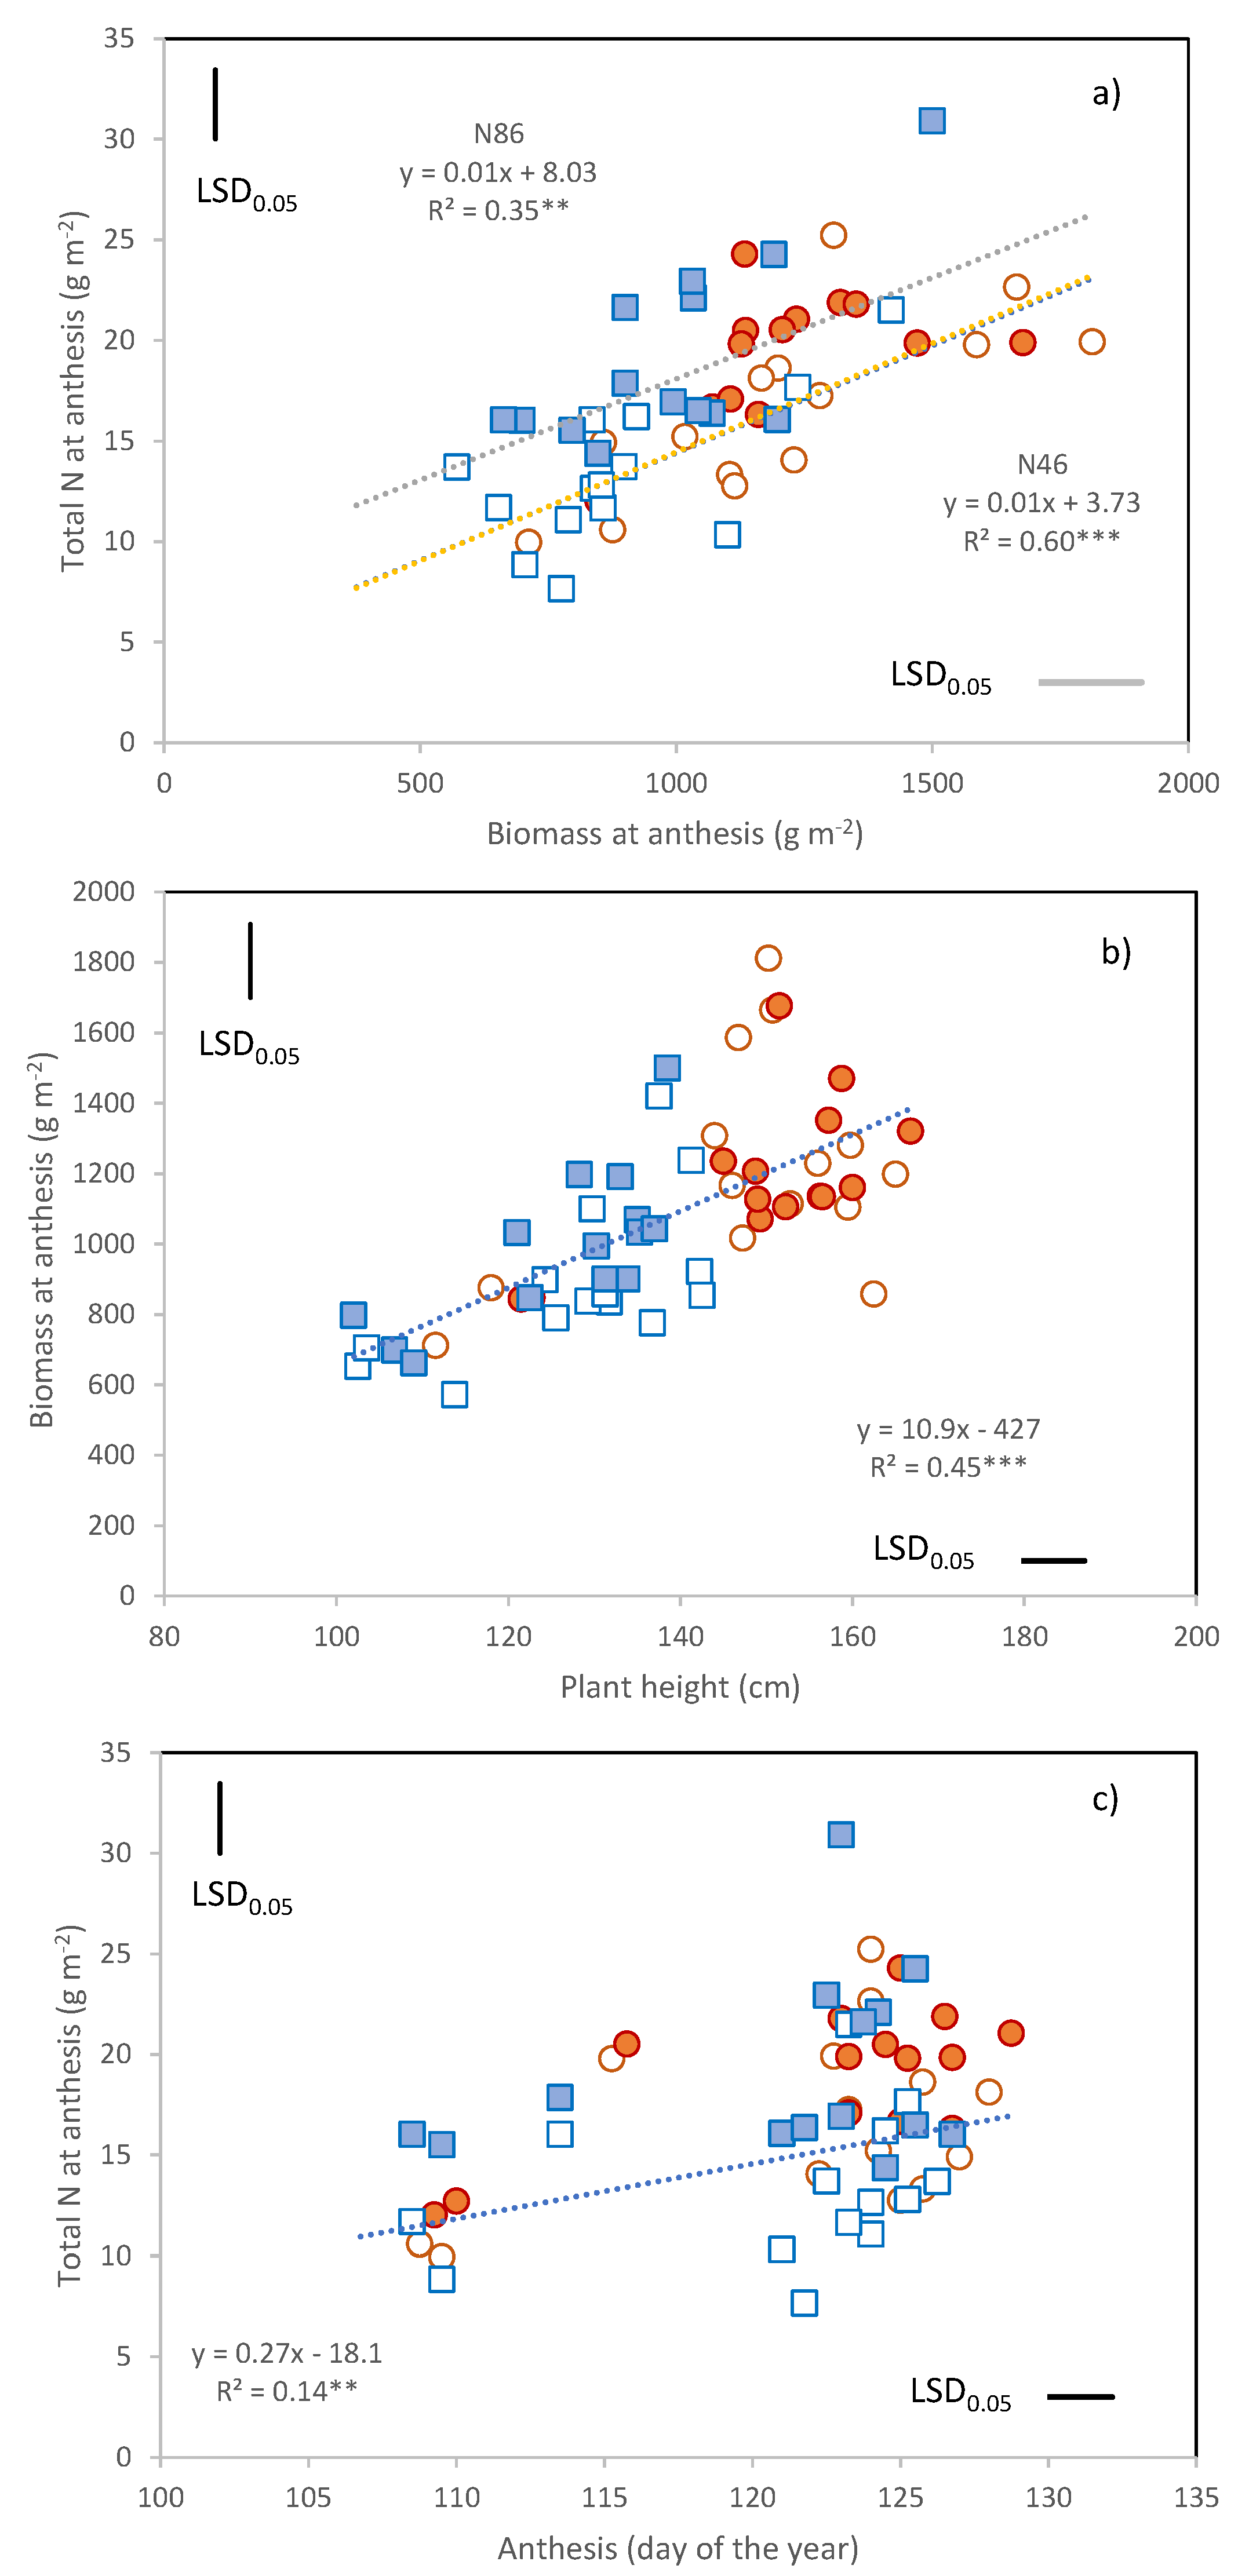
The total amount of N present in the above-ground biomass at anthesis ranged from 8 to 31 g m
−2 (
Figure 2a) and was on average higher under N86 (17.8 g m
−2) than under N46 (14.5 g m
−2) (
Table 4). Within each N treatment, the genotypic variability observed in total N taken up by anthesis was attributable to the variation in total biomass (
Figure 2a), and not in the mean biomass N percentage (N46,
r = 0.28 ns; N86,
r = 0.37 ns). Total biomass was, in turn, highly dependent on plant height and thus higher in the tall cultivars and in 2016 (
Figure 2b).
The relationship between anthesis date and N uptake of was statistically significant (
r = 0.43 **,
Figure 2c), but only due to the presence of the early flowering cultivars Ichnusa, Maristella, and Timilia. No effect of anthesis date on pre-anthesis N uptake was detected for the other 11 cultivars.
Ear N% at anthesis was on average higher at N86 (2.3%) than at N46 (2.0%), but the proportion of N partitioned to the ears was significantly higher under N46 (0.23) than under N86 (0.21) (
Table 4). Vegetative tissues displayed a lower N percentage than that of the ears, and was again higher under N86 (1.7%) than under N46 (1.4%) (
Table 4).
3.4.2. Maturity
The total N present in the crop at maturity was 27% higher in 2016 (19.6 g m
−2,
Table 4) than in the following season (only 15.7 g m
−2), partly as a consequence of the greater uptake after anthesis, permitted by the higher spring rainfall of 2016. In the majority of cultivars, the total N present in the crop at maturity was limited to the N already present at anthesis in the drier 2017 season; in this year, only Ichnusa, Maristella, Calabria and Cappelli were able to take additional N up after anthesis. In the wetter 2016 season, N uptake continued after anthesis in most cultivars, contributing to up to 40% of the total N present at maturity.
Earlier anthesis surely created more favorable conditions for post-anthesis N uptake under the terminal water stress characterizing the two seasons, but at the same time, resulted in less N uptake before anthesis, as shown by the negative association calculated in 2016 between the N uptake before and after anthesis (
Figure 3a).
Despite this additional N uptake, also in 2016 the total N available to the growing grains was associated with the amount of N, taken up by anthesis (
Figure 3b).
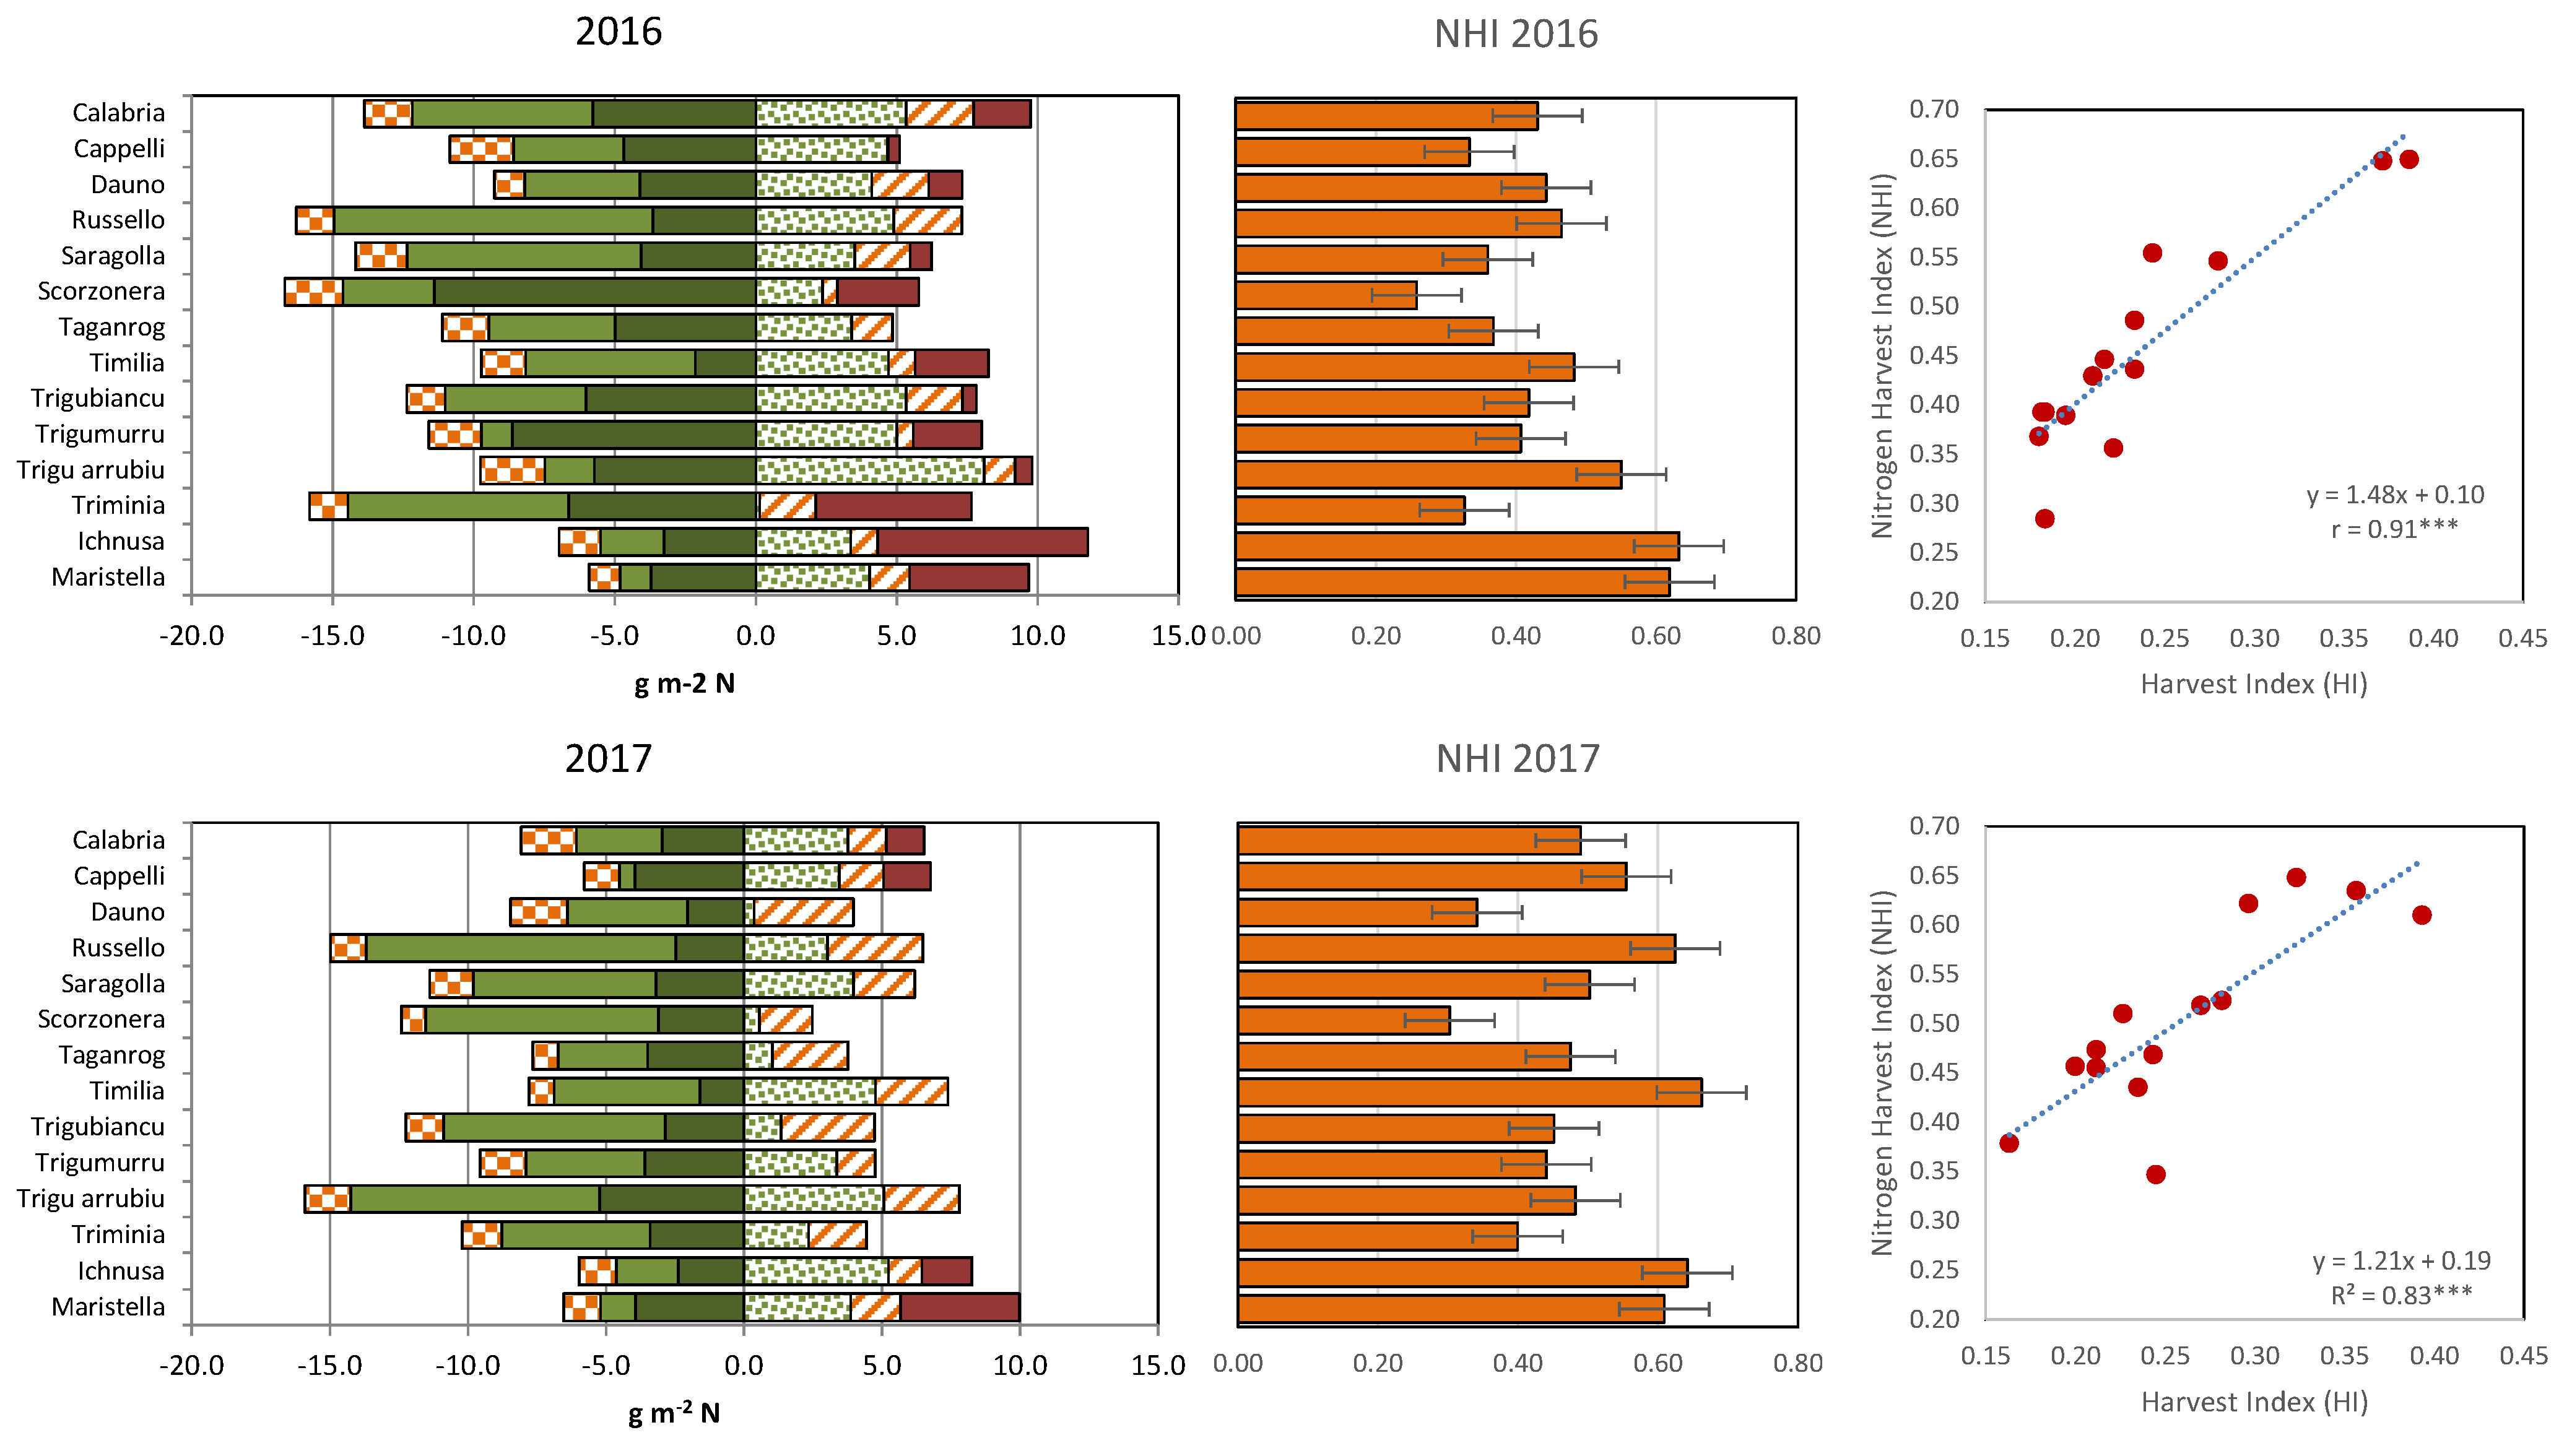
Despite the greater amount of total N present in their biomass at maturity (
Figure 4, left panel), in 2016 most tall cultivars delivered a lower amount of N per square meter to their mature grains, leaving more N in the straw (8.2–15.0 g m
−2) compared with Maristella and Ichnusa (4.8–5.5 g m
−2). The greater quantity of structural N, roughly assumed to correspond to the minimum N% observed at maturity in the straw multiplied by the straw dry matter, could be one of the reasons behind the limited capacity of cultivars like Scorzonera, Calabria, Trigu Murru, Trigu biancu and Triminia, to remobilize their large N source in 2016. In this year, these five cultivars were those that left more N in their straw and were also those with the highest amounts of structural N (from 5.8 to 11.4 g N m
−2). Summed with their lower post-anthesis N uptake, this meant that in this year the NHI for the tall cultivars (26–55%) was generally lower than those for short cultivars (62–63%) (
Figure 3, central panels). A positive and significant relationship was calculated in both years between NHI and HI (
Figure 3, right panels). In 2017, the differences between tall and short cultivars were less clear, but the short cultivars still displayed a higher NHI than most tall cultivars.
In 2017, relocation from the ear contributed more to the N found in the grains at maturity than in 2016 (
Figure 3), as also shown by the N remobilization efficiency (NRE) data. NRE expresses the quantity of N lost by the different organs between anthesis and maturity as a percentage of N content at anthesis. In 2017 the NRE calculated for the ears on the average of cultivars and N treatments (0.59,
Table 4) was higher compared with 2016 (0.42), although only half of the cultivars showed a significantly higher ear NRE in 2017 than in 2016, consistent with the significant cultivar × year interaction for this trait revealed by ANOVA (
Table S1).
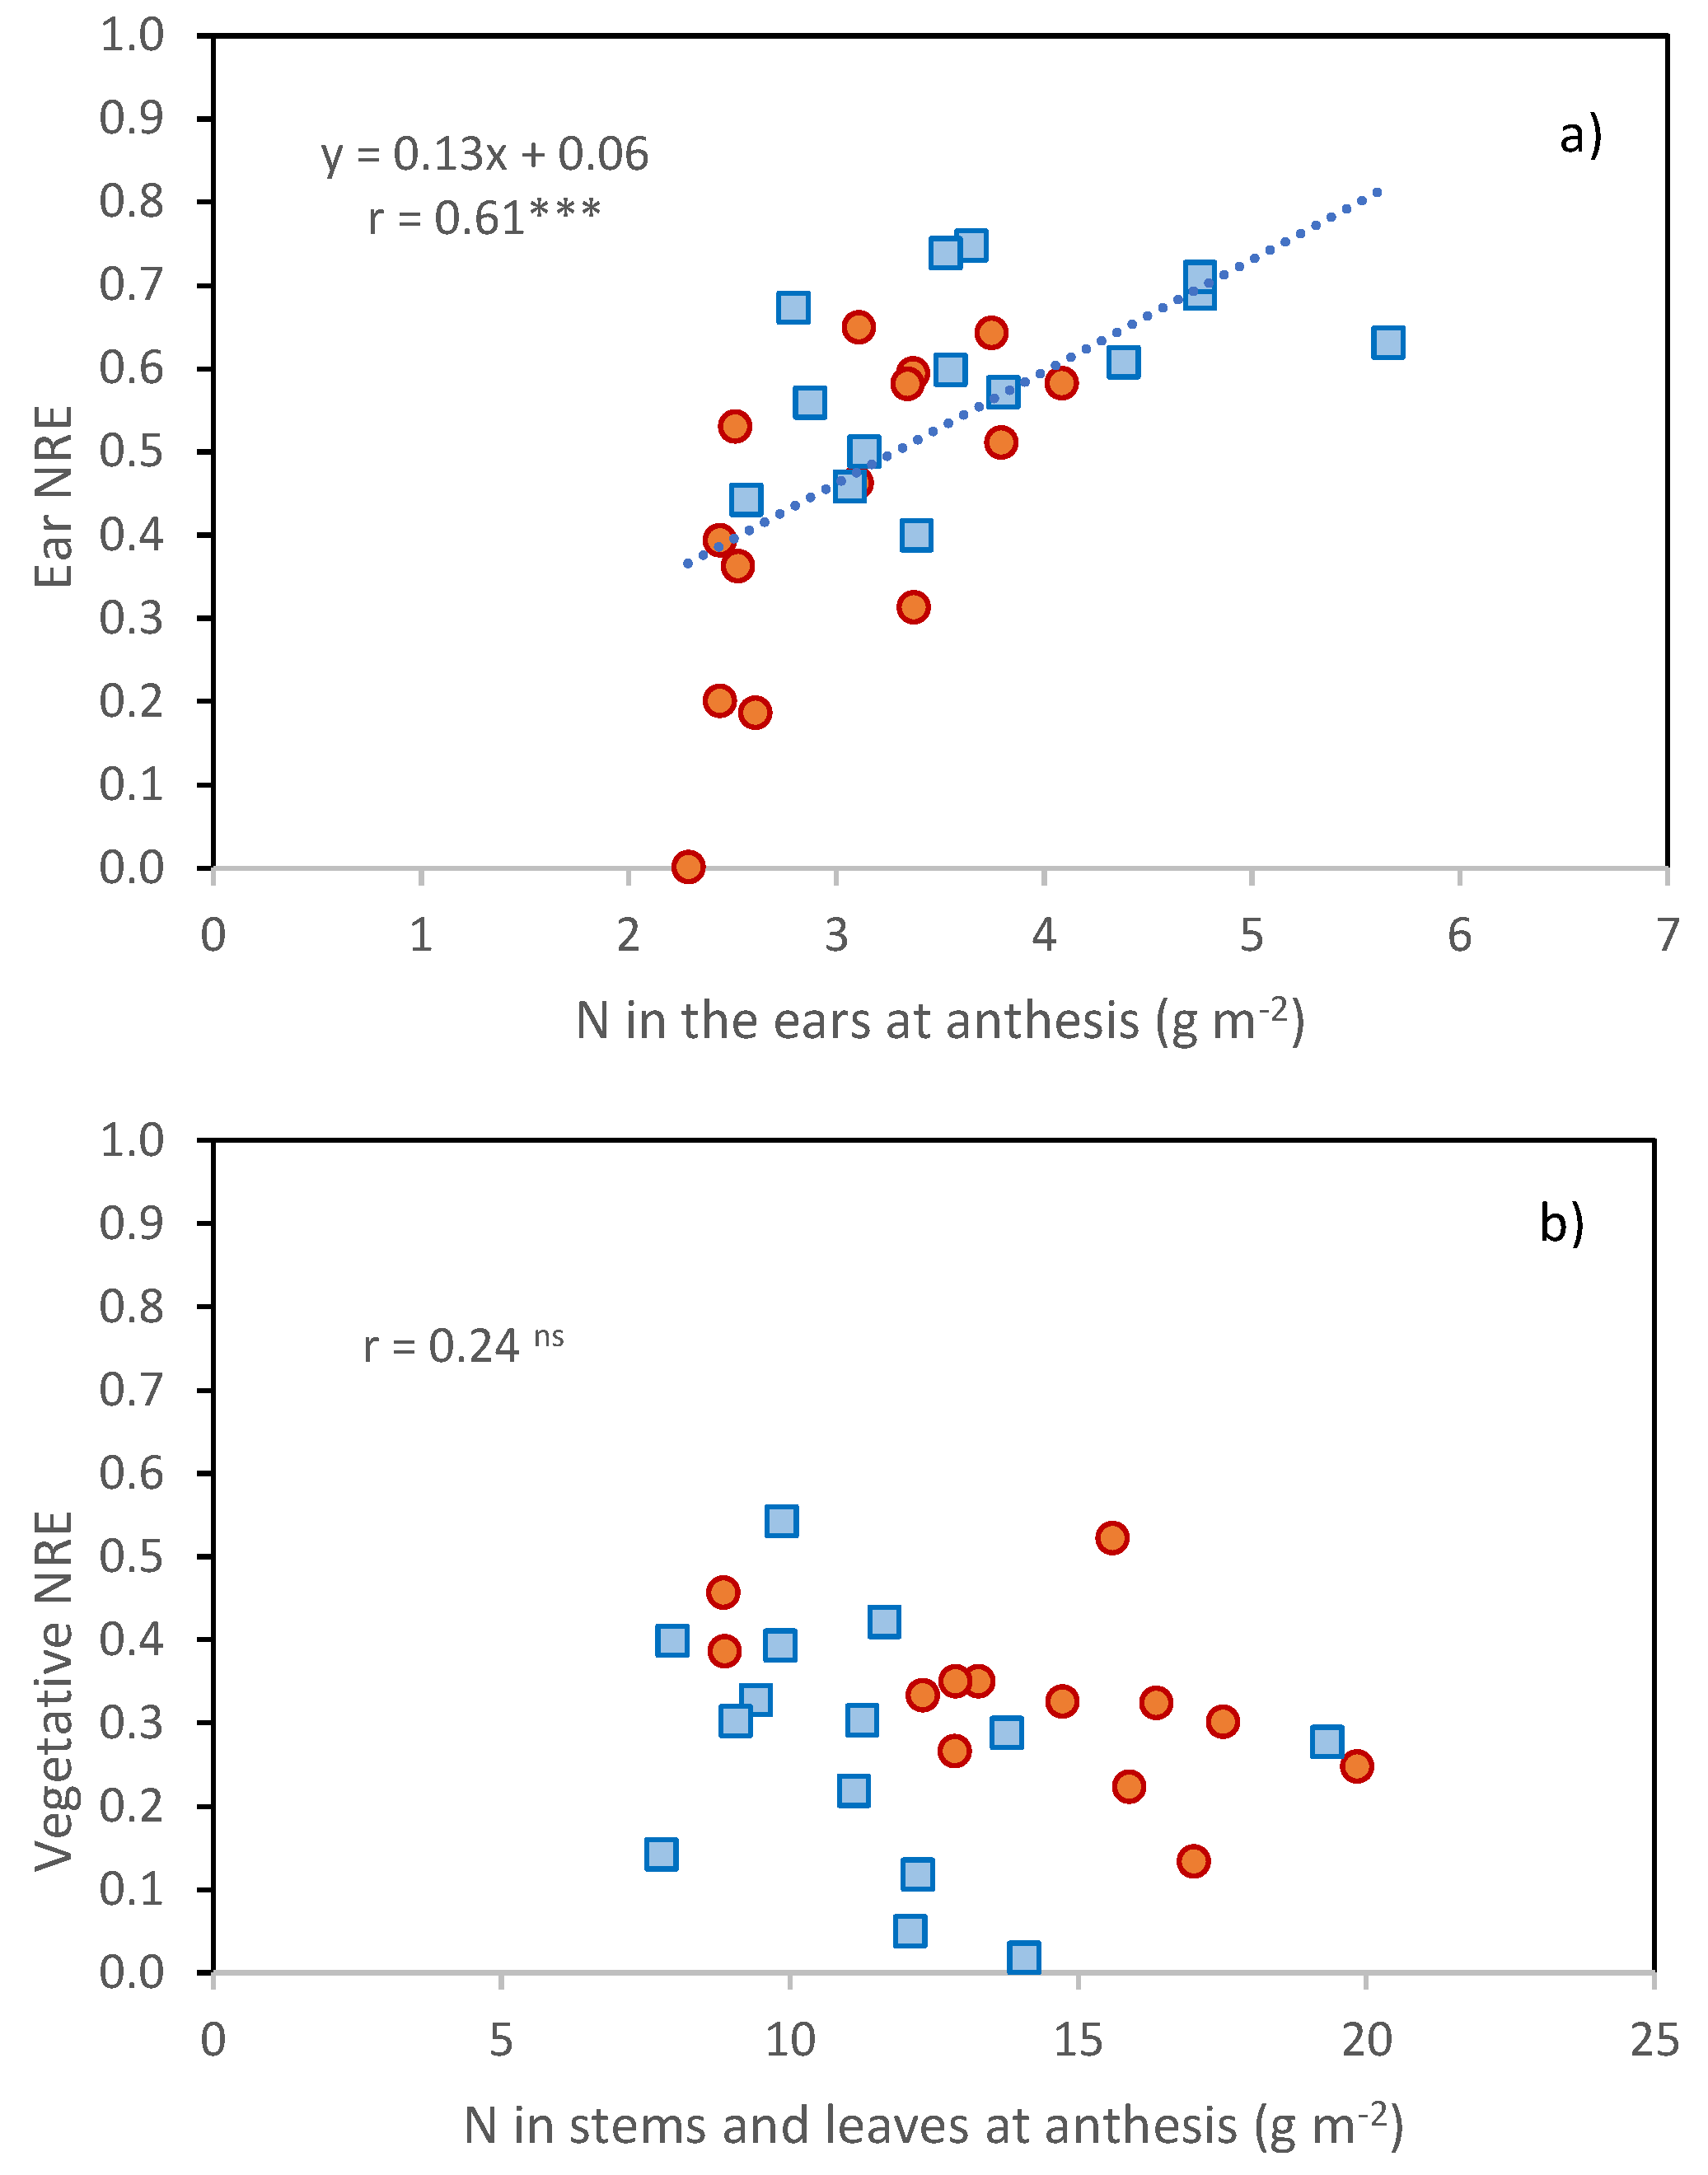
The ears were also the organs with the greatest decrease in N percentage between anthesis and maturity (from 2.13% to 1.01% on the average of the two years,
Table 5) compared with that exhibited by leaves and stems (from 1.47 to 0.89%,
Table 5). A positive relationship was found between N partitioned to the ears at anthesis and ear NRE (
Figure 5,
r = 0.61 ***), but not between N partitioned to vegetative tissues at anthesis and vegetative NRE.
3.5. Grain Nitrogen and Protein Percentage
No effect of year value was detected on the nitrogen content of the grain, whether expressed in percentage or in µg of N in the grain whereas the fertilization treatment determined an increment in the both grain protein percentage and µg of N in the grain (
Table S1 and
Table 4). The ranking of the cultivars in relation to the percentage of N in the grains or the µg of N in the grain was reliable because it was not influenced by the year or by the nitrogen treatment as demonstrated by the lack of any significant interaction involving the cultivar (
Table S1). Cultivar means are therefore presented and discussed.
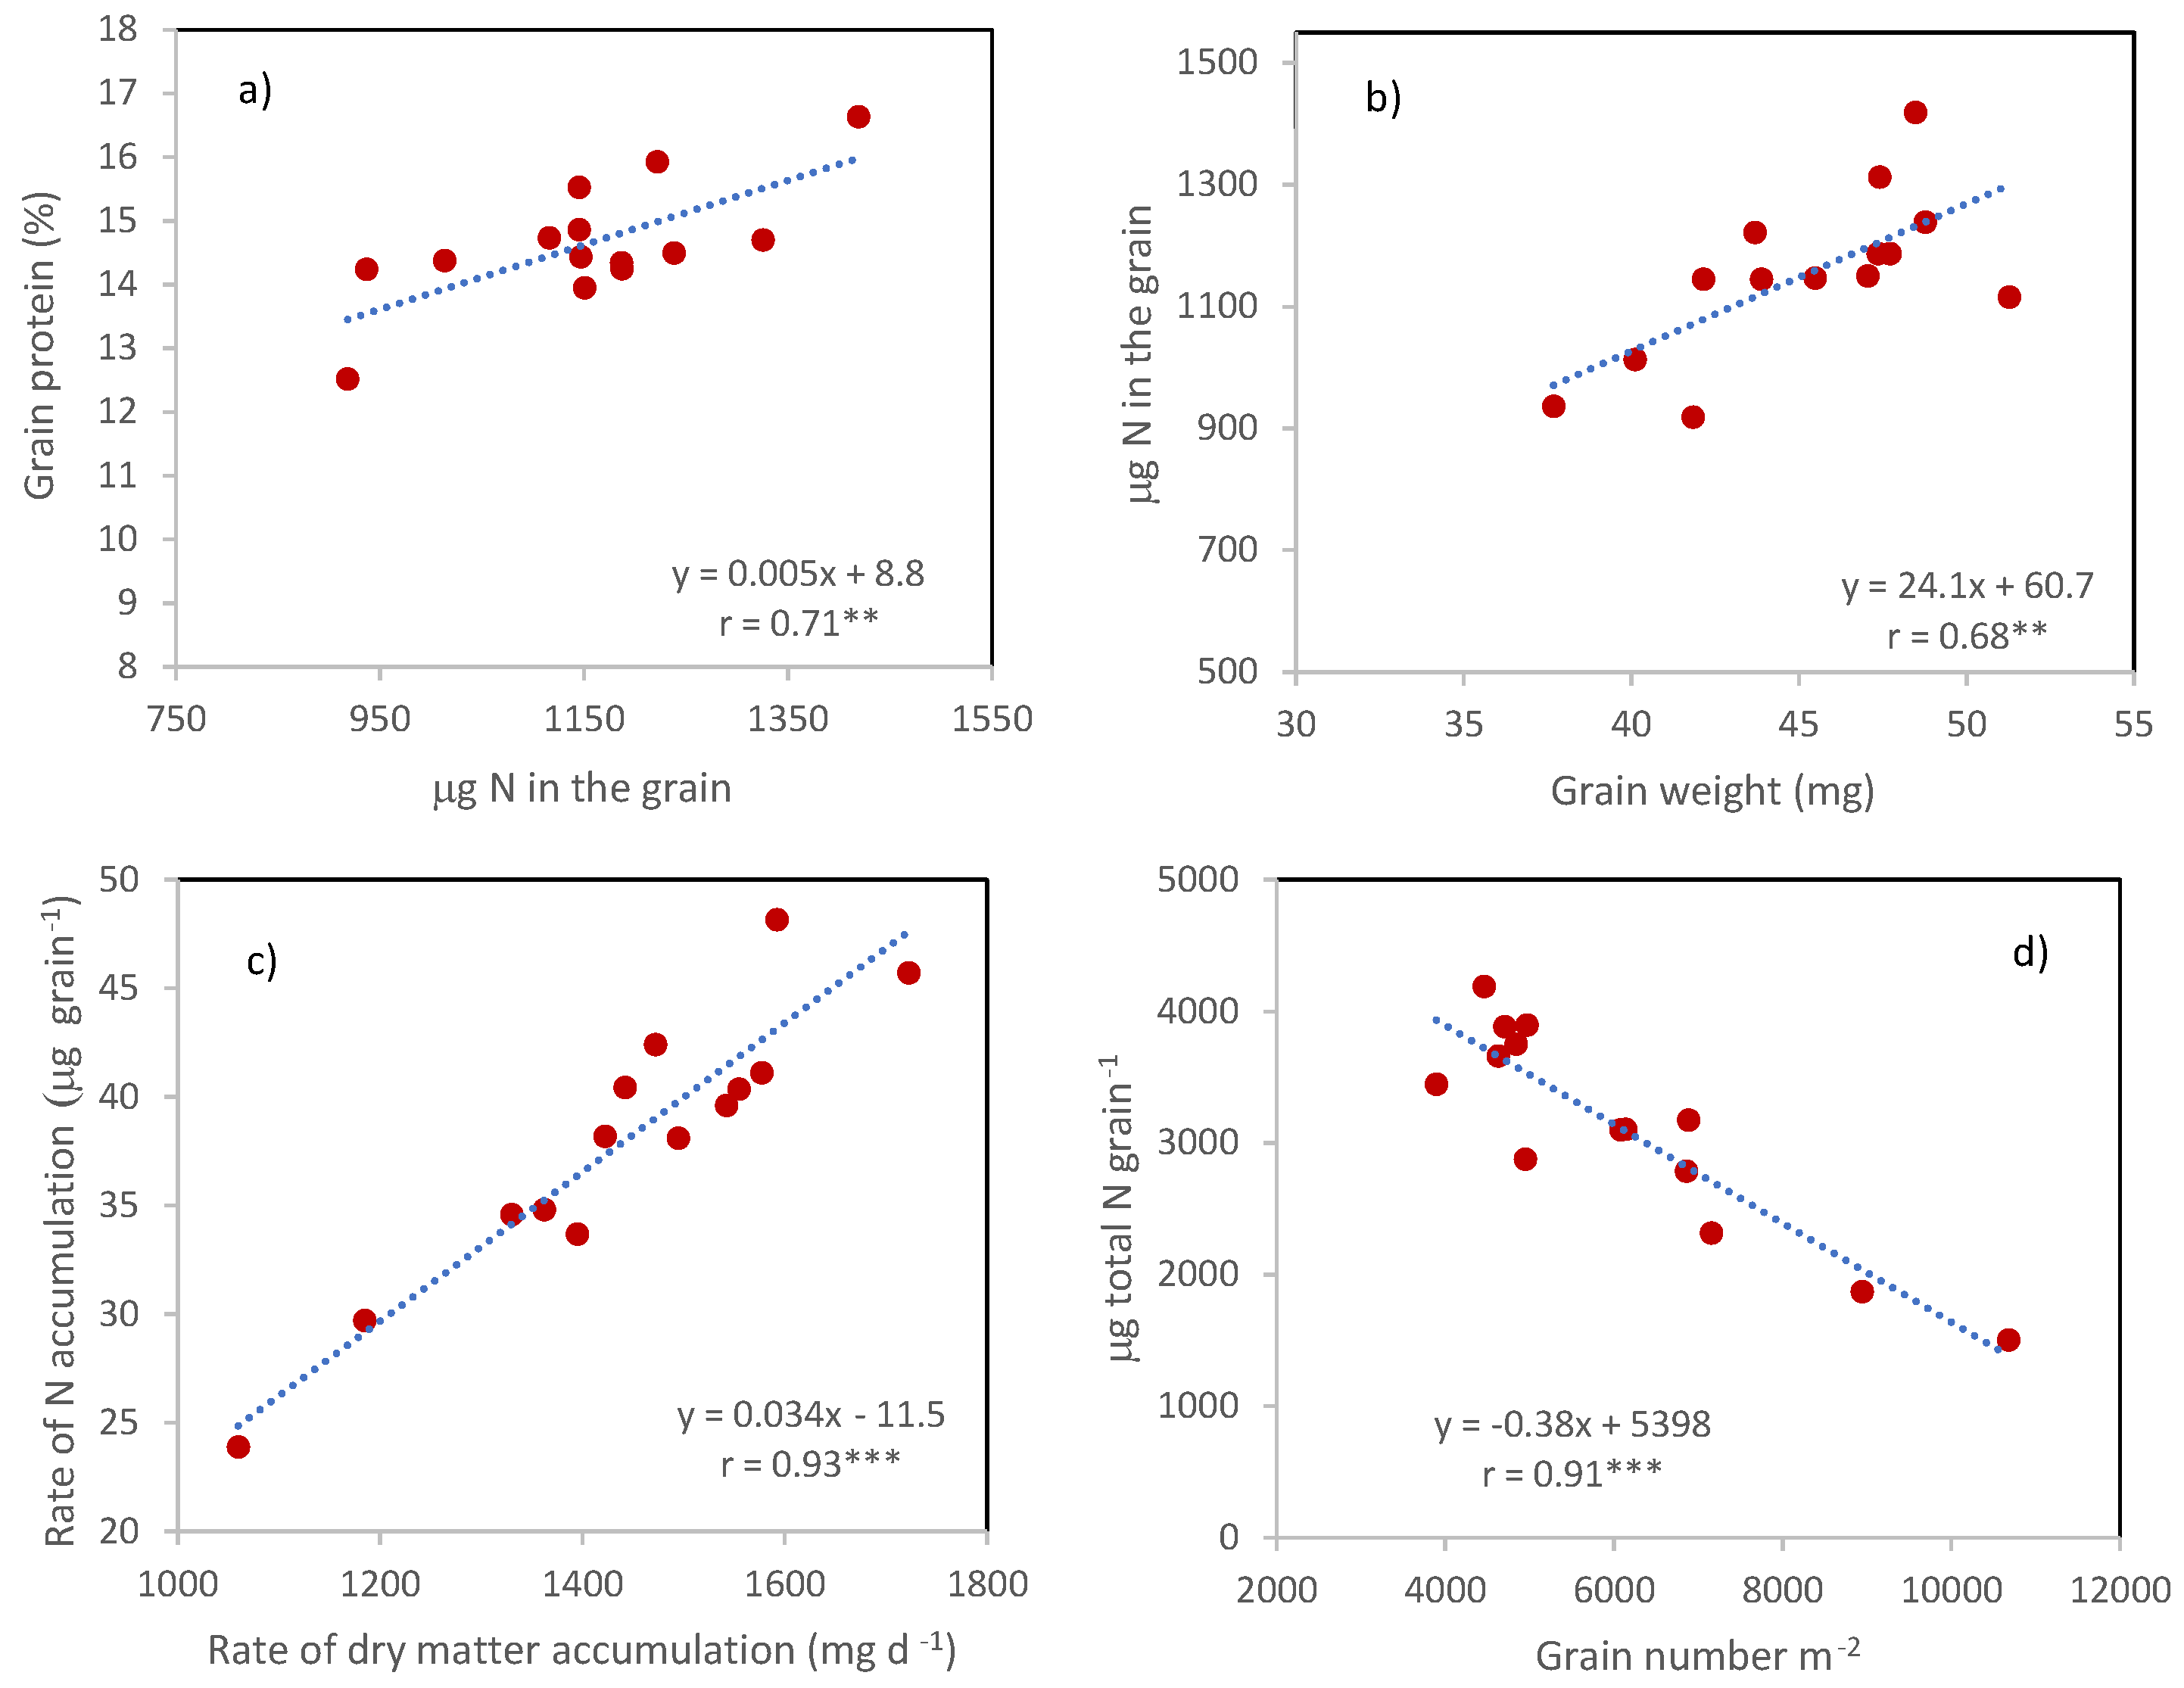
The differences between cultivars in grain protein percentage were not a consequence of the corresponding differences in grain weight since no relationship was detected between the two traits. Instead, they derived from the corresponding differences in the µg of N in the grain, being the two traits (grain protein percentage and µg of N in the grain) associated with
r = 0.71 ** (
Figure 6a). In turn, µg of N in the grain was positively associated with grain weight (
r = 0.68 ***,
Figure 6b), in agreement with the strong and positive correlation between the rates of dry matter and nitrogen accumulation in the grains calculated on the number of days between anthesis and maturity (
Figure 6c,
r = 0.93 ***).
The sink strength, represented by GNO, did not directly affect the µg of N in the grains, but reduced the amount of N potentially available for each grain, calculated as the ratio between total N and GNO (
r = −0.94 ***,
Figure 6d).
No effect of the N rate was observed on the pattern or strength of these relationships, which, therefore, also existed under the moderate N stress signalled by the crop NNIs grown at N46.
4. Discussion
Growing interest in the recovery of abandoned marginal land areas and the diversification of cropping systems in response to the spread of new social values [
21,
22] are what fuelled our interest in analysing wheat grain nitrogen content in a crop system suited to old durum wheat cultivars. The study takes into consideration low soil fertility, terminal water stress typical of the Mediterranean environment and two N rates, for which the higher rate is split between sowing and the stem elongation phase to maximize the effect of nitrogen on grain nitrogen content [
23]. Old Italian durum wheat cultivars have already demonstrated their capacity to produce grains with high protein percentages in these conditions [
1], and here, we explored the traits responsible for this high grain protein percentage.
The total N accumulated by anthesis under the low N supply was lower than the amount accumulated under the higher N rate because the additional application of N at the stem elongation phase, i.e., during the period of maximum crop growth, by improving the nutritional status of the crops as evaluated by the NNI, increased the crop growth rate and hence the total biomass at anthesis and its N concentration. This was the likely reason behind the lower GNO observed at N46 compared with that seen at N86, because fruiting efficiency was not affected by N deficiency and by the consequent decrease in ear N percentage, in agreement with [
24]. Our results are in accordance with those of [
7,
25] who found that the limiting crop growth rate induced by N deficiency around flowering can decrease the GNO and grain yield in wheat.
N deficiency favored the partitioning of more N to the ears at anthesis, as already observed by [
16], who suggested that the ear may be a prioritized sink for N under low N conditions. No positive effect of N deficiency on N remobilization efficiency was observed here in contrast with [
26].
Grain protein percentage was on average higher under the higher N availability, both because of a greater amount of N in the grain, and more importantly, of a lower grain weight. It is reasonable to propose that the greater biomass and presumably greater leaf area developed due to the greater amount of N available could have induced more severe water stress following anthesis as a consequence of a higher transpiration rate, considering that water availability rapidly decreased to very low levels after this phase. The great sensitivity of dry matter deposition to drought and high temperatures [
27,
28], thus, explains why grain weight was lower at the higher fertilisation rate.
In the end, the higher GNO obtained with the higher N rate was associated with a higher grain protein percentage but an unchanged grain yield, a phenomenon frequently observed in wheat grown in Mediterranean environments [
1,
29].
The set of old durum wheat cultivars compared in this experiment only comprised cultivars lacking the dwarfing
Rht1 gene, but they still varied in plant height. Most of them are landraces or pure lines belonging to the
mediterraneum type described by [
14]. They are all tall and late in flowering and were predominantly grown in the south of Italy and in the Italian islands (Sicily and Sardinia) during the first half of the 20th century. Two of the old cultivars, Ichnusa and Maristella, were derived from intraspecific crosses–mainly
mediterraneum ×
syriacum–utilized by Italian breeders since 1950 to obtain earlier and shorter pure lines [
30]. Therefore, two different combinations of plant height and anthesis date were represented in the set of old durum wheat cultivars analyzed; namely, ‘tall and late’ and ‘short and early’. Previous studies performed on similar sets of cultivars in the same type of Mediterranean environment demonstrated that most of them are able to produce grains with medium to high protein content even under low N inputs [
2].
The grain yield of the old Italian cultivars displayed low sensitivity to the severe terminal stress conditions of 2017. Old Italian cultivars are characterized by a higher grain filling rate compared with modern ones [
5], and this allowed them maintain high grain weights even under the severe water stress that characterized 2017, and in spite of the high temperatures and short time available for grain filling due to their late anthesis. Recently, the authors in [
4] demonstrated that the genes responsible for the late anthesis of durum wheat landraces are partly responsible for their high grain filling rate. The results of this experiment demonstrate that a late anthesis, if associated with a high grain filling rate, can produce large grains even under severe terminal water and temperature stress, with only one month available for grain filling. The high grain filling rate can also explain why grain protein percentage was not higher in the more stressful season, as usually observed [
31]. Moreover, a high grain filling rate is associated with a high N accumulation rate in the grains, resulting in a high N content and protein percentage [
32].
Under the crop system described, and in the two seasons characterized by a terminal drought of distinct severities, GNO was crucial for the variation in grain yield, as generally noted for wheat, but the particularly large grains of some cultivars partly compensated for their low GNO. The genotypic variation in GNO and in fruiting efficiency were strongly dependent upon one another, as previously demonstrated for wheat [
33,
34] and triticale [
35]. The consistently low fruiting efficiency of most cultivars, with the exception of the two early-flowering cultivars Maristella and Ichnusa, could have been, at least in part, a consequence of their lateness, which exposed the grain number determination period to stressful environmental conditions. Fruiting efficiency is proportional to grain set, and grain set can fall below 100% under stress [
36], and even under apparently favorable conditions in old bread wheat cultivars [
37].
Large genotypic variation was observed in the processes of nitrogen accumulation, partitioning and redistribution mainly associated with anthesis date and plant height. The combination of ‘tall and late’ traits permitted a longer duration of dry matter and N accumulation. The tall stature of most old cultivars, associated with their greater biomass and to their capacity to accumulate N by anthesis, was also presumably associated with their having a large root system [
16,
38], which could have favored N uptake. Root depth and extension is particularly important when, like in this experiment, low N fertilization rates are adopted [
21].
The late anthesis had a drawback effect on the capacity to prolong N uptake after anthesis; nevertheless, the total N (pre + post-anthesis N uptake) available to the grains of late cultivars was greater than that for the earlier ones. Post-anthesis N uptake in Mediterranean environments, although important, is extremely aleatory due to the uneven amount and distribution of spring rainfall. N translocation is therefore extremely important in order to feed the growing grains, although the NRE values for the vegetative tissues calculated in these experiments were much lower (particularly in 2017), in comparison with the genotypic variation reported by other authors, which ranges between 0.52 and 0.92 ([
16] and papers cited therein). Apart from the high proportion of structural N deriving from the tallness of most cultivars, it is plausible that the terminal drought had been so severe and the senescence process had occurred so rapidly, that remobilization was impaired. Finally, we cannot exclude that the low GNO—coherent with the agricultural system adopted [
1]—generated a sink limitation for N, particularly in the cultivars whose grains achieved a very high protein content. According to [
17], N remobilization, generally driven by N source, can become sink limited when the N content of the grains exceeds 1.1–1.2 mg N grain
−1. In fact, many of the cultivars in the present work had N contents that exceeded this level.
Ears represented the organs with the highest NRE in agreement with [
17], and their NRE was positively associated with the N in ears at anthesis.
5. Conclusions
The value of recovering abandoned marginal areas unsuited to high-input agricultural systems in the Mediterranean environment makes selecting the cultivars that can be adapted to this type of agricultural system an important challenge. One potential solution could be old durum wheat cultivars, which in these agricultural systems, can guarantee acceptable yield levels and high protein percentages. In the specific set of cultivars examined here, and in the context of two particularly dry seasons and a management approach suited to low-input systems, GNO played a twofold role in the N economy of old cultivars. On one hand, the GNO modulated the amount of N potentially available for each grain, and this was partly responsible for the grain N content and protein percentage. On the other hand, the low GNO probably limited the possibility of delivering the large N source to the grains.
By contrast, the large grains that characterized the majority of the cultivars, played a positive role in generating both grain yield, by compensating for the low GNO, and a high grain protein percentage, because the high grain filling rate, responsible for their large grains was associated with a high N accumulation rate in the grains, thus, resulting in a high N content and protein percentage.


