Article

A Typological Concept to Predict the Nitrogen Release from Organic Fertilizers in Farming Systems

Leibniz Institute of Vegetable and Ornamental Crops (IGZ) e.V., Theodor-Echtermeyer-Weg 1, 14979 Großbeeren, Germany
*
Author to whom correspondence should be addressed.
Agronomy 2020, 10(9), 1448; https://doi.org/10.3390/agronomy10091448
Submission received: 20 August 2020 / Revised: 16 September 2020 / Accepted: 18 September 2020 / Published: 22 September 2020
(This article belongs to the Section Soil and Plant Nutrition)

Abstract

:
The prediction of nitrogen (N) mineralization or immobilization in organic fertilizers is an important tool to optimize fertilizer use, especially in intensive agricultural systems. Our aim was to derive a model to predict the N mineralization/immobilization from readily available information on the properties of organic fertilizers in farming practice. On the basis of a literature review, a characterization of organic fertilizers was performed, revealing a large variance in fertilizer properties within the defined categories and subcategories. A partial linear model was derived and used for the prediction of N mineralization/immobilization based on the type of fertilizer and the carbon (C) to organic nitrogen (Norg) ratio. Depending on the previously defined category, a strong mineralization (e.g., plant- and animal-based commercial fertilizers) or a predominant immobilization (e.g., compost and slurries) was detected. For a total of seven main categories and their subcategories, individual models were developed. This work shows that the mineralization properties of organic fertilizers can be sufficiently predicted through a simple classification into a fertilizer category and through the C to Norg ratio.

1. Introduction

In conventional and organic crop systems, the management of plant nutrition and soil fertility is based on the supply of inorganic and organic nutrients. Organic fertilizers and crop residues are important nutrient sources for plants in sustainable crop systems [1]. This applies above all to the plant available N (sum of NO3–N, NO2–N, and NH4–N), which is usually the limiting nutrient in intensive plant cultivation systems [2].
Depending on the origin of the fertilizer, the proportion of N available to plants in organic fertilizers varies greatly [3]. The inorganic N content (mainly NH4–N) in organic fertilizers ranges from 0% of total N in keratin-based fertilizers to 70% and more in liquid organic fertilizers. A considerable part of the N is present in an organically bound form. The organic matter of fertilizers is first mineralized by soil microorganisms, and thus is converted into an inorganic plant-available form. Consequently, the amount of plant-available N from organic fertilizers in the soil varies in the first period (month within growing period) after application [3,4]. This fluctuation occurs within the same fertilizer class (e.g., keratin-based fertilizers), but also between fertilizer groups, such as manures, slurries, or commercial fertilizers [3,5]. Predicting N mineralization primarily from the organically bound N fraction in organic fertilizers is one of the most important objectives for improving the efficiency of N use in agricultural cultivation systems [4,6,7]. This knowledge is crucial because of a lack of information on the amount of plant-available N that is mineralized within the cultivation period.
To predict the N mineralization of organic fertilizers depending on their composition, several approaches have been pursued in the past, all using different quality parameters [7,8,9,10,11,12,13,14]. However, many of the relevant parameters in the models are not part of the standard analyses of organic fertilizers in agricultural practice and are not always useful to predict N mineralization [15]. Most of the models for the N release from organic fertilizer in the first year after application are based on the assumption of different organic pools, which are mineralized at different rates. Previous publications have suggested that knowledge about the different pools of organic matter cannot be meaningful without detailed knowledge of the soil properties and quality indices of organic fertilizers and climatic conditions [9,16]. Therefore, prediction of the nutrient supply from organic fertilizers is often not reliable [17,18]. A further reason is the large variety of organic fertilizers, some of which differ greatly in nutrient content, composition, application method [19], and quality [20], thus making individual fertilizer models considerably more difficult to investigate.
Previous researchers have investigated the N release properties of different classes of organic fertilizers, such as plant residues [2], manure [4,21,22], and waste water from the food industry [23] individually as a function of the C to N ratio. The authors pointed out several factors that influenced the properties of the N supply. They agreed that the C to N or the C to Norg ratio of the organic fertilizer was the main factor influencing the net N release within the first months after application under constant incubation conditions. Environmental conditions, such as soil water content, soil texture, and soil temperature, have an important effect on the nitrogen release from organic fertilizers [24,25,26]. A further factor that impacts the nitrogen release from organic fertilizers is the application method, for example, mixing or surface application [19]. It is also clear that biochemical composition plays an important role in improving the prediction of the N supply of organic fertilizers. The biochemical composition of organic fertilizers, such as neutral detergent fiber content, water-soluble N content, and lignin or polyphenol content, can have a significant influence on net N mineralization [2,27,28]. The proportion of this easily degradable pool in an organic fertilizer depends on several properties, such as chemical composition and environmental conditions. Several publications have pointed out that the short-term N supply of inorganic N significantly depended on the ratio of organic carbon to organic nitrogen (C to Norg) or the ratio of organic carbon to nitrogen (C to N) in organic fertilizers [4,8,29]. Organic fertilizers with a C to Norg ratio below 20–30 lead to the mineralization of the nutrient N, while higher C to Norg ratios lead to N immobilization followed by a mineralization or immobilization process [2,30]. When the C to Norg ratio in organic fertilizers is higher than 30, the risk of immobilization of inorganic N increases, which is associated with a decrease in plant-available N. In such a case, the risk of yield loss significantly increases the economic risks, as the expected fertilizing effect may not occur. The main environmental factors influencing the degradation of organic matter under arable farming conditions are soil water content and soil temperature [28]. However, knowledge of the factors that predict organic fertilizer mineralization is not sufficient to explain net N mineralization [17].
In agricultural practice, the analysis of several quality parameters of organic fertilizers involves a great deal of effort, which makes the establishment of analytical methods to measure potential N release difficult. Due to the high complexity, it is not realistic to identify better relationships than the relationship of C to N for predicting the N mineralization of organic matter [31]. To solve this problem, Morvan, et al. [31] characterized slurry based on several quality characteristics. After characterization, they successfully classified organic fertilizers in terms of composition criteria and C and N mineralization properties. Their work implied that organic fertilizers of the same origin should follow a comparable mineralization course. Therefore, it should be possible to predict N release from organic fertilizers within organic fertilizer classes and subclasses. Therefore, a broad spectrum of different fertilizer variations can be evaluated based on the literature data from incubation experiments.
First, we wanted to provide an overview on the nutrient contents and mineralization properties of organic fertilizers in agricultural practice, from which it was possible to carry out an investigation of the short-term mineralization of organic fertilizers and plant residues according to a classification with data that were usually available in agricultural practice. From this, a tool was developed, which was able to provide recommendations for a wide range of applications of organic fertilizers in agricultural practice. We further established that the relationship between the N release and C to Norg ratio of organic fertilizers could be predicted by the type and processing of the fertilizer. Therefore, categorization into simple main groups and subgroups of organic fertilizers would likely improve the prediction of N input from organic fertilizers using standard parameters without complex analysis of the applied material.

2. Materials and Methods

2.1. Data Selection

In order to achieve an overview of the mineralization behavior as a function of the measurable quality parameters of organic fertilizers in the soil, a literature review was carried out. The selected studies on N supply with organic fertilizers and plant residues were carefully checked and investigated with ISI Web of Knowledge (https://apps.webofknowledge.com) and Google Scholar (https://scholar.google.com). The search was conducted according to the following five criteria to select suitable data: (1) To avoid random environmental effects such as tensile stress or temperatures below 5 °C, and to ensure a distinction between different N sources, only incubation studies without plant N uptake were selected. (2) Mineralization time history studies should have more than three sampling times. (3) To avoid atypical conditions, publications should provide sufficient information on organic fertilizers such as C and N content, soil properties such as texture, and experimental conditions such as temperature. (4) For the calculation of net N mineralization, the control without fertilization should be considered or included in the results of the expression of the net N mineralization/immobilization. (5) In order to avoid the probability of atypical incubation conditions, some studies were excluded that presented mineralization curves that differed significantly from the expected values, for example, if net N mineralization release rates were unexplainably much higher than 1 g g−1 Norg, which implied an additional N release from soil organic matter.
Following this selection procedure, 98 studies with 835 observations representing the N mineralization kinetics of soil organic matter were used for data analysis. The soil moisture in the experiments was adjusted between 40% and 80% of the maximum soil water holding or field capacity, known as the optimal for organic matter mineralization. The soil was incubated in glass and plastic jars or plastic bags under aerobic conditions. The documented amount of soil for the experiment ranged between 80 and 2500 g, but not each experiment offered this information. The incubation temperatures in the studies ranged between 5 and 35 °C. Organic fertilizers were mixed homogenously with the soil in each study. The applied amount of fertilizer N ranged between 10 and 1500 mg N kg−1. Because of a lack of information, not all required information was available in each study. However, incubation temperature, applied fertilizer, and soil water content were documented in each study. The soil types varied widely among the studies and ranged from sandy to clay soil. However, a soil group classification was performed due to LUFA soil classification because of different documentation styles.
The evaluation and later model development were based on a classification of organic fertilizers mainly by type of raw material and processing. The properties of the processing steps before their application in the field, such as composting or anaerobic processing, were used as further classification criteria. Table 1 shows the seven classes and 27 subclasses used in the present study. The main classes were formed in a practical way from commercial fertilizers and farm manures, to which compost was also assigned. The commercial fertilizers were mainly residues from the industrial processes of food production or seed-based fertilizers. Green manure was defined as fresh plant material, while farmyard manure was split into solid manure from ruminants (cattle/sheep manure) and swine, as well as solid manure from poultry and slurry. Finally, compost was prescribed as material composted at temperatures of approximately 60 °C. The subclasses were defined as subgroups of the main classes. Biosolids are defined as the solid residues of municipal wastewater treatment [32].

2.2. Determination of net N Mineralization from Organic Fertilizers

Data describing the soil properties and the experimental set-up were taken from text passages or tables from the analyzed publications. N release was extracted from the figures with the R (GNU) package “pixmap” (Team 2014) to obtain the values from the diagrams. To calculate the daily cumulative net release from the organic fertilizers in the soil/fertilizer mixtures, the following formula was used:
N m = ( N m i n s f N m i n s ) N o r g
where Nm is the net N mineralized or immobilized from the Norg of the organic fertilizer; Nminsf represents the sum of NH4–N and NO3–N in the soil/fertilizer mixture during the incubation of the soil/organic fertilizer mixture; amd Nmins describes the sum of NH4–N and NO3–N of the soil without the addition of an organic fertilizer. The organic N content of the organic fertilizer (Norg) was calculated as the difference between total N and fertilizer inorganic N (NH4–N and NO3–N).
A first-order kinetic model was used to represent the course of N mineralization/immobilization from the organic fertilizer:
N r = N 0 ( 1   e x p ( k ·   w ( T ) · t ) )
where Nr is the amount of net mineralized/immobilized Norg, as a sum of NO3–N and NH4–N released at time t after application; N0 represents the maximum potential mineralization/immobilization rate of added Norg. If Nr and N0 are positive, mineralization processes dominate, whereas negative values describe immobilization processes. The parameter k represents the first-order rate constant expressed as thermal time after cooperation [°Cd]−1 at Topt; w(T) is a temperature adjustment calculated according to Thornley [33] and De Neve [34], where Topt, Tmin, and Tmax are 35, −5, and 45 °C, respectively; T is the temperature of the incubation experiment.
w ( T ) = ( T T m i n ) q ( T ) · ( T m a x T ) ( T o p t T m i n ) q ( T ) · ( T m a x T o p t ) q ( T ) = ( T o p t T m i n ) ( T m a x T o p t )
After calculating the values for N0 and k for each N mineralization/immobilization observation, the relationships between the ratio of C to N and C to Norg were analyzed by a stepwise rank correlation analysis. Due to a strong significant correlation between N0 and the C to N ratio (data not shown), the C to Norg ratio was selected for the model approach.
Thereafter, the representation of N0 was conducted using a partial linear model of organic changes within the first 150 days after the application of organic fertilizer as follows:
region1(CNorg) = (y1 × (x2 − t) + y2 × (CNorg − x1))/(x2 − x1)
region2(CNorg) = (y2 × (x3 − t) + y3 × (CNorg − x2))/(x3 − x2)
region3(CNorg) = (y3 × (x4 − t) + y4 × (CNorg − x3))/(x4 − x3)
N0 = if(CNorg ≤ x2; region1(CNorg); if(CNorg ≤ x3; region2(CNorg); region3(CNorg))))
where x1 to x4 are the limits of the linear models that represent the C to Norg ratio (CNorg of organic fertilizer), and y1 to y4 represent the net N mineralization of organic N (g g1 fertilizer Norg). The parameterization was performed by the R-package “optimx.” To avoid unrealistic results, all linear parts of the partial linear model should show a negative increase due to a general negative relationship between the N mineralization and the C to Norg ratio in organic fertilizer. This requirement had no relevant effect on the model error.

2.3. Statistics

For the root mean squared error (RMSE), the mean absolute error (AEM) was used to describe the performance of the model. The influence of the quality parameters on the maximum release rate of organic fertilizers was tested by stepwise linear regression analysis with the R package “olsrr.” To test the effect of soil type, a classification of the presented soil information according LUFA was conducted previously.
A E M = 1 n i = 1 n ( y i y ^ i )
R M S E = 1 n i = 1 n ( y i y ^ i ) ²

3. Results

The contents of total Norg in the selected main categories and subcategories of fertilizers are shown in Figure 1. Compared with the organic C content, the N content within most of the fertilizer groups had a wide range (Figure 1 and Figure 2). Only the materials that are mainly decomposed by microorganisms in the preparation process (i.e., manure, compost, and slurry) and commercial organic fertilizers have a low variation in Norg content. The commercial organic fertilizers of animal origin are characterized by the highest Norg contents among the main groups, mostly above 90 g Norg kg−1 of dry matter (DM). The production residues, legume meals, plant-based mixtures, and vinasse follow with values between approximately 40 and 80 g Norg kg−1 DM. Interestingly, leguminous green fertilizers show only slightly lower Norg contents than the commercial fertilizers of plant origin. The lowest Norg contents are documented for the already fermented or composted fertilizers, i.e., cattle/swine/sheep manures, manure compost, plant compost, and fungi biomass manure. The Norg contents of the subgroups hardly differ from those of the corresponding main groups.
The C to Norg ratio for most of the commercial organic fertilizers of animal origin is typically characterized by a value below 10 (Figure 3), for example, keratin-based fertilizers (mean C to Norg = 3.7), legume meals (mean C to Norg = 9.1), and Vinasse (mean C to Norg = 8.9). In contrast, the C to Norg ratio is higher for most plant-based commercial organic fertilizers, and also the range of variation shows an increase (Figure 3). Manures, green manures, and wastewater should be highlighted here, as their ranges of variation are amongst the highest.
To determine the release of Norg (N0) in the first 150 days after manure addition, a simple exponential model was used to interpret the mineralization course for each study. The calculated N0 from organic fertilizer varies widely within most organic alteration groups (Figure 4). In addition, according to N0, the range of variation of the N mineralization or immobilization among the organic fertilizer groups was high. The mean N0 was highest in the main groups of commercial fertilizers of animal origin, poultry manure, and commercial fertilizers of plant origin. Here, on average, 50%, 41%, and 40%, respectively, of the added Norg was released within the first month after application.
Arranged by main groups, the release properties of the organic fertilizers decrease from commercial fertilizers of animal origin > poultry manure > commercial fertilizers of plant origin > green manures > composts > slurries. In particular, seed meal, blood meal, and hair, horn and feather residues are effective organic fertilizers, with a mean Norg release of approximately 50% within the first 150 days after application. Conversely, the Norg fraction in solid farmyard manures and composts tend to immobilize inorganic N in the soil (Figure 4). The N release from composts and solid farmyard manures shows low mineralization to moderate immobilization. In general, the subgroups follow the same pattern as their corresponding main groups. Poultry manure, however, has a similar mineralization pattern as the subgroups of the commercial fertilizers of animal origin and the commercial fertilizers of plant origin. Plant residues and wastewater show a strong immobilization up to a high mineralization rate of >50% of total Norg within the first 150 days. The variation of inorganic N release differs strongly within the subgroups (Figure 4). The highest immobilization was estimated after the application of wastewater and non-legume green manure, which reached up to −200%.
The mineralization rate constant (k) shows high variations among the main groups and subgroups (Figure 5). This is most pronounced for plant-based commercial organic fertilizers and composts. Green and solid farmyard manures display a smaller range and a similar mean k of approximately 0.35. In most publications, there was no evidence of a relationship between the Corg and N content, suggesting that k is likely to be affected by temperature and quality indications not presented here.
By partial linear regression, a negative relationship between N0 and the organic C to Norg emerged for the subclasses (Figure 6 and Figure 7). Due to the very different progression of mineralization/immobilization within the solid farmyard manure group, poultry manure was excluded from this group and presented separately (Figure 6). Due to the chosen partial linear model, the main groups and subgroups of fertilizers follow predominantly the same partition pattern. The mineralization of fertilizers that only consist of a few components and feature a small C to Norg ratio, such as horn-based fertilizer, (hair, horn, and feather residues and keratin based mixtures) did not exhibit a significant correlation (p > 0.05) with the C to Norg ratio. The N mineralization within the different fertilizer main classes as a function of the C to Norg ratio generally showed different courses. The courses of the net mineralization for composts differed from most fertilizer categories (Figure 7). Even for composts with narrow C to Norg ratios, a low mineralization of approximately 5% of the total Norg or immobilization of mineral N was forecasted.
The t- values of the stepwise linear regression analyses of N0 on the C to N and C to Norg ratios are −6.4 and −25.1, respectively (Table 2 and Table 3). No significant relationship was found between k and the quality parameters instead of significant temperature effects (Table 4).
The model-dependent RMSE of the prediction of the mineralization rate and the correlation coefficients of the prediction show the lowest values, with approximately 0.10 and 0.14 g g −1 Norg for composts and commercial organic fertilizers, respectively. Higher values for the RMSE of above 0.21 and 0.27 g g −1 Norg are measurable in the main groups of manures and commercial fertilizers from plant material (Table 5). The plant residues by far, however, show the highest RMSE. A differentiation into subgroups resulted in a clear improvement of the prediction for most cases; however, this is not adaptable for all subgroups.

4. Discussion

The data obtained from this literature review confirmed that the realization of N supply in fertilizer management with organic fertilizers depends on the type of fertilizer. After the application of organic fertilizer, the Norg has to be converted by soil microorganisms in order to become available to plants. Thus, the amount of plant-available N released from organic fertilizers is generally lower than the amount of plant-available N after the application of synthetic fertilizers. Depending on the treatment and composition of the fertilizer, the proportion of inorganic N hardly differed within commercial organic fertilizers of animal and plant origins. The assigned fertilizers of the respective group featured a high N content, and thus revealed a low C to N ratio. Hence, commercial organic fertilizers of animal and plant origins provided a high amount of plant available N [35,36,37,38]. The N fractions in most commercial organic fertilizers are mainly comprised of uniform and relatively pure substances, such as keratin, blood proteins, or plant proteins. Those proteins are readily degradable, and therefore are rapidly mineralized by the soil microbial community [39]. Therefore, the high net N mineralization rates observed for both groups can be explained by the very high proportion of readily available Norg for microbial conversion in the soil [40].
It is noteworthy that, at a similar net N release of approximately 40–50% (0.4–0.5 g g Norg−1), the average C to N ratio of plant-based commercial organic fertilizers was higher than the C to N ratio of those of animal origin. It is possible that readily degradable proteins of both groups are converted into inorganic N during the first 150 days after application, whereas the long-chain organic compartments present in plant-based commercial organic fertilizers are mineralized much slower. In commercial organic fertilizers of plant origin, these are usually components of stable compartments with a high C to N ratio, such as lignin and polysaccharides, which partly explain the higher total C to N ratio in the material. Polysaccharides such as hemicellulose and cellulose in legumes [41] and increased amounts of aromatic compounds in production waste [42] also have a decelerating influence on the mineralization process. Differences in short-term N release could probably be explained by an inhibitory effect expressed in the hemicellulose, polyphenol to N ratio, lignin, or lignin and polyphenol to N ratio [39,43]. However, due to the lack of detailed information on the content of lignin, hemicellulose, or polyphenolic substances in most publications, it was not possible to further investigate the correlations between these quality parameters and the course of N release.
The above-mentioned quality parameters also occurred in varying proportions in green manure fertilizers, which consisted of different shares of shoots, leaves, and seeds. As shown in this literature overview, other studies have also demonstrated a high variation of the C to Norg ratio within this main group and a highly negative correlation of the C to Norg ratio with the net N mineralization [27,44]. The critical C to Norg ratio for the net N immobilization was 26 for green manures, as previously observed by Trinsoutrot et al. [45]. With regard to their immobilization behavior, green manure fertilizers behaved analogously to the group of commercial fertilizers of plant origin.
A strong negative relationship between the C to Norg ratio and the net N mineralization was shown for most of the other fertilizer classes (Figure 6 and Figure 7). The critical C to Norg ratio varied only to a small extent, whether or not the negative relationship was significantly pronounced. However, this depended mostly on the variation of the C to Norg ratio within the fertilizer classes. This could be observed after the application of keratin-based fertilizers, whose mineralization behavior showed no significant dependence on the C to Norg ratio due to a small variance in the C to N ratio (Figure 6). There could be a link between the mineralizable fractions of commercial organic fertilizer of animal origin and solid farmyard manures from ruminants, an assumption derived from the course of the partial linear model (Figure 6 and Figure 7) of both fertilizer classes. The N mineralization of commercial fertilizers of animal origin and solid farmyard manures (excluding poultry manures) followed a similar pattern. Similarities in the protein composition, breakdown products, or composition between the two fertilizer groups could be related to the fact that both fertilizer groups are of mammal origin (with the exception of feather meal). The divergence in the course of the net N mineralization of poultry manures was probably related to their high proportion of urea. Similar to both groups of commercial fertilizers, poultry manures had high levels of readily microbial available N, and their low content of fiber could accelerate the N mineralization [30] as compared with manures of different animal origin.
The main reason for the difference in the net N mineralization among poultry manures and the remaining solid farmyard manures could be in the concentration of uric acid and total N or denitrification losses [46,47]. Uric acid is rapidly hydrolyzed to urea, and then presented in plant-available form [48,49]. The content of uric acid that was converted into inorganic N before application could have had an influence on the proportion of Norg released from the fertilizer. The remaining solid farmyard manures were characterized by a very low net mineralization within the first year of application. This was in line with several publications that have investigated the N availability of swine, cattle, sheep/goat, and horse manures [4,50,51]. In the composting process, inorganic N is reduced and the stabilization of Norg is increased. Our results also indicated that the immobilization of Norg outweighed the N mineralization immediately after the application of manure [4].
In contrast to solid farmyard manures, a high share of inorganic N in the total N pool characterized the group of liquid fertilizers. In contrast, the net N mineralization from the Norg content of these fertilizers was low. Our data implied that the Norg content of the manures induced the immobilization of inorganic soil N by the microbial soil community. This was supported by the wide C to Norg ratios, which were associated with immobilization in the other fertilizer groups. Moreover, it could not be excluded that gaseous N losses via N2, N2O, and NH3 influenced the results. This was consistent with several publications where a net N immobilization was observed in the first 21 weeks after the addition of biogas or solid farmyard manures [52,53,54,55]. Other authors have also pointed out a reduction in net N utilization associated with an increased proportion of fibers in source materials or diets [56]. Approximately 25% of NH4–N in manure was immobilized within the first two weeks after application by the soil microbial community or by the mineral phase of the soil [53,57]. This could also explain the negative inorganic N availability and the relationship between the C to Norg ratio of organic change and N release. Compost is an organic fertilizer that has been stabilized by microorganisms during the composting process [58]. During the composting process, the organic N was converted into stabilized organic forms, while the easily degradable fraction decreased. Therefore, the converted stabilized Norg generally showed a very low release of inorganic N in this evaluation.
The mineralization rate constants showed a high variation over most organic fertilizer classes and subclasses. No general statements about the relationship between fertilizer quality and mineralization rate could be derived from this work. However, it could be stated that in most of the evaluated incubation experiments, a fast release rate was observed. The influence of the soil water content, which was found in many publications [59,60], could not be assessed in this work, because the water content was always adjusted to the optimum required for the microbial activity. The particle size of the fertilizer could also impact the mineralization rate constant. For example, the processing of organic fertilizer into flour increased the fertilizer’s particle surface area. This enlargement of access for the microbial activity resulted in a quicker mineralization of the particles [39,59]. However, no clear evidence of a dependence of processing on k was found in this work (Table 4).
In some publications, the first day for the determination of net N mineralization was probably chosen too late. This could have resulted in an underestimation of the mineralization rate constant, as the maximum cumulative release could already have occurred between the first and second measurement dates. Due to the high variation of incubation temperatures and in relation to the mostly missing information on ingredients, an effect of multiple sugars and aromatic compounds on the mineralization or immobilization rate could not be excluded, but was also not quantified by our data. The main factor for the prediction of the mineralization rate constant in this data compilation seemed to be the soil temperature. Other influencing factors, such as the impact of the composition of the organic fertilizer on the mineralization rate constant, the C to Norg ratio, or the N content were not applicable here. The results presented here were taken as the mean values of the temperature-dependent mineralization rate for our model. In contrast to the mineralization rates presented in this paper, here again, the range of N mineralization was arguable.
In previous articles, the variation of the inorganic N availability from commercial organic fertilizers of animal origin was explained by the incubation temperature [61], the immobilization of inorganic N in the presence of high inorganic N contents in the soil [62], or by soil texture effects [63]. On the contrary, the correlation analysis carried out in this work suggested that the main factors for the mineralization rate could be described by the C to Norg ratio of the fertilizer. It should be noted that all plant residues caused net N mineralization if the incubation period was extended [2]. This implied that the prediction of the net N immobilization through a one-pool model did not project the dynamics for a long-term consideration of net N mineralization from organic fertilizers. In theory, a two-pool model seems to be more suitable. However, the development of a goal-oriented model requires standardized incubation conditions with a high temporal resolution. Better results from the compiled data were obtained using a one-pool model, which could be due to the various incubation conditions in the investigated experiments. Furthermore, the predictions of net N immobilization with the one-pool model were more robust and led to a better prediction than with several pool models [62,64]. As suggested by [63], the remineralization of immobilized N was not easy to determine, as it was influenced by several factors that were not available in agricultural practice. The timing and extent of remineralization seemed to depend on the soil type, as well as on the soil temperature [11], which was not quantifiable in this work.
Our results emphasized that the type and the processing of organic fertilizers were largely responsible for the N composition and mineralization properties. Thus, untreated organic fertilizers such as keratin fertilizers or legume flours showed the highest average release rates, whereas composting or anaerobic/aerobic storage resulted in a reduction of the net N mineralization. The main factor for the determination of the net mineralization was, in addition to processing, the C to Norg ratio (Table 2). Within most of the fertilizer categories used in this publication, an individual correlation with the C to Norg ratio was evident to determine the course of the N mineralization/immobilization. Hence, components such as hemicelluloses affected these dynamics [27,31]. The reasons for the variation of the C to N ratio within the fertilizer groups were manifold and usually reflected the proportion of proteins or multiple sugars (i.e., lignin, cellulose, or hemicellulose). Many of these properties affected the composition of the processed organic fertilizer. Here, however, the duration, intensity, and environmental conditions during composting or fermentation were also decisive [58].
The classification into subclasses did not have an inherent positive effect on the prediction of net N mineralization. In addition, the prediction of net N mineralization for the six defined main classes showed acceptable results. However, the determined prediction error was relatively high, which could also be due to the varying quality of the evaluated incubation experiments. Nonetheless, it was clear that a classification of organic fertilizers by the type of raw material and processing was a useful tool to predict the N release with respect to generally available quality parameters. This was in line with other publications that highlighted the classification of organic fertilizers to be a useful tool to improve the prediction of net N mineralization [31,65]. This was not the case for the prediction of the mineralization rate constant. Here, the results of the work did not show any relationships that were dependent on the fertilizer class. A classification is recommended if no detailed information about the composition of the regarded fertilizers or their quality parameters are available. For a suitable classification, describing the original material (e.g., feedstock) or consistency can be sufficient, to get a first hint about the N release properties from organic fertilizers. This may allow more robust and generalized predictions of the N-release of organic fertilizers in the future. Thus, the use of organic fertilization can be optimized, resulting in a reduction in N losses. Implemented into a model, the data can be an important contribution to the decision-making process for the application of new organic fertilizers. Nevertheless, the results presented here should also be viewed with caution, as the model errors are too high to allow a precise prediction of organic fertilizer N release. Therefore, standardized incubation conditions regarding temperature and resolution of measurements during incubation should be defined separately for each fertilizer category. The standardization of the incubation conditions could significantly reduce the error of the prediction.
Due to their high release rate of inorganic N, the use of commercial organic fertilizers of animal origin meets the demand of plant species with high N requirements, such as most Brassica in vegetable production systems. Since their N to P ratio is relatively high, they qualify as a suitable fertilization option in intensive organic production systems. These systems are usually characterized by a high surplus of P resulting in a high P accumulation in the soil. It should be noted, however, that these fertilizers are by-products from mostly intensive animal production. Their carbon footprint and greenhouse gas potential [66] are usually associated with negative environmental impacts. Therefore, the environmental disadvantages of animal production systems should be taken into account when applying keratin-based fertilizers. In Europe, there are already strict regulations that limit the application of blood- and bone-based fertilizers [67]. The associated risks of using these fertilizers are mostly related to hygienic concerns. Commercial organic fertilizers of plant origin have also been proven to be highly effective fertilizers; however, an influence on plant protection and crop rotation must be taken into account. For example, the cultivation of legumes and/or Brassica in the same area is associated with cultivation breaks of three to four years. Techniques such as catch and carry or transfer mulch could complement successful fertilizing strategies here. These organic substances can be used specifically for organic fertilization, for example, from multi-crop green crops or catch crops. If a growth stage with the lowest possible C to Norg ratio is defined, the organic fertilization can be optimized. Due to a favorable carbon footprint and good availability of N, green manure fertilizers from plant residues should gain more importance in intensive production systems [68].
Since only small amounts of organic N are obtained for uptake from composted organic material (i.e., manure and compost) into the plant in the first year of application [69], these organic fertilizers are only suitable for soil improvement, and thus represent a fertilizer class with long-term effectiveness. The same applies to solid farmyard manures. Here, however, an increased risk of leaching during the crop-free period under continental climate conditions must be pointed out. Therefore, fertilizers with a long-term effect on the high nutrient requirements of vegetable crops must be regarded as critical in intensive vegetable growing. The use of liquid fertilizers in intensive vegetable growing is mostly limited to preplanting periods by legal restrictions, and therefore their application should be considered with regard to application timing and avoidance of gaseous N losses.
The developed models were incorporated into the calculation software “N-Expert” [70], which could be used to calculate the N demand in open field planting systems.

5. Conclusions

The C to Norg ratio in organic fertilizers, in combination with the conducted fertilizer classification, seems to be a good indicator for predicting the N availability from organic substances. It was clearly shown that, with some exceptions, the mineralization of Norg can be sufficiently predicted by the origin, treatment, and formulation of the respective group. In this context, organic commercial fertilizers of animal origin with a fast and high release rate, as well as plant-derived commercial fertilizers and fertilizers of plant production residues (e.g., vinasse), should be highlighted as efficient organic fertilizers. However, the influence of the soil properties on immobilization cannot be evaluated by the current data. Our literature research reveals that the N availability for the first year after application can be predicted to a satisfying degree. By means of categorization, it is possible to develop a model relevant for agricultural practice with reduced input requirements for gaining essential information on fertilizer quality. To reduce the prediction error, a standardized test design for incubation experiments is crucial.

Author Contributions

Conceptualization, A.S. and C.F.; methodology, A.S. and C.F.; software, A.S. and C.F.; validation A.S. and C.F.; investigation, A.S.; data curation, A.S. and C.F.; writing—original draft preparation, A.S.; writing—review and editing, A.S.; visualization, A.S.; supervision, C.F.; project administration, C.F.; funding acquisition, C.F. All authors have read and agreed to the published version of the manuscript.

Funding

Financial support from the German Federal Agency for Agriculture and Food (BLE) is gratefully acknowledged.

Conflicts of Interest

The authors declare no conflict of interest.

References

  1. Whalen, J.K.; Kernecker, M.L.; Thomas, B.W.; Sachdeva, V.; Ngosong, C. Soil food web controls on nitrogen mineralization are influenced by agricultural practices in humid temperate climates. CAB Rev. Perspect. Agric. Vet. Sci. Nutr. Nat. Resour. 2013, 8, 8. [Google Scholar] [CrossRef] [Green Version]
  2. Chen, B.; Liu, E.K.; Tian, Q.; Yan, C.; Zhang, Y. Soil nitrogen dynamics and crop residues. A review. Agron. Sustain. Dev. 2014, 34, 429–442. [Google Scholar] [CrossRef] [Green Version]
  3. Gutser, R.; Ebertseder, T.; Weber, A.; Schraml, M.; Schmidhalter, U. Short-term and residual availability of nitrogen after long-term application of organic fertilizers on arable land. J. Plant Nutr. Soil Sci. 2005, 168, 439–446. [Google Scholar] [CrossRef]
  4. Webb, J.; Sørensen, P.; Velthof, G.; Amon, B.; Pinto, M.; Rodhe, L.; Salomon, E.; Hutchings, N.; Burczyk, P.; Reid, J. An Assessment of the Variation of Manure Nitrogen Efficiency throughout Europe and an Appraisal of Means to Increase Manure-N Efficiency. Adv. Agron. 2013, 119, 371–442. [Google Scholar]
  5. Stadler, C.; Von Tucher, S.; Schmidhalter, U.; Gutser, R.; Heuwinkel, H. Nitrogen release from plant-derived and industrially processed organic fertilizers used in organic horticulture. J. Plant Nutr. Soil Sci. 2006, 169, 549–556. [Google Scholar] [CrossRef]
  6. Rigby, H.; Clarke, B.O.; Pritchard, D.L.; Meehan, B.; Beshah, F.; Smith, S.R.; Porter, N.A. A critical review of nitrogen mineralization in biosolids-amended soil, the associated fertilizer value for crop production and potential for emissions to the environment. Sci. Total Environ. 2016, 541, 1310–1338. [Google Scholar] [CrossRef]
  7. Lazicki, P.; Geisseler, D.; Lloyd, M. Nitrogen mineralization from organic amendments is variable but predictable. J. Environ. Qual. 2020, 49, 483–495. [Google Scholar] [CrossRef]
  8. Kumar, K.; Goh, K.M. Nitrogen release from crop residues and organic amendments as affected by biochemical composition. Commun. Soil Sci. Plant Anal. 2003, 34, 2441–2460. [Google Scholar] [CrossRef]
  9. Pansu, M.; Thuries, L. Kinetics of C and N mineralization, N immobilization and N volatilization of organic inputs in soil. Soil Biol. Biochem. 2003, 35, 37–48. [Google Scholar] [CrossRef]
  10. Pansu, M.; Thuries, L.; Larre-Larrouy, M.C.; Bottner, P. Predicting N transformations from organic inputs in soil in relation to incubation time and biochemical composition. Soil Biol. Biochem. 2003, 35, 353–363. [Google Scholar] [CrossRef]
  11. Mohanty, M.; Probert, M.E.; Reddy, K.S.; Dalal, R.C.; Rao, A.S.; Menzies, N.W. Modelling N mineralization from high C:N crop residues. Agrochimica 2011, 55, 178–192. [Google Scholar]
  12. Mohanty, M.; Reddy, K.S.; Probert, M.E.; Dalal, R.C.; Rao, A.S.; Menzies, N.W. Modelling N mineralization from green manure and farmyard manure from a laboratory incubation study. Ecol. Model. 2011, 222, 719–726. [Google Scholar] [CrossRef]
  13. Probert, M.E.; Delve, R.J.; Kimani, S.K.; Dimes, J.P. Modelling nitrogen mineralization from manures: Representing quality aspects by varying C: N ratio of sub-pools. Soil Biol. Biochem. 2005, 37, 279–287. [Google Scholar] [CrossRef] [Green Version]
  14. Romanenkov, V.; Belichenko, M.; Petrova, A.; Raskatova, T.; Jahn, G.; Krasilnikov, P. Soil organic carbon dynamics in long-term experiments with mineral and organic fertilizers in Russia. Geoderma Reg. 2019, 17, e00221. [Google Scholar] [CrossRef]
  15. Nicolardot, B.; Recous, S.; Mary, B. Simulation of C and N mineralisation during crop residue decomposition: A simple dynamic model based on the C: N ratio of the residues. Plant Soil 2001, 228, 83–103. [Google Scholar] [CrossRef]
  16. Corbeels, M.; Hofman, G.; Van Cleemput, O. Simulation of net N immobilisation and mineralisation in substrate-amended soils by the NCSOIL computer model. Biol. Fertil. Soils 1999, 28, 422–430. [Google Scholar] [CrossRef]
  17. Marschner, P.; Hatam, Z.; Cavagnaro, T.R. Soil respiration, microbial biomass and nutrient availability after the second amendment are influenced by legacy effects of prior residue addition. Soil Biol. Biochem. 2015, 88, 169–177. [Google Scholar] [CrossRef]
  18. Matteau, J.-P.; Gumiere, S.; Gallichand, J.; Létourneau, G.; Khiari, L.; Gasser, M.-O.; Michaud, A. Coupling of a nitrate production model with HYDRUS to predict nitrate leaching. Agric. Water Manag. 2019, 213, 616–626. [Google Scholar] [CrossRef]
  19. Zaman, M.; Cameron, K.; Di, H.; Inubushi, K. Changes in mineral N, microbial biomass and enzyme activities in different soil depths after surface applications of dairy shed effluent and chemical fertilizer. Nutr. Cycl. Agroecosyst. 2002, 63, 275–290. [Google Scholar] [CrossRef]
  20. Möller, K.; Schultheiß, U. Chemical characterization of commercial organic fertilizers. Arch. Agron. Soil Sci. 2015, 61, 989–1012. [Google Scholar] [CrossRef]
  21. Antil, R.S.; Janssen, B.H.; Lantinga, E.A. Laboratory and greenhouse assessment of plant availability of organic N in animal manure. Nutr. Cycl. Agroecosyst. 2009, 85, 95–106. [Google Scholar] [CrossRef] [Green Version]
  22. Chadwick, D.R.; John, F.; Pain, B.F.; Chambers, B.J.; Williams, J. Plant uptake of nitrogen from the organic nitrogen fraction of animal manures: A laboratory experiment. J. Agric. Sci. 2000, 134, 159–168. [Google Scholar] [CrossRef] [Green Version]
  23. Parnaudeau, V.; Nicolardot, B.; Robert, P.; Alavoine, G.; Pagès, J.; Duchiron, F. Organic matter characteristics of food processing industry wastewaters affecting their C and N mineralization in soil incubation. Bioresour. Technol. 2006, 97, 1284–1295. [Google Scholar] [CrossRef] [PubMed]
  24. Thangarajan, R.; Bolan, N.S.; Naidu, R.; Surapaneni, A. Effects of temperature and amendments on nitrogen mineralization in selected Australian soils. Env. Sci. Pollut. Res. Int. 2015, 22, 8843–8854. [Google Scholar] [CrossRef]
  25. Calderon, F.J.; McCarty, G.W.; Reeves, J.B. Analysis of manure and soil nitrogen mineralization during incubation. Biol. Fertil. Soils 2005, 41, 328–336. [Google Scholar] [CrossRef]
  26. Sistani, K.R.; Adeli, A.; McGowen, S.L.; Tewolde, H.; Brink, G.E. Laboratory and field evaluation of broiler litter nitrogen mineralization. Bioresour. Technol. 2008, 99, 2603–2611. [Google Scholar] [CrossRef]
  27. Jensen, L.S.; Salo, T.; Palmason, F.; Breland, T.A.; Henriksen, T.M.; Stenberg, B.; Pedersen, A.; Lundström, C.; Esala, M. Influence of biochemical quality on C and N mineralisation from a broad variety of plant materials in soil. Plant Soil 2005, 273, 307–326. [Google Scholar] [CrossRef]
  28. Kumar, K.; Goh, K.M. Crop residues and management practices: Effects on soil quality, soil nitrogen dynamics, crop yield, and nitrogen recovery. In Advances in Agronomy; Sparks, D.L., Ed.; Elsevier Inc.: Newark, NJ, USA, 2000; Volume 68, pp. 197–319. [Google Scholar]
  29. Chantigny, M.H.; Angers, D.A.; Rochette, P. Fate of carbon and nitrogen from animal manure and crop residues in wet and cold soils. Soil Biol. Biochem. 2002, 34, 509–517. [Google Scholar] [CrossRef]
  30. Nahm, K.H. Factors influencing nitrogen mineralization during poultry litter composting and calculations for available nitrogen. Worlds Poult. Sci. J. 2005, 61, 238–255. [Google Scholar] [CrossRef]
  31. Morvan, T.; Nicolardot, B.; Pean, L. Biochemical composition and kinetics of C and N mineralization of animal wastes: A typological approach. Biol. Fertil. Soils 2006, 42, 513–522. [Google Scholar] [CrossRef]
  32. Hseu, Z.-Y.; Huang, C.-C. Nitrogen mineralization potentials in three tropical soils treated with biosolids. Chemosphere 2005, 59, 447–454. [Google Scholar] [CrossRef] [PubMed]
  33. Thornley, J.H. Grassland Dynamics: An Ecosystem Simulation Model; CAB international: Wallingford, UK, 1998. [Google Scholar]
  34. De Neve, S. Organic matter mineralization as a source of nitrogen. In Advances in Research on Fertilization Management of Vegetable Crops; Springer: Turin, Italy, 2017; pp. 65–83. [Google Scholar]
  35. Hadas, A.; Kautsky, L. Feather Meal, a Semi-Slow-Release Nitrogen-Fertilizer for Organic Farming. Fertil. Res. 1994, 38, 165–170. [Google Scholar] [CrossRef]
  36. Chaves, B.; De Neve, S.; Boeckx, P.; Berko, C.; Van Cleemput, O.; Hofman, G. Manipulating the N release from N-15 labelled celery residues by using straw and vinasses. Soil Biol. Biochem. 2006, 38, 2244–2254. [Google Scholar] [CrossRef]
  37. da Silva, A.; Rossetto, R.; Bombecini, J.; Piemonte, M.; Muraoka, T. Nitrogen Mineralization from Sugarcane Vinasse. J. Plant Nutr. 2014, 37, 1227–1236. [Google Scholar] [CrossRef]
  38. Kornillowicz-Kowalska, T.; Bohacz, J. Biodegradation of keratin waste: Theory and practical aspects. Waste Manag. 2011, 31, 1689–1701. [Google Scholar] [CrossRef] [PubMed]
  39. Sabahi, H.; Schulz, R.; Müller, T.; Li, Z. Nitrogen turnover of legume seed meals as affected by seed meal texture and quality at different temperatures. Arch. Agron. Soil Sci. 2009, 55, 671–682. [Google Scholar] [CrossRef]
  40. Stadler, C. Nitrogen Release and Nitrogen Use Efficiency of Plant Derived Nitrogen Fertilisers in Organic Horticultural Soils under Glasshouse Conditions. Ph.D. Thesis, Chair of Plant Nutrition, Technical University of Munich (TUM), Munich, Germany, 2006. [Google Scholar]
  41. Li, Z.; Schulz, R.; Müller, T. Mineralization of legume seed meals as organic fertilizers affected by their quality at low temperatures. Biol. Agric. Hortic. 2014, 31, 91–107. [Google Scholar] [CrossRef]
  42. Parnaudeau, V.; Condom, N.; Oliver, R.; Cazevieille, P.; Recous, S. Vinasse organic matter quality and mineralization potential, as influenced by raw material, fermentation and concentration processes. Bioresour. Technol. 2008, 99, 1553–1562. [Google Scholar] [CrossRef]
  43. Nakhone, L.N.; Tabatabai, M.A. Nitrogen mineralization of leguminous crops in soils. J. Plant Nutr. Soil Sci.-Z. Fur Pflanzenernahr. Und Bodenkd. 2008, 171, 231–241. [Google Scholar] [CrossRef]
  44. Chaves, B.; De Neve, S.; Hofman, G.; Boeckx, P.; Van Cleemput, O. Nitrogen mineralization of vegetable root residues and green manures as related to their (bio)chemical composition. Eur. J. Agron. 2004, 21, 161–170. [Google Scholar] [CrossRef]
  45. Trinsoutrot, I.; Recous, S.; Bentz, B.; Lineres, M.; Cheneby, D.; Nicolardot, B. Biochemical quality of crop residues and carbon and nitrogen mineralization kinetics under nonlimiting nitrogen conditions. Soil Sci. Soc. Am. J. 2000, 64, 918–926. [Google Scholar] [CrossRef]
  46. Gordillo, R.M.; Cabrera, M.L. Mineralizable nitrogen in broiler litter: I. Effect of selected litter chemical characteristics. J. Environ. Qual. 1997, 26, 1672–1679. [Google Scholar] [CrossRef]
  47. Gordillo, R.M.; Cabrera, M.L. Mineralizable nitrogen in broiler litter: II. Effect of selected soil characteristics. J. Environ. Qual. 1997, 26, 1679–1686. [Google Scholar] [CrossRef]
  48. Ruiz Diaz, D.A.; Sawyer, J.E. Mallarino, A.P. Poultry Manure Supply of Potentially Available Nitrogen with Soil Incubation. Agron. J. 2008, 100, 1310. [Google Scholar] [CrossRef]
  49. Kirchmann, H. Carbon and Nitrogen Mineralization of Fresh, Aerobic and Anaerobic Animal Manures during Incubation with Soil. Swed. J. Agric. Res. 1991, 21, 165–173. [Google Scholar]
  50. Ajwa, H.A.; Tabatabai, M.A. Decomposition of Different Organic Materials in Soils. Biol. Fertil. Soils 1994, 18, 175–182. [Google Scholar] [CrossRef]
  51. Abbasi, M.K.; Hina, M.; Khalique, A.; Khan, S.R. Mineralization of three organic manures used as nitrogen source in a soil incubated under laboratory conditions. Commun. Soil Sci. Plant Anal. 2007, 38, 1691–1711. [Google Scholar] [CrossRef]
  52. Sanger, A.; Geisseler, D.; Ludwig, B. C and N dynamics of a range of biogas slurries as a function of application rate and soil texture: A laboratory experiment. Arch. Agron. Soil Sci. 2014, 60, 1779–1794. [Google Scholar] [CrossRef]
  53. Sorensen, P.; Amato, M. Remineralisation and residual effects of N after application of pig slurry to soil. Eur. J. Agron. 2002, 16, 81–95. [Google Scholar] [CrossRef]
  54. Sänger, A. Application of Biogas Slurries from Energy Crops to Arable Soils and Their Impact on Carbon and Nitrogen Dynamics. Ph.D. Thesis, Faculty of Organic Agricultural Sciences, University of Kassel, Kassel, Germany, 2012. [Google Scholar]
  55. Bernal, M.P.; Kirchmann, H. Carbon and Nitrogen Mineralization and Ammonia Volatilization from Fresh, Aerobically and Anaerobically Treated Pig Manure during Incubation with Soil. Biol. Fertil. Soils 1992, 13, 135–141. [Google Scholar]
  56. Sorensen, P.; Fernandez, J.A. Dietary effects on the composition of pig slurry and on the plant utilization of pig slurry nitrogen. J. Agric. Sci. 2003, 140, 343–355. [Google Scholar] [CrossRef]
  57. Morvan, T.; Leterme, P.; Arsene, G.; Mary, B. Nitrogen transformations after the spreading of pig slurry on bare soil and ryegrass using 15 N-labelled ammonium. Dev. Crop Sci. 1997, 25, 237–244. [Google Scholar]
  58. Bernal, M.P.; Alburquerque, J.A.; Moral, R. Composting of animal manures and chemical criteria for compost maturity assessment. A review. Bioresour. Technol. 2009, 100, 5444–5453. [Google Scholar] [CrossRef] [PubMed]
  59. Agehara, S.; Warncke, D.D. Soil moisture and temperature effects on nitrogen release from organic nitrogen sources. Soil Sci. Soc. Am. J. 2005, 69, 1844–1855. [Google Scholar] [CrossRef] [Green Version]
  60. Verma, B.C.; Datta, S.P.; Rattan, R.K.; Singh, A.K. Impact of temperature and moisture regimes on carbon and nitrogen mineralization in an alluvial soil amended with organics. Agrochimica 2013, 57, 31–48. [Google Scholar]
  61. Katroschan, K.-U.; Uptmoor, R.; Stützel, H. Nitrogen use efficiency of organically fertilized white cabbage and residual effects on subsequent beetroot. Plant Soil 2014, 382, 237–251. [Google Scholar] [CrossRef]
  62. Cordovil, C.d.S.; Coutinho, J.; Goss, M.; Cabral, F. Potentially mineralizable nitrogen from organic materials applied to a sandy soil: Fitting the one-pool exponential model. Soil Use Manag. 2005, 21, 65–72. [Google Scholar] [CrossRef]
  63. Chaves, B.; De Neve, S.; Boeckx, P.; Van Cleemput, O.; Hofman, G. Screening organic biological wastes for their potential to manipulate the N release from N-rich vegetable crop residues in soil. Agric. Ecosyst. Environ. 2005, 111, 81–92. [Google Scholar] [CrossRef]
  64. Gil, M.V.; Carballo, M.T.; Calvo, L.F. Modelling N mineralization from bovine manure and sewage sludge composts. Bioresour. Technol. 2011, 102, 863–871. [Google Scholar] [CrossRef]
  65. Noirot-Cosson, P.E.; Dhaouadi, K.; Etievant, V.; Vaudour, E.; Houot, S. Parameterisation of the NCSOIL model to simulate C and N short-term mineralisation of exogenous organic matter in different soils. Soil Biol. Biochem. 2017, 104, 128–140. [Google Scholar] [CrossRef]
  66. Capper, J. Should we reject animal source foods to save the planet? A review of the sustainability of global livestock production. S. Afr. J. Anim. Sci. 2013, 43, 233–246. [Google Scholar] [CrossRef] [Green Version]
  67. Taube, F.; Balmann, A.; Bauhus, J.; Birner, R.; Bokelmann, W.; Christen, O.; Gauly, M.; Grethe, H.; Holm-Müller, K.; Horst, W. Amendment of the fertiliser application ordinance: Limiting nutrient surpluses effectively. Ber. Über Landwirtsch.-Z. Für Agrarpolit. Und Landwirtsch. 2013, 91, 1–12. [Google Scholar]
  68. Maitra, S.; Zaman, A.; Mandal, T.K.; Palai, J.B. Green manures in agriculture: A review. J. Pharmacogn. Phytochem. 2018, 7, 1319–1327. [Google Scholar]
  69. Nendel, C.; Reuter, S.; Kubiak, R.; Nieder, R. Nitrogen mineralization from mature bio-waste compost in vineyard soils-I. Long-term laboratory incubation experiments. J. Plant Nutr. Soil Sci.-Z. Fur Pflanzenernahr. Und Bodenkd. 2004, 167, 397–407. [Google Scholar] [CrossRef]
  70. Fink, M.; Scharpf, H. Workshop on Ecological Aspects of Vegetable Fertilization in Integrated Crop Production in the Field. In N-Expert-A Decision Support System for Vegetable Fertilization in the Field; Wageningen Academic Publishers: Weinstrasse, Germany, 1992; Volume 339, pp. 67–74. [Google Scholar]
Figure 1. Boxplot of organic N content in the fertilizer main groups (capital letters) and subgroups. The circles are the means and the stripes are the medians of the observations.
Agronomy 10 01448 g001
Figure 2. Boxplot of organic C in the fertilizer main groups (capital letters) and subgroups. The circles are means and the stripes are the medians of the observations.
Agronomy 10 01448 g002
Figure 3. Boxplot of organic C to organic N ratio in the fertilizer main groups (capital letters) and subgroups. The circles are means and the stripes are the medians of the observations.
Agronomy 10 01448 g003
Figure 4. Boxplot of potential inorganic N release (N0) of the fertilizer main groups (capital letters) and subgroups. The circles are the means and the stripes are the medians of the observations.
Agronomy 10 01448 g004
Figure 5. Boxplot of the mineralization rate constant k [°Cd]−1 of the fertilizer main groups (capital letters) and subgroups. The circles are the means and the stripes are the medians of the observations.
Agronomy 10 01448 g005
Figure 6. Dependency of potential inorganic N release within 150 days after organic fertilizer application on the fertilizer C to organic N ratio in different fertilizer classes.
Agronomy 10 01448 g006
Figure 7. Dependency of potential inorganic N release within 150 days after organic fertilizer application on the fertilizer C to organic N ratio in different fertilizer classes.
Agronomy 10 01448 g007
Table 1. Overview of the main groups (bold text) and corresponding subgroups. The numbers in parentheses represent the number of observations.
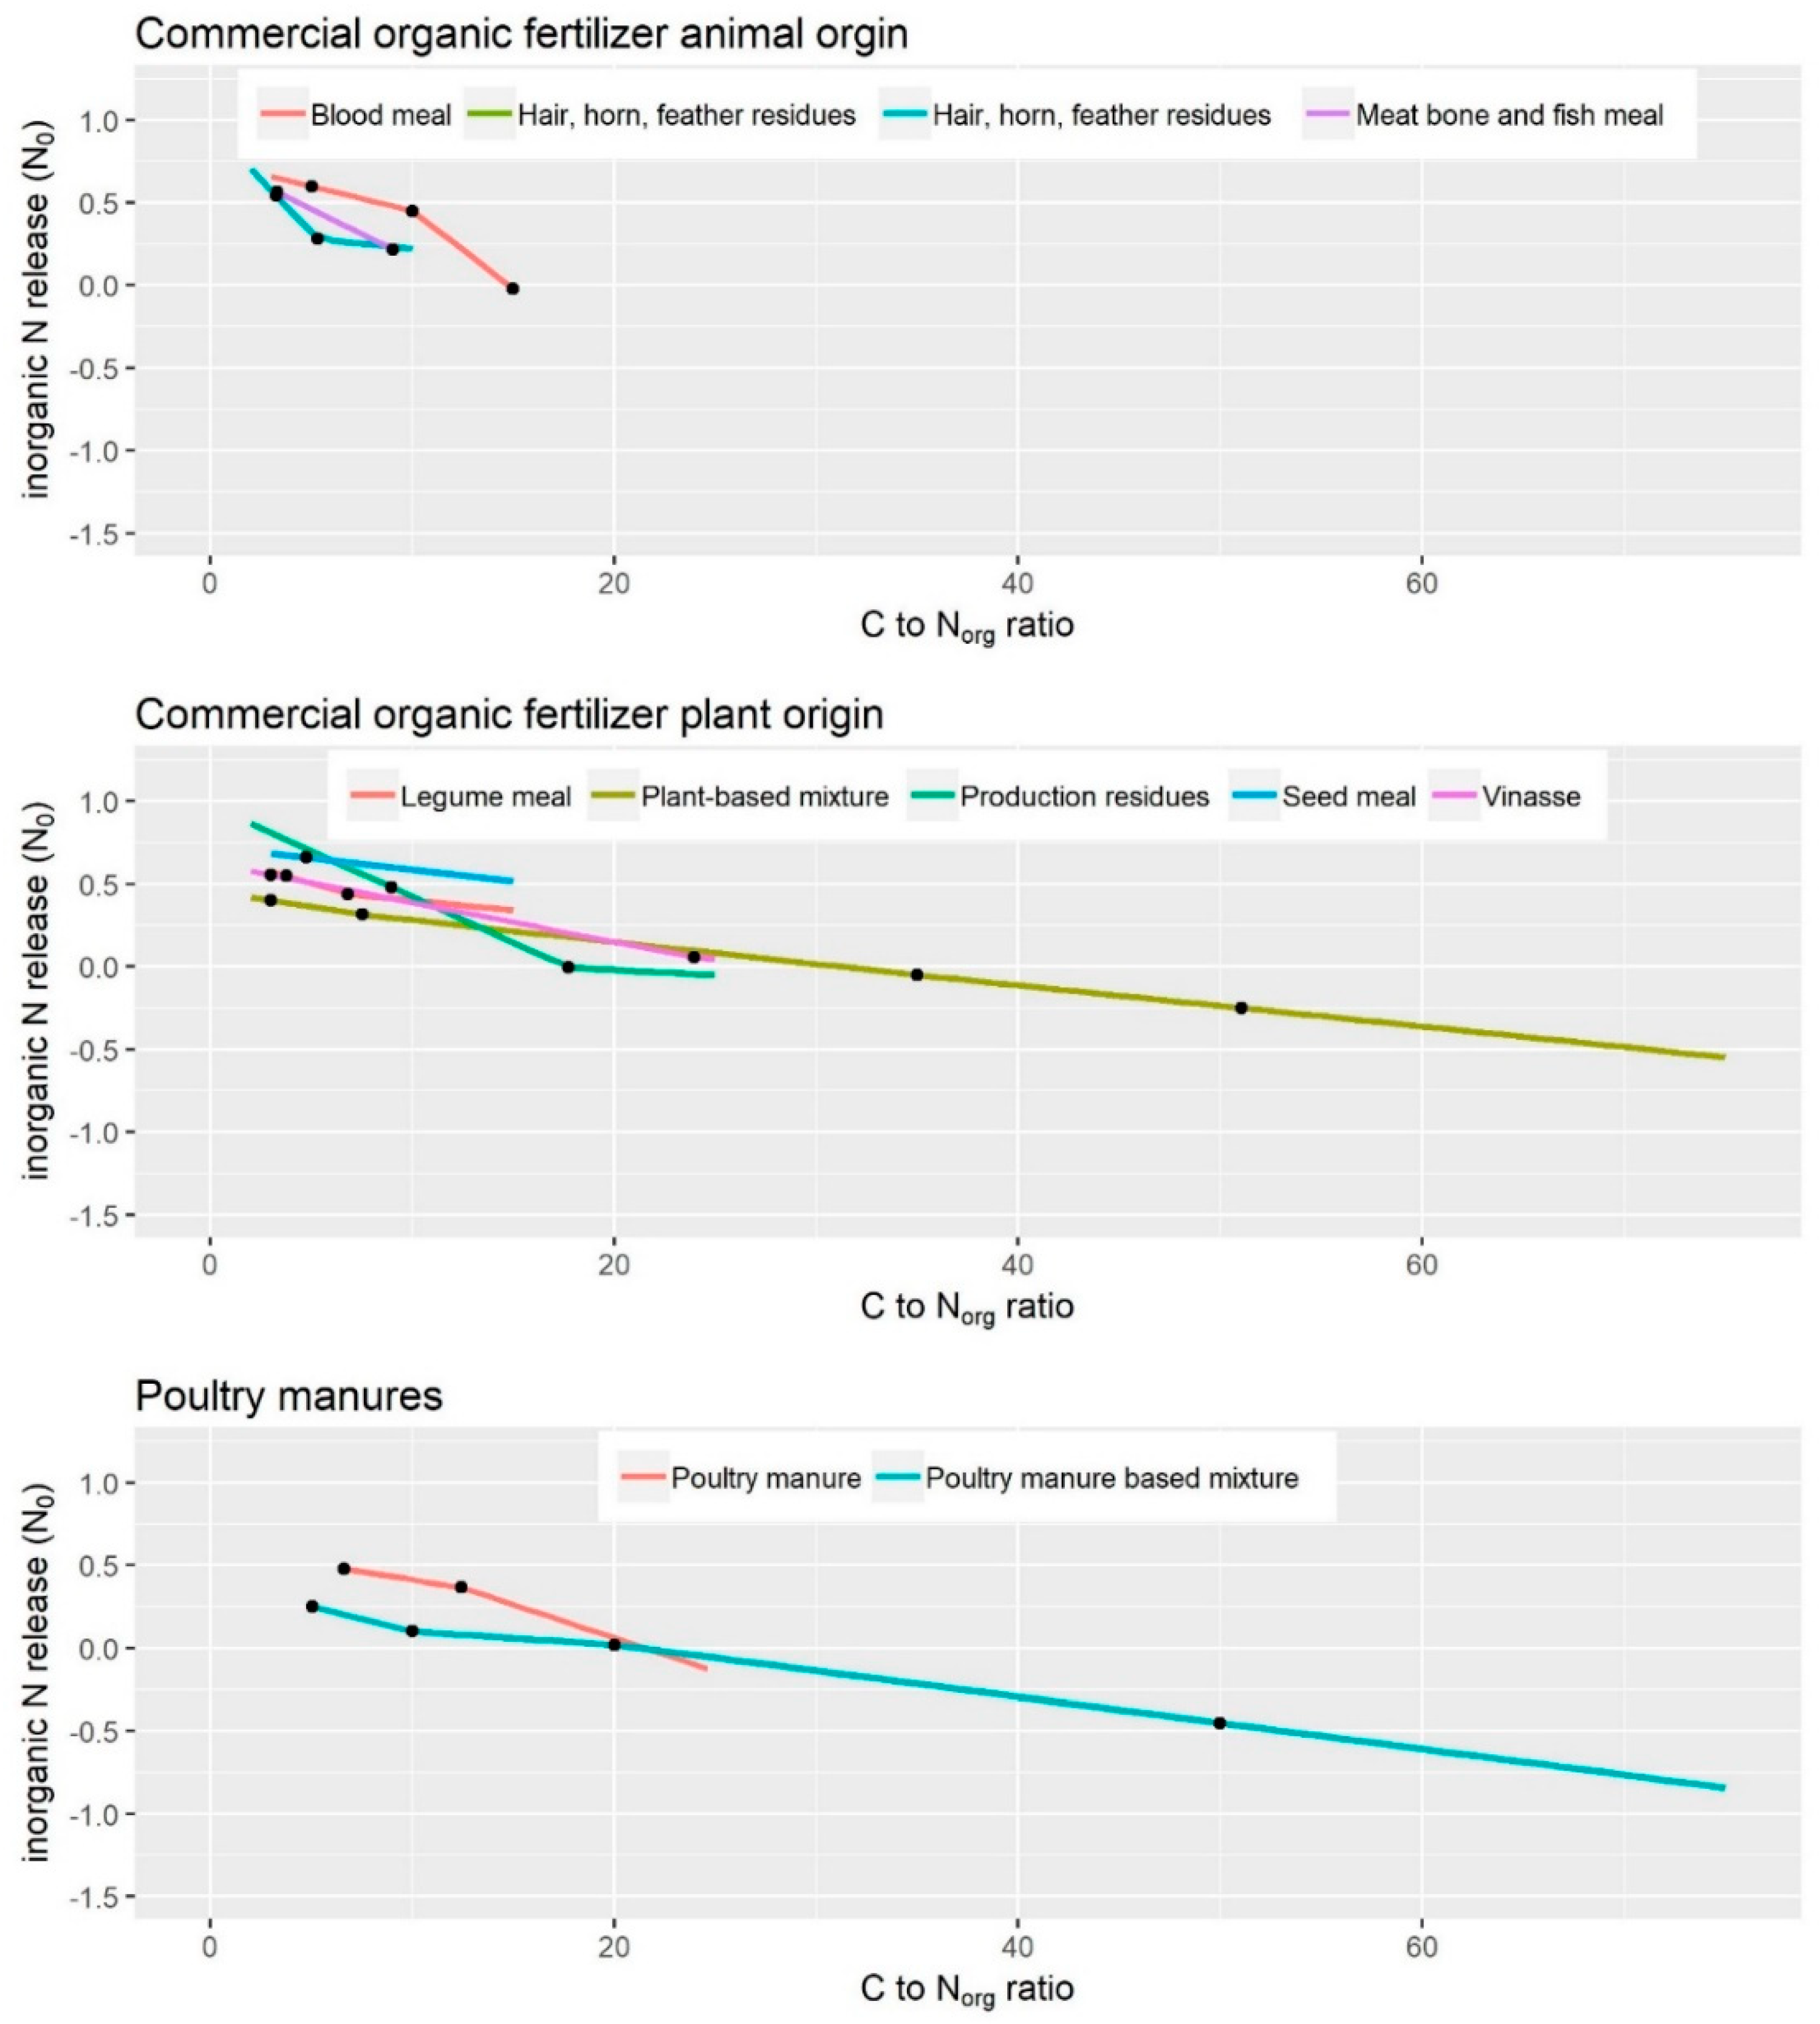
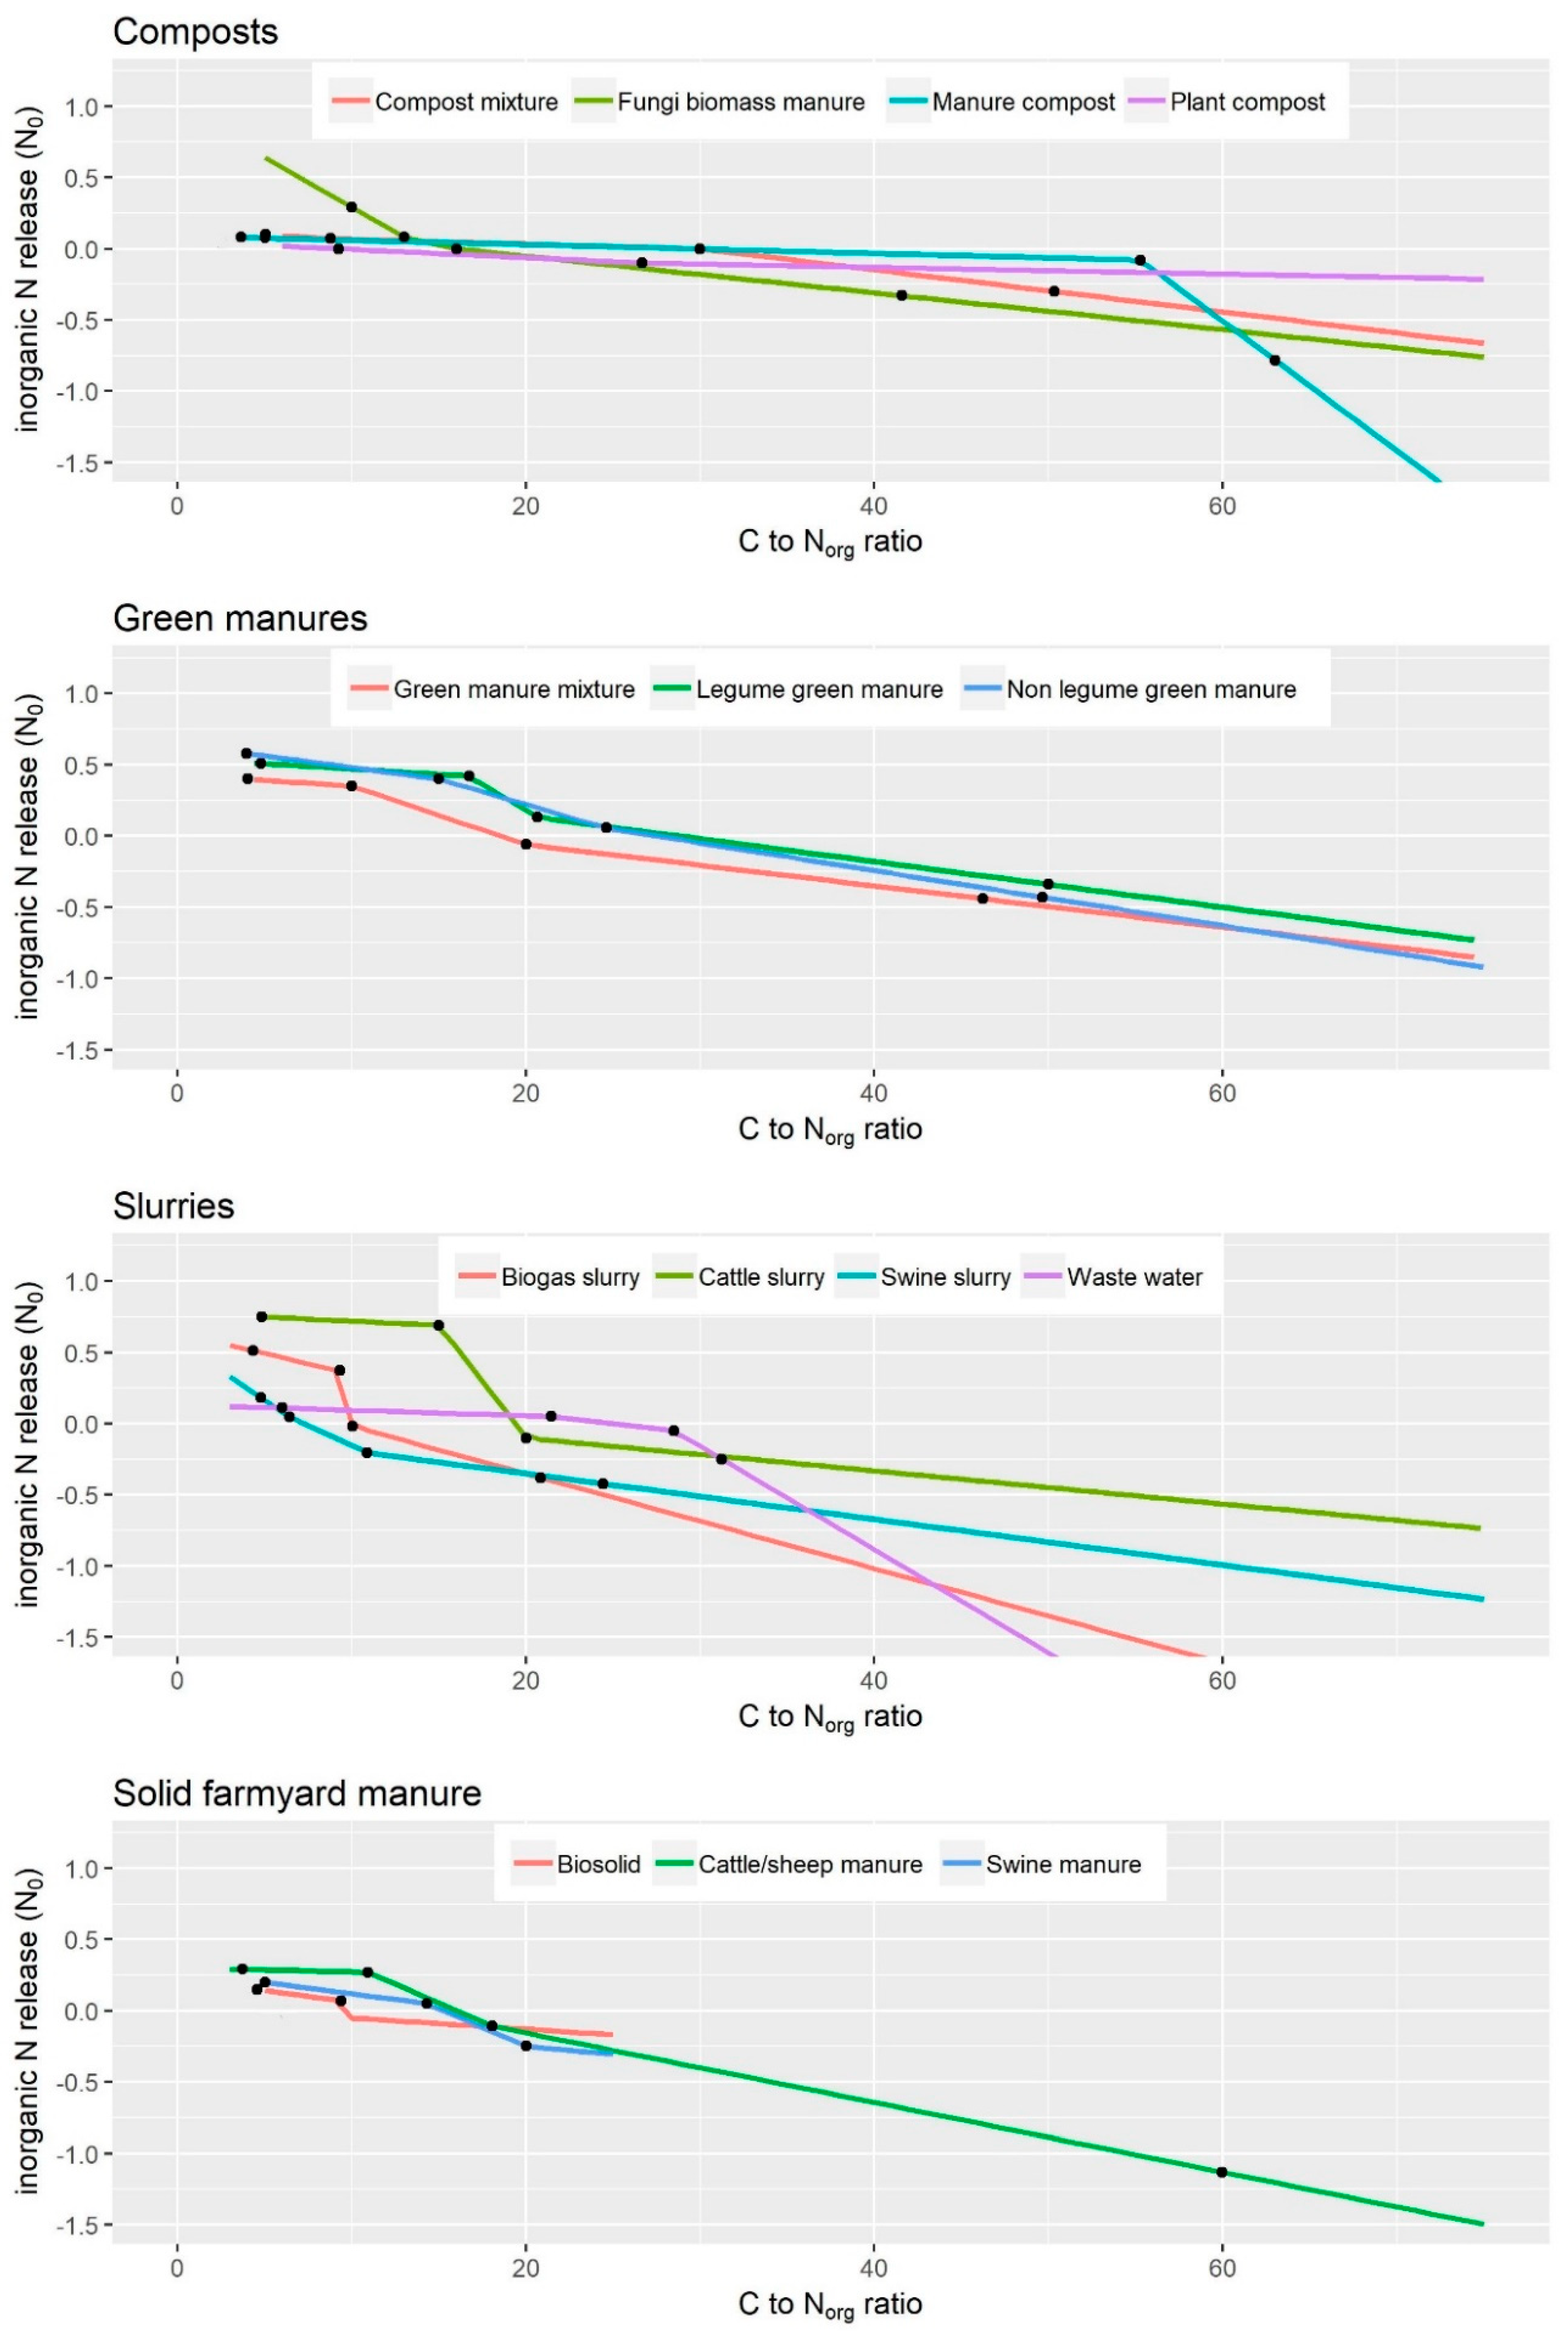
Commercial Organic Fertilizers of Plant Origin (170)Solid Farmyard Manures (67)
Plant-based mixture (26)Swine manure (14)
Legume meal (77)Biosolid (20)
Production residues (22)Cattle/sheep manure (33)
Seed meal (19)
Vinasse (26)Poultry manures (114)
Poultry manure (98)
Poultry manure-based mixture (16)
Commercial organic fertilizers of animal origin (83)Slurries (100)
Hair, horn, and feather residues (47)Biogas slurry (32)
Meat bone and fish meal (21)Wastewater (21)
Blood meal (15)Swine slurry (9)
Cattle slurry (38)
Green manures (204)Composts (83)
Non-legume green manure (126)Plant compost (20)
Legume green manure (66)Manure compost (52)
Green manure mixture (12)Compost mixture (6)
Fungi biomass manure (5)
Table 2. Forward stepwise linear regression analysis of N0 for the parameters C to N ratio, N content of the fertilizer, incubation temperature, and soil class.
BetaSEstd. Betatp
(Intercept)0.3830.247 1.55NS
N content0.2110.0890.1642.363<0.05
C to N ratio−0.6250.094−0.451−6.648<0.05
Inkubation temperature0.0040.0020.0591.883NS
Soil class (LUFA)0.0160.0110.0441.432NS
Table 3. Forward stepwise linear regression analysis of N0 for the parameters C to Norg ratio, N content of the fertilizer, incubation temperature, and soil class.
BetaSEstd. Betatp
(Intercept)1.2980.047 27.459<0.05
C to Norg ratio−1.0490.042−0.66−25.125<0.05
Table 4. Forward stepwise linear regression analysis of k for the parameters C to N ratio, C to Norg ratio, N content of the fertilizer, moisture (in % maximum water holding capacity), incubation temperature, and soil class.
BetaSEstd. Betatp
(Intercept)0.0040.062 0.059NS
Incubation temperature0.0120.0020.1944.91<0.05
Soil class (LUFA)−0.0160.012−0.054−1.374NS
Table 5. Model statistics of the prediction quality of the observed data. Root mean squared error (RMSE), absolute error of mean (AEM), and bias in g g −1 Norg.
NamenRMSEAEMBias
Biogas slurry320.1310.0850.017
Non-legume green manure1260.430.3060.185
Hair, horn, and feather residues470.1860.1380.035
Legume meal770.0940.0680.009
Manure-based mixture160.110.0810.012
Meat bone and fish meal210.0970.0720.009
Manure compost520.0970.0760.009
Plant-based mixture260.2510.1850.063
Blood meal150.0870.0680.008
Plant compost200.1040.0660.011
Poultry manure980.1870.1350.035
Production residues220.160.1250.026
Seed meal190.1630.1440.027
Swine manure140.2340.1490.055
Swine slurry90.1920.1420.037
Vinasse260.1920.1530.037
Wastewater210.3930.3230.155
Biosolid200.0810.0650.007
Cattle slurry380.2260.1380.051
Cattle/sheep manure330.3310.240.11
Compost mixture60.1520.1490.023
Fungi biomass manure50.0340.0270.001
Legume green manure660.1830.1460.033
Green manure mixture120.1440.1130.021

