Article

The Complete Chloroplast Genome Sequence of the Speirantha gardenii: Comparative and Adaptive Evolutionary Analysis

Department of Life Sciences, Yeungnam University, Gyeongsan 38541, Gyeongsan-buk, Korea
*
Authors to whom correspondence should be addressed.
Agronomy 2020, 10(9), 1405; https://doi.org/10.3390/agronomy10091405
Submission received: 10 August 2020 / Revised: 3 September 2020 / Accepted: 14 September 2020 / Published: 16 September 2020
(This article belongs to the Section Horticultural and Floricultural Crops)

Abstract

:
The plant “False Lily of the Valley”, Speirantha gardenii is restricted to south-east China and considered as an endemic plant. Due to its limited availability, this plant was less studied. Hence, this study is focused on its molecular studies, where we have sequenced the complete chloroplast genome of S. gardenii and this is the first report on the chloroplast genome sequence of Speirantha. The complete S. gardenii chloroplast genome is of 156,869 bp in length with 37.6% GC, which included a pair of inverted repeats (IRs) each of 26,437 bp that separated a large single-copy (LSC) region of 85,368 bp and a small single-copy (SSC) region of 18,627 bp. The chloroplast genome comprises 81 protein-coding genes, 30 tRNA and four rRNA unique genes. Furthermore, a total of 699 repeats and 805 simple-sequence repeats (SSRs) markers are identified in the genome. Additionally, KA/KS nucleotide substitution analysis showed that seven protein-coding genes have highly diverged and identified nine amino acid sites under potentially positive selection in these genes. Phylogenetic analyses suggest that S. gardenii species has a closer genetic relationship to the Reineckea, Rohdea and Convallaria genera. The present study will provide insights into developing a lineage-specific marker for genetic diversity and gene evolution studies in the Nolinoideae taxa.

1. Introduction

The plant chloroplast plays a pivotal role in photosynthesis and other biological metabolic processes that mediate the adaptation of the plant to the surrounding environment [1]. The highly conserved angiosperm plants encode a circular chloroplast genome with a quadripartite structure, consists of a large single-copy (LSC) region, and small single-copy (SSC) region which is separated by a duplicate inverted repeat (IRa and IRb) regions and differences in genome size and composition are taxonomically informative [1,2,3,4,5]. Although the amount of variation is not very significant across flowering plants, the chloroplast genome size varies between species that ranges from 107 kb (Cathaya argyrophylla) to 280 kb (Pelargonium) [6,7]. Normally the chloroplast genome encodes 120 to 130 genes, involved in photosynthesis, transcription and translation process [6]. Though the angiosperm chloroplast genomes are highly conserved, several mutational events, such as structural rearrangement, insertions and deletions (InDels), inversions, translocations, and copy number variations (CNVs) occur within the chloroplast genomes. This polymorphism in the chloroplast genome provides an understanding of population genetics, phylogenetic and evolutionary studies, species barcoding and endangered species conservation and enhancement of breeding of the plants.
Flowering plants are the largest clade among the land plants, consisting of more than 250,000 species [8]. Among these, Nolinoideae is a subfamily, with more than 100 species, of the Asparagaceae family belonging to the monocot flowering plants. In the past decade, a few species of Nolinoideae have been characterized at the molecular level and phylogenetic implications with other species were identified [9,10,11,12,13,14,15]. The genus Speirantha belongs to the subfamily Nolinoideae and consists of only one species, S. gardenii and its common name is “False Lily of the Valley”. The distribution of this species is restricted to south-east China and is considered an endemic plant [16]. It is a delightful and intriguing small-scale evergreen perennial plant with panicles of delicate starry white flowers during early spring and the foliage is glossy, pale green and elliptic or elliptic-oblanceolate in shape. Due to its rare availability, extensive molecular studies have not been carried out for this species. So, in the present study, we report the first complete chloroplast genome sequence of S. gardenii and analyzed repeat regions and simple-sequence repeats (SSRs) markers in the genome. Furthermore, we compared the S. gardenii chloroplast genome with its closely related species. Additionally, highly variable regions and seven protein-coding genes that are discovered in their genome to be under positive selection, could be employed to create potential markers for phylogenetic studies or candidates for DNA barcoding in future studies.

2. Results

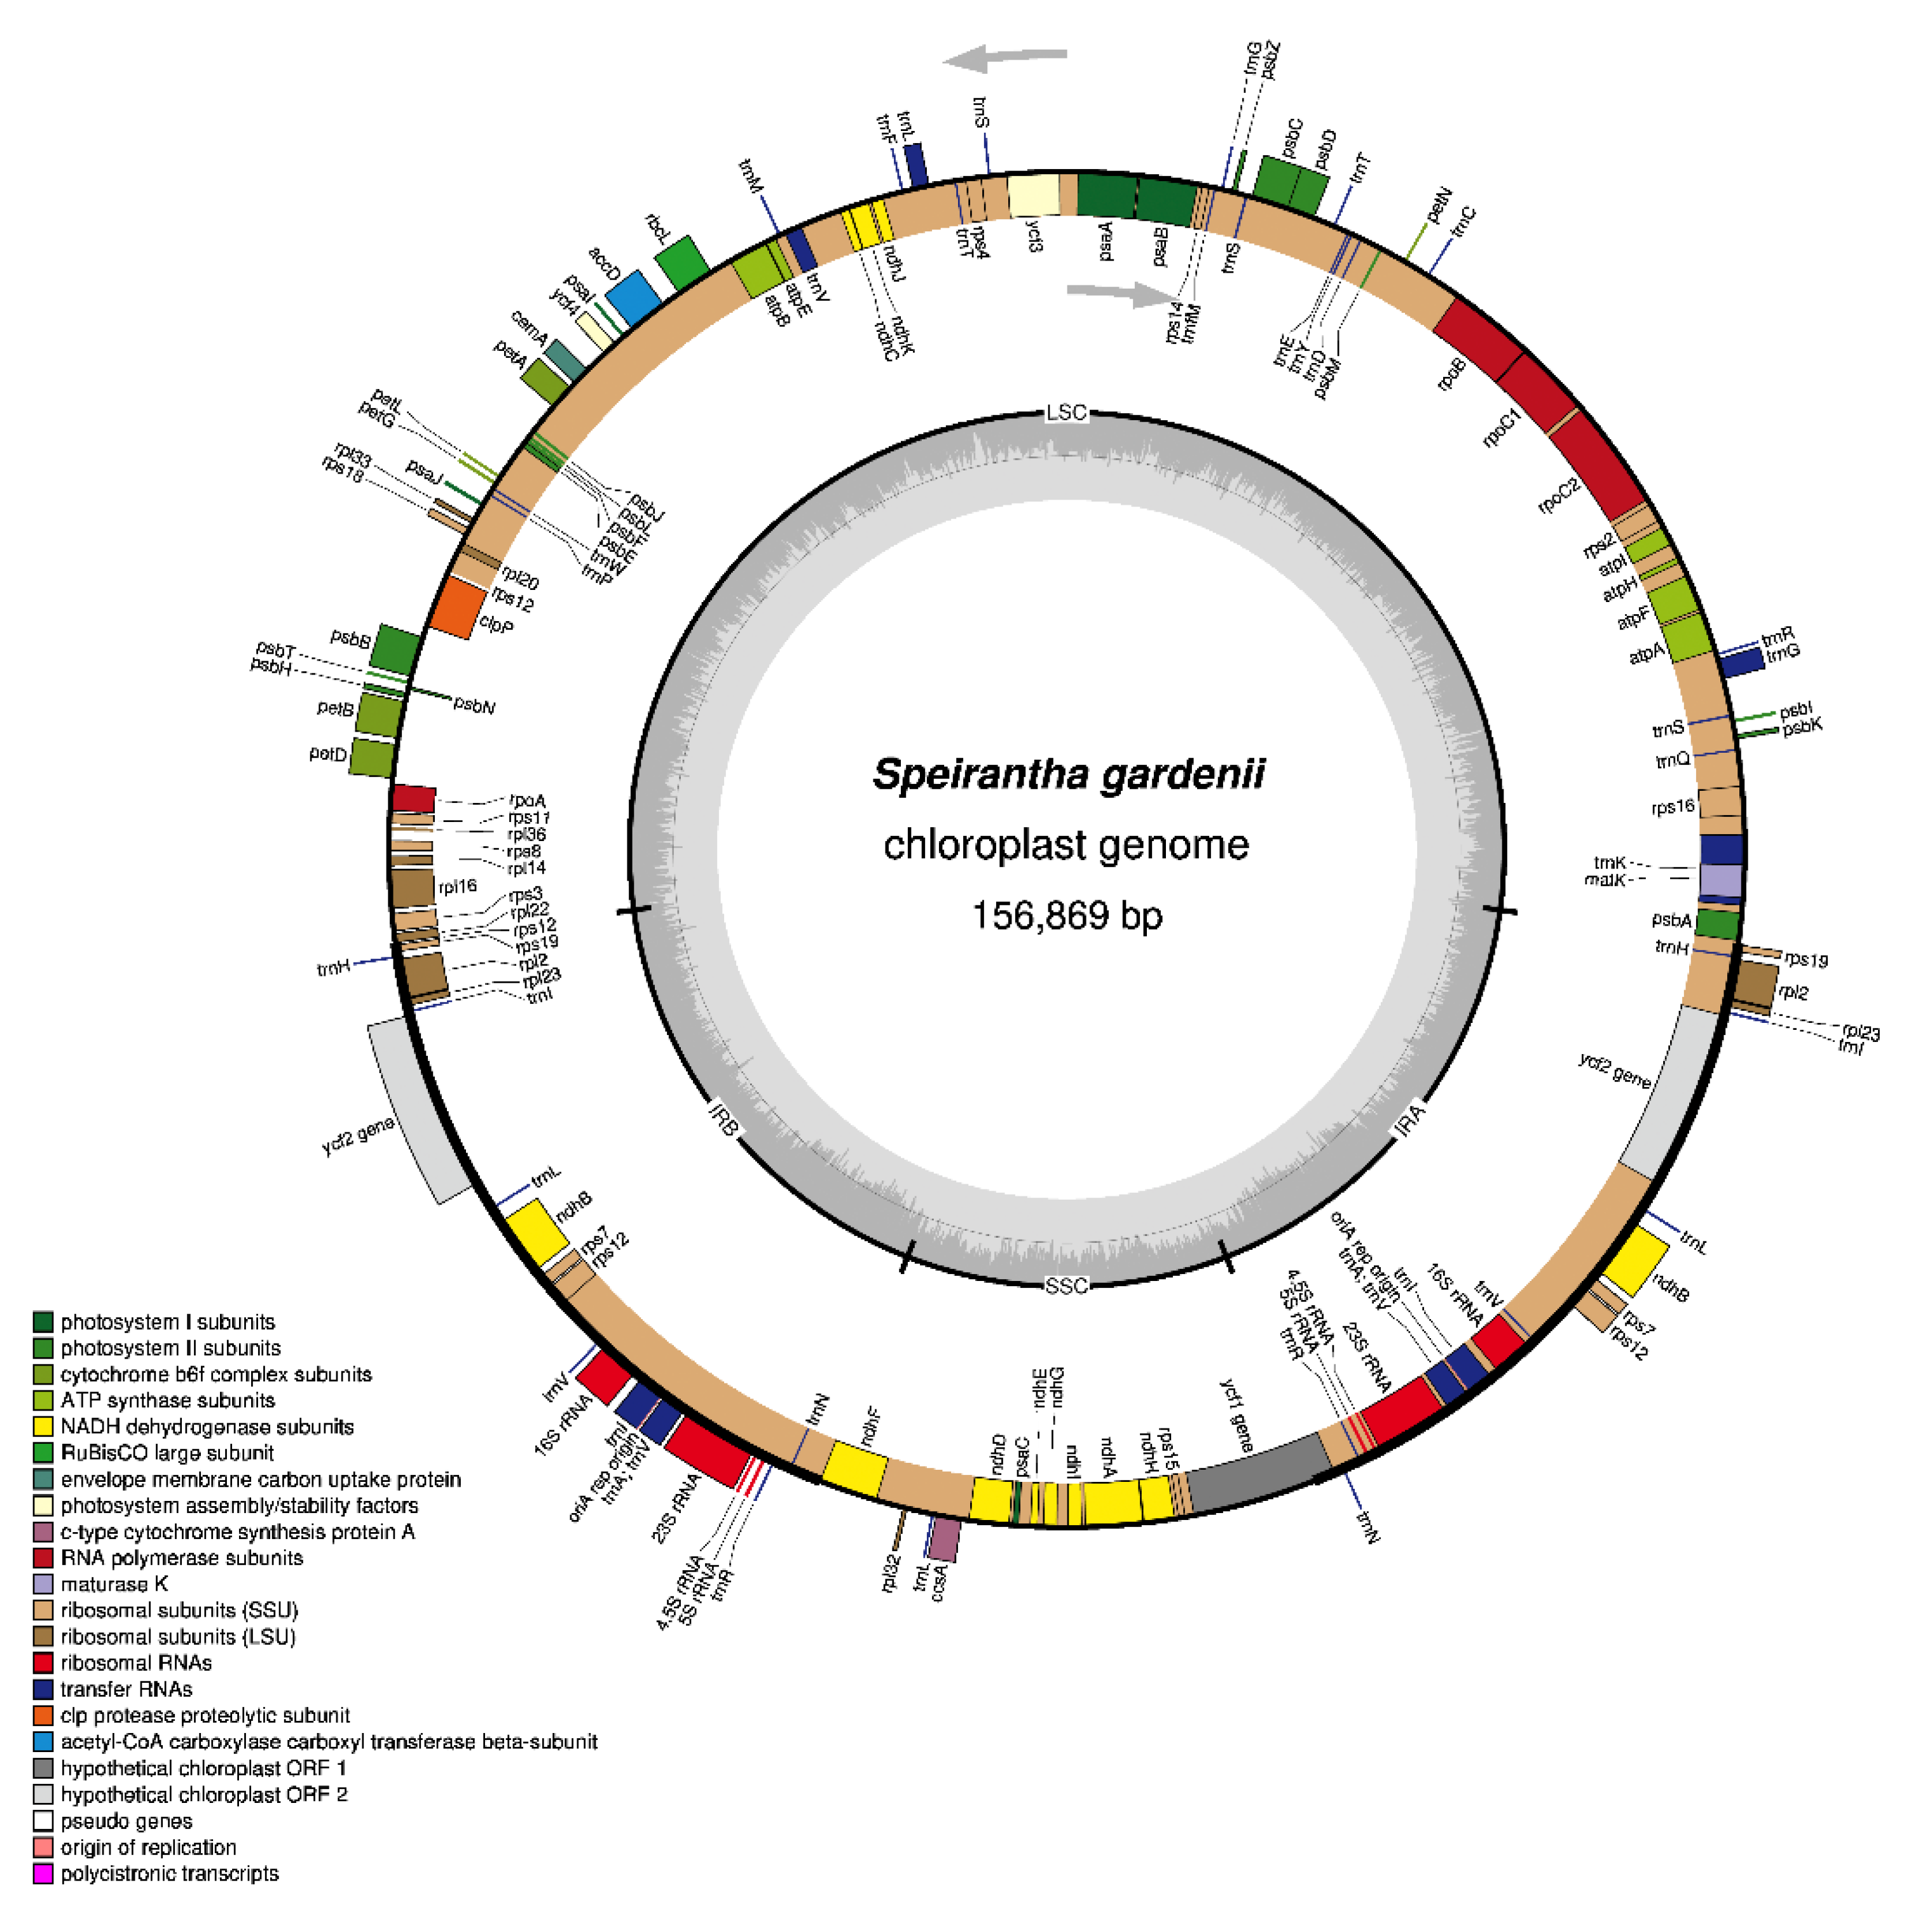
2.1. General Features of the Speirantha Gardenii Chloroplast Genome

The overall length of the S. gardenii chloroplast genome is 156,869 bp, exhibiting the circular quadripartite structure characteristic of major angiosperm plants. The chloroplast genome consists of a pair of the inverted repeat (IR) regions (26,437 bp) separated by a large single-copy (LSC) region of 85,368 bp and a small single-copy (SSC) region of 18,627 bp (Figure 1). When calculating duplicated genes in the IR region only one time, the chloroplast genome contains 115 genes, including 81 protein-coding genes, 30 tRNA genes and four rRNA genes (Table 1). All four rRNAs, nine protein-coding genes and eight tRNA genes are duplicated in the IR regions, making the total number of 136 genes. Seventeen genes contain introns, including five tRNA and ten protein-coding genes with a single intron and clpP and ycf3 with two introns (Supplementary Materials Table S1). Overall, the order and contents of the gene of the S. gardenii are identical with other species of Nolinoideae except the length of the infA gene and pseudogene infA in the C. keiskei, Liriope spicata and Nolina atopocarpa (Supplementary Materials Table S2). The GC content of the S. gardenii chloroplast genome is 37.6% (Table 1), like R. carnea, whereas GC content is low in the species of R. chinensis (37.2%) and high in the C. keiskei (37.9%).

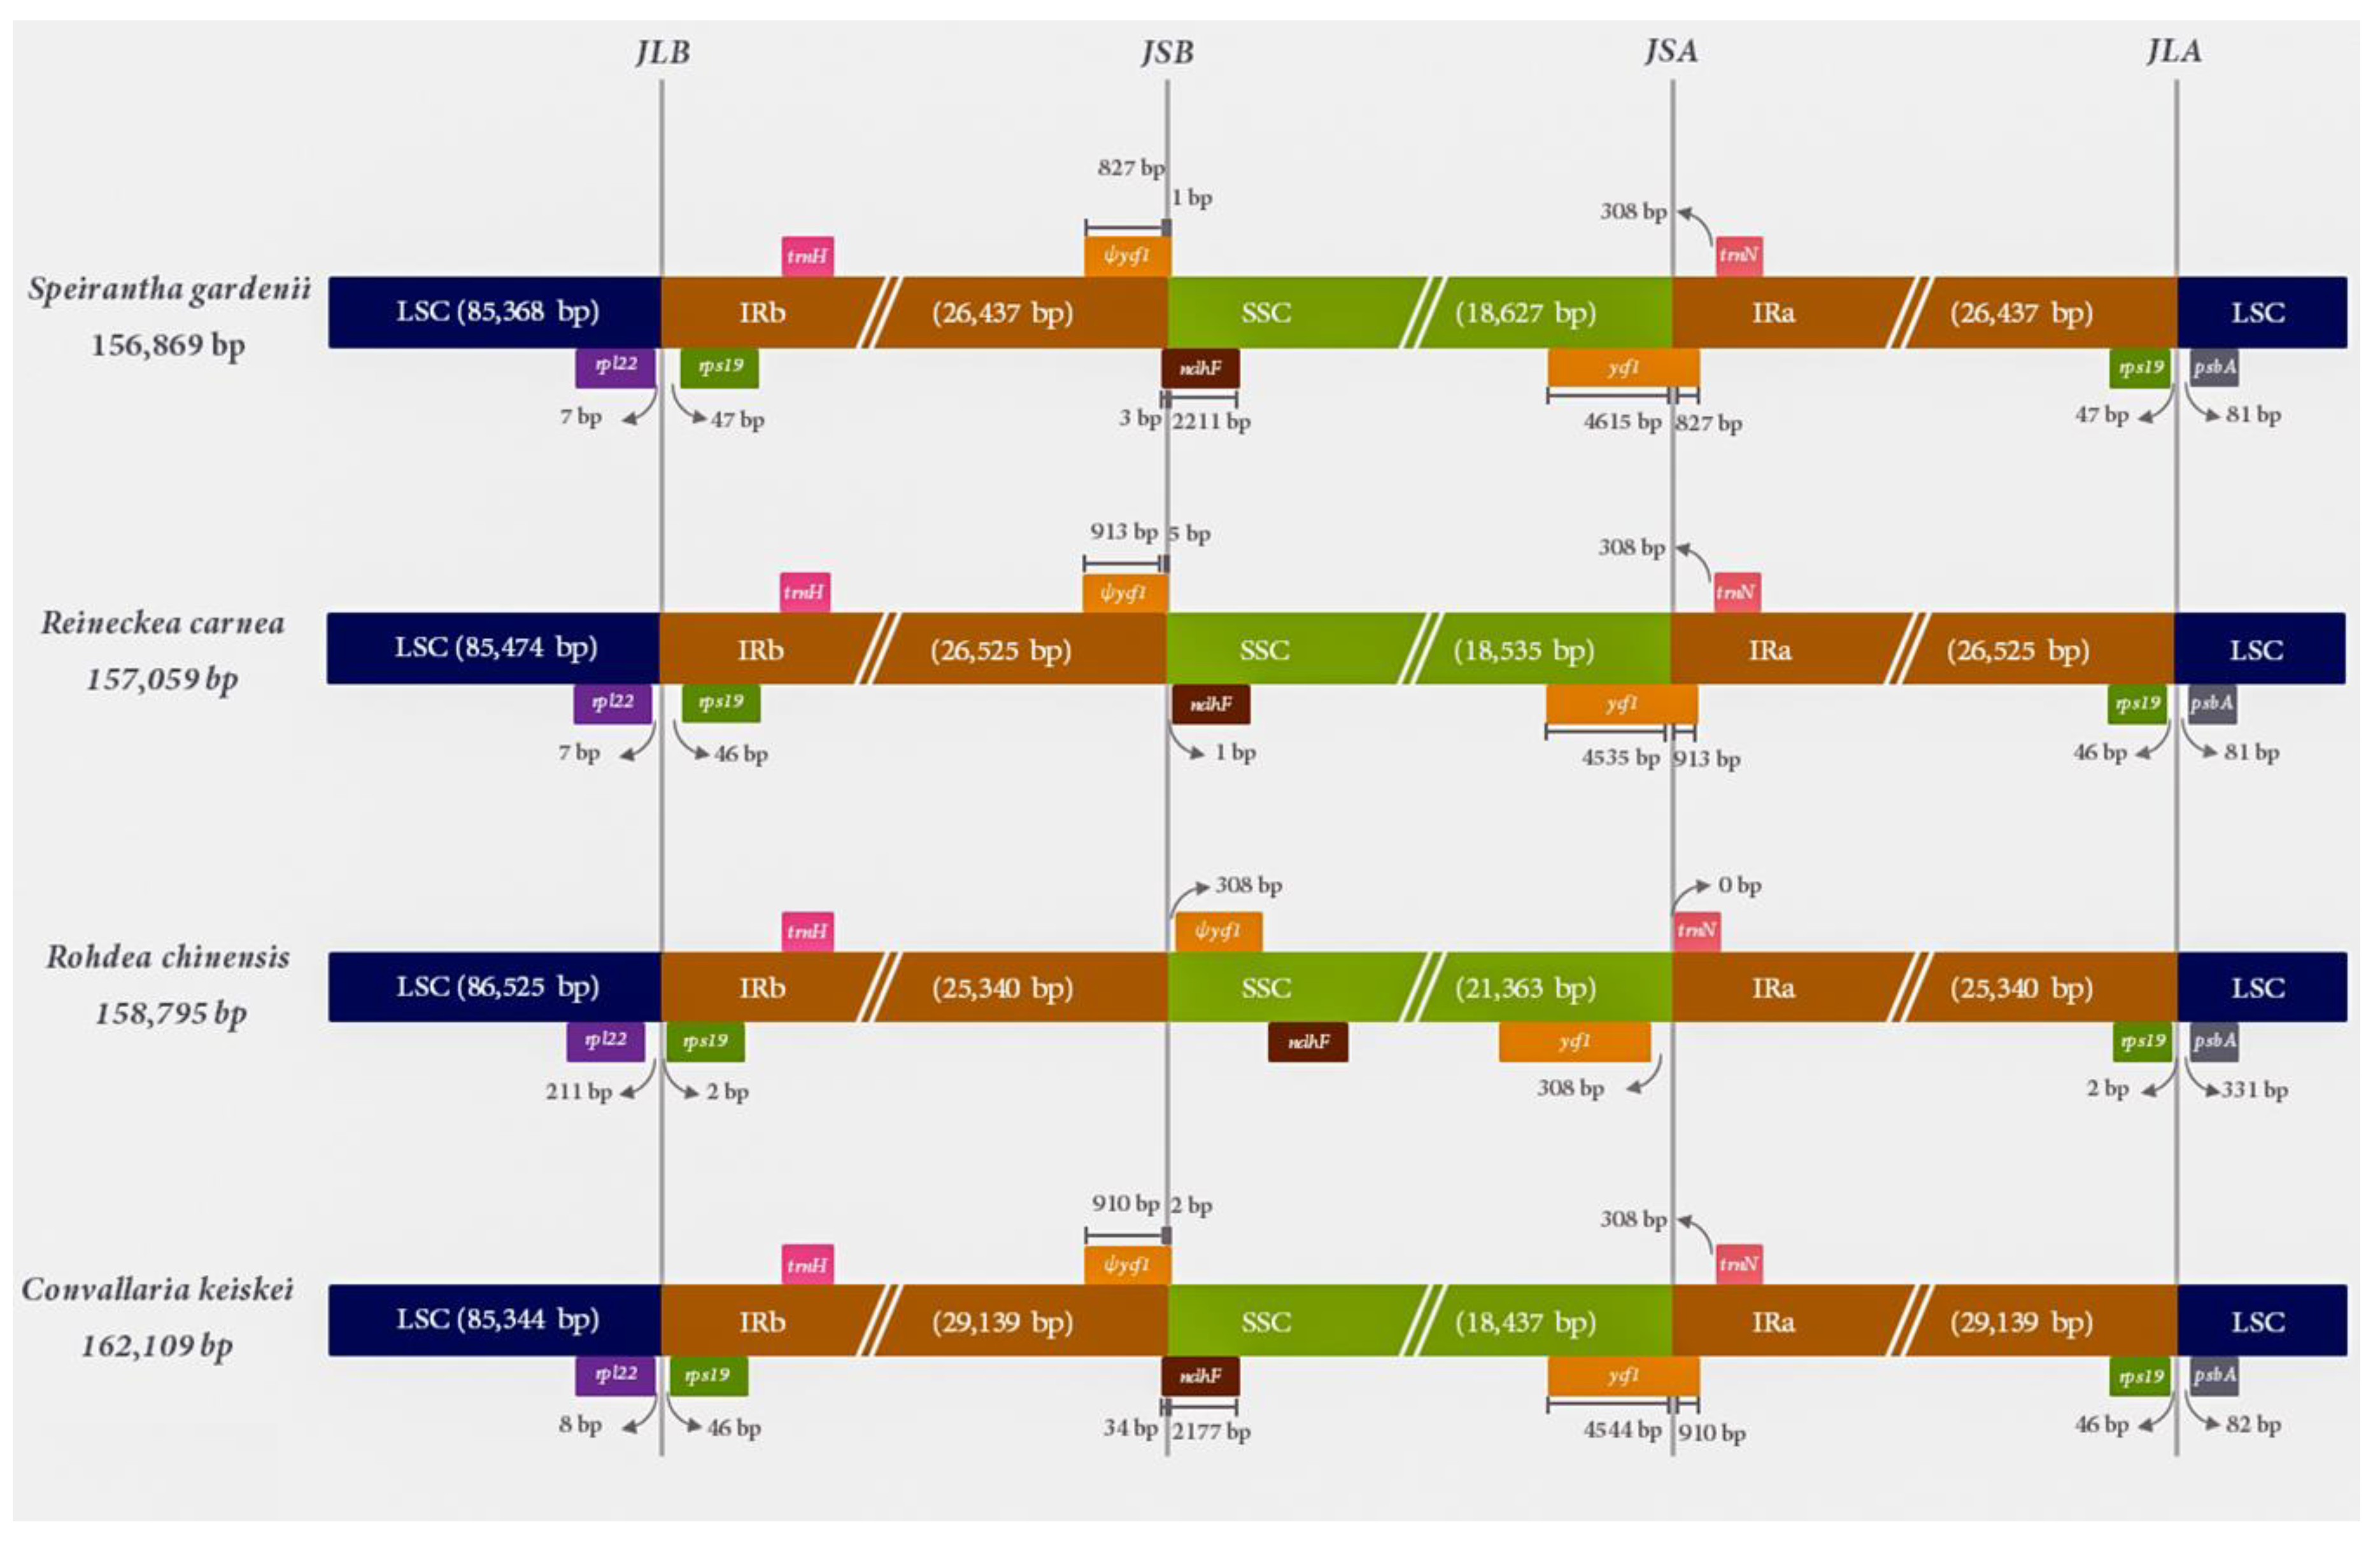
2.2. Comparative Analysis of the IR Contraction and Expansion in the Species of Nolinoideae

The LSC-IR and SSC-IR borders of the S. gardenii chloroplast genome are compared with three other closely related species (R. carnea, R. chinensis and C. keiskei) of the Nolinoideae subfamily (Figure 2). Two intact copies of the rps19 gene are present in the IR regions of all chloroplast genomes, whereas, in the IRbSSC border, the pseudogene yfc1 and ndhF gene crosses the IRb/SSC border region and overlaps with 1–34 bp region in the borders. Similarly, the intact ycf1 gene in all the chloroplast genomes except R. chinensis crosses SSC/IRa region with an 827–913 bp length fragment of ycf1 located in the IRA region. In contrast, the functional and pseudogene of ycf1 of the R. chinensis have dispersed in the SSC region and 308 bp away from the IRb/SSC and SSC/IRa border. Due to this ψycf1 gene shift in the IRb/SSC border of R. chinensis chloroplast genome, the gene ndhF is present in the SSC region and the trnN gene is present in the SSC/IRa region. The psbA gene sequences are found in LSC regions in all the chloroplast genomes. This gene is ~81–82 bp away from the IRa/LSC border of S. gardenii, R. carnea, and C. keiskei chloroplast genomes but 331 bp away for R. chinensis.
The sequence variation in chloroplast genomes of four Nolinoideae subfamily chloroplast genomes is plotted using the mVISTA program, where minor divergence is identified between S. gardenii and R. carnea (Figure 3). When S. gardenii is compared with two other chloroplast genomes namely R. chinensis and C. keiskei, it is highly diverged due to the presence of sequence variation in both protein-coding and intergenic regions of these two species.

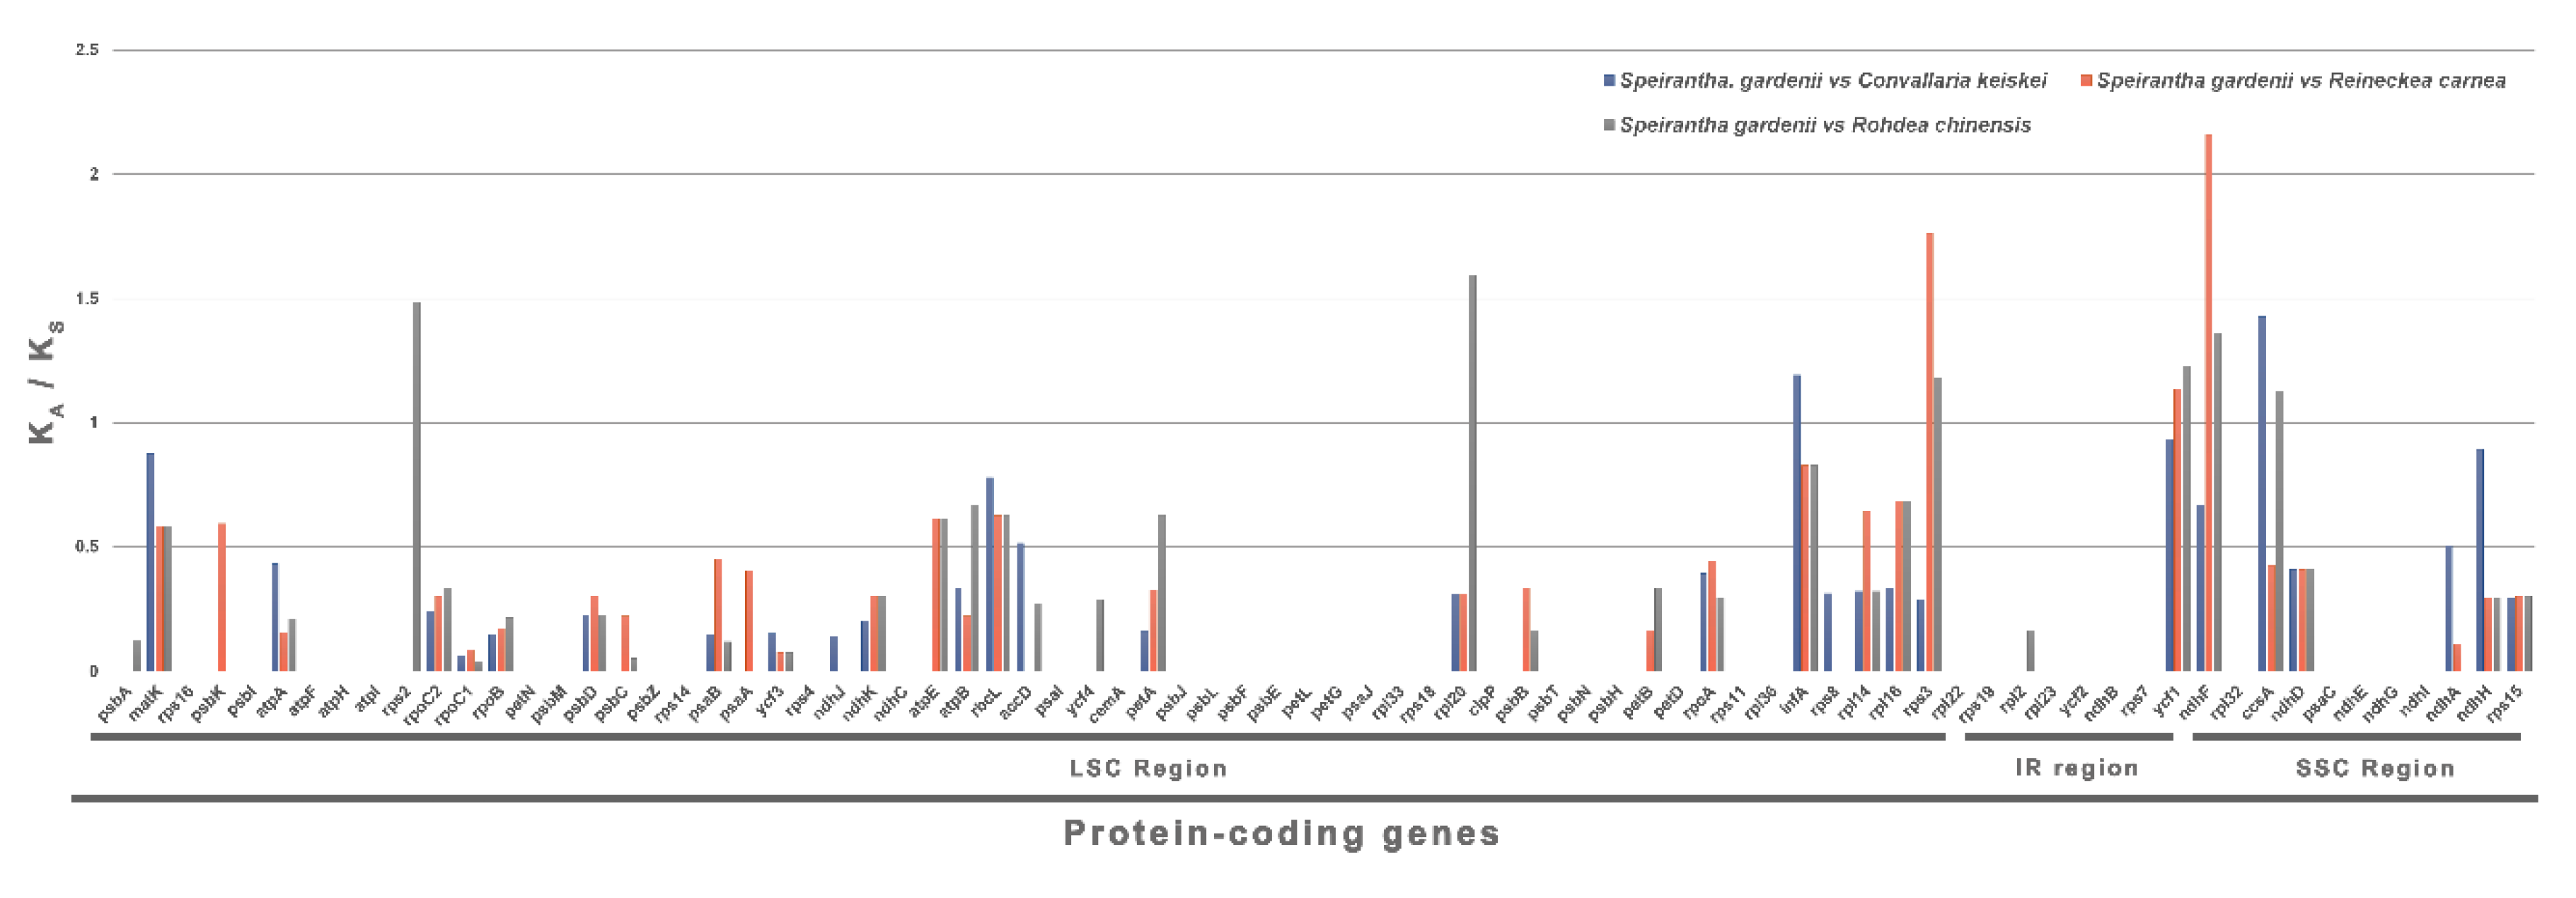
2.3. Synonymous (KS) and Nonsynonymous (KA) Substitution Rate Analysis

Synonymous and nonsynonymous substitution rates are analyzed for 79 protein-coding genes of S. gardenii, R. carnea, R. chinensis and C. keiskei chloroplast genomes (Figure 4). The KA/KS ratio of most of the genes are less than 1, except ccsA (1.13–1.43), infA (1.19), ndhF (1.36–2.15), rpl20 (1.59), rps2 (1.48), rps3 (1.18–1.76) and ycf1 (1.13–1.23) protein-coding genes.

2.4. Selective Pressure Events

The positive selection of seven protein-coding genes (ccsA, infA, ndhF, rpl20, rps2, rps3 and ycf1), genes of four closely related species (S. gardenii, R. carnea, R. chinensis and C. keiskei) and publicly available Nolinoideae chloroplast genome species were analyzed separately. The ω2 values of seven genes of four Nolinoideae species are ranging from 1 to 999 in the M2a model. So further, we compared these seven genes across Nolinoideae species to understand the selective pressure events. Due to the presence of pseudogenization of the infA and ycf1 gene in some Nolinoideae species, we analyzed the remaining five genes and identified the ω2 values ranging from 1 to 240.876. Furthermore, Bayes empirical Bayes (BEB) analysis is used to analyze the location of consistent selective sites in the seven protein-coding genes of four Nolinoideae species using the M7 vs. M8 model. The analysis revealed that five sites under potentially positive selection in the three protein-coding genes (infA-3; ndhF-1 and rps3-1) with posterior probabilities more than 0.95. Furthermore, the two sites (rps2-1 and ycf1-1) with greater than 0.99 (Supplementary Table S3) and the 2ΔLnL value is ranging from 0 to 26.084 (Table 2). Additionally, five genes (ccsA, ndhF, rpl20, rps2 and rps3) of all Nolinoideae species were analyzed and predicted that seven sites (ccsA-3 and ndhF-4) greater than 0.95 and two sites (ndhF-1 and rps2-1) with >0.99 (Supplementary Table S4) and the 2ΔLnL value is ranging from 0 to 108.245 (Table 3). In both analyses revealed that rpl20 does not encode any positively selected sites in their gene and the 2ΔLnL and the p-value of LRT are 0 to 0.40 and 0.895–1.0, respectively.

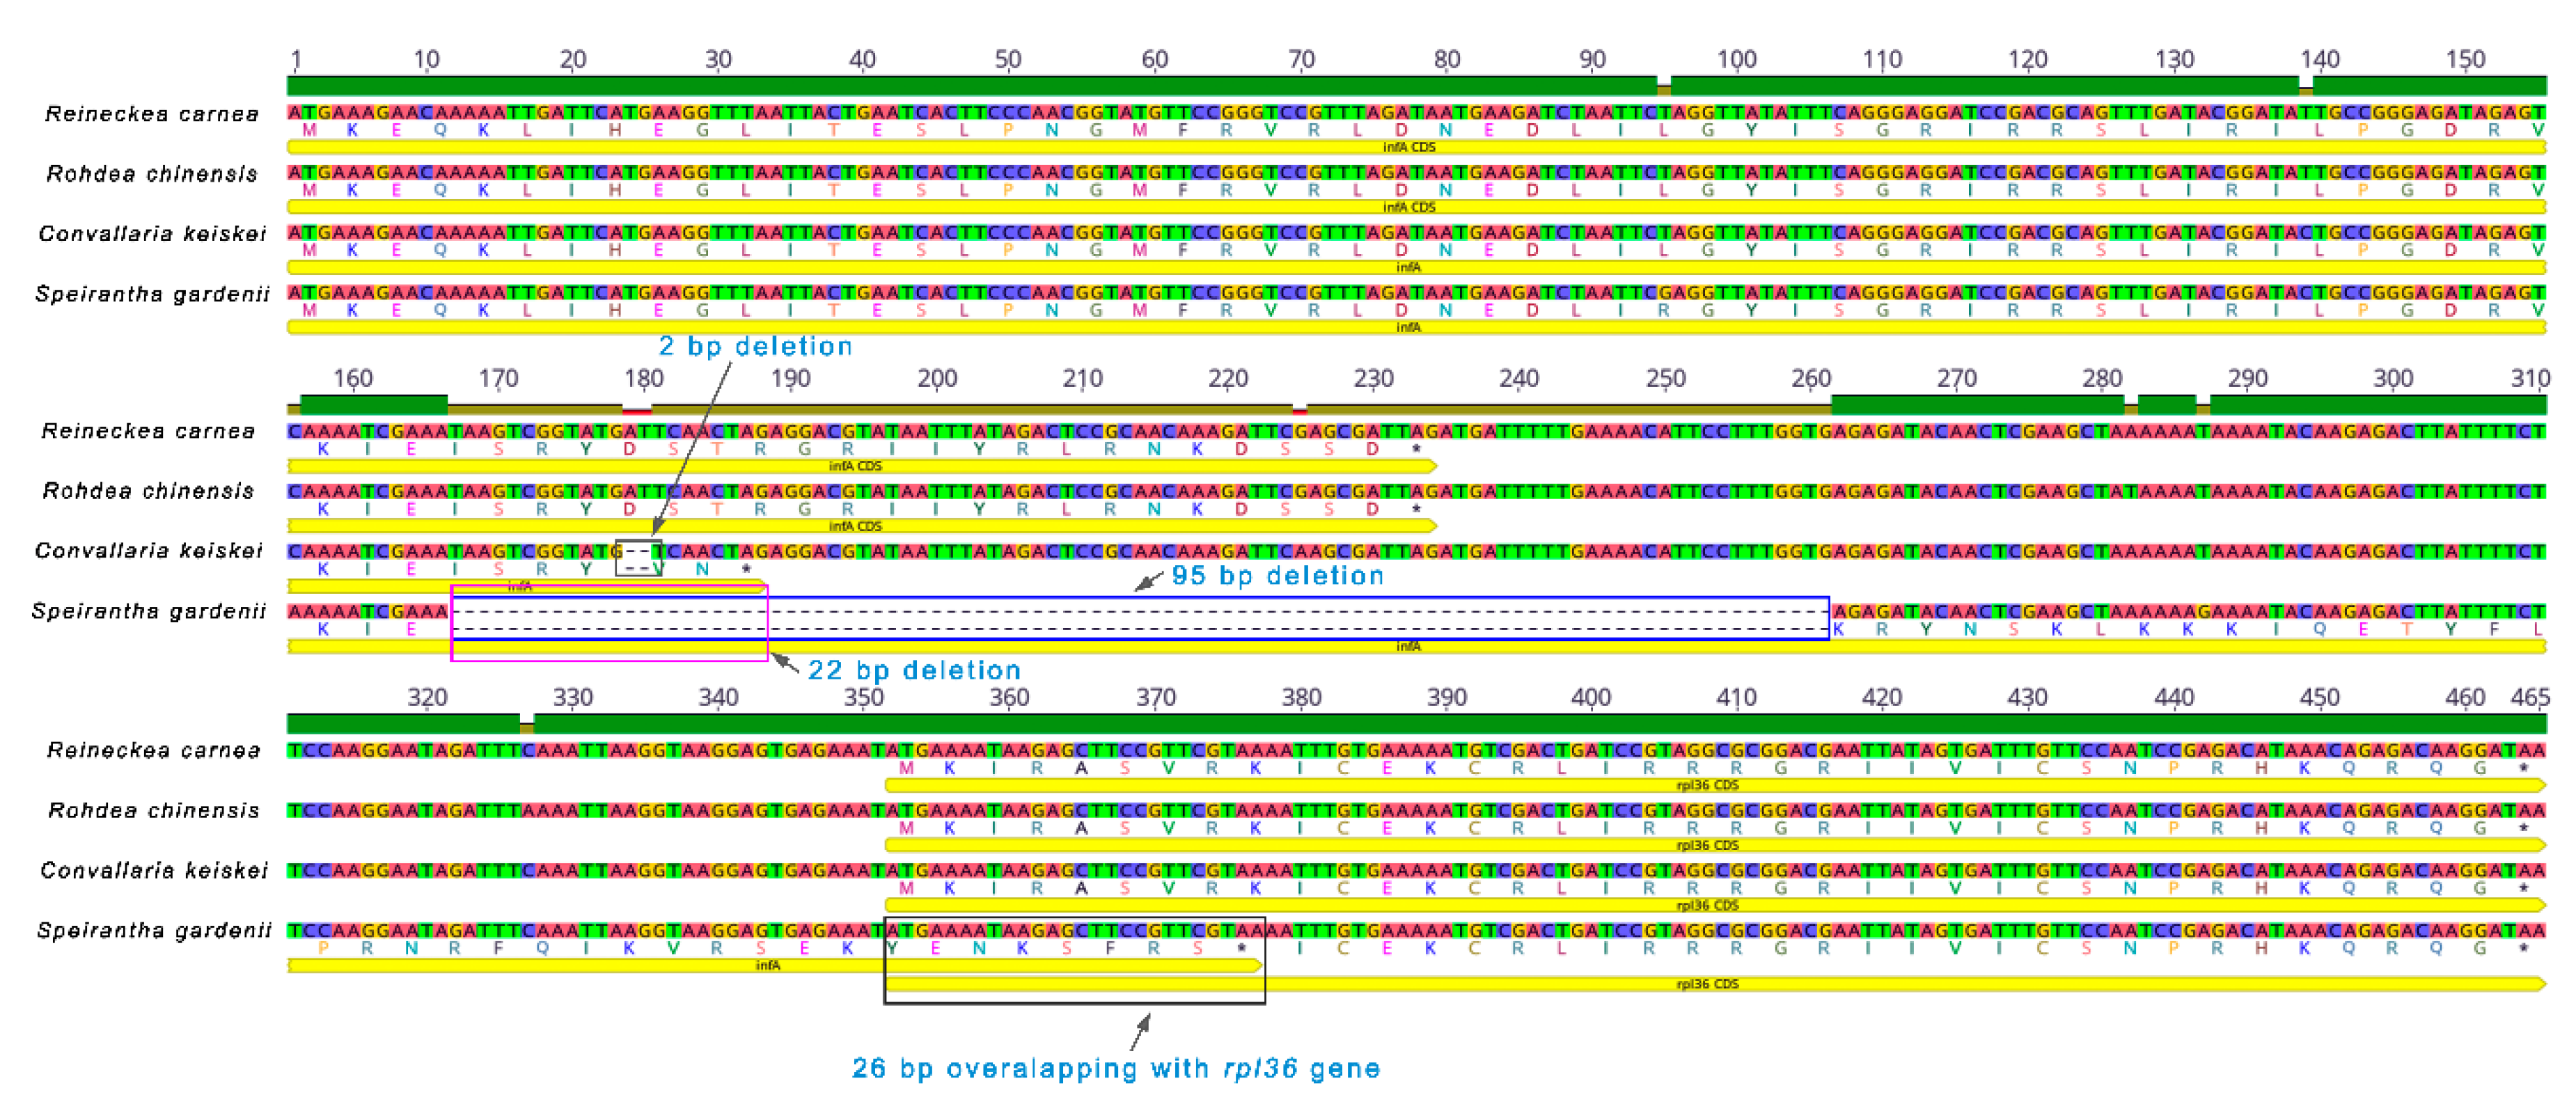
2.5. Analysis of infA Gene

The translation factor IF-1 (infA) gene of S. gardenii is compared with the other three Nolinoideae species. The comparative analysis showed that 26 bp deleted at the 3’ end of the infA gene followed by 79 bp deletion in the intergenic region between infA and rpl36 gene in the chloroplast genome of S. gardenii. Due to this frameshift mutation, the 3’ end of the infA is extended and 26 bp overlaps with the rpl36 gene, thus leads to the length of the infA gene increased to 282 bp (Figure 5).

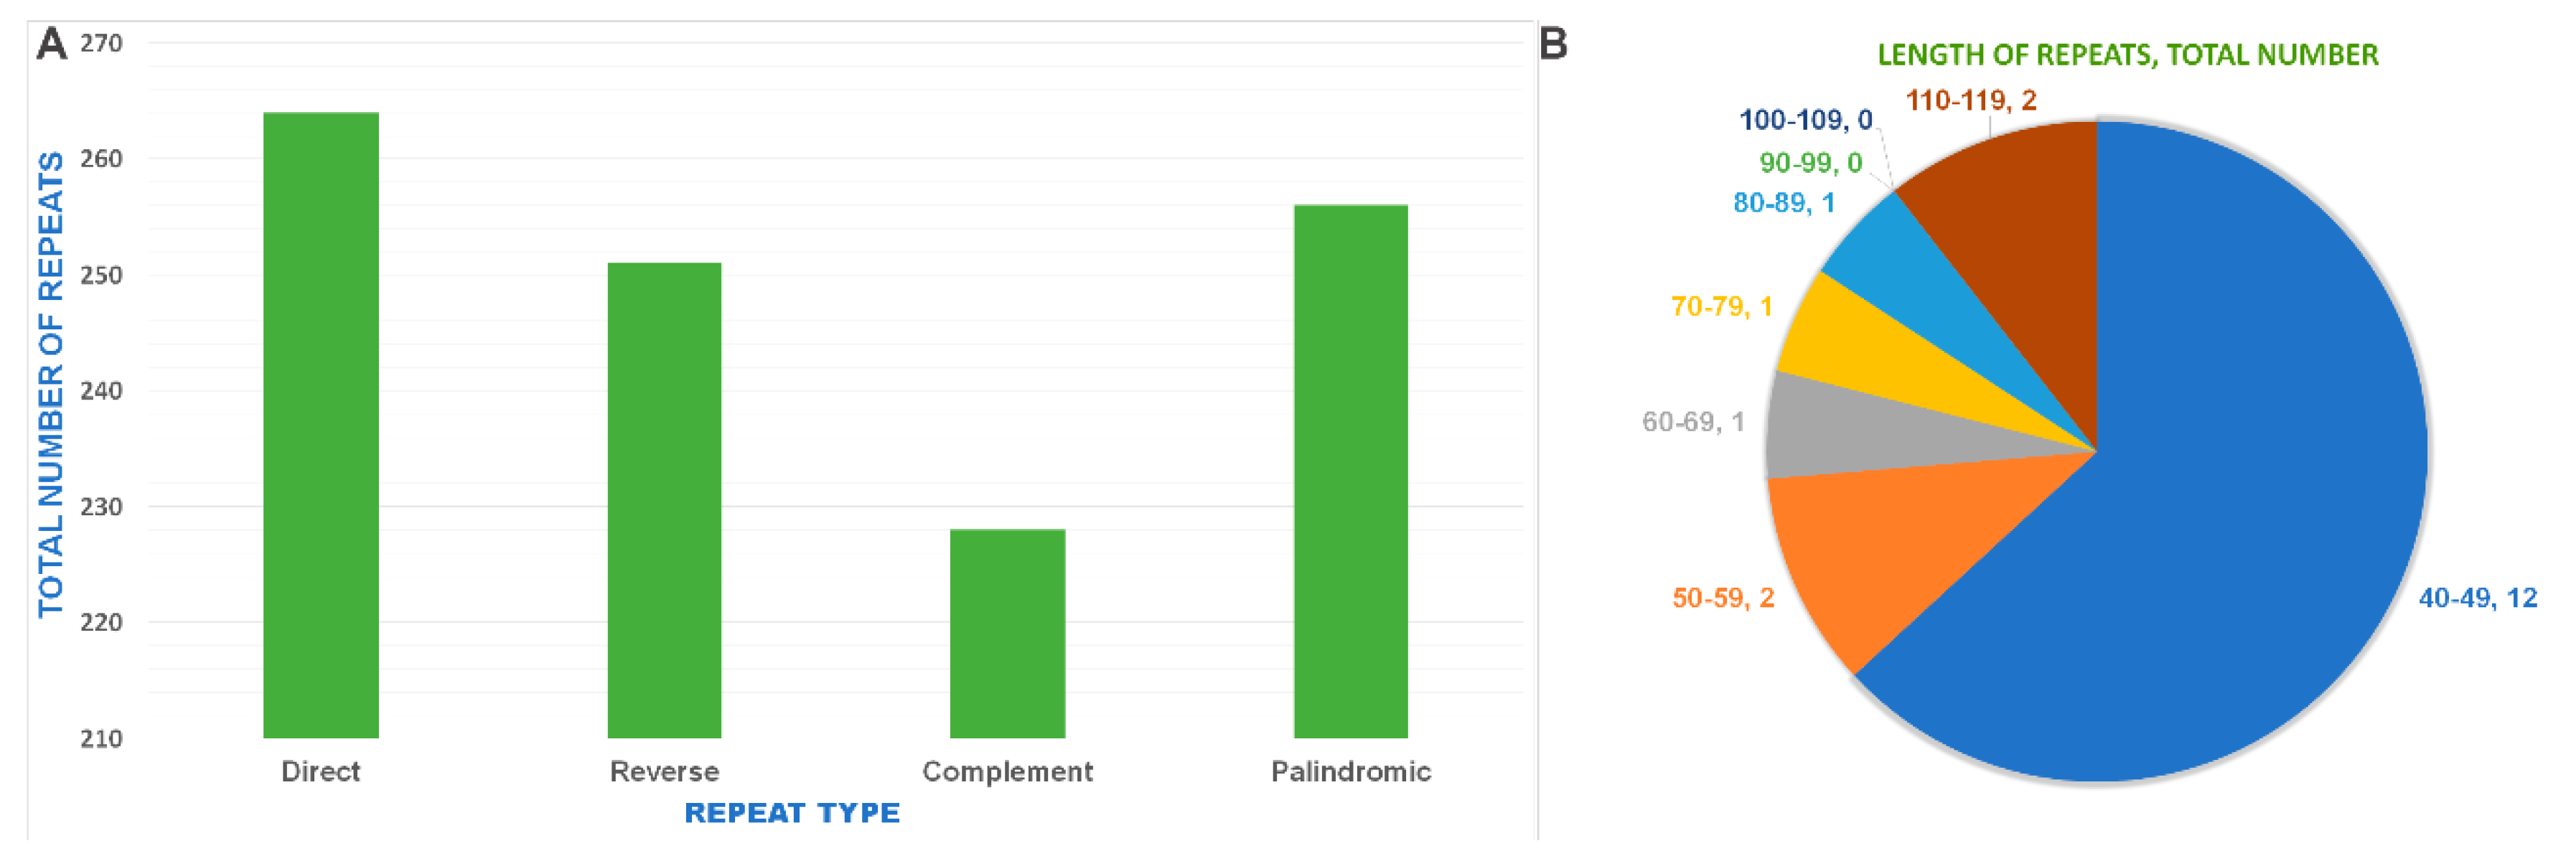
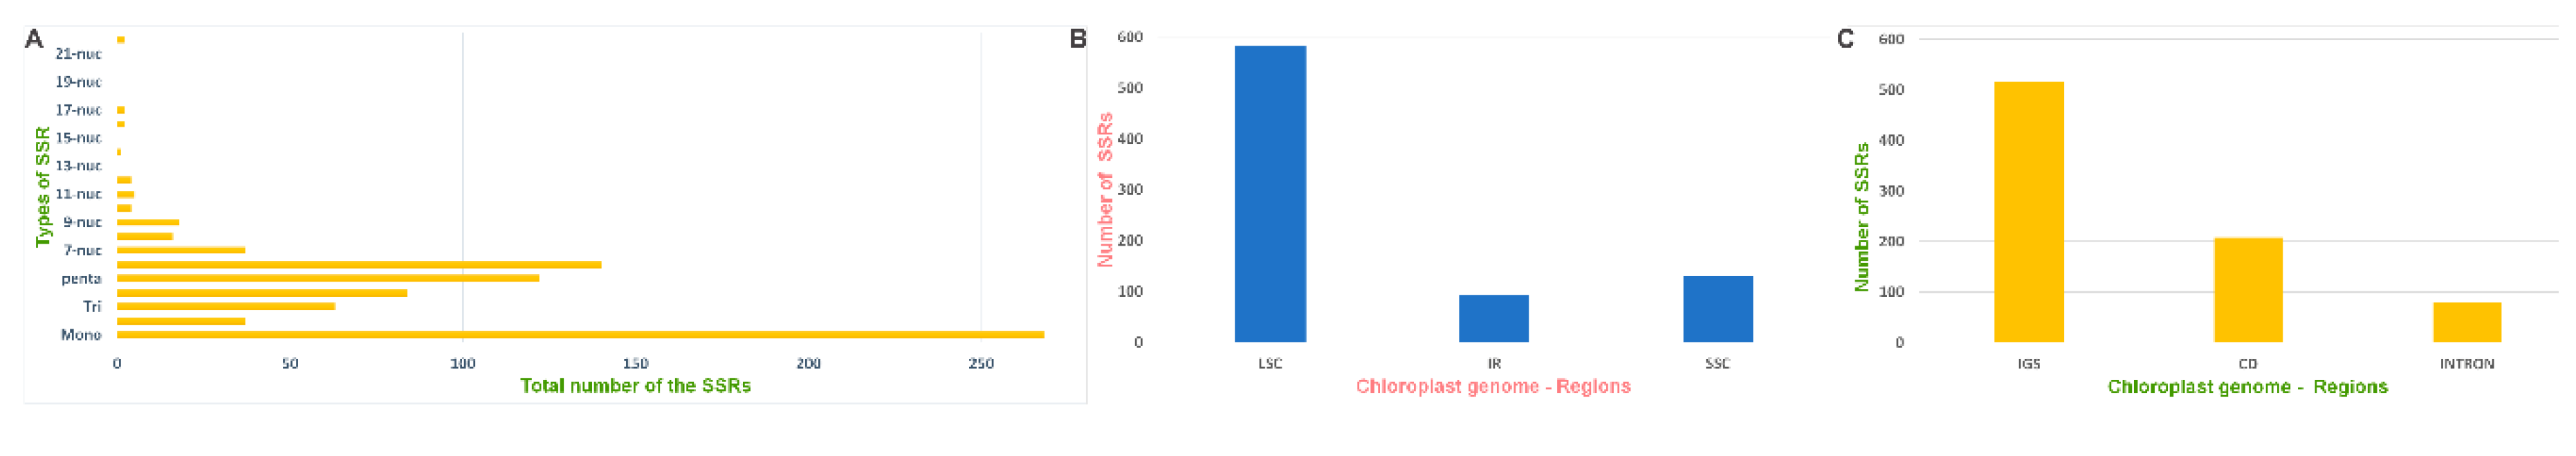
2.6. Repeat Sequence and Simple Sequence Repeat Analysis

REPuter program is used to determine the presence of repeat sequences in the S. gardenii chloroplast genome. The analysis showed that a total of 699 repeats, with motif length from 30 to 115 bp are present in its genome. The repeats sequences included 264 direct, 251 reverse, 228 complementary and 256 palindromic repeats (Figure 6a). Of these repeats, 30–39 bp long repeats predominantly occupy in the chloroplast genome and account for 98.1% (680 repeats) (data not shown). The remaining 19 repeats are distributed in the range of 40 to 115 bp length (Figure 6b).
A total of 805 simple sequence repeats (SSRs) were identified in the S. gardenii chloroplast genome. Of these, 268 (33.29%) are mono-nucleotide repeats, 37 (5.6%) di-nucleotide repeats, 63 (7.8%) tri-nucleotide repeats, 84 (10.4%) tetra-nucleotide repeats, 122 (15.15%) penta-nucleotide repeats, 140 (17.39%) hexa-nucleotide repeats, 37 (4.6%) 7-nucleotide repeats, 16 (1.99%) 8-nucleotide repeats, 18 (2.24%) 9-nucleotide repeats and 4, 5, 4, 1, 2, 2 and 2 are 10-, 11-, 12-, 14-, 16-, 17- and 22- nucleotide repeats, respectively (Figure 7a). Of the 805 SSRs, 72.17% (581), 11.55% (93) and 16.28% (131) SSRs are present in the LSC, IR, and SSC regions, respectively (Figure 7b). Additionally, the distribution of SSR in the protein-coding, intron and intergenic regions (IGS) were analyzed, and found that 517 (64.22%), 208 (25.84%), and 80 (9.94%) SSRs are located in IGS, protein-coding, and intron regions, respectively (Figure 7c).

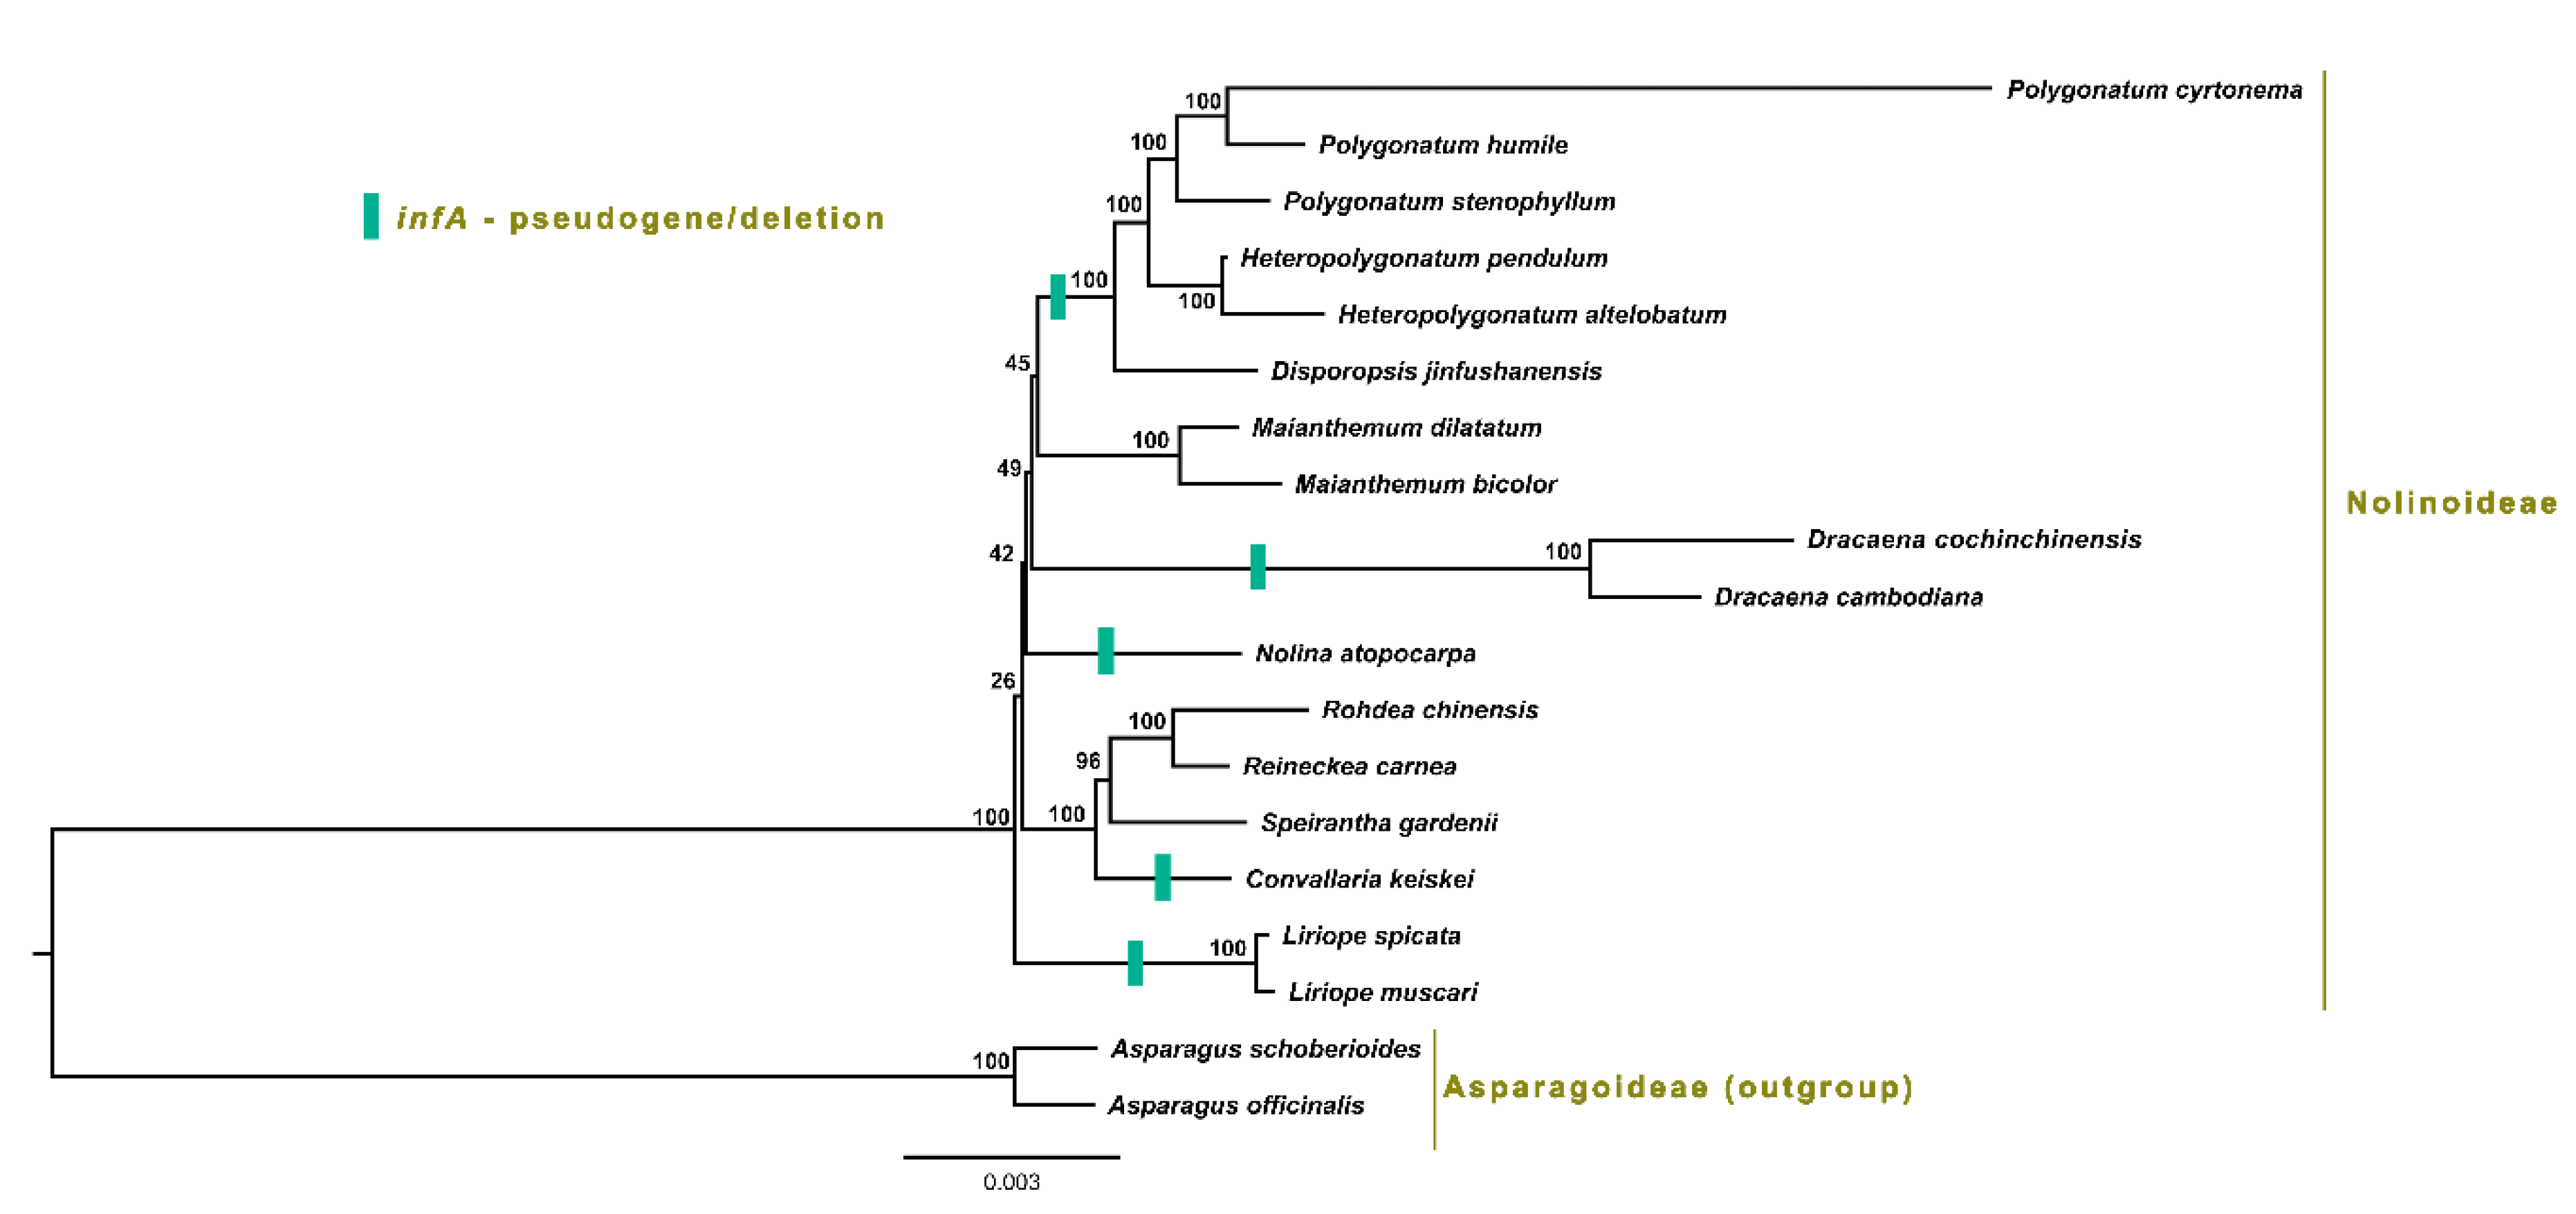
2.7. Phylogenetic Analysis

To analyze the phylogenetic position of S. gardenii with other Nolinoideae species, 75 protein-coding genes of 19 Nolinoideae chloroplast genomes are aligned. ML phylogenetic tree analysis revealed that Nolinoideae species formed a monophyletic group (Figure 8). S. gardenii clustered with R. carnea, R. chinensis and C. keiskei with strong bootstrap value and showed that S. gardenii is sister to both R. carnea, R. chinensis and C. keiskei.

3. Discussion

The species Speirantha gardenii is a monocot plant of the Nolinoideae subfamily of the family Asparagaceae. Until recently, only a few complete chloroplast genome sequences for this Nolinoideae subfamily have been deposited in GenBank, with the very first being that of Polygonatum cyrtonema in 2015. Owing to the development of high-throughput sequencing technologies, additional Nolinoideae chloroplast genomes were sequenced [9,10,11,12,13,14,15], but the genus Speirantha has to date remained unexplored. Therefore, in the present study, we sequenced the S. gardenii chloroplast genome and compared it with its closed related other Nolinoideae members. The length of the complete chloroplast genome sequence of S. gardenii is 156,869 bp and contains 137 individual genes, which is in the range of other Nolinoideae and angiosperms. The GC content of S. gardenii is 36.7%, which is similar with R. carnea, but differs with other closely related species, namely, R. chinensis (37.2%) and C. keiskei (37.9%) suggesting that the distribution of the GC contents in the Nolinoideae chloroplast genomes are inconsistent and this difference is due to the presence of high-level GC nucleotide percentages in the four rRNA genes in IR regions (Table 1). Likewise, similar results have been identified in other angiosperm chloroplast genomes [17,18,19].
Though the gene order and gene content are similar to other Nolinoideae species, the length of the chloroplast genome differs in the Nolinoideae species. LSC region of the species of Nolinoideae subfamily is generally similar but differs in SSC and IR regions in some species. The SSC region of the R. chinensis (21,363 bp) is expanded due to the shift of the ycf1 gene from the IR/SSC border to the SSC region. To support this event, plenty of insertion and deletion process is observed in their chloroplast genome. Interestingly, the IR region of the C. keiskei is expanded due to the integration of 3.3 kb mitochondrial region in the chloroplast genome and this event is restricted to the Convallaria genus [12].
Furthermore, the high sequence variation is identified in the chloroplast genomes of Nolinoideae species. When S. gardenii is compared with other closely related species, the minor divergence is identified in the intergenic regions of the R. carnea chloroplast genome. Besides, high sequence variation is identified in the intergenic regions of C. keiskei and intergenic and protein-coding regions of R. chinensis. This sequence variation is due to the insertion of the mitochondrial region in the chloroplast genome of C. keiskei and indel observed in the intergenic and protein-coding regions of R. chinensis genome. Owing to the indel events in the Nolinoideae species, the substitution rate impacts in some protein-coding genes. The rate of synonymous substitutions (KS) accumulates nearly neutral evolution, whereas the rate of nonsynonymous substitutions (KA) are subjected to selective pressures of varying degree and positive or negative direction [20]. The ratio of KA/KS (ω) value below 1 indicates that the corresponding genes experiencing relaxed or purifying selection while ω = 1 and ω > 1 indicate neutral and positive selection, respectively [20,21]. The KA/KS ratio of the protein-coding genes, such as ccsA, infA, ndhF, rpl20, rps2, rps3 and ycf1, are more than 1, which indicates that these genes are under positive selection (Figure 4). This deviation from unity is due to the presence of indel, premature stop codon and amino-acid substitution events in the protein-coding genes, such as the 6 bp deletion and three amino-acid change in the ccsA and infA of C. keiskei; 6 and 5 amino acid change by non-synonymous substitution in the ndhF gene of R. carnea and R. chinensis; 8 bp insertion and 2 amino-acid substitution in the rpl20 and rps2 of R. chinensis; 3 amino acid change in the rps3 of R. carnea; 18 amino-acid change and 161 bp insertion in the ycf1 gene of R. carnea and R. chinensis. Though we have identified high KA/KS nucleotide substitution ratio in these protein-coding genes, the overall nucleotide identity is >99.2%, except for infA (85%). So, we compared the infA gene in the Nolinoideae subfamily. Usually, the length of the infA gene is 234 bp. Most of the species of the Nolinoideae subfamily do not contain an infA gene or contain it as a pseudogene except Maianthemum dilatatum, M. bicolor, R. carnea and R. chinensis [9,10,13]. Meanwhile, the deletion of two bp at the 180th bp position in the infA gene of C. keiskei, causes frameshift mutation to a premature stop codon and thus leads to the formation of infA pseudogene [12]. In contrast, a total of 95 bp deletion occurred at the 3’ end of the infA gene (26 bp) and the intergenic region between the infA and rpl36 gene (79 bp). Due to the indel process, a frameshift mutation occurred and the 3’ end of the infA is extended and 26 bp overlaps with the rpl36 gene, which thus led to the length of the infA gene increased to 282 bp (Figure 5). Furthermore, a similar type of elongated infA gene is observed in many monocot plants such as Zea mays, Oryza sativa, Hordeum vulgare etc. [22,23,24]. Besides, previous studies also revealed that most of the angiosperms have lost their infA gene independently in their chloroplast genome [25].
Based on ω analysis of 79 protein-coding genes of S. gardenii, R. carnea, R. chinensis and C. keiskei chloroplast genomes, we identified seven genes that are under positive selection. So, we evaluated a selective analysis of the exons of each of seven protein-coding genes using site-specific models with four comparison models (M0 vs. M3, M1 vs. M2a, M7 vs. M8, M8a vs. M8, likelihood ratio test (LRT) (threshold value p ≤ 0.05) in EasyCodeML software [26]. Among seven models, M2a is the positive selective model and p (p0, p1 and p2) represents the proportions of negative or purifying, neutral and positive selection. The ω2 values of seven genes are ranging from 1 to 999 in the M2a model (Supplementary Table S3). Further, we compared these seven genes across the publicly available Nolinoideae chloroplast genome species to understand the selective pressure events. Due to the presence of pseudogenization of the infA and ycf1 gene in some Nolinoideae species, we analyzed the remaining five genes and identified the ω2 values ranging from 1 to 240.876 (Supplementary Table S4). The variation in ω2 value might be due to the increase in the number of species analyzed in this study.
To determine which sites are subject to positive selection, Bayes empirical Bayes (BEB) analysis is used to analyze the location of consistent selective sites in the seven protein-coding genes of S. gardenii chloroplast genome with its three closely related species using the M7 vs. M8 model. These genes include one NADH-dehydrogenase subunit gene (ndhF), one ribosome large subunit gene (rpl20), two ribosome small subunit genes (rps2 and rps3) and ccsA, infA and ycf1 genes. The analysis of BEB revealed that five sites are under potentially positive selection in the four protein-coding genes (infA-3; ndhF-1 and rps3 -1) with posterior probabilities of more than 0.95 and two sites (rps2-1 and ycf1-1) with greater than 0.99 (Table 2). Furthermore, it could not identify any positively selected sites in the ccsA and rpl20 genes. The 2ΔLnL value of two genes is zero and the p-value of LRT is more than 0.05. In contrast, when analyzed with five genes (ccsA, ndhF, rpl20, rps2 and rps3) of all Nolinoideae species, we identified seven sites (ccsA-3 and ndhF-4) greater than 0.95 and two sites (ndhF-1 and rps2-1) >0.99. Furthermore, we can able to find out positively selected sites in the ccsA gene when analyzed with all the species of the Nolinoideae subfamily. Nevertheless, we could not find any positively selected sites in rpl20 and rps3. In both analyses, rpl20 does not encode any positively selected sites in their gene, even though it has a higher ω value than ccsA, infA, rps2 and ycf1 genes. To support this analysis, the 2ΔLnL value of rpl20 is zero and the p-value of LRT is greater than 0.05 (Table 2 and Table 3). All these highly positive selection genes are involved in the functions of the plant genetic system or photosynthesis process [27,28,29,30,31]. Besides, these seven genes have undergone positive selection, which might be the result of adaptation to their diverse habitats. In the end, highly variable regions and seven protein-coding genes that are identified in their genome to be under positive selection could be used to generate potential markers for phylogenetic studies or candidates for DNA barcoding in future studies.
Simple sequence repeats (SSRs) are extremely powerful molecular marker and play a major role in the population genetics, evolutionary studies, chloroplast genome rearrangement and recombination process [2,18,32,33,34,35,36,37,38]. Among the 805 SSRs found in the S. gardenii plastome, most of the SSRs are mononucleotide, which occupies 33.29% followed by hexa- (17.39%) and penta- (15.15%) nucleotide SSRs in their genome. We also found many SSRs in IGS regions (64.22%) compared to protein-coding and intron regions in the S. gardenii plastome. Because most of the protein-coding genes are highly conserved than intergenic regions of angiosperm chloroplast genomes [3,5,12]. Similarly, the previous studies also revealed that the non-coding region contains more SSRs than the coding regions [18,39,40]. The presence of SSR markers in the S. Speirantha could be used to understand the genetic relationships between the closely related species. The complete chloroplast genome sequence-based phylogenetic studies provide essential information regarding the evolutionary relationship among species, genera and families [41,42,43,44,45,46]. The phylogenetic relationship of the Nolinoideae taxa has not been resolved in earlier studies. The reason for this is that the Nolinoideae subfamily consists of three major tribe clades, namely, Polygonateae, Aspidistreae and Ophiopogoneae, and is weakly supported in the phylogenetic tree [47]. Moreover, in the Polygonateae clade, several Polygonatum species were characterized and their phylogenetic relationships have been resolved recently [9,11,14,15]. In contrast, only a few studies have been carried out in the Aspidistreae tribe clade [10,12,13]. So, in the present study, we constructed a maximum-likelihood phylogenetic tree based on concatenated 75 protein-coding genes of 19 Nolinoideae species and revealed that all the species formed a monophyletic group and S. gardenii formed a cluster with R. carnea, R. chinensis and C. keiskei. The previous studies also support this phylogenetic tree where similar results were obtained that showed weakly supported bootstrap value in some nodes of the Nolinoideae phylogeny [9,10,11,12,13,14,15,48]. The phylogenetic result also showed that Speirantha, Rohdea, Reineckea and Convallaria genus are constantly clustered in the same clade with a high-resolution value, even though high sequence divergence is noted in few protein-coding genes of these chloroplast genomes. These results suggest that Speirantha is a sister clade to Rohdea, Reineckea and Convallaria genus. However, the genus Liriope made the sister group to the Aspidistreae tribe clade with very weak bootstrap value (26%). Floden and Schilling [47] revealed that the Maianthemum is not sister to Disporopsis, Heteropolygonatum and Polygonatum and suggested that Maianthemum does not belong to the Polygonateae tribe based on petA-psbJ + ITS analyses. In contrast, our results showed that Maianthemum is a sister to Disporopsis, Heteropolygonatum and Polygonatum and it belongs to the Polygonateae tribe based on 75 plastid protein-coding genes. To support our results, previous studies also revealed that Maianthemum was included in the Polygonateae tribe based on four plastid markers [49,50]. Therefore, more taxa need to be included to understand the phylogenetic position and their relationships with other Nolinoideae subfamily species in future studies.

4. Materials and Methods

4.1. DNA Extraction and Sequencing

A high-quality Speirantha gardenii DNA sample was obtained from the DNA bank of the Royal Botanic Gardens, Kew, London, England (http://data.kew.org/dnabank/DnaBankForm.html). Whole-genome sequencing was performed using Illumina HiSeq2500 (Phyzen Ltd., South Korea) and a paired-end (PE) library of 2 × 150 bp and an insert size of ~550 bp and obtained 8,363,058,594 raw reads. Read quality was analyzed with FastQC [51] and low-quality reads were removed with Trimmomatic 0.39 [52]. The clean reads were filtered with GetOrganelle pipe-line (https://github.com/Kinggerm/GetOrganelle) to get plastid-like reads, then the filtered reads were assembled by de nova approach using SPAdes version 3.12.0 [53]. The obtained contigs (>500 bp) were mapped with Nicotiana tabacum plastid genes (NC_001879) and three putative plastid-like contigs were identified and scaffolded using Geneious Prime (Biomatters, New Zealand). complete chloroplast genome sequence and gene annotation were submitted to GenBank and assigned the accession number MT797212.

4.2. The Chloroplast Genome Annotation of the S. gardenii

Dual Organeller GenoMe Annotator (DOGMA) program was employed to annotate the S. gardenii chloroplast genome [54]. The initial annotation, putative starts, stops, and intron positions were adjusted by comparing them with closely related Convallaria keiskei homologous genes. Transfer RNA genes were verified using tRNAscan-SE version1.21 with default settings [55]. The online program OGDRAW was used to draw a circular map of the S. gardenii chloroplast genome [56].

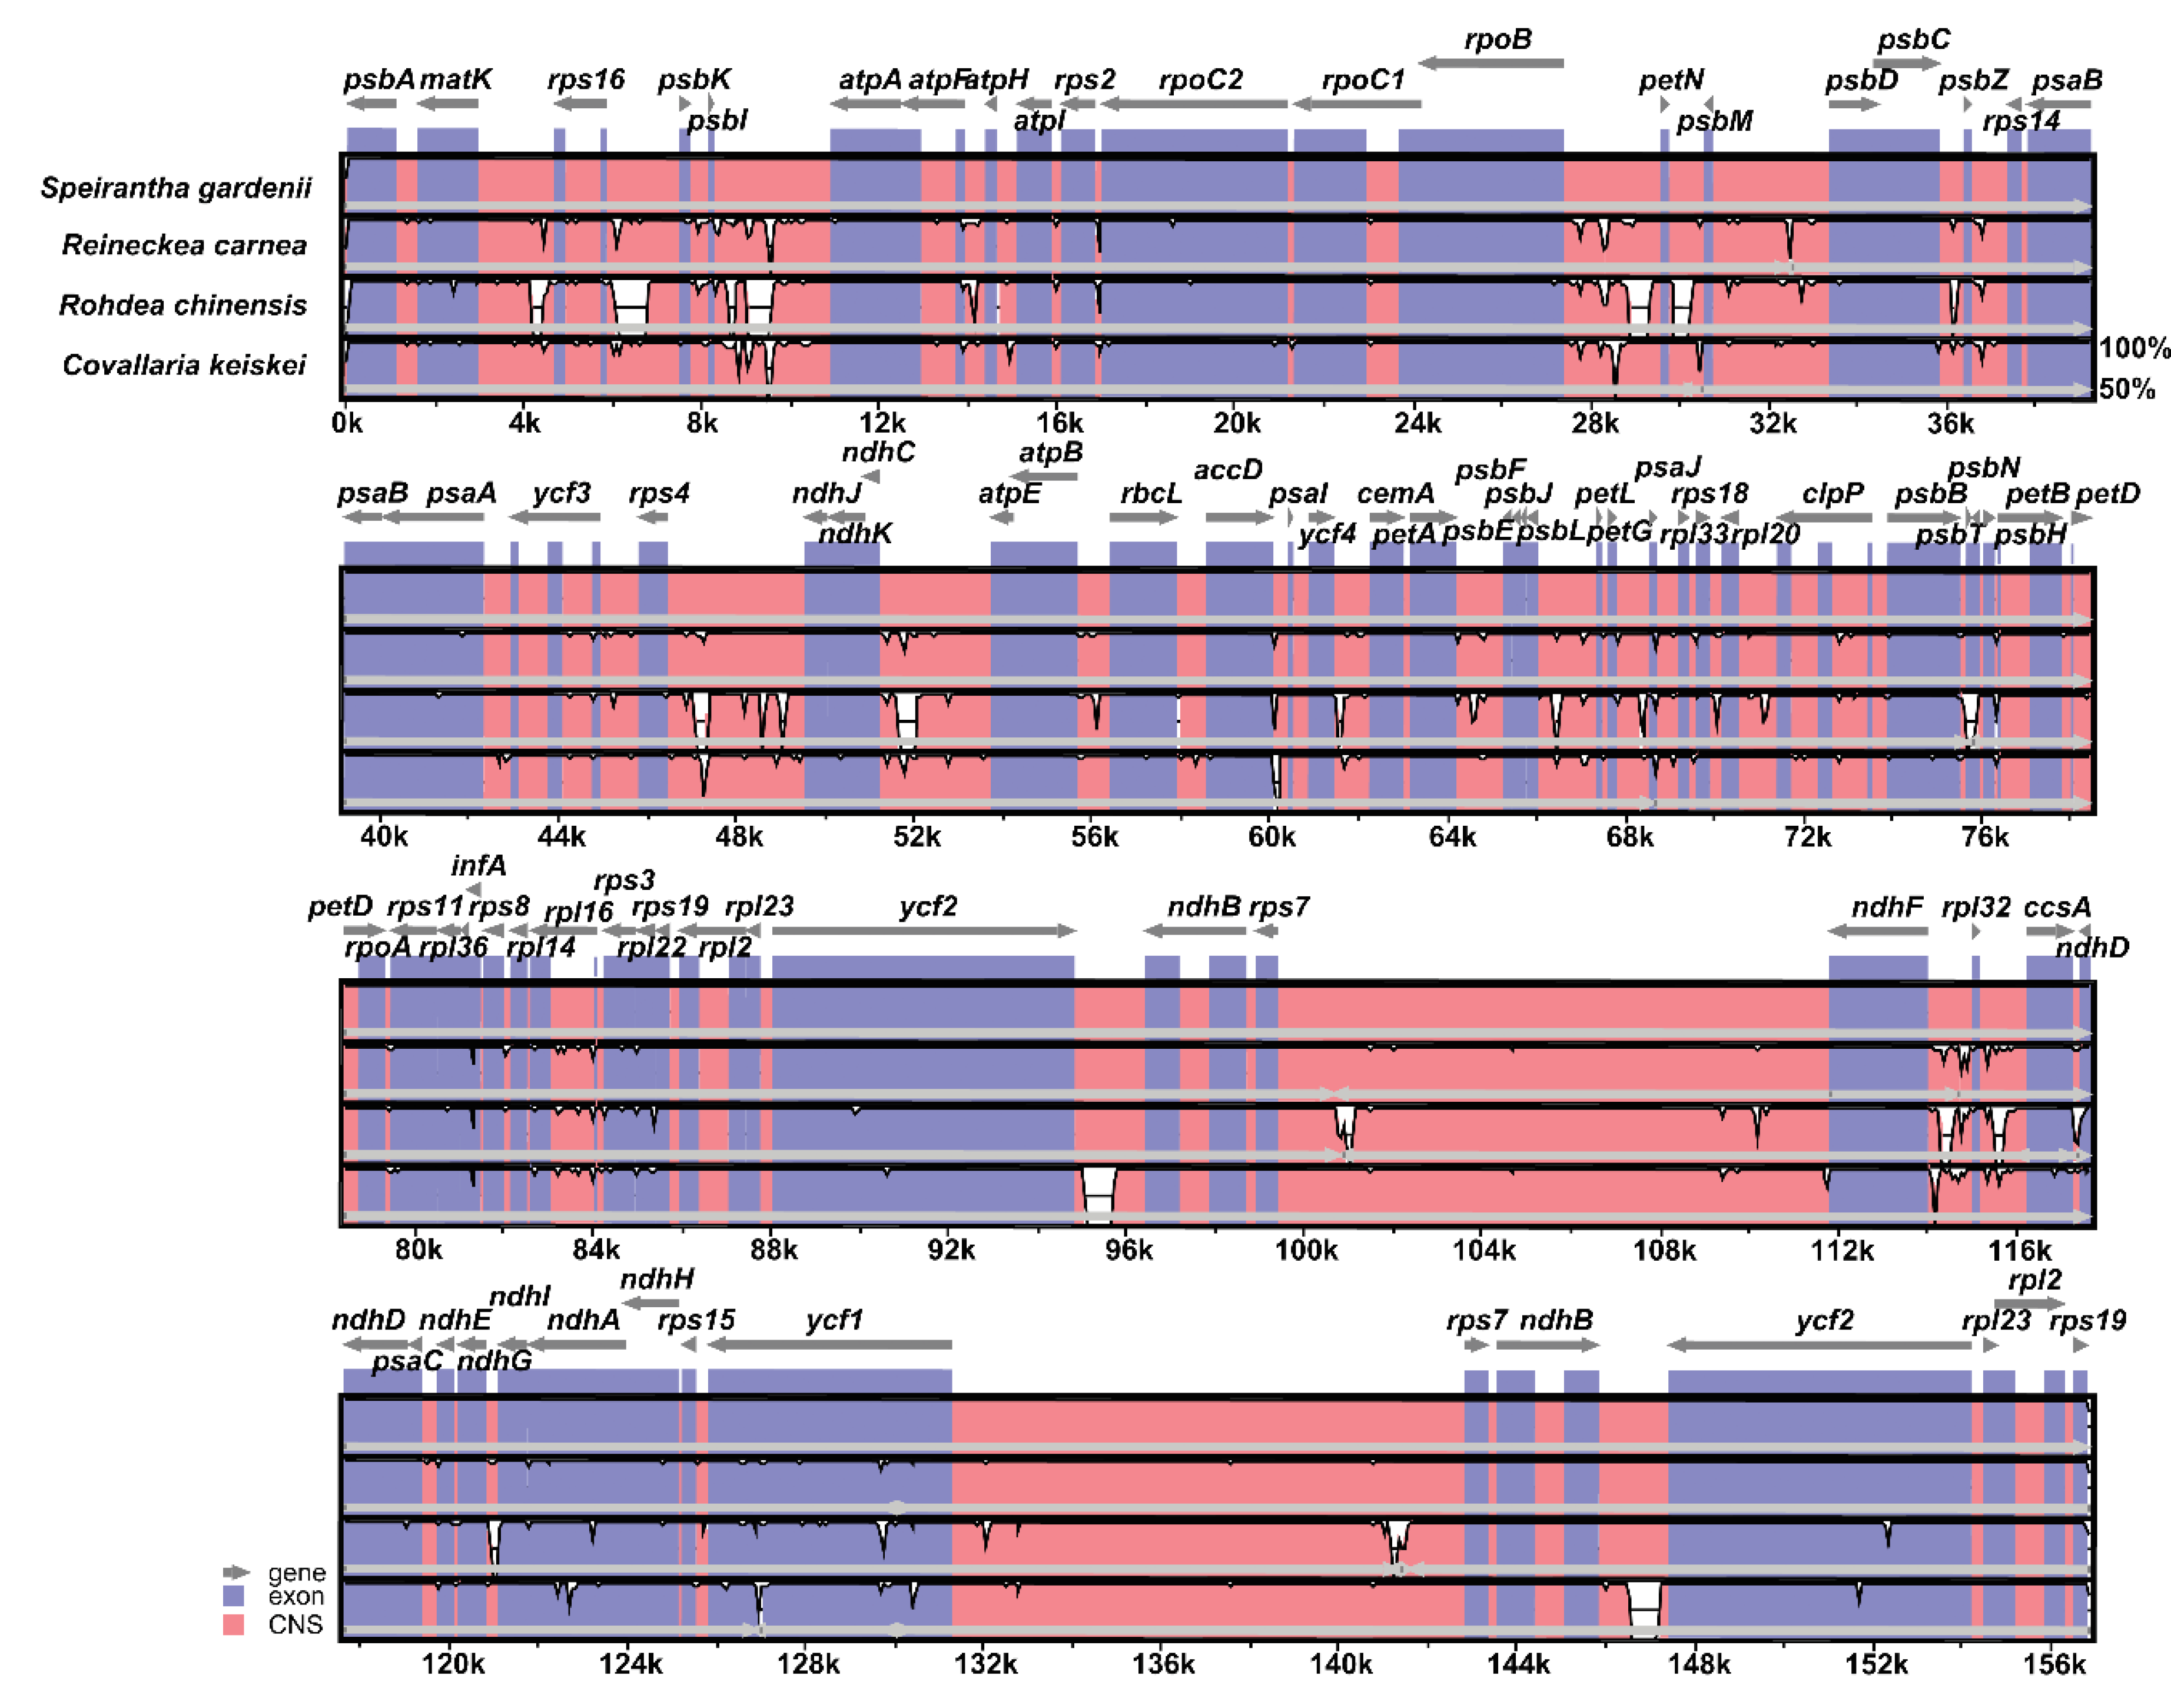
4.3. Comparative Chloroplast Genome Analysis of the S. gardenii

The mVISTA program in Shuffle-LAGAN mode was used to compare the S. gardenii chloroplast genome with closely related three other chloroplast genomes namely Reineckea carnea, Rohdea chinensis and C. keiskei using S. gardenii annotation as a reference [57]. The boundaries between IR and SC regions of these species were also compared and analyzed.

4.4. Characterization of Substitution Rates

To evaluate synonymous (KS) and nonsynonymous (KA) substitution rates, the S. gardenii chloroplast genome was compared with the three other chloroplast genome sequences of R. carnea, R. chinensis and C. keiskei. The similar individual functional protein-coding gene exons of these genomes were extracted and aligned separately using Geneious Prime (Biomatters, New Zealand). The aligned sequences were translated into protein sequences and substitution rates were analyzed using DnaSP [58].

4.5. Positive Selection Analysis

To detect the nonsynonymous vs. synonymous (ω) ratio of seven protein-coding genes (ccsA, infA, ndhF, rpl20, rps2, rps3 and ycf1) under selection in four species S. gardenii, R. carnea, R. chinensis and C. keiskei and all Nolinoideae species separately, the sequences of each gene were aligned using the MAFFT program [59] and the maximum likelihood phylogenetic tree was constructed using RAxML v. 7.2.6 [60]. The nested site-specific model was conducted to calculate nonsynonymous (KA) and synonymous substitution (KS) ratio using EasyCodeML [26]. The seven codon substitution models described as M0, M1a, M2a, M3, M7, M8 and M8a were examined. Two likelihood ratio tests were conducted to identify the positively selected sites: M0 (one-ratio) vs. M3 (discrete), M1a (neutral) vs. M2a (positive selection) and M7 (β) vs. M8 (β and ω > 1) and M8a ((β and ω = 1) vs. M8, which were compared using a nested site-specific model [26]. The likelihood ratio test (LRT) of the above comparison was carried out respectively to evaluate the selection strength and the p-values of Chi-square (x2) lesser than 0.05 were considered as significant. If the LRT p-values were significant (<0.05), Bayes empirical Bayes (BEB) method was implemented to identify codons under positive selection. The BEB values higher than 0.95 and 0.99 indicate the sites potentially under positive selection and highly positive selection, which is indicated by asterisks and double asterisks, respectively.

4.6. Analysis of Repeat Sequences and Single Sequence Repeats (SSR)

REPuter software was applied to detect the presence of repeat sequences, including forward, reverse, palindromic and complementary repeats in the chloroplast genome of S. gardenii [61]. The following parameters were used to identify repeats in REPuter: (1) Hamming distance 3, (2) minimum sequence identity of 90%, (3) and a repeat size of more than 30 bp. Phobos software v1.0.6 was employed to discover SSRs of chloroplast genome; parameters for the match, mismatch, gap and N positions were set at 1, −5, −5 and 0, respectively [62].

4.7. Phylogenetic Tree Analysis

A phylogenetic tree was constructed using 75 protein-coding genes of 19 Nolinoideae chloroplast genomes and Asparagus used as the outgroup. The 18 completed chloroplast genome sequences were downloaded from the National Center for Biotechnology Information (NCBI) Organelle Genome Resource database (Supplementary Table S5). The aligned protein-coding gene sequences were saved in PHYLogeny Inference Package (PHYLIP) format using Clustal X v2.1 [63] and phylogenetic analysis was constructed based on maximum likelihood (ML) analysis using the GTRI model by RAxML v. 7.2.6 with 1000 bootstrap replications [60].

5. Conclusions

The present study describes the complete chloroplast genome sequence of Speirantha gardenii and is the first such report for a species in Speirantha. The S. gardenii chloroplast genome (156,869 bp) is fully characterized and compared with its closely related species of Nolinoideae subfamily. Overall, the gene contents and gene arrangements are similar and highly conserved in the species of Nolinoideae subfamily. Furthermore, high sequence variation in the protein-coding and intergenic regions, repeat sequences analysis, nucleotide substitution patterns and amino acid sites under potentially positive selection in seven protein-coding genes in the chloroplast genomes of species of the Nolinoideae subfamily may be useful for developing a lineage-specific marker for genetic diversity and gene evolution studies. Besides, phylogenomic studies showed that the genera Speirantha, Rohdea, Reineckea and Convallaria are constantly clustered in the same clade suggest that these taxa are close genetic relationships to each other and highly conserved in the Nolinoideae subfamily.

Supplementary Materials

Supplementary Materials can be found at https://www.mdpi.com/2073-4395/10/9/1405/s1. Table S1: List of genes present in the chloroplast genome of Speirantha gardenii. Supplementary, Table S2: Comparison of general features of Nolinoideae chloroplast genomes, Table S3, Comparison of site models, positive selective amino acid loci and estimation of parameters for seven protein-coding genes in the four Nolinoideae species, Table S4: Comparison of site models, positive selective amino acid loci and estimation of parameters for five protein-coding genes in the Nolinoideae species, Table S5. List of chloroplast genomes used for phylogenetic analysis.

Author Contributions

S.P. and G.R. conceived and designed the experiments. G.R. performed the experiments, analyzed the data, and prepared a draft of the manuscript and figures. S.P. and G.R. modified the manuscript. All authors have read and agreed to the published version of the manuscript.

Funding

The National Research Foundation of Korea (NRF) (2019R1F1A1062102) project, Ministry of Education, the Republic of Korea, awarded to Gurusamy Raman, Department of Life Sciences, Yeungnam University.

Acknowledgments

This study was supported by the National Research Foundation of Korea (NRF) (2019R1F1A1062102) project, Ministry of Education, Republic of Korea, awarded to Gurusamy Raman, Department of Life Sciences, Yeungnam University.

Conflicts of Interest

The authors declare that they have no competing interests.

Abbreviations

LSCLarge single-copy
SSCSmall single-copy
IRsInverted repeats
CNVsCopy number variations
DOGMADual Organeller GenoMe Annotator
tRNATransfer RNA
rRNARibosomal RNA
KSSynonymous substitution
KANon-synonymous substitution
ωNonsynonymous vs. synonymous ratio
SSRSimple sequence repeats
LRTLikelihood ratio test

References

  1. Ana, M.C.; Silvana, M.S.; Konstantin, R.; Paul, M.P.; Robert, J.S.; Fernando, O.Z.; Morrone, O. Phylogeny of Nassella (Stipeae, Pooideae, Poaceae) Based on Analyses of Chloroplast and Nuclear Ribosomal DNA and Morphology. Syst. Bot. 2014, 39, 814–828. [Google Scholar] [CrossRef]
  2. Dong, W.; Xu, C.; Li, W.; Xie, X.; Lu, Y.; Liu, Y.; Jin, X.; Suo, Z. Phylogenetic Resolution in Juglans Based on Complete Chloroplast Genomes and Nuclear DNA Sequences. Front. Plant Sci. 2017, 8, 1148. [Google Scholar] [CrossRef] [Green Version]
  3. Jansen, R.K.; Cai, Z.; Raubeson, L.A.; Daniell, H.; Depamphilis, C.W.; Leebens-Mack, J.; Muller, K.F.; Guisinger-Bellian, M.; Haberle, R.C.; Hansen, A.K.; et al. Analysis of 81 genes from 64 plastid genomes resolves relationships in angiosperms and identifies genome-scale evolutionary patterns. Proc. Natl. Acad. Sci. USA 2007, 104, 19369–19374. [Google Scholar] [CrossRef] [PubMed] [Green Version]
  4. Li, P.; Zhang, S.; Li, F.; Zhang, S.; Zhang, H.; Wang, X.; Sun, R.; Bonnema, G.; Borm, T.J. A Phylogenetic Analysis of Chloroplast Genomes Elucidates the Relationships of the Six Economically Important Brassica Species Comprising the Triangle of U. Front. Plant Sci. 2017, 8, 111. [Google Scholar] [CrossRef] [PubMed] [Green Version]
  5. Raman, G.; Park, S. Analysis of the Complete Chloroplast Genome of a Medicinal Plant, Dianthus superbus var. longicalyncinus, from a Comparative Genomics Perspective. PLoS ONE 2015, 10, e0141329. [Google Scholar] [CrossRef] [Green Version]
  6. Daniell, H.; Lin, C.S.; Yu, M.; Chang, W.J. Chloroplast genomes: Diversity, evolution, and applications in genetic engineering. Genome Biol. 2016, 17, 134. [Google Scholar] [CrossRef] [Green Version]
  7. Palmer, J.D. Comparative Organization of Chloroplast Genomes. Annu. Rev. Genet. 1985, 19, 325–354. [Google Scholar] [CrossRef]
  8. Friis, E.M.; Pedersen, K.R.; Crane, P.R. Cretaceous angiosperm flowers: Innovation and evolution in plant reproduction. Palaeogeogr. Palaeoclimatol. Palaeoecol. 2006, 232, 251–293. [Google Scholar] [CrossRef]
  9. Gurusamy, R.; Lee, E.M.; Nam, G.H.; Lee, B.; Park, S. The complete chloroplast genome of monocot plant, Maianthemum dilatatum. Mitochondrial DNA Part B 2018, 3, 1185–1186. [Google Scholar] [CrossRef] [Green Version]
  10. Zhou, Y.; Wang, Y.; Shi, X.; Mao, S. The complete chloroplast genome sequence of Campylandra chinensis (Liliaceae). Mitochondrial DNA Part B 2018, 3, 780–781. [Google Scholar] [CrossRef] [Green Version]
  11. Lee, S.Y.; Zou, Y.; Liao, W.; Fan, Q. The complete chloroplast genome of a traditional medicinal and food plant, Polygonatum humile (Asparagaceae, Asparagales). Mitochondrial DNA Part B 2019, 4, 3184–3185. [Google Scholar] [CrossRef]
  12. Raman, G.; Park, S.; Lee, E.M.; Park, S. Evidence of mitochondrial DNA in the chloroplast genome of Convallaria keiskei and its subsequent evolution in the Asparagales. Sci. Rep. 2019, 9, 5028. [Google Scholar] [CrossRef] [PubMed]
  13. Sun, Z.-S.; Cao, P.-H.; Li, Y.-L.; Huang, S. Complete chloroplast genome of Reineckia carnea and its implications for the phylogenetic position within Nolinoideae (Asparagaceae). Mitochondrial DNA Part B 2019, 4, 2129–2130. [Google Scholar] [CrossRef]
  14. Du, Z.; Qian, J.; Jiang, Y.; Duan, B. The complete chloroplast genome of Polygonatum ordoratum (Mill.) Druce and its phylogenetic analysis. Mitochondrial DNA Part B 2020, 5, 1601–1602. [Google Scholar] [CrossRef]
  15. Jin, J.; Lao, J.; Zhong, C.; He, W.; Xie, J.; Hu, G.; Liu, H.; Yan, F.; Zhang, S. Complete chloroplast genome of a medicinal species Polygonatum kingianum in China (Asparagaceae, Asparagales). Mitochondrial DNA Part B 2020, 5, 959–960. [Google Scholar] [CrossRef] [Green Version]
  16. Wu, Z.; Raven, P. Flora of China (Flagellariaceae through Marantaceae); Missouri Botanical Garden Press: St. Louis, MO, USA, 2000. [Google Scholar]
  17. Curci, P.L.; De Paola, D.; Danzi, D.; Vendramin, G.G.; Sonnante, G. Complete chloroplast genome of the multifunctional crop globe artichoke and comparison with other Asteraceae. PLoS ONE 2015, 10, e0120589. [Google Scholar] [CrossRef]
  18. Raman, G.; Park, V.; Kwak, M.; Lee, B.; Park, S. Characterization of the complete chloroplast genome of Arabis stellari and comparisons with related species. PLoS ONE 2017, 12, e0183197. [Google Scholar] [CrossRef]
  19. Yang, J.B.; Yang, S.X.; Li, H.T.; Yang, J.; Li, D.Z. Comparative chloroplast genomes of Camellia species. PLoS ONE 2013, 8, e73053. [Google Scholar] [CrossRef] [Green Version]
  20. Shi, H.; Yang, M.; Mo, C.; Xie, W.; Liu, C.; Wu, B.; Ma, X. Complete chloroplast genomes of two Siraitia Merrill species: Comparative analysis, positive selection and novel molecular marker development. PLoS ONE 2019, 14, e0226865. [Google Scholar] [CrossRef]
  21. Tomoko, O. Synonymous and nonsynonymous substitutions in mammalian genes and the nearly neutral theory. J. Mol. Evol. 1995, 40, 56–63. [Google Scholar] [CrossRef]
  22. Hiratsuka, J.; Shimada, H.; Whittier, R.; Ishibashi, T.; Sakamoto, M.; Mori, M.; Kondo, C.; Honji, Y.; Sun, C.R.; Meng, B.Y. The complete sequence of the rice (Oryza sativa) chloroplast genome: Intermolecular recombination between distinct tRNA genes accounts for a major plastid DNA inversion during the evolution of the cereals. Mol. Gen. Genet. 1989, 217, 185–194. [Google Scholar] [CrossRef] [PubMed]
  23. Maier, R.M.; Neckermann, K.; Igloi, G.L.; Kossel, H. Complete sequence of the maize chloroplast genome: Gene content, hotspots of divergence and fine tuning of genetic information by transcript editing. J. Mol. Biol. 1995, 251, 614–628. [Google Scholar] [CrossRef] [PubMed]
  24. Saski, C.; Lee, S.B.; Fjellheim, S.; Guda, C.; Jansen, R.K.; Luo, H.; Tomkins, J.; Rognli, O.A.; Daniell, H.; Clarke, J.L. Complete chloroplast genome sequences of Hordeum vulgare, Sorghum bicolor and Agrostis stolonifera, and comparative analyses with other grass genomes. Theor. Appl. Genet. 2007, 115, 591. [Google Scholar] [CrossRef] [Green Version]
  25. Millen, R.S.; Olmstead, R.G.; Adams, K.L.; Palmer, J.D.; Lao, N.T.; Heggie, L.; Kavanagh, T.A.; Hibberd, J.M.; Gray, J.C.; Morden, C.W.; et al. Many parallel losses of infA from chloroplast DNA during angiosperm evolution with multiple independent transfers to the nucleus. Plant Cell 2001, 13, 645–658. [Google Scholar] [CrossRef] [PubMed] [Green Version]
  26. Gao, F.; Chen, C.; Arab, D.A.; Du, Z.; He, Y.; Ho, S.Y.W. EasyCodeML: A visual tool for analysis of selection using CodeML. Ecol. Evol. 2019, 9, 3891–3898. [Google Scholar] [CrossRef] [PubMed] [Green Version]
  27. Hao, D.C.; Chen, S.L.; Xiao, P.G. Molecular evolution and positive Darwinian selection of the chloroplast maturase matK. J. Plant Res. 2010, 123, 241–247. [Google Scholar] [CrossRef]
  28. Jiang, P.; Shi, F.X.; Li, M.R.; Liu, B.; Wen, J.; Xiao, H.X.; Li, L.F. Positive Selection Driving Cytoplasmic Genome Evolution of the Medicinally Important Ginseng Plant Genus Panax. Front. Plant Sci. 2018, 9, 359. [Google Scholar] [CrossRef]
  29. Zhang, Z.; An, M.; Miao, J.; Gu, Z.; Liu, C.; Zhong, B. The Antarctic sea ice alga Chlamydomonas sp. ICE-L provides insights into adaptive patterns of chloroplast evolution. BMC Plant Biol. 2018, 18, 53. [Google Scholar] [CrossRef] [Green Version]
  30. Heyduk, K.; Moreno-Villena, J.J.; Gilman, I.S.; Christin, P.A.; Edwards, E.J. The genetics of convergent evolution: Insights from plant photosynthesis. Nat. Rev. Genet. 2019, 20, 485–493. [Google Scholar] [CrossRef]
  31. Li, C.J.; Wang, R.N.; Li, D.Z. Comparative analysis of plastid genomes within the Campanulaceae and phylogenetic implications. PLoS ONE 2020, 15, e0233167. [Google Scholar] [CrossRef]
  32. Mrazek, J. Analysis of distribution indicates diverse functions of simple sequence repeats in Mycoplasma genomes. Mol. Biol. Evol. 2006, 23, 1370–1385. [Google Scholar] [CrossRef] [PubMed] [Green Version]
  33. Pauwels, M.; Vekemans, X.; Gode, C.; Frerot, H.; Castric, V.; Saumitou-Laprade, P. Nuclear and chloroplast DNA phylogeography reveals vicariance among European populations of the model species for the study of metal tolerance, Arabidopsis halleri (Brassicaceae). New Phytol. 2012, 193, 916–928. [Google Scholar] [CrossRef] [PubMed]
  34. Provan, J.; Powell, W.; Hollingsworth, P.M. Chloroplast microsatellites: New tools for studies in plant ecology and evolution. Trends Ecol. Evol. 2001, 16, 142–147. [Google Scholar] [CrossRef]
  35. Cao, J.L.; Jiang, D.; Zhao, Z.Y.; Yuan, S.B.; Zhang, Y.J.; Zhang, T.; Zhong, W.H.; Yuan, Q.J.; Huang, L.Q. Development of Chloroplast Genomic Resources in Chinese Yam (Dioscorea polystachya). Biomed. Res. Int. 2018, 2018, 11. [Google Scholar] [CrossRef]
  36. Curci, P.L.; De Paola, D.; Sonnante, G. Development of chloroplast genomic resources for Cynara. Mol. Ecol. Resour. 2016, 16, 562–573. [Google Scholar] [CrossRef]
  37. Dong, W.P.; Liu, H.; Xu, C.; Zuo, Y.J.; Chen, Z.J.; Zhou, S.L. A chloroplast genomic strategy for designing taxon specific DNA mini-barcodes: A case study on ginsengs. BMC Genet. 2014, 15, 1–8. [Google Scholar] [CrossRef] [Green Version]
  38. Li, B.; Lin, F.R.; Huang, P.; Guo, W.Y.; Zheng, Y.Q. Development of nuclear SSR and chloroplast genome markers in diverse Liriodendron chinense germplasm based on low-coverage whole genome sequencing. Biol. Res. 2020, 53, 1–12. [Google Scholar] [CrossRef] [PubMed]
  39. Tangphatsornruang, S.; Uthaipaisanwong, P.; Sangsrakru, D.; Chanprasert, J.; Yoocha, T.; Jomchai, N.; Tragoonrung, S. Characterization of the complete chloroplast genome of Hevea brasiliensis reveals genome rearrangement, RNA editing sites and phylogenetic relationships. Gene 2011, 475, 104–112. [Google Scholar] [CrossRef]
  40. Wang, L.; Wuyun, T.-N.; Du, H.; Wang, D.; Cao, D. Complete chloroplast genome sequences of Eucommia ulmoides: Genome structure and evolution. Tree Genet. Genomes 2016, 12, 12. [Google Scholar] [CrossRef]
  41. Carbonell-Caballero, J.; Alonso, R.; Ibañez, V.; Terol, J.; Talon, M.; Dopazo, J. A Phylogenetic Analysis of 34 Chloroplast Genomes Elucidates the Relationships between Wild and Domestic Species within the Genus Citrus. Mol. Biol. Evol. 2015, 32, 2015–2035. [Google Scholar] [CrossRef] [Green Version]
  42. Henriquez, C.L.; Arias, T.; Pires, J.C.; Croat, T.B.; Schaal, B.A. Phylogenomics of the plant family Araceae. Mol. Phylogenet. Evol. 2014, 75, 91–102. [Google Scholar] [CrossRef] [PubMed]
  43. Xu, J.Y.; Shen, X.F.; Liao, B.S.; Xu, J.; Hou, D.Y. Comparing and phylogenetic analysis chloroplast genome of three Achyranthes species. Sci. Rep. 2020, 10, 1–13. [Google Scholar]
  44. Satish, K.V.; Pasha, S.V.; Krishna, P.H.; Reddy, C.S. Achyranthes coynei Santapau (Amaranthaceae): An Endemic and Threatened Species from Kachchh Desert, India. Natl. Acad. Sci. Lett. 2015, 38, 281–282. [Google Scholar]
  45. Schwartz, L.M.; Gibson, D.J.; Young, B.G. Life history of Achyranthes japonica (Amaranthaceae): An invasive species in southern Illinois. J. Torrey Bot. Soc. 2016, 143, 93–102. [Google Scholar]
  46. Moore, M.J.; Bell, C.D.; Soltis, P.S.; Soltis, D.E. Using plastid genome-scale data to resolve enigmatic relationships among basal angiosperms. Proc. Natl. Acad. Sci. USA 2007, 104, 19363–19368. [Google Scholar]
  47. Floden, A.; Schilling, E.E. Using phylogenomics to reconstruct phylogenetic relationships within tribe Polygonateae (Asparagaceae), with a special focus on Polygonatum. Mol. Phylogenet. Evol. 2018, 129, 202–213. [Google Scholar]
  48. Yamashita, J.; Tamura, M.N. Phylogenetic analyses and chromosome evolution in Convallarieae (Ruscaceae sensu lato), with some taxonomic treatments. J. Plant Res. 2004, 117, 363–370. [Google Scholar] [CrossRef]
  49. Meng, Y.; Nie, Z.L.; Deng, T.; Wen, J.; Yang, Y.P. Phylogenetics and evolution of phyllotaxy in the Solomon’s seal genus Polygonatum (Asparagaceae: Polygonateae). Bot. J. Linn. Soc. 2014, 176, 435–451. [Google Scholar]
  50. Chen, S.C.; Kim, D.K.; Chase, M.W.; Kim, J.H. Networks in a Large-Scale Phylogenetic Analysis: Reconstructing Evolutionary History of Asparagales (Lilianae) Based on Four Plastid Genes. PLoS ONE 2013, 8, e59472. [Google Scholar]
  51. Andrews, S. FASTQC: A Quality Control Tool for High Throughput Sequence Data; Elsevier: Amsterdam, The Netherland, 2010. [Google Scholar]
  52. Bolger, A.M.; Lohse, M.; Usadel, B. Trimmomatic: A flexible trimmer for Illumina sequence data. Bioinformatics 2014, 30, 2114–2120. [Google Scholar] [CrossRef] [Green Version]
  53. Nurk, S.; Bankevich, A.; Antipov, D.; Gurevich, A.A.; Korobeynikov, A.; Lapidus, A.; Prjibelski, A.D.; Pyshkin, A.; Sirotkin, A.; Sirotkin, Y.; et al. Assembling single-cell genomes and mini-metagenomes from chimeric MDA products. J. Comput. Biol. 2013, 20, 714–737. [Google Scholar] [CrossRef] [Green Version]
  54. Wyman, S.K.; Jansen, R.K.; Boore, J.L. Automatic annotation of organellar genomes with DOGMA. Bioinformatics 2004, 20, 3252–3255. [Google Scholar] [CrossRef] [PubMed] [Green Version]
  55. Schattner, P.; Brooks, A.N.; Lowe, T.M. The tRNAscan-SE, snoscan and snoGPS web servers for the detection of tRNAs and snoRNAs. Nucleic Acids Res. 2005, 33, W686–W689. [Google Scholar] [CrossRef] [PubMed]
  56. Lohse, M.; Drechsel, O.; Bock, R. OrganellarGenomeDRAW (OGDRAW): A tool for the easy generation of high-quality custom graphical maps of plastid and mitochondrial genomes. Curr. Genet. 2007, 52, 267–274. [Google Scholar] [CrossRef] [PubMed]
  57. Frazer, K.A.; Pachter, L.; Poliakov, A.; Rubin, E.M.; Dubchak, I. VISTA: Computational tools for comparative genomics. Nucleic Acids Res. 2004, 32, W273–W279. [Google Scholar] [CrossRef] [PubMed]
  58. Librado, P.; Rozas, J. DnaSP v5: A software for comprehensive analysis of DNA polymorphism data. Bioinformatics 2009, 25, 1451–1452. [Google Scholar] [CrossRef] [PubMed] [Green Version]
  59. Katoh, K.; Standley, D.M. MAFFT multiple sequence alignment software version 7: Improvements in performance and usability. Mol. Biol. Evol. 2013, 30, 772–780. [Google Scholar] [CrossRef] [Green Version]
  60. Stamatakis, A.; Hoover, P.; Rougemont, J. A rapid bootstrap algorithm for the RAxML Web servers. Syst. Biol. 2008, 57, 758–771. [Google Scholar] [CrossRef]
  61. Kurtz, S.; Choudhuri, J.V.; Ohlebusch, E.; Schleiermacher, C.; Stoye, J.; Giegerich, R. REPuter: The manifold applications of repeat analysis on a genomic scale. Nucleic Acids Res. 2001, 29, 4633–4642. [Google Scholar] [CrossRef] [Green Version]
  62. Mayer, C.; Leese, F.; Tollrian, R. Genome-wide analysis of tandem repeats in Daphnia pulex—A comparative approach. BMC Genom. 2010, 11, 277. [Google Scholar] [CrossRef] [Green Version]
  63. Larkin, M.A.; Blackshields, G.; Brown, N.P.; Chenna, R.; McGettigan, P.A.; McWilliam, H.; Valentin, F.; Wallace, I.M.; Wilm, A.; Lopez, R.; et al. Clustal W and Clustal X version 2.0. Bioinformatics 2007, 23, 2947–2948. [Google Scholar] [CrossRef] [PubMed] [Green Version]
Figure 1. Gene map of Speirantha gardenii. Genes lying outside the outer circle are transcribed in a counter-clockwise direction, and genes inside this circle are transcribed in a clockwise direction. The colored bars indicate known protein-coding genes, transfer RNA genes, and ribosomal RNA genes. The dashed, dark grey area in the inner circle denotes GC content, and the light grey area indicates genome AT content. LSC, large single-copy; SSC, small single-copy; IR, inverted repeat.
Agronomy 10 01405 g001
Figure 2. Comparison of the large single-copy (LSC), small single-copy (SSC) and inverted repeat (IR) border regions of four Nolinoideae chloroplast genomes. ψ indicates a pseudogene. The figure is not drawn to scale.
Agronomy 10 01405 g002
Figure 3. Sequence alignment of four Nolinoideae chloroplast genomes performed using the mVISTA program with Speirantha gardenii as a reference. The top grey arrow shows genes in order (transcriptional direction) and the position of each gene. A 70% cut-off was used for the plots. The y-axis indicates a percent identity of between 50% and 100%, and the red and blue areas indicate intergenic and genic regions, respectively.
Agronomy 10 01405 g003
Figure 4. The ratio of non-synonymous (KA) to synonymous (KS) substitutions of 79 protein-coding genes of four species of Nolinoideae.
Agronomy 10 01405 g004
Figure 5. Comparison of infA and rpl36 gene and their intergenic regions of four Nolinoideae species.
Agronomy 10 01405 g005
Figure 6. The distribution of different repeat types in the Speirantha gardenii chloroplast genome. (A) The number of different types of repeats. F—forward repeats; R—reverse repeats; P—palindromic repeats; C—complement repeats (B). The length and the total number of repeat sequences present in the chloroplast genome.
Agronomy 10 01405 g006
Figure 7. The presence of simple sequence repeats (SSRs) in the Speirantha gardenii chloroplast genome. (A) Distribution of different types of SSRs; (B) Presence of SSRs in the LSC, SSC, and IR regions; (C) Presence of SSRs in intergenic spacers, protein-coding regions, and intron regions.
Agronomy 10 01405 g007
Figure 8. Molecular phylogenetic tree based on 75 protein-coding genes of 19 Asparagaceae chloroplast genomes. Asparagus set as the outgroup. The tree was constructed by maximum likelihood (ML) analysis of the conserved regions using the RAxML program and the general time-reversible invariant-sites (GTRI) nucleotide substitution model. The stability of each tree node was tested by bootstrap analysis with 1000 replicates. Bootstrap values are indicated on the branches, and the branch length reflects the estimated number of substitutions per 1000 sites. The Puerto Rico rectangular box indicates that the infA gene is either a pseudogene or deleted in their respective chloroplast genome.
Agronomy 10 01405 g008
Table 1. The characteristic feature of the Speirantha gardenii chloroplast genome.
Sequence Region S. gardenii
Total chloroplast genome size (bp) 156,869
LSC length (bp) 85,368
SSC length (bp) 18,627
IR length (bp) 26,437
Total number of genes 136
Protein-coding genes 90
tRNA genes 38
rRNA genes 8
Genes duplicated by IR 21
Genes with introns 17
GC contentTotal (%)37.6
LSC (%)35.6
SSC (%)31.5
IR (%)43.0
CDS (%)38.1
rRNA (%)55.3
tRNA (%)53.2
All genes (%)39.8
Protein-coding genes (%bp) 50.13
All genes (%bp) 71.42
Non-coding regions (%) 28.58
Table 2. Comparison of likelihood ratio test (LRT) statistics of positive selection models against their null models (2ΔLnL) and positive selective amino acid loci for four Nolinoideae species.
Protein-Coding GenesComparison between Models2ΔLnLd.f.p-ValuePositive Sites (M7 vs. M8)
ccsAM0 vs. M304181 N 0.642, 125 S 0.642, 223 S 0.642, 280 S 0.642, 292 I 0.636
M1 vs. M2A021
M7 vs. M80.00000220.999999
M8a vs. M80.00152410.968859739
infAM0 vs. M315.84536640.00323383632 L 0.759, 56 I 0.881, 57 G 0.966 *, 58 M 0.965 *, 59 Q 0.737, 60 L 0.961 *
M1 vs. M2A11.35017620.003430367
M7 vs. M811.35255420.003426291
M8a vs. M811.35016610.000754412
ndhFM0 vs. M312.43587440.01438789867 F 0.543, 281 F 0.568, 472 Y 0.581, 486 E 0.606, 505 N 0.571, 560 H 0.583, 574 L 0.617, 596 L 0.665, 614 S 0.616, 636 G 0.632, 675 L 0.580, 680 Q 0.628, 728 F 0.568, 732 L 0.963 *, 734 F 0.931
M1 vs. M2A9.77172620.007552603
M7 vs. M88.53566220.014012143
M8a vs. M88.52995610.003493481
rpl20M0 vs. M304143 L 0.620, 80 R 0.612, 116 M 0.612, 117 K 0.603
M1 vs. M2A021
M7 vs. M80.0001320.999935002
M8a vs. M80.0000410.994953769
rps2M0 vs. M324.06907240.00007736848 T 0.838, 59 D 0.839, 91 A 0.838, 160 E 0.840, 199 L 0.850, 237—0.998 **
M1 vs. M2A23.73508820.000007014
M7 vs. M815.31682220.000472057
M8a vs. M813.71529010.000212716
rps3M0 vs. M317.51452840.00153495828 N 0.937, 30 S 0.599, 68 Q 0.584, 105 F 0.608, 106 H 0.580, 221—0.988 *
M1 vs. M2A12.63152220.00180759
M7 vs. M814.59367220.00067768
M8a vs. M813.50593810.00023781
ycf1M0 vs. M326.08425240.000030431267 Y 0.939, 271 Y 0.517, 290 D 0.520, 296 Y 0.995 **, 407 L 0.523, 438 R 0.536, 447 S 0.503, 491 T 0.545, 507 Q 0.503, 558 K 0.920, 601 I 0.539, 804 L 0.523, 864 I 0.503, 921 F 0.535, 953 R 0.936, 1068 S 0.558, 1082 Q 0.927, 1096 S 0.516, 1108 R 0.935, 1162 R 0.510, 1255 L 0.559, 1340 L 0.926, 1370 Q 0.524, 1373 Q 0.503, 1375 F 0.515, 1484 Q 0.509, 1499 I 0.523, 1526 F 0.541, 1543 L 0.505, 1639 Q 0.530, 1671 H 0.925, 1672 F 0.515
M1 vs. M2A19.80683620.000050003
M7 vs. M819.22831620.000066777
M8a vs. M818.52804510.000016742
Positively selected sites (* p > 95%; ** p > 99%).
Table 3. Comparison of likelihood ratio test (LRT) statistics of positive selection models against their null models (2ΔLnL) and positive selective amino acid loci for across all Nolinoideae species.
Protein-Coding GenesComparison between Models2ΔLnLd.f.p-ValuePositive Sites (M7 vs. M8)
ccsAM0 vs. M325.07092440.000048685170 D 0.989 *, 175 R 0.969 *, 178 F 0.764, 184 F 0.978 *, 186 D 0.871, 206 R 0.868, 278 S 0.582
M1 vs. M2A13.32423420.001278437
M7 vs. M813.68779220.001065942
M8a vs. M813.31902210.000262727
ndhFM0 vs. M374.5898644077 V 0.814, 463 K 0.804, 486 A 0.610, 513 G 0.702, 514 R 0.638, 523 H 0.828, 531 T 0.942, 546 V 0.979 *, 560 N 0.998 **, 584 P 0.726, 586 F 0.947, 588 G 0.550, 590 P 0.961 *, 596 L 0.698, 636 G 0.975 *, 638 P 0.850, 675 L 0.637, 680 Q 0.871, 728 F 0.830, 729 F 0.720, 732 L 0.973 *, 733 F 0.627
M1 vs. M2A17.81004420.000135706
M7 vs. M818.04123620.000120891
M8a vs. M817.82747810.000024187
rpl20M0 vs. M30.40731640.9818735576 Y 0.698
M1 vs. M2A0.01687420.991598492
M7 vs. M80.06773220.966701034
M8a vs. M80.0173510.895206241
rps2M0 vs. M3108.223694032 A 0.524, 131 N 0.504, 199 L 0.612, 237—1.000 **
M1 vs. M2A108.2237620
M7 vs. M8108.23742420
M8a vs. M8108.24561810
rps3M0 vs. M32.18761440.7012975230 S 0.571, 86 E 0.568
M1 vs. M2A021
M7 vs. M80.00000420.999998
M8a vs. M80.02585210.87226229
Positively selected sites (* p > 95%; ** p > 99%).

