Article

Volatile Profiling of Fifteen Willow Species and Hybrids and Their Responses to Giant Willow Aphid Infestation

1
Wildlife and Ecology Group, School of Agriculture and Environment, Massey University, Private Bag 11222, Palmerston North 4410, New Zealand
2
Plant & Food Research, Fitzherbert Science Centre, Batchelar Road, Palmerston North 4410, New Zealand
*
Author to whom correspondence should be addressed.
Agronomy 2020, 10(9), 1404; https://doi.org/10.3390/agronomy10091404
Submission received: 6 August 2020 / Revised: 10 September 2020 / Accepted: 14 September 2020 / Published: 16 September 2020
(This article belongs to the Special Issue Semiochemicals in Pest Management)

Abstract

:
The giant willow aphid (Tuberolachnus salignus) is a large stem-feeding insect which forms dense colonies on infested plants. Since T. salignus is a new invasive species in New Zealand, we have a poor understanding of the plant chemical responses to aphid infestation. This study aimed to characterize the volatile organic compounds (VOCs) emissions of fifteen different willow species and hybrids growing in New Zealand, and to evaluate changes in response to T. salignus attack in a field trial. Volatiles were collected using a headspace sampling technique and analysed using gas chromatography-mass spectrometry (GC-MS). We found high variability in the volatile profiles of different species and hybrids, with (Z)-3-hexenyl acetate and (E)-β-ocimene being the only common components to all blends. Taxonomically related plants showed an overlapping pattern of VOC emission, and there seemed to be a clear separation between shrub and tree willows. Responses to aphid infestation were variable, with only four species/hybrids showing changes in their total VOC emission, or that of at least one class of VOCs. A weak positive correlation between aphid population estimates and VOC emissions suggests that responses are species-specific and not infestation-dependent. These results reveal useful information about the interaction between T. salignus and its potential host plants for biological control and pest management purposes.

1. Introduction

Plants naturally release a wide array of volatile organic compounds (VOCs) into the environment to perform various ecological and physiological processes [1]. Chemically, VOCs are low molecular weight lipophilic molecules, consisting of terpenoids, benzenoids, green leaf volatiles (GLVs), fatty acid and amino acid derivatives [2]. The production and release of these VOCs are highly responsive to biotic and abiotic factors, making them an excellent source of information for surrounding organisms [3,4]. VOCs mediate multiple ecological interactions: they can repel herbivores [5,6], attract the natural enemies of herbivores (predators and parasitoids), and lure pollinators and seed dispersers, which are key elements to the plant’s defense and reproduction [7,8,9]. However, VOC can also enhance the attractiveness of plants to some herbivores, harming the emitting plants [10]. Plants also release VOCs to protect themselves from environmental stress, such as heat or UV-radiation [11,12].
A variety of factors are known to influence both the quality and quantity of VOCs emitted by plants [13]. Among them, the plant species is a determining factor, since some biosynthetic pathways are taxon-specific [14,15]. As VOC emission quantitively and qualitatively differs from one species to another, volatile blends (scents) are good indicators of a plant’s identity and of evolutionary relationships among plant groups [4]. Some VOCs are released only from specific plant species, or plant groups, while others are ubiquitous to all plant species [16]. Within the same plant species, VOCs emission can vary within species, and with the phenological state, age and sex of the plant [17,18,19,20].
Although plants constitutively emit VOCs, both quantitative and qualitative changes in VOCs blends are detected when plants are attacked by insect herbivores [21]. These herbivore-induced plant volatiles (HIPVs) mainly consist of GLVs, aromatics and terpenoids [22]. The HIPV emission is a dynamic process between the host plant and herbivorous insects [23], where the abundance and identity of the attacker influences the responses to herbivore attack [24]. The feeding mode of the herbivore appears to play a key role in regulating the plant’s responses, activating different signaling pathways [25]. Previous studies suggest that phloem feeders induce less pronounced changes in the volatile emission of their host plants than chewing insects [26,27].
Willow plants are known to release various VOCs, consisting of acetaldehydes, acetones, acetic acids, isoprenes, methanols, methyl ethyl ketones, methyl vinyl ketones and monoterpenes [28,29]. These emissions are species-specific [30], have been related to both direct and indirect plant defenses [31], and play an important role in host selection by aphids [32] and other insects [33]. As willows possess different growth forms [34], VOC blends and response to herbivore attack can differ between tree and shrub types.
Willows (Salix spp.) are known for their high genetic diversity encompassing more than 400 wild and cultivated species and hybrids all over the world [35]. New Zealand (NZ) currently has 59 species and hybrids [36]. Some of them are widely planted in NZ for biomass production, soil conservation on pastoral hill country and river banks, and as sources of spring pollen and nectar for honey bees [37,38,39]. Willows are now being infested by the giant willow aphid, Tuberolachnus salignus Gmelin (Hemiptera: Aphididae), a stem-feeding insect that was first reported in NZ in December 2013 [40]. Aphid infestation reduces the amount of photosynthetic storage in willow roots and stems, leading to changes in plant performance and growth [41]. Long-term sustainable management solutions are needed to reduce the impact of aphid infestation, such as the selection of resistant willow species or hybrids for planting [42]. A key aspect for selection is a better understanding of the aphid interaction with its host plant, including the plant’s production and emission of volatile organic compounds (VOCs) in response to herbivore attack.
Some studies have explored the role of willow VOCs in host selection by herbivores, such as the willow sawfly (Nematus oligospilus) and willow leaf beetles (Phratora spp. and Plagiodera spp.) [30,43,44,45]. However, there is scarce information about willow responses to attacks by phloem-feeding herbivores [46]. Therefore, in this study, we explored the intra-genus (Salix) variation in VOCs from fifteen willow species and hybrids, and changes in VOCs emissions in response to infestation by T. salignus. We expect these results will shed some light on the aphid–plant interaction, and inform pest management decisions for successful willow growing.

2. Materials and Methods

2.1. Study Site and Plant Material

This study was conducted in a willow field trial at the Orchard Block, Plant Growth Unit, Massey University, NZ (40°22′41.70″ S, 175°36′30.67″ E). The field trial was set up to investigate the interactions of the giant willow aphid with its host plants and the environment. Fifteen willow species and hybrids, from different geographical origins [36], were grown in three blocks of paired rows, with the position of each species being random within each paired row. Twelve ramets (an individual of plant species, vegetatively reproduced from a single parent plant) of each species or hybrid were planted within each row. Within each block, one row was randomly selected as a control (aphid exclusion), while the adjacent row was aphid-infested. Information on the willow species and hybrids, and the field trial layout are provided in Table 1 and Table S1.
The willow field trial was planted using stem cuttings in June 2017, with 0.4 m spacing between cuttings within the rows, and 4 m spacing between rows. The willow plants in the control rows were inspected for colonising aphids on a weekly basis, and any aphids found were removed manually. Mavrik® insecticide (Nelson, NZ) was applied on 28 February 2018 and 17 January 2019, when manual control was impractical due to high population densities of T. salignus.

2.2. Aphid Inoculation
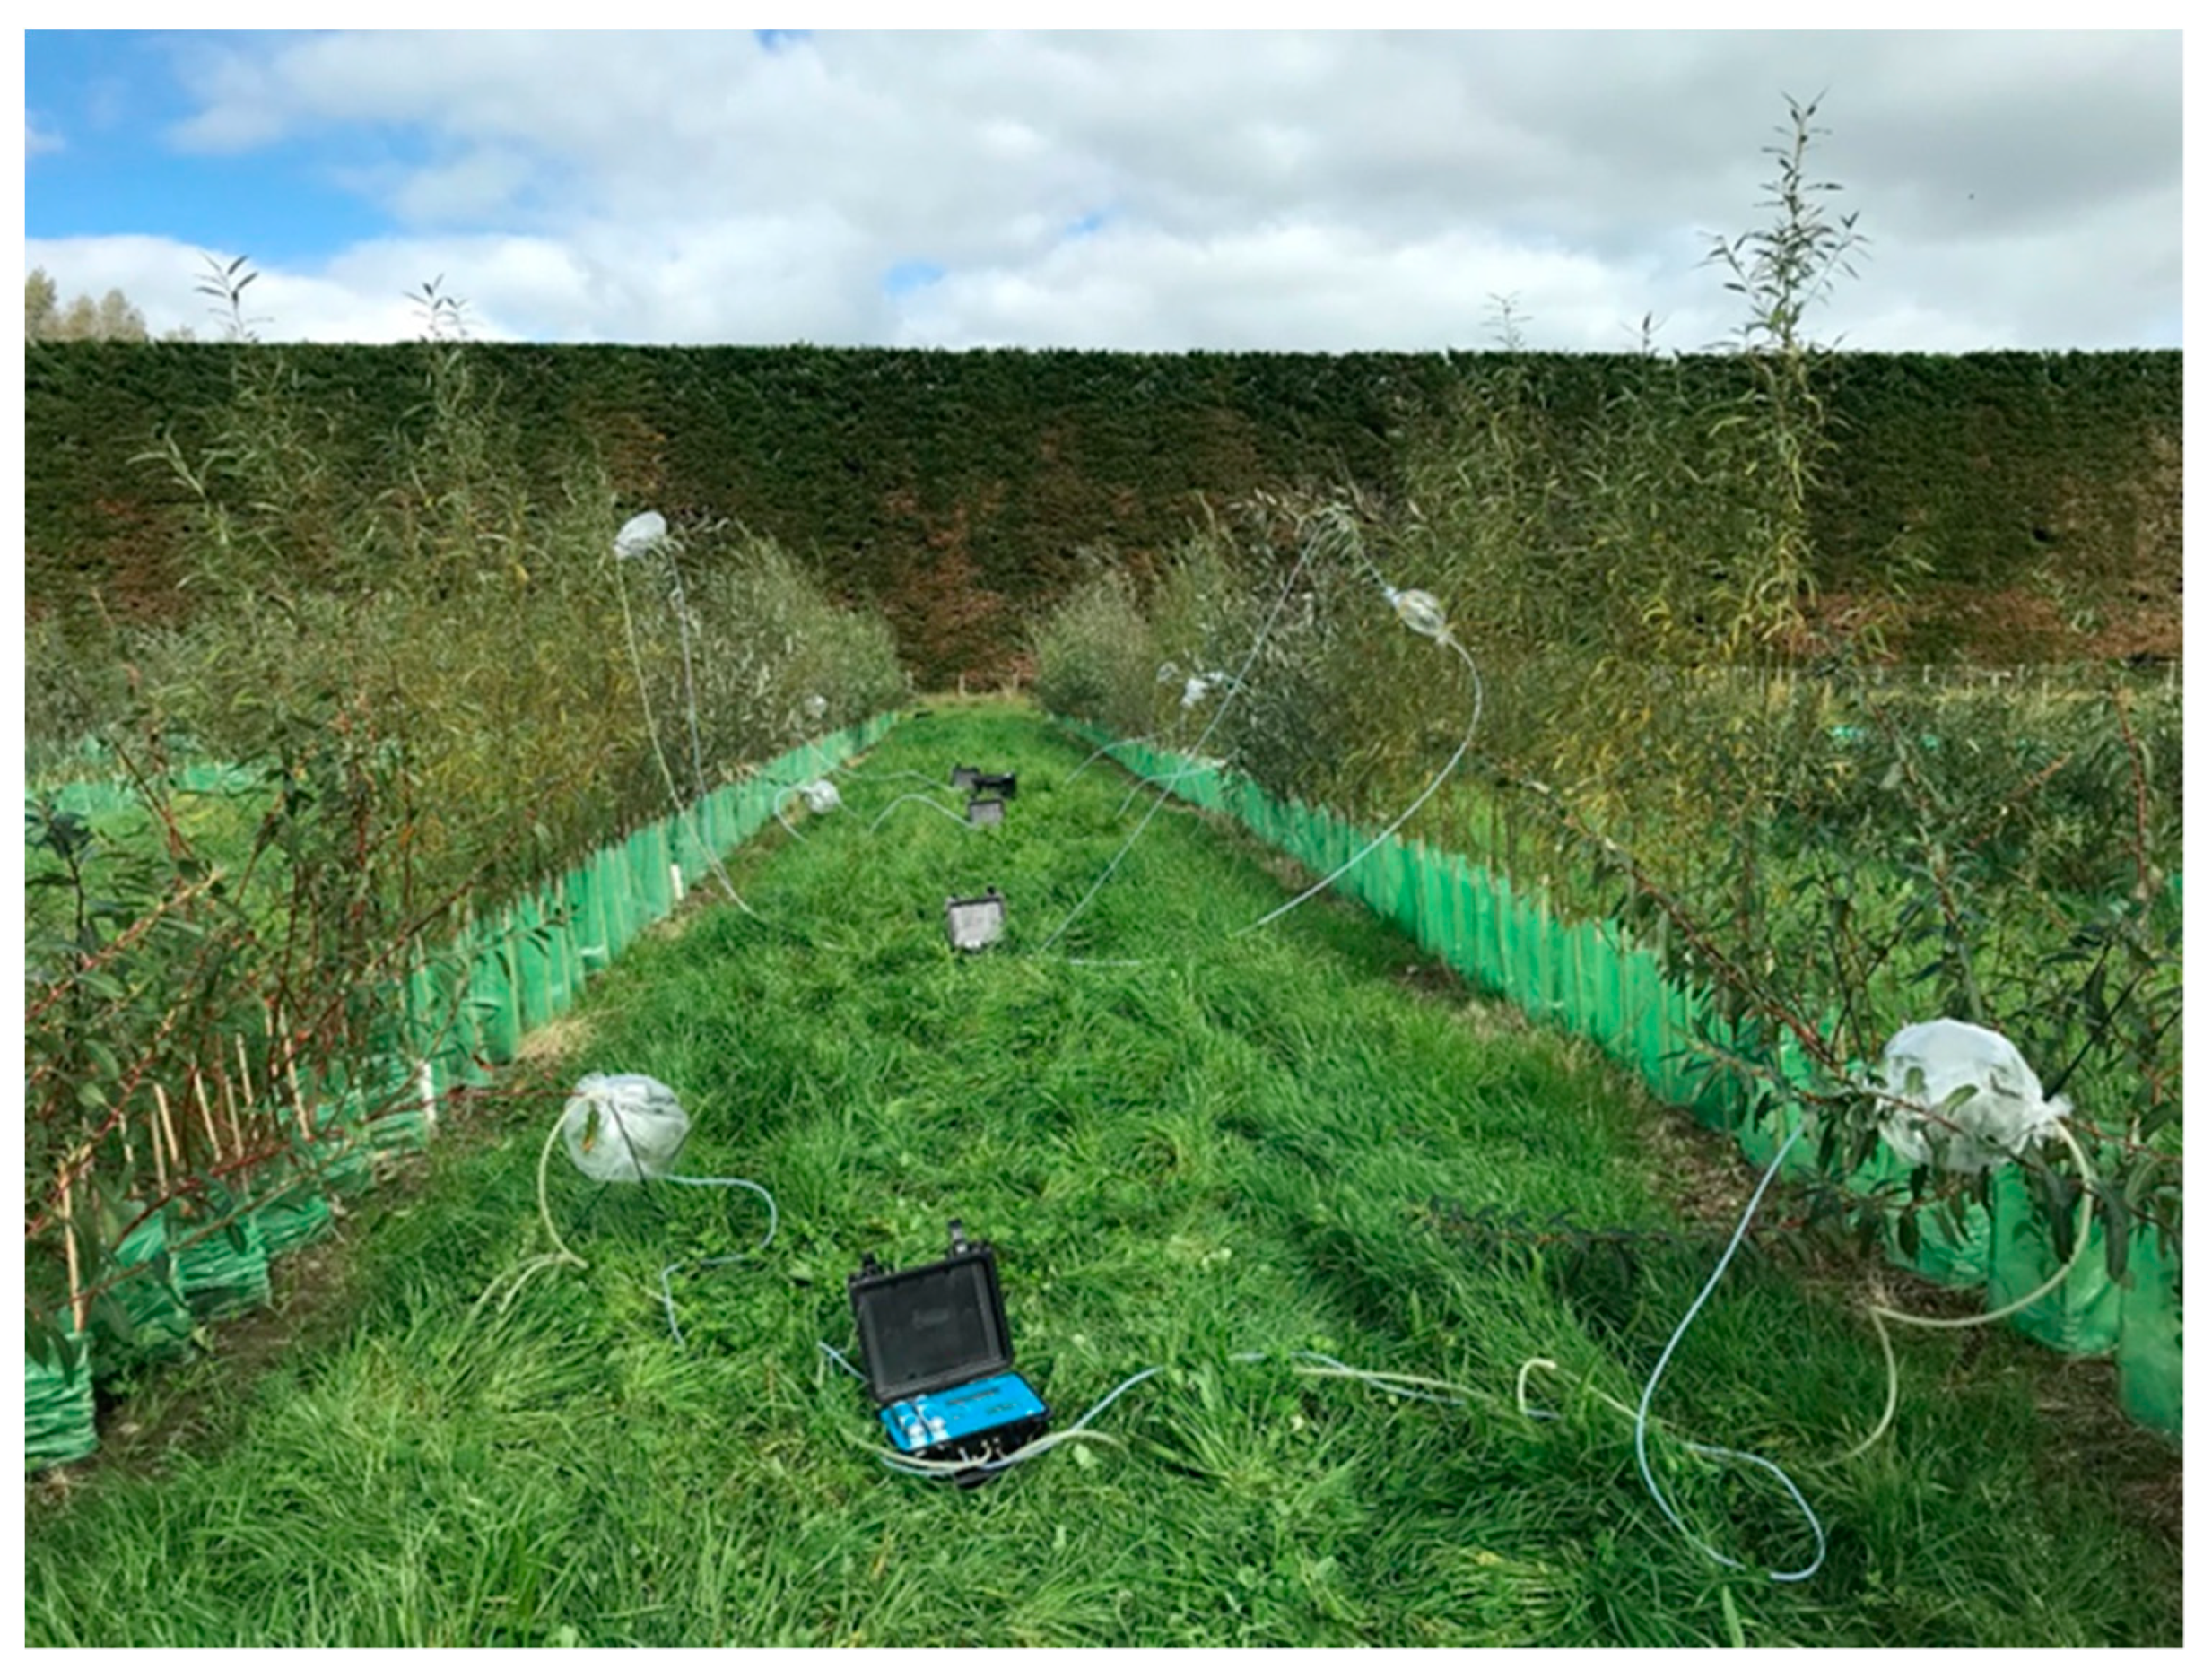
Willow plants in the aphid-infested rows were inoculated with five adult aphids per plant on 25–27 January 2018 and 6–7 December 2019. Additional inoculations with ten adult aphids per plant were done on 13–14 February 2018 and 30 January 2019. The aphid population per ramet of each sampled plant was quantified immediately before VOC collection using a visual scale from zero to six, with 0 = less than five aphids, 1 = 2 to 20 aphids, 2 = 20 to 50 aphids, 3 = 50 to 100 aphids, 4 = 100 to 300 aphids, 5 = 300 to 600 aphids, and 6 = 600 aphids or more per plant, as described by Collins [47] with slight modification.

2.3. VOCs Sampling

VOCs from willow branches were collected using the push-pull headspace sampling method as described in Effah, et al. [48]. Among the twelve plants in the row plots of each species or hybrid, one of the middle ramets (plants 5, 6 or 7) per plot was chosen to ensure that the VOCs collected were released from that treatment, without receiving VOCs from different neighboring plants, for a total of six plants per species. Willow branches of a suitable size, without visible sign of damage by insects and pathogens, were selected and enclosed in oven cooking bags (Glad®, Melbourne, Australia). One inlet and one outlet tube were fastened with cable binders at each end of the bag. The portable volatile assay system (PVAS22 pump, VAS Rensselaer NY) was used to circulate carbon-filtered air through the bag (Figure 1). Incoming air was pumped at 1.70 L/min and outgoing air was pulled at 1.20 L/min creating a slight overpressure to avoid contaminants from entering the bag. The VOCs emitted from the willow foliage were trapped in Haysep-Q filters attached to the outlet (pull) tubes. The pump ran for two hours, and then the filters were removed and individually wrapped with labelled pieces of aluminum foil, and stored in a cooler box to prevent contamination and evaporation of the collected volatiles. The willow branches were cut just below the bags, and the oven-dried weight of the branches was measured after drying at 60 °C for 72 h; therefore, volatiles measured are presented in nanograms per dry weight (g) per hour (ng·g·DW−1·h−1). Negative controls were also included by taking air samples from empty bags to exclude potential contaminants.
The first VOC sampling was performed on 17–23 January 2018, to characterize the willow VOCs (n = 6 branches/species or hybrid, 90 in total) before giant willow aphid inoculation. To estimate the effect of T. salignus on the VOC emissions of the willow plants, second VOC sampling was done shortly after aphid inoculation from both the control and aphid-infested plants on 15–17 March 2019.

2.4. Gas Chromatography–Mass Spectrometry (GC-MS) Analysis

The volatile compounds in the filters were eluted using a solvent solution with an internal standard (200 µL hexane with 10 ng/mL of nonyl acetate) into gas chromatography-mass spectrometry (GC-MS) vials and then stored in a −80 °C freezer before analysis. The willow volatiles were separated and identified using the GC-2010 Plus Gas Chromatograph (Shimadzu, Japan) coupled to the AOC-20 I Auto-injector, QP2010 SE- gas chromatograph-mass spectrophotometer, and TG-5MS column (30 m × 250 μm × 0.25 μm). Helium (He) was used as a carrier gas with the flow rate of 0.5 mL/min into split mode (10:1). The injector port and detector were set up at 250 and 230 °C, respectively. The oven temperature was initially held at 50 °C for 3 min, then increased by 5°C/min to 95 °C, and then ramped to 240 °C at 15°C/min, where it was maintained for three minutes. VOCs were tentatively identified using the NIST (National Institute of Standards and Technology) Mass Spectral Library and confirmed by comparing their retention times with those of commercial standards whenever available. Post-run analyses were carried out using the Shimadzu Lab Solutions software (version 2.50). VOCs were quantified by dividing their peak area by that of the internal standard and expressed as nanogram per microliter per gram of dry weight of foliage per hour (ng·g−1·h−1). Contaminants (toluene, p-xylene, o-xylene, diethyl phthalate, etc.) that were consistently identified in negative controls (empty oven cooking bags) were excluded from further analyses.

2.5. Statistical Analysis

The R statistical software (Version 3.6.1) [49] was used for all analyses. For the VOC profiling of the fifteen willow species and hybrids, 19 VOCs were chosen, based on their consistent occurrence in the samples of at least one species or hybrid. One replicate of S. × fragilis that did not emit the selected compounds was dropped from analyses. The VOC data were square-root transformed to achieve normality [50], and to allow rare VOCs to have equal weight by reducing the overestimation of highly-occurring VOCs in the headspace samples [51]. We performed a permutational multivariate analysis of variance (PERMANOVA) with Bonferroni adjustment to differentiate the VOC blends of the fifteen willow species and hybrids. The analysis was done using the Adonis function with Bray–Curtis distance matrix and 999 permutations [52]. Non-metric Multi-Dimensional Scaling (NMDS) was performed to depict differences in the VOC profiles of the willow species and hybrids. The PERMANOVA and NMDS were performed using the vegan [53] package.
The relative proportion of each major VOC class (aldehydes, GLVs, monoterpenes and sesquiterpenes) was calculated by summing up the specific VOC concentrations for each group, and then dividing by the whole blend as described by Digilio, et al. [54]. We constructed linear mixed model (LMM) ANOVAs on the square root transformed relative VOC proportions using the lme4 package, to further differentiate the emission of VOC class within each species or hybrid. The fifteen willow species and hybrids were treated as a fixed factor, while the row number of the VOC sampling was considered as a random variable. The linear mixed model was fitted on a proxy-log scale and a multiple comparison was then performed using Tukey’s HSD test in multcomp and lsmeans packages.
To test the response of the willows to aphid infestation, a Tweedie generalized linear model with gamma distribution and log-link function was used to compare the total VOC emissions, and that of each of the four major VOC groups (aldehydes, GLVs, monoterpenes and sesquiterpenes). The concentrations of specific VOCs were summed up to become the total concentrations of the major VOC classes. A one-way ANOVA, followed by Tukey’s HSD test was used to compare aphid population levels on willow species, monitored just before VOC sampling. Finally, a Spearman’s rank correlation was performed to correlate the aphid population level (proxy-log scale) and the total VOC emissions for the aphid-infested willows; the relationship was visualized using the ggpubr package.

3. Results

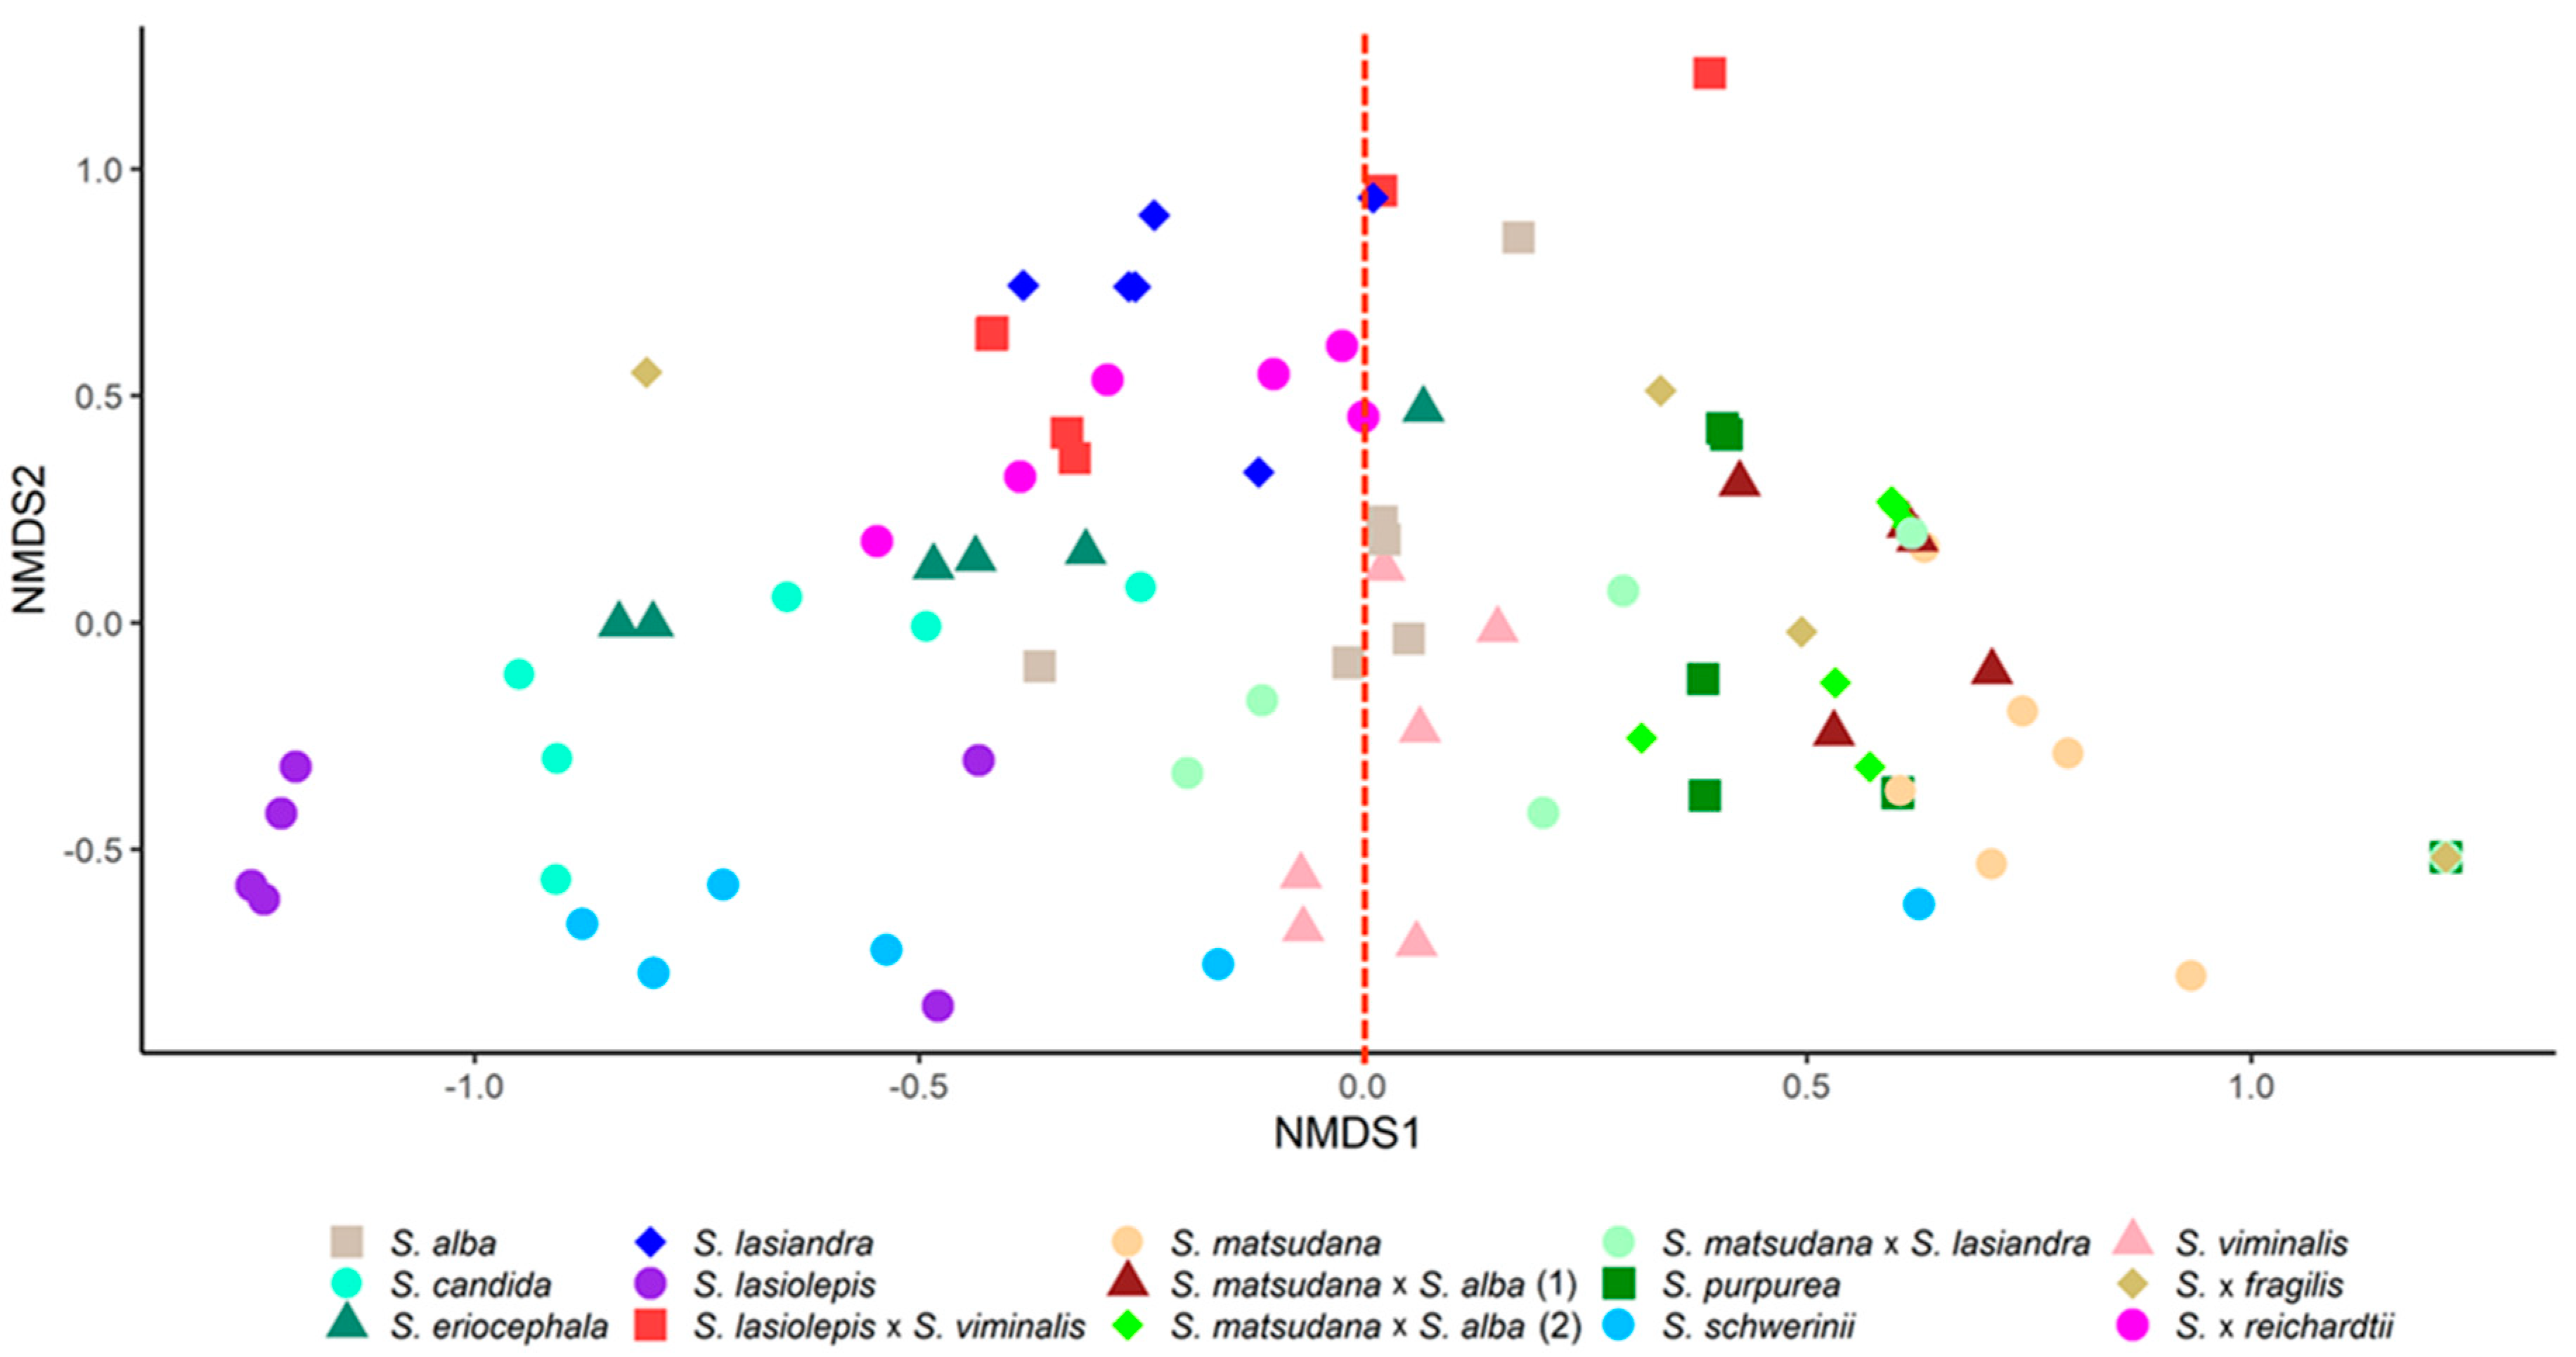
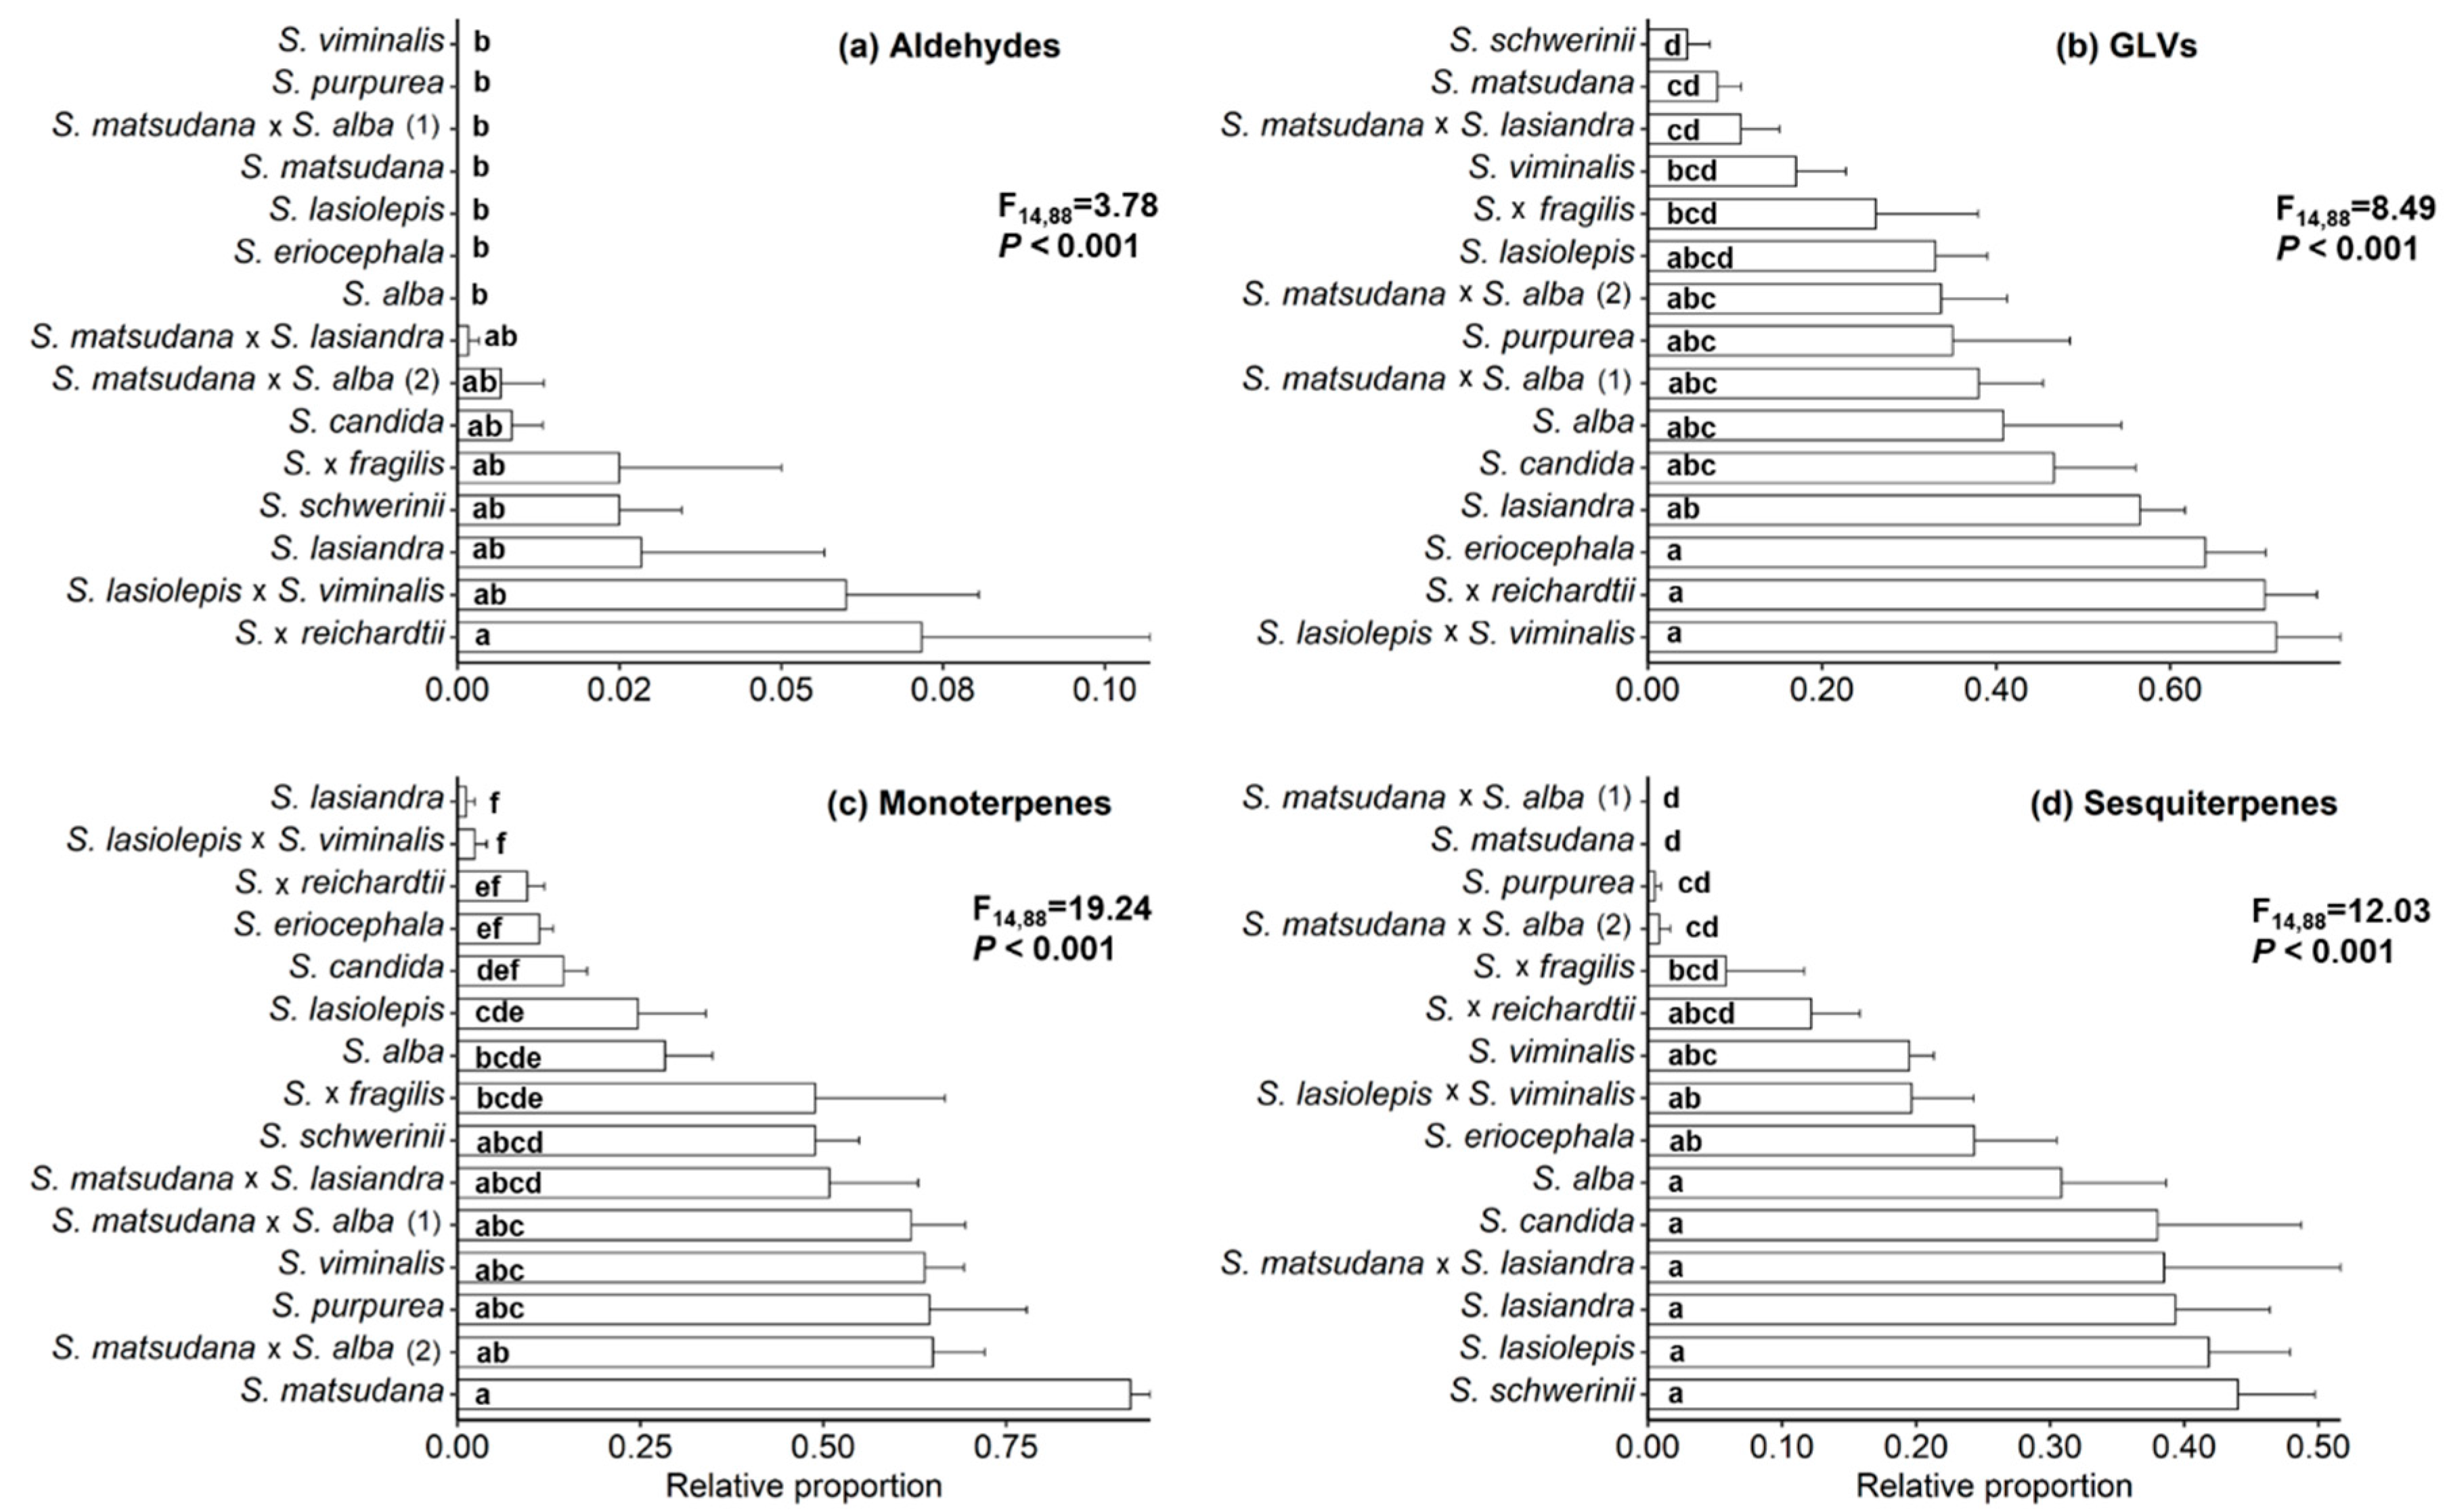
3.1. Characterisation of Willow VOCs

The VOCs in the headspace samples from the willow plants, before inoculation with aphids, included: one aldehyde (nonanal), four GLVs ((Z)-3-hexenol, (Z)-3-hexenyl acetate, (Z)-3-hexenyl benzoate and (Z)-3-hexenyl-α-methylbutyrate), four monoterpenes ((E)-β-ocimene, (Z)-β-ocimene, α-ocimene and β-myrcene) and ten sesquiterpenes (α-cubebene, (E,E)α-farnesene, (E)-β-famesene, germacrene D, δ-cadinene, (E)-α-bergamotene, copaene, (Z,E)-α-farnesene, β-caryophyllene and cedrene) (Table 2). Salix candida and S. schwerinii released the largest number of VOCs (15), whereas S. matsudana, S. matsudana × S. alba (NZ 1040), S. purpurea, S. lasiandra, S. lasiolepis × S. viminalis and S. matsudana × S. alba (NZ 1184) emitted less than six out of the 19 selected VOCs. The remaining species and hybrids produced 7 to 11 VOCs in their headspace samples. The two VOCs released by all willows in this study were (Z)-3-hexenyl acetate and (E)-β-ocimene. More than 50% of the species and hybrids released α-farnesene, (Z,E)-α-farnesene and α-ocimene. The VOCs (E)-β-famesene, germacrene D, δ-cadinene, β-myrcene, cedrene, (Z)-3-hexenyl-α-methylbutyrate, α-cubebene, copaene and (E)-α-bergamotene were released from 25% of the willow species and hybrids. Salix candida was the only species that emitted (Z)-3-hexenyl benzoate (Table 2).
The VOC profiles of the tested willow species and hybrids differed significantly (PERMANOVA; Pseudo-F14,88 = 5.83, p < 0.001). Due to the high overlap of the VOC profiles, the NMDS algorithm yielded a low stress value (badness-of-fit; 0.20). However, some of the willow species and hybrids were distinguishable from others. For instance, there was clear differentiation between S. lasiandra and S. lasiolepis, S. schwerinii, S. matsudana and S. matsudana × S. alba (NZ 1040). Salix schwerinii had no overlap with S. eriocephala, S. × reichardtii, S. lasiolepis × S. viminalis, S. lasiandra and S. matsudana × S. alba (NZ 1040) (Figure 2). As expected, the closely related species and hybrids had more similar VOC profiles, as observed for S. matsudana and its hybrids. Tree willows were clustered separately from the shrub willows (Figure 2).
The fifteen willow species and hybrids emitted different proportions of the four classes of VOCs. The relative proportions of long-chain aldehydes in the whole blends differed significantly among the willow species and hybrids (F14,88 = 3.78, p < 0.001) (Figure 3a). The (LMM) ANOVA results also showed a significant fixed effect in GLVs proportion (F14,88 = 8.49, p < 0.001). Three species (S. lasiolepis × S. viminalis, S. × reichardtii and S. eriocephala) released more GLVs than five other species or hybrids (S. schwerinii, S. matsudana, S. matsudana × S. lasiandra, S. viminalis and S. × fragilis) (Figure 3b). Monoterpene production varied greatly among the willow species and hybrids (F14,88 = 9.24, p < 0.001). Salix matsudana, S. matsudana × S. alba (NZ 1184), S. purpurea, S. viminalis and S. matsudana × S. alba (NZ 1040) had the largest monoterpene emissions, while S. lasiandra and S. lasiolepis × S. viminalis released the lowest amount (Figure 3c). There were significant differences in the relative proportion of sesquiterpenes too (F14,88 = 12.03, p < 0.001). Salix schwerinii, S. lasiolepis, S. lasiandra, S. matsudana × S. lasiandra, S. candida, and S. alba were all high sesquiterpene-emitters, while S. matsudana × S. alba (NZ 1040) and S. matsudana had zero emissions (Figure 3d).

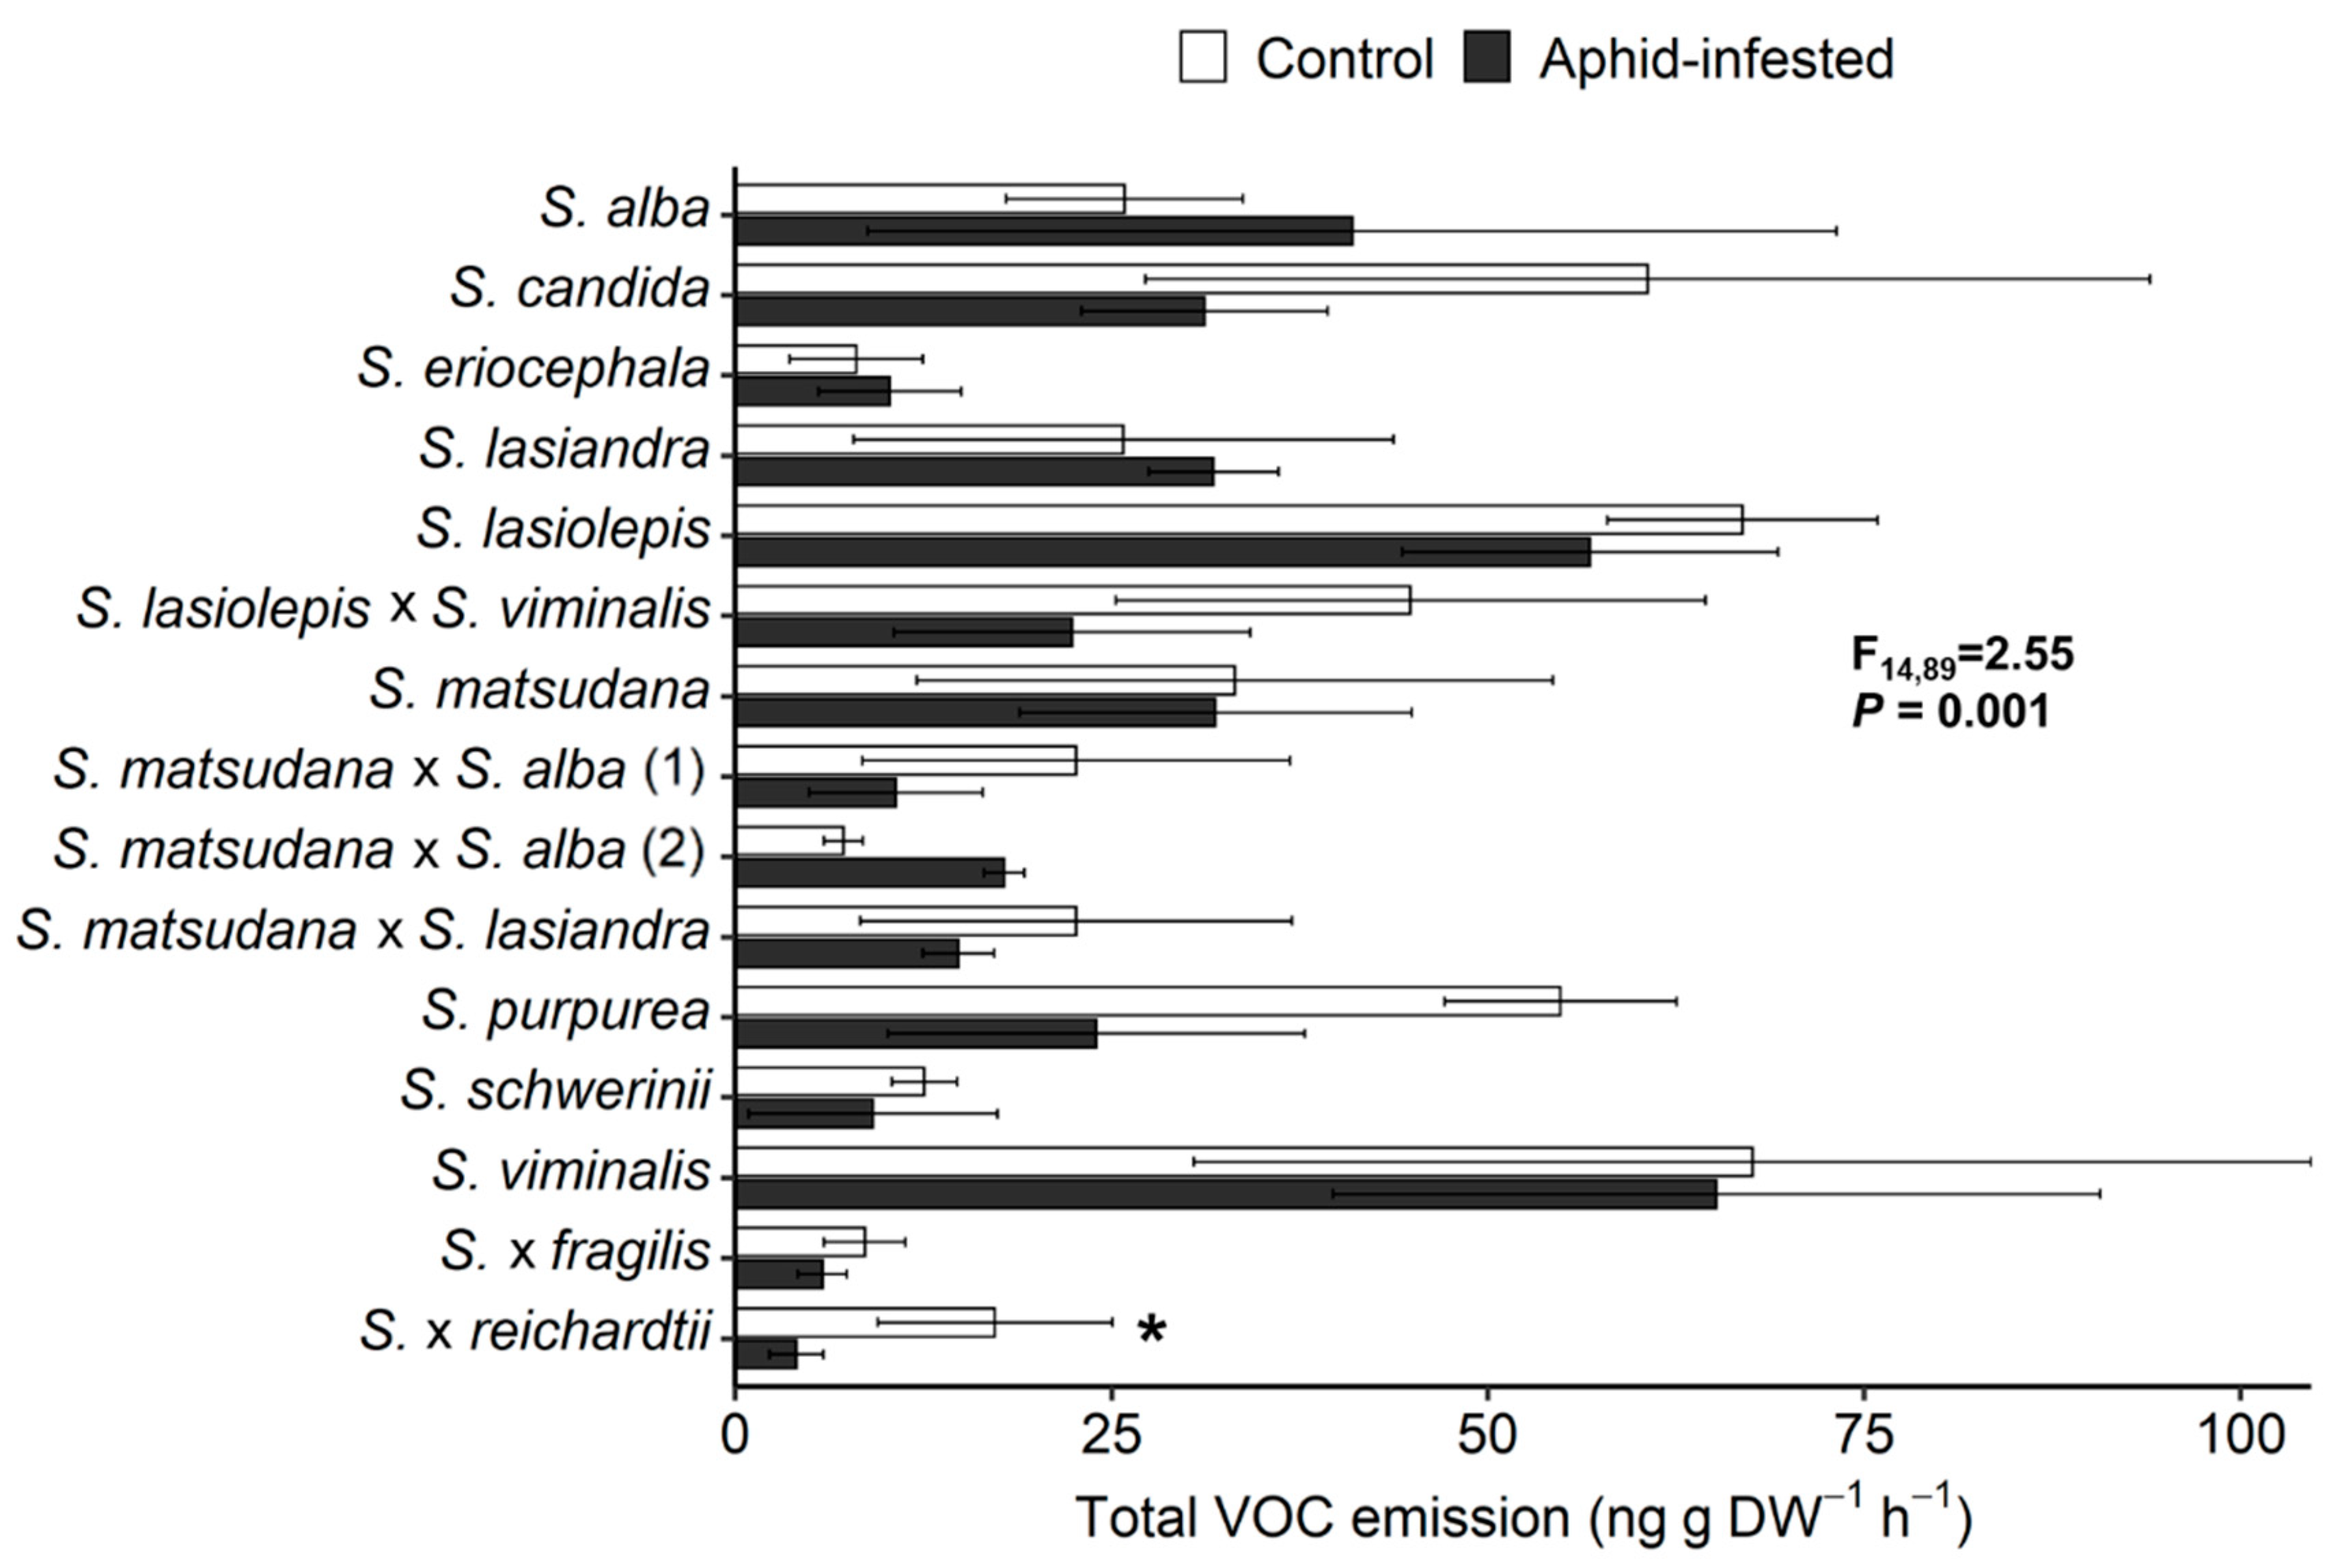
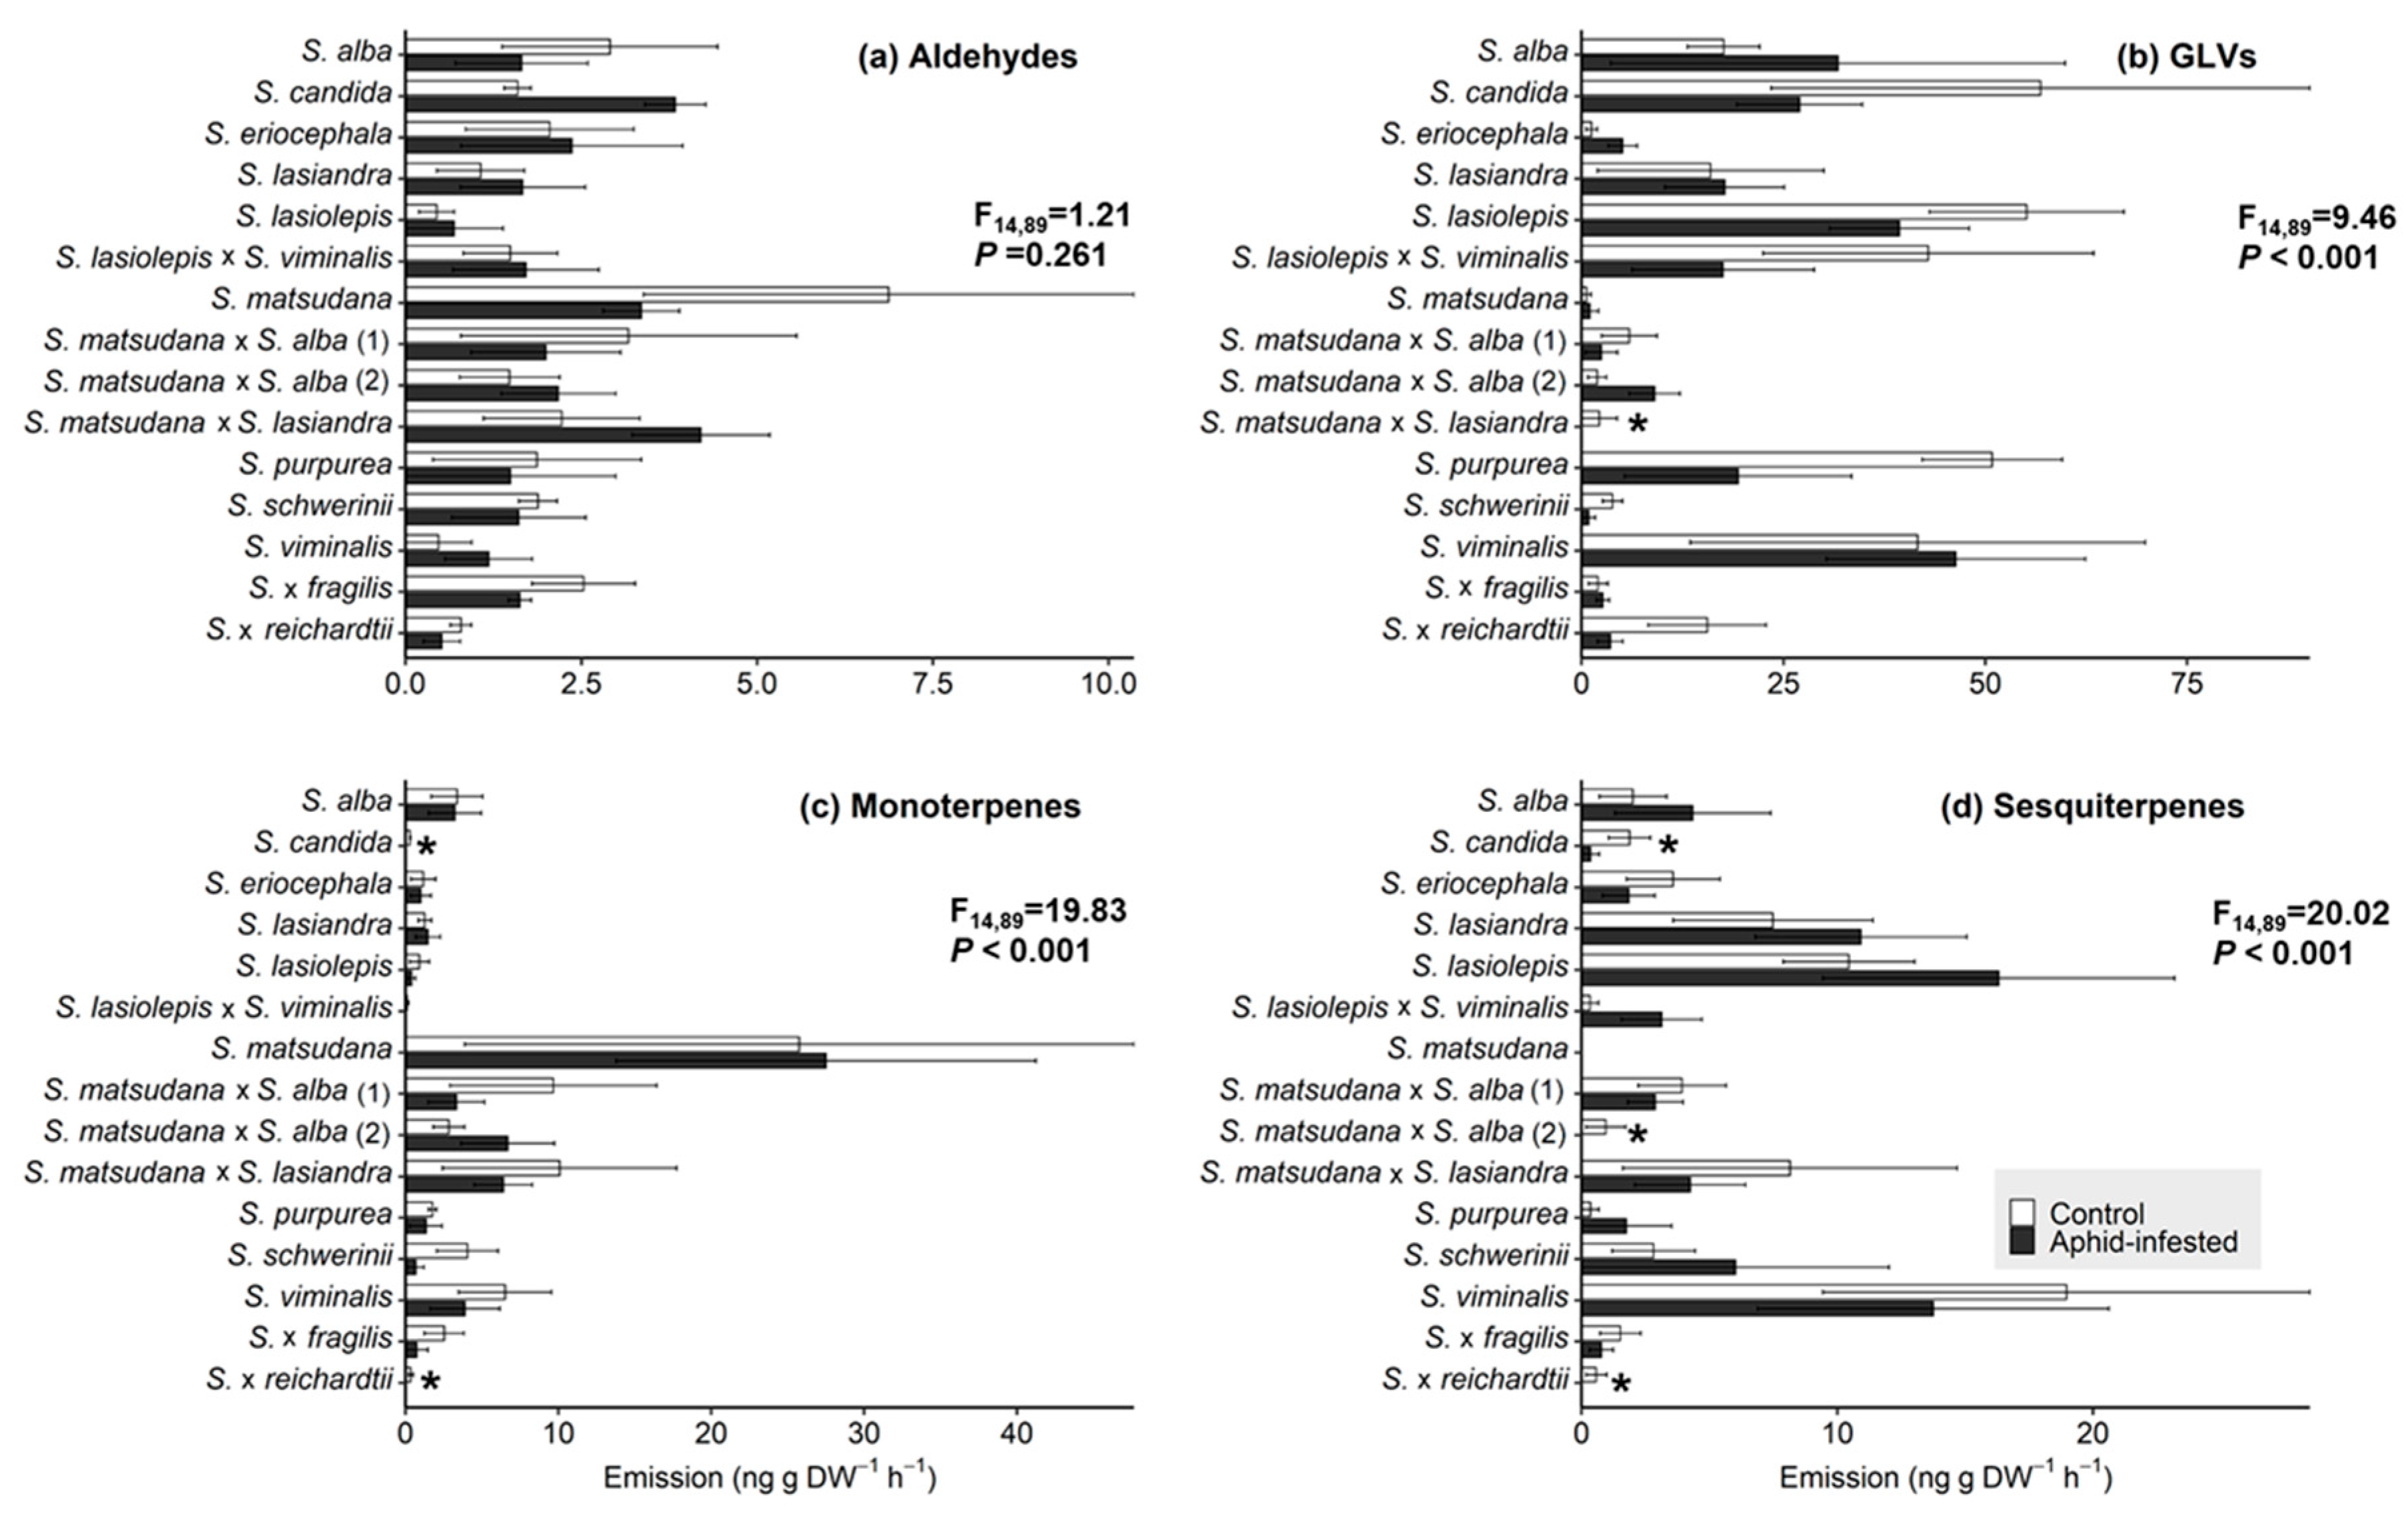
3.2. VOC Response of Willow Species and Hybrids to T. salignus Infestation

Eighteen VOCs were identified in the headspace samples from aphid-infested plants (Table S2) and different willow species responded differently to T. salignus infestation. In most cases, the VOC profiles of aphid-infested willow plants did not differ significantly from those of control plants (Figure 4). However, upon closer inspection, aphid infestation was found to significantly decrease total VOC emission in S. × reichardtii (Figure 4), GLV emission in S. matsudana × S. lasiandra, monoterpene emission in S. × reichardtii and S. candida, and sesquiterpene emission in S. × reichardtii, S. matsudana × S. alba (NZ 1184) and S. candida (Figure 5).

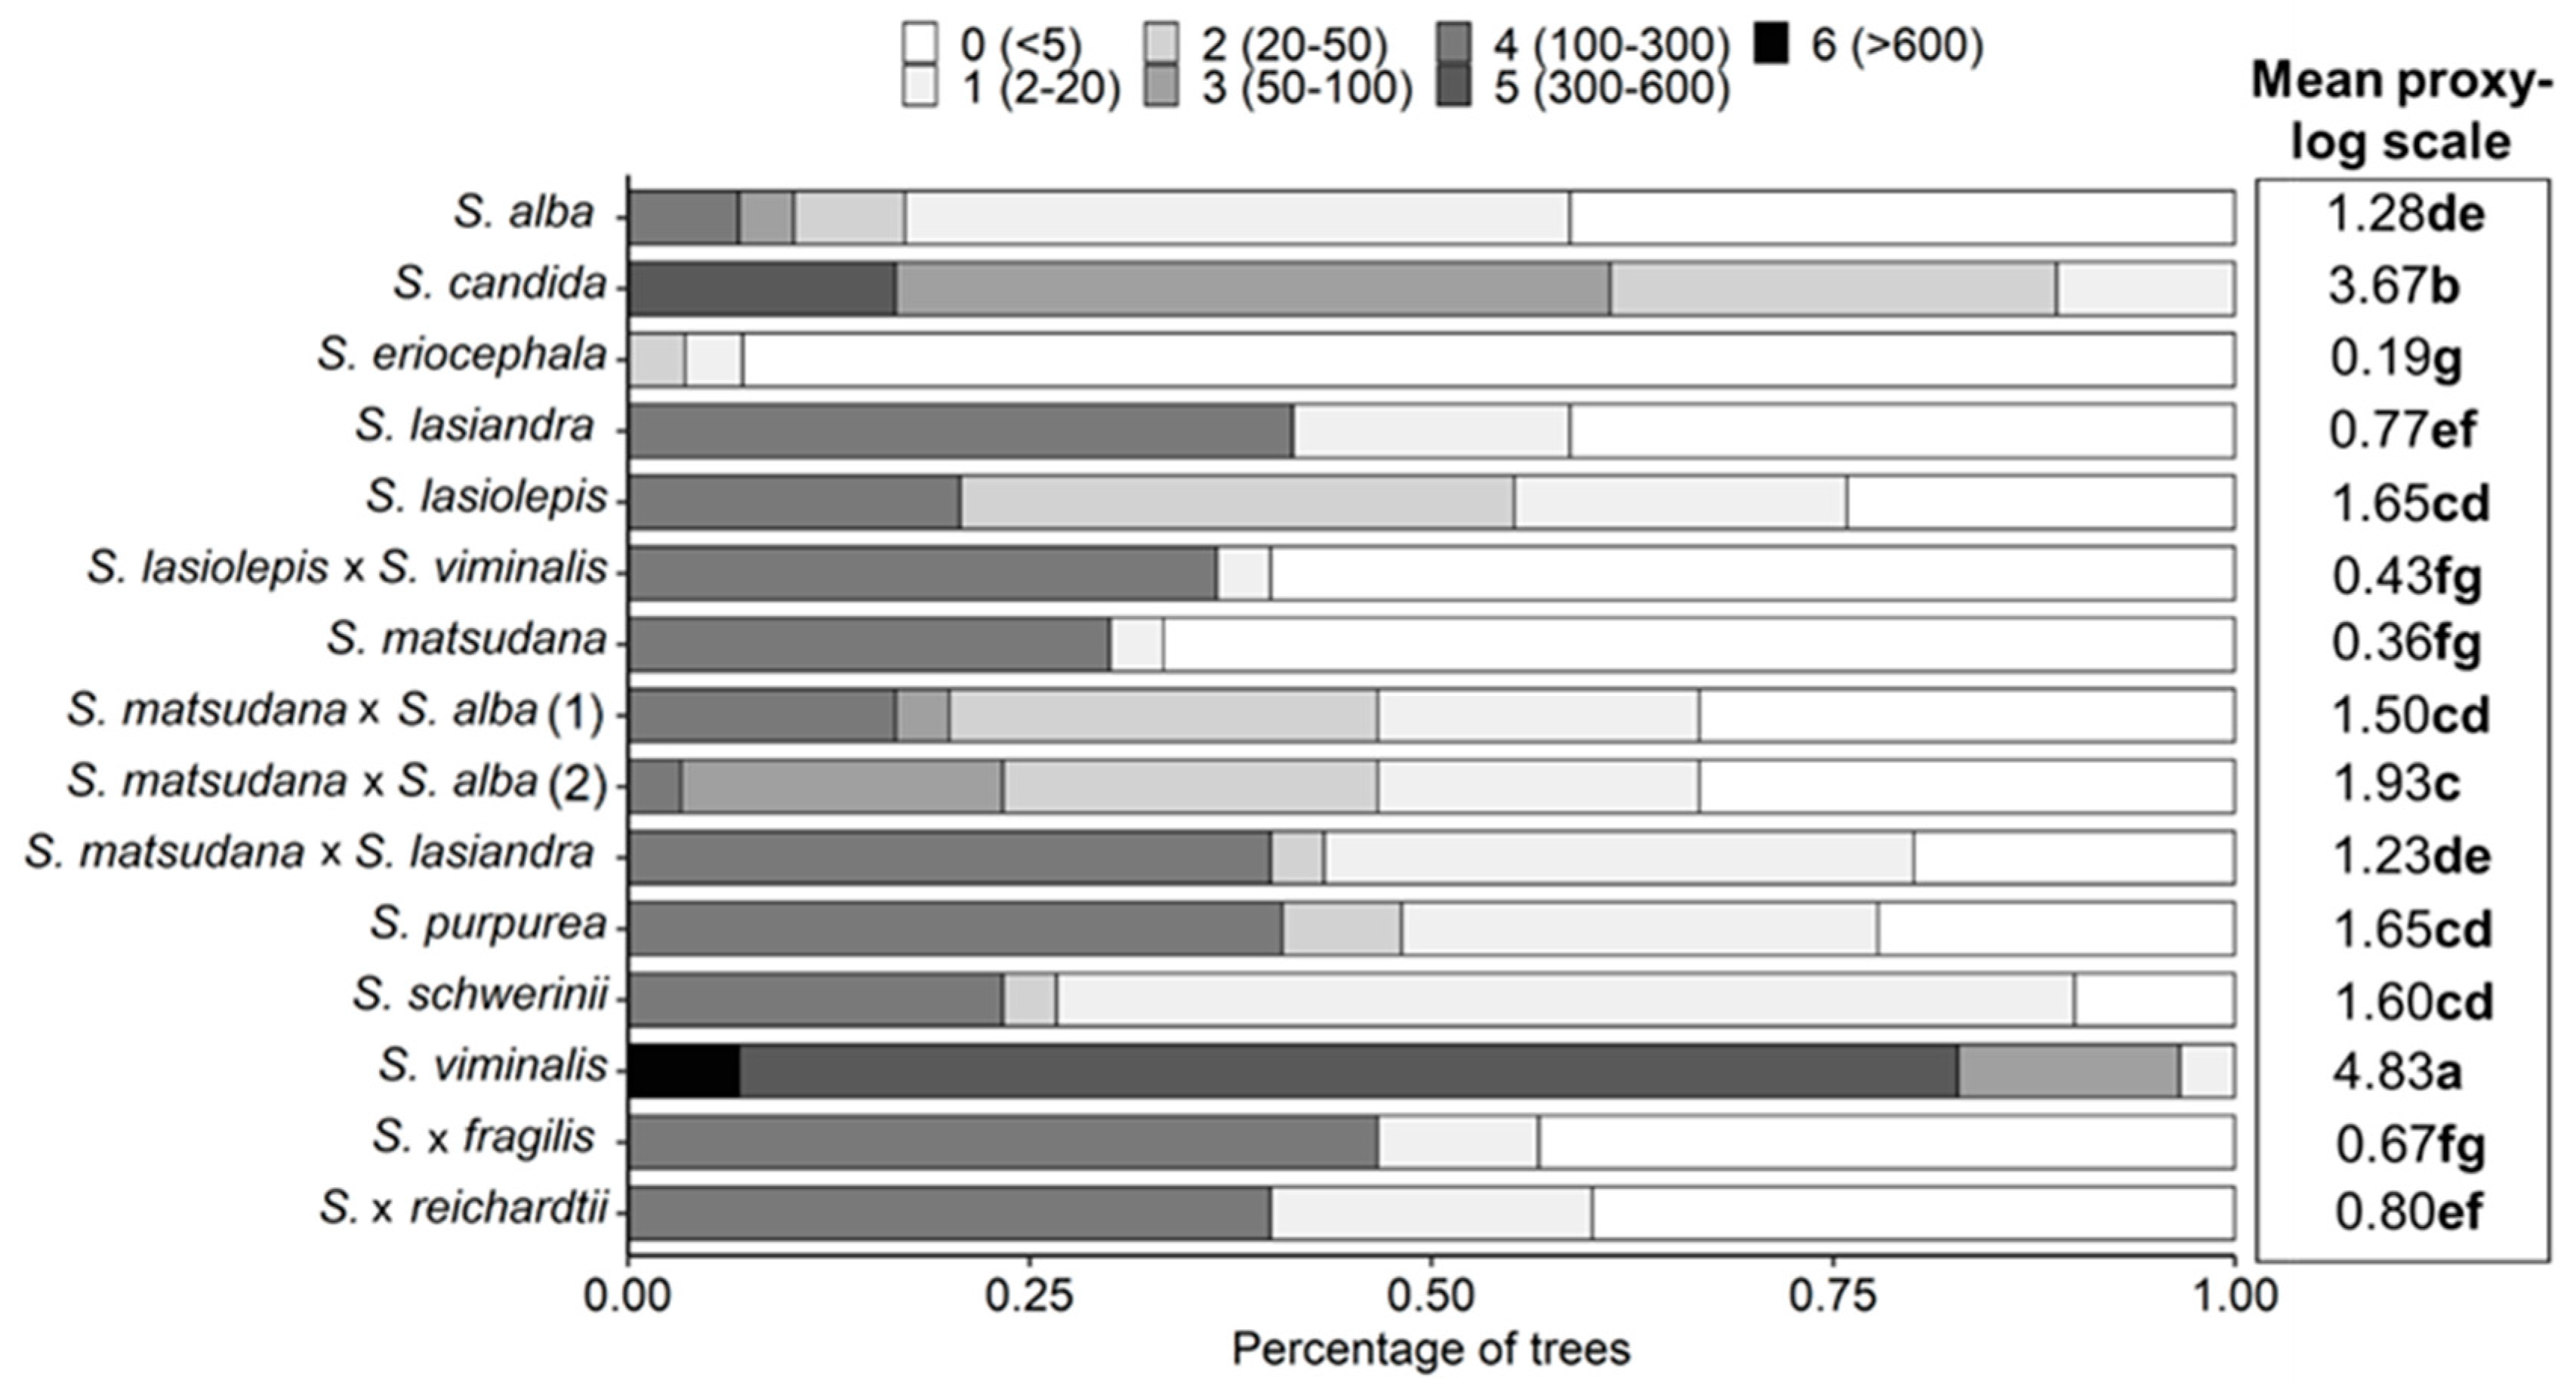
3.3. Correlation between Aphid Infestation and VOC Emissions

Our observation of aphid populations before VOC collection revealed different degrees of infestation among willow species (Figure 6), with S. eriocephala, S. matsudana, and S. lasiolepis × S. viminalis having very low infestation rates (most plants having 20 aphids or less) and S. viminalis having the highest infestation rates (most plants having 300 aphids or more), followed by S. candida (most plants having over a 100 aphids). Correlation analysis revealed only a weak relationship between aphid infestation and VOC emissions (n = 45, ρ = 0.34, p = 0.02).

4. Discussion

Our results showed variation in the VOC profiles of the different willow species and hybrids, attributed to the diversity of Salix spp. used in current study (Table 1). The VOC emissions were found to be more similar between closely related plants, as shown by close clustering between S. matsudana and its hybrids (S. matsudana × S. alba (NZ 1040), S. matsudana × S. alba (NZ 1184) and S. matsudana × S. lasiandra). VOC composition was distinct between shrub and tree willows, supporting the genetic clustering between these two growth forms as recently reported by Ngantcha [55].
Although species and hybrids varied in the number of compounds emitted, two compounds were common to all blends: GLVs (Z)-3-hexenyl acetate and monoterpene (E)-β-ocimene. Both compounds have been reported for S. eriocarpa [45], S. viminalis [43] and in related poplar trees (Populus nigra and P. trichocarpa) [9,56], suggesting that they are ubiquitous to plants species in the family Salicaceae. Studies suggest that these two compounds play important ecological roles. For example, (Z)-3-hexenyl acetate has been identified as a key compound associated with herbivore damage in different willow varieties and in poplar species, and is known to attract natural enemies [9,30,57]. In other willow and poplar species (E)-β-ocimene is involved in within-plant communication as a signal emitted by damaged plant parts to alert nearby undamaged parts of potential attack [58]. In our study, some species and hybrids reduced their emissions of these two compounds in response to T. salignus herbivory (Figure S1, Table S4). The reasons behind this reduction are not yet known and deserve further investigation.
Few studies have explored willow VOC responses to herbivore attack. HIPV emission by willows can be highly specific, varying with the life stage of their attacker (larvae vs. adult), and informing natural enemies about the suitable stage of their prey [59]. The predatory ladybird (Aiolocaria hexaspilota) was more attracted to VOC blends induced by willow beetle (Plagiodera versicolora) larvae, containing higher amounts of the GLVs (Z)-3-hexenol and (Z)-3-hexenyl acetate, the monoterpenes (E)-β-ocimene, (Z)-β-ocimene, allo-ocimene and linalool, the sesquiterpene (E)-α-farnesene, and two oximes (nitrogenous compounds) [59]. These results show that HIPVs play a role in host selection by herbivores, and in indirect defense in willows.
In the present study, we observed that not all willow species and hybrids reacted to aphid damage in the same way. While some willows (S. × reichardtii, S. matsudana × S. lasiandra, S. matsudana × S. alba, and S. candida) responded by decreasing their VOC emissions, the majority of species and hybrids did not show a significant change. Other studies on phloem feeders show contrasting results, with some reporting increases in VOC emissions after attack [26,60,61,62,63]. For instance, infestation by spiral gall aphid Pemphigus spyrothecae (Hemiptera: Aphididae) on leaf tissue can alter leaf’s photosynthetic activity that in turn triggers jasmonate transportation from petiole to lamina and finally modifies VOC emission in poplar (Populus × petrovskiana) [63]. However, there are also reports showing reductions in VOC emissions or no response at all [27,61,64]. Furthermore, studies comparing chewers and phloem feeders typically indicate that the latter have a less pronounced effect on VOC emissions than chewing herbivores [27,64].
The lack of response in most species and hybrids may be due to the fact that the giant willow aphid does not directly damage the photosynthetically active tissue (leaves), nor causes severe mechanical damage (as chewing herbivores do), and thus may not trigger strong changes in VOC emissions [64]. However, it has been suggested that aphids actively suppress plant responses to escape their natural enemies [61]. This manipulation of plant responses is possibly mediated by microbial endosymbionts of aphids in order to protect their hosts [65]. Further studies are required to clarify the mechanism behind the observed responses (or lack of them).
The VOC emission reduction observed in some species and hybrids may also be due to a trade-off between indirect and direct defense (i.e., production of VOCs vs. non-volatile secondary metabolites) [66,67,68,69]. Both direct and indirect defenses have a metabolic cost to the plant, and plants typically favor one type of defense over another. For instance, a study investigating wild and cultivated accessions of lima bean (Phaseolus lunatus) found that plants producing high levels of cyanogenic compounds (direct defenses) released low amounts of VOCs (indirect defenses) and vice versa [69]. In this study, some species and hybrids hosted lower aphid populations and appear to be more naturally resistant to aphid attack than others (Figure 6). This resistance is possibly associated with the presence of physical defense mechanisms (e.g., rough bark of resistant species), suggesting that defense trade-offs could exist in different types of willows.
Plant volatiles are known to play a role in deterring herbivores and attracting natural enemies in related tree species [6,9,59], but considering the costs involved in VOC production and emission [70,71], it would be disadvantageous for a plant to increase its emissions if there was an elevated fitness cost (e.g., higher appetency to generalist herbivores) with no net benefit (e.g., no attraction of natural enemies); such as in our case, where the invasive aphid lacks specialist natural enemies.
The degree of infestation (Figure 6) could also have contributed to different outcomes. The emission of HIPVs can qualitatively and quantitively vary depending on the population density of the insect feeding on host plants [72,73], with studies typically reporting a positive correlation between herbivore population density and VOC emission [74,75,76]. However, we only found a weak correlation between aphid infestation and VOC emission, and responding species and hybrids (except S. candida) were not heavily infested. This shows that responses are host-specific and less dependent on the degree of infestation, although within the responding species and hybrids, changes in aphid density may affect VOC emissions. Further studies are required to test this hypothesis.
A study by Aradottir et al. [46] found that T. salignus was significantly attracted to certain willow varieties but not to others in laboratory olfactometry tests. Although the compounds involved were not identified, this evidence shows that the giant willow aphid uses plant volatiles to choose their host plants. Therefore, future research should explore the role of VOCs in T. salignus host selection and colonization, and the behavioral responses of potential natural enemies of T. salignus, such as the harlequin ladybird Harmonia axyridis [77] to willow VOCs. Our results suggest that some naturally resistant species and hybrids (S. lasiolepis × S. viminalis and S. eriocephala) are rich GLV emitters, which are known to repel herbivores and attract natural enemies in other systems [78]. Representative compounds from this group, such as (Z)-3-hexenyl acetate, are good candidates for further testing.
In this study, plants belonging to the same species or hybrid had the same sex, so we did not explore the influence of plant sex on VOC emissions or responses to herbivory; this is an aspect that requires further investigation. Being an exploratory study, our results were limited to a low number of replicates, and therefore, we encourage additional studies with higher replication to confirm these findings. Aphid infestation was unequal between plants, as we wanted to explore aphid behavior in nature, and in doing so, were able to identify some species and hybrids which appear to be naturally more resistant than others to aphid attack. We are following this lead towards the selection of resistant species and hybrids for sustainable willow growing.

5. Conclusions

To summarize, there was a high variation in VOC emissions by different willow species and hybrids, with clear clustering between tree and shrub species. Most species and hybrids did not show significant changes in their VOC emissions in response to T. salignus infestation, but in those that did, this response was typically a reduction in VOC emissions. Whether this occurs due to the lack of response by the plant, trade-offs between direct and indirect defenses, or the active suppression of plant defenses by the aphid, requires further testing. Our study provides the foundation to further explore the role of willow VOCs in host selection by T. salignus. This information will contribute to the selection of willow species and hybrids for future planting, to reduce the ecological and economic impacts of this emerging pest.

Supplementary Materials

The following are available online at https://www.mdpi.com/2073-4395/10/9/1404/s1. Table S1: Split-plot experimental layout of the willow field trial, Table S2: GC-MS analysis of VOCs released from the foliage of 15 willow species and hybrids, for the control and aphid-infested treatments, Table S3: Mean emissions of total and major VOC classes as influenced by willow species/hybrid and aphid infestation, Table S4: Mean emissions of selected VOCs as influenced by willow species/hybrid and aphid infestation, Figure S1: Total emissions of the terpenoid (E)-β-ocimene and the GLV (Z)-3-hexenyl acetate. Asterisks indicate significant differences between the treatments within each species or hybrid, Tukey’s HSD test, α = 0.05. Details can be seen in Table S4.

Author Contributions

Data curation, M.M. and A.C.M.; Formal analysis, K.M.T., M.M. and A.C.M.; Funding acquisition, M.M. and A.C.M.; Investigation, K.M.T. and A.C.M.; Methodology, A.C.M.; Project administration, M.M., T.J. and A.C.M.; Resources, M.M., T.J. and A.C.M.; Software, K.M.T. and A.C.M.; Supervision, M.M., T.J. and A.C.M.; Validation, M.M., T.J. and A.C.M.; Visualization, K.M.T.; Writing—original draft, K.M.T.; Writing—review and editing, K.M.T., M.M., T.J. and A.C.M. All authors have read and agreed to the published version of the manuscript.

Funding

This research received no external funding.

Acknowledgments

The authors acknowledge the contribution for the willow field trial from the Sustainable Farming Fund Project, Ministry for Primary Industries (MPI), New Zealand. We thank John Sykes for technical assistance with the GC-MS, and Paul Barrett, Evans Effah, Mari Nakano, Claire Zucchetta and Shaun Nielsen for field assistance during VOC collection. The current study is a part of the Ph.D. project funded by a New Zealand Government Scholarship to Kyaw Min Tun.

Conflicts of Interest

The authors declare no conflict of interest.

References

  1. Jaeger, D.M.; Runyon, J.B.; Richardson, B.A. Signals of speciation: Volatile organic compounds resolve closely related sagebrush taxa, suggesting their importance in evolution. New Phytol. 2016, 211, 1393–1401. [Google Scholar] [CrossRef] [PubMed]
  2. Dudareva, N.; Pichersky, E. Metabolic engineering of plant volatiles. Curr. Opin. Biotechnol. 2008, 19, 181–189. [Google Scholar] [CrossRef]
  3. Clavijo McCormick, A. Can plant–natural enemy communication withstand disruption by biotic and abiotic factors? Ecol. Evol. 2016, 6, 8569–8582. [Google Scholar] [CrossRef] [PubMed]
  4. Vivaldo, G.; Masi, E.; Taiti, C.; Caldarelli, G.; Mancuso, S. The network of plants volatile organic compounds. Sci. Rep. 2017, 7, 1–18. [Google Scholar] [CrossRef] [Green Version]
  5. De Moraes, C.M.; Mescher, M.C.; Tumlinson, J.H. Caterpillar-induced nocturnal plant volatiles repel conspecific females. Nature 2001, 410, 577–580. [Google Scholar] [CrossRef] [PubMed]
  6. Irmisch, S.; Clavijo McCormick, A.; Günther, J.; Schmidt, A.; Boeckler, G.A.; Gershenzon, J.; Unsicker, S.B.; Köllner, T.G. Herbivore-induced poplar cytochrome P450 enzymes of the CYP 71 family convert aldoximes to nitriles which repel a generalist caterpillar. Plant J. 2014, 80, 1095–1107. [Google Scholar] [CrossRef] [PubMed]
  7. Amo, L.; Jansen, J.J.; van Dam, N.M.; Dicke, M.; Visser, M.E. Birds exploit herbivore-induced plant volatiles to locate herbivorous prey. Ecol. Lett. 2013, 16, 1348–1355. [Google Scholar] [CrossRef] [Green Version]
  8. Dudareva, N.; Pichersky, E. Biochemical and molecular genetic aspects of floral scents. Plant Physiol. 2000, 122, 627–634. [Google Scholar] [CrossRef] [Green Version]
  9. Clavijo McCormick, A.; Irmisch, S.; Reinecke, A.; Boeckler, G.A.; Veit, D.; Reichelt, M.; Hansson, B.S.; Gershenzon, J.; Köllner, T.G.; Unsicker, S.B. Herbivore-induced volatile emission in black poplar: Regulation and role in attracting herbivore enemies. Plant Cell Environ. 2014, 37, 1909–1923. [Google Scholar] [CrossRef]
  10. Baldwin, I.T.; Kessler, A.; Halitschke, R. Volatile signaling in plant–plant–herbivore interactions: What is real? Curr. Opin. Plant Biol. 2002, 5, 351–354. [Google Scholar] [CrossRef]
  11. Owen, S.M.; Peñuelas, J. Opportunistic emissions of volatile isoprenoids. Trends Plant Sci. 2005, 10, 420–426. [Google Scholar] [PubMed]
  12. Holopainen, J.K.; Gershenzon, J. Multiple stress factors and the emission of plant VOCs. Trends Plant Sci. 2010, 15, 176–184. [Google Scholar] [PubMed]
  13. Clavijo McCormick, A.; Unsicker, S.B.; Gershenzon, J. The specificity of herbivore-induced plant volatiles in attracting herbivore enemies. Trends Plant Sci. 2012, 17, 303–310. [Google Scholar] [PubMed]
  14. Arneth, A.; Schurgers, G.; Hickler, T.; Miller, P. Effects of species composition, land surface cover, CO2 concentration and climate on isoprene emissions from European forests. Plant Biol. 2007, 9, 150–162. [Google Scholar]
  15. Winters, A.J.; Adams, M.A.; Bleby, T.M.; Rennenberg, H.; Steigner, D.; Steinbrecher, R.; Kreuzwieser, J. Emissions of isoprene, monoterpene and short-chained carbonyl compounds from Eucalyptus spp. in southern Australia. Atmos. Environ. 2009, 43, 3035–3043. [Google Scholar]
  16. Kesselmeier, J.; Staudt, M. Biogenic volatile organic compounds (VOC): An overview on emission, physiology and ecology. J. Atmos. Chem. 1999, 33, 23–88. [Google Scholar]
  17. Ashman, T.-L.; Bradburn, M.; Cole, D.H.; Blaney, B.H.; Raguso, R.A. The scent of a male: The role of floral volatiles in pollination of a gender dimorphic plant. Ecology 2005, 86, 2099–2105. [Google Scholar]
  18. Masante-Roca, I.; Anton, S.; Delbac, L.; Dufour, M.C.; Gadenne, C. Attraction of the grapevine moth to host and non-host plant parts in the wind tunnel: Effects of plant phenology, sex, and mating status. Entomol. Exp. Appl. 2007, 122, 239–245. [Google Scholar]
  19. Michereff, M.F.F.; Laumann, R.A.; Borges, M.; Michereff-Filho, M.; Diniz, I.R.; Neto, A.L.F.; Moraes, M.C.B. Volatiles mediating a plant-herbivore-natural enemy interaction in resistant and susceptible soybean cultivars. J. Chem. Ecol. 2011, 37, 273–285. [Google Scholar]
  20. Shiojiri, K.; Karban, R. Plant age, communication, and resistance to herbivores: Young sagebrush plants are better emitters and receivers. Oecologia 2006, 149, 214–220. [Google Scholar]
  21. Dudareva, N.; Klempien, A.; Muhlemann, J.K.; Kaplan, I. Biosynthesis, function and metabolic engineering of plant volatile organic compounds. New Phytol. 2013, 198, 16–32. [Google Scholar] [CrossRef] [PubMed]
  22. Giacomuzzi, V.; Cappellin, L.; Khomenko, I.; Biasioli, F.; Schütz, S.; Tasin, M.; Knight, A.L.; Angeli, S. Emission of volatile compounds from apple plants infested with Pandemis heparana larvae, antennal response of conspecific adults, and preliminary field trial. J. Chem. Ecol. 2016, 42, 1265–1280. [Google Scholar] [CrossRef] [PubMed]
  23. McClung, C.R. Plant circadian rhythms. Plant Cell 2006, 18, 792–803. [Google Scholar] [CrossRef] [PubMed] [Green Version]
  24. Clavijo McCormick, A.; Boeckler, G.A.; Köllner, T.G.; Gershenzon, J.; Unsicker, S.B. The timing of herbivore-induced volatile emission in black poplar (Populus nigra) and the influence of herbivore age and identity affect the value of individual volatiles as cues for herbivore enemies. BMC Plant Biol. 2014, 14, 304. [Google Scholar] [CrossRef] [Green Version]
  25. Walling, L.L. The myriad plant responses to herbivores. J. Plant Growth Regul. 2000, 19, 195–216. [Google Scholar] [CrossRef]
  26. Joó, É.; Van Langenhove, H.; Šimpraga, M.; Steppe, K.; Amelynck, C.; Schoon, N.; Müller, J.-F.; Dewulf, J. Variation in biogenic volatile organic compound emission pattern of Fagus sylvatica L. due to aphid infection. Atmos. Environ. 2010, 44, 227–234. [Google Scholar] [CrossRef]
  27. Rodriguez-Saona, C.; Crafts-Brandner, S.J.; Cañas, L.A. Volatile emissions triggered by multiple herbivore damage: Beet armyworm and whitefly feeding on cotton plants. J. Chem. Ecol. 2003, 29, 2539–2550. [Google Scholar] [CrossRef]
  28. Copeland, N.; Cape, J.N.; Heal, M.R. Volatile organic compound emissions from Miscanthus and short rotation coppice willow bioenergy crops. Atmos. Environ. 2012, 60, 327–335. [Google Scholar] [CrossRef] [Green Version]
  29. Hakola, H.; Rinne, J.; Laurila, T. The hydrocarbon emission rates of tea-leafed willow (Salix phylicifolia), silver birch (Betula pendula) and European aspen (Populus tremula). Atmos. Environ. 1998, 32, 1825–1833. [Google Scholar] [CrossRef]
  30. Peacock, L.; Lewis, M.; Powers, S. Volatile compounds from Salix spp. varieties differing in susceptibility to three willow beetle species. J. Chem. Ecol. 2001, 27, 1943–1951. [Google Scholar] [CrossRef]
  31. Goggin, F.L. Plant–aphid interactions: Molecular and ecological perspectives. Curr. Opin. Plant Biol. 2007, 10, 399–408. [Google Scholar] [CrossRef] [PubMed]
  32. Ahmed, N.; Darshanee, H.L.C.; Khan, I.A.; Zhang, Z.-F.; Liu, T.-X. Host selection behavior of the green peach aphid, Myzus persicae, in response to volatile organic compounds and nitrogen contents of cabbage cultivars. Front. Plant Sci. 2019, 10, 79. [Google Scholar] [CrossRef] [PubMed] [Green Version]
  33. Inui, Y.; Miyamoto, Y.; Ohgushi, T. Comparison of volatile leaf compounds and herbivorous insect communities on three willow species. Popul. Ecol. 2003, 45, 41–46. [Google Scholar] [CrossRef]
  34. Argus, G.W. Classification of Salix in the new world. Bot. Electron. News 1999, 227, 1–6. [Google Scholar]
  35. Argus, G.W. Salix (Salicaceae) distribution maps and a synopsis of their classification in North America, North of Mexico. Harv. Pap. Bot. 2007, 12, 335–368. [Google Scholar] [CrossRef]
  36. Glenny, D.; Jones, T. Key to Willow Species and Hybrids Present in New Zealand. Available online: https://www.landcareresearch.co.nz/resources/identification/plants/salix-key (accessed on 16 June 2020).
  37. Isebrands, J.; Aronsson, P.; Carlson, M.; Ceulemans, R.; Coleman, M.; Dickinson, N.; Dimitriou, J.; Doty, S.; Gardiner, E.; Heinsoo, K. Environmental applications of poplars and willows. In Poplars and Willows: Trees for Society and the Environment; Isebrands, J.G., Richardson, J., Eds.; CABI and FAO: Rome, Italy, 2014; pp. 258–336. [Google Scholar]
  38. Newstrom-Lloyd, L.; McIvor, I.; Jones, T.; Gabarret, M.; Polturat, B. Winning with Willows: Extending the Supply of Nutritious Pollen for Bees in Spring. Available online: https://www.poplarandwillow.org.nz/documents/winning-with-willows.pdf (accessed on 19 September 2019).
  39. Wilkinson, A.G. Poplars and willows for soil erosion control in New Zealand. Biomass Bioenerg. 1999, 16, 263–274. [Google Scholar] [CrossRef]
  40. Martin, N.A. Giant Willow Aphid—Tuberolachnus salignus. Available online: http://nzacfactsheets.landcareresearch.co.nz/factsheet/InterestingInsects/Giant-willow-aphid---Tuberolachnus-salignus.html (accessed on 12 December 2019).
  41. Sopow, S.; Jones, T.; Mclvor, I.; McLean, J.; Pawson, S. Potential impacts of Tuberolachnus salignus (giant willow aphid) in New Zealand and options for control. Agric. Forest Entomol. 2017, 19, 225–234. [Google Scholar] [CrossRef] [Green Version]
  42. Sopow, S. Giant Willow Aphid in New Zealand. Available online: https://www.scionresearch.com/__data/assets/pdf_file/0006/48183/GiantWillowAphid.pdf (accessed on 7 February 2020).
  43. Fernandez, P.C.; Meiners, T.; Björkman, C.; Hilker, M. Electrophysiological responses of the blue willow leaf beetle, Phratora vulgatissima, to volatiles of different Salix viminalis genotypes. Entomol. Exp. Appl. 2007, 125, 157–164. [Google Scholar] [CrossRef]
  44. Braccini, C.L.; Vega, A.S.; Coll Araoz, M.V.; Teal, P.E.; Cerrillo, T.; Zavala, J.A.; Fernandez, P.C. Both volatiles and cuticular plant compounds determine oviposition of the willow sawfly Nematus oligospilus on leaves of Salix spp. (Salicaceae). J. Chem. Ecol. 2015, 11, 985–996. [Google Scholar] [CrossRef]
  45. Yoneya, K.; Ozawa, R.; Takabayashi, J. Specialist leaf beetle larvae use volatiles from willow leaves infested by conspecifics for reaggregation in a tree. J. Chem. Ecol. 2010, 36, 671–679. [Google Scholar] [CrossRef]
  46. Aradottir, G.; Karp, A.; Hanley, S.; Shield, I.; Woodcock, C.; Dewhirst, S.; Collins, C.; Leather, S.; Harrington, R. Host selection of the giant willow aphid (Tuberolachnus salignus). Redia 2009, XCII, 223–225. [Google Scholar]
  47. Collins, C. Aspect of the Ecology of Two Stem-Feeding Willow Aphid Species. Ph.D. Thesis, Imperial College, University of London, London, UK, 2001. [Google Scholar]
  48. Effah, E.; Barrett, D.P.; Peterson, P.G.; Godfrey, A.J.R.; Potter, M.A.; Holopainen, J.K.; Clavijo McCormick, A. Natural variation in volatile emissions of the invasive weed Calluna vulgaris in New Zealand. Plants 2020, 9, 283. [Google Scholar]
  49. R Development Core Team R. A Language and Environment for Statistical Computing; R Foundation for Statistical Computing: Vienna, Austria, 2019. [Google Scholar]
  50. Zhang, B.; Du, N.; Li, Y.; Shi, P.; Wei, G. Distinct biogeographic patterns of rhizobia and non-rhizobial endophytes associated with soybean nodules across China. Sci. Total Environ. 2018, 643, 569–578. [Google Scholar]
  51. Sheehan, E.V.; Stevens, T.F.; Gall, S.C.; Cousens, S.L.; Attrill, M.J. Recovery of a temperate reef assemblage in a marine protected area following the exclusion of towed demersal fishing. PLoS ONE 2014, 8, e83883. [Google Scholar]
  52. Arbizu, M. pairwiseAdonis: Pairwise Multilevel Comparison Using Adonis, R Package Version 0.0.1; Available online: https://github.com/pmartinezarbizu/pairwiseAdonis (accessed on 19 December 2019).
  53. Oksanen, J.; Blanchet, F.G.; Kindt, R.; Legendre, P.; O’hara, R.; Simpson, G.L.; Solymos, P.; Stevens, M.H.H.; Wagner, H. Vegan: Community Ecology Package, R package version 1.17-4; Available online: https://CRAN.R-project.org/package=vegan (accessed on 8 January 2020).
  54. Digilio, M.C.; Corrado, G.; Sasso, R.; Coppola, V.; Iodice, L.; Pasquariello, M.; Bossi, S.; Maffei, M.E.; Coppola, M.; Pennacchio, F. Molecular and chemical mechanisms involved in aphid resistance in cultivated tomato. New Phytol. 2010, 187, 1089–1101. [Google Scholar]
  55. Ngantcha, A.C. DNA Fingerprinting and Genetic Relationships among Willow (Salix spp.). Master’s Thesis, University of Saskatchewan, Saskatoon, SK, Canada, 2010. [Google Scholar]
  56. Danner, H.; Boeckler, G.A.; Irmisch, S.; Yuan, J.S.; Chen, F.; Gershenzon, J.; Unsicker, S.B.; Köllner, T.G. Four terpene synthases produce major compounds of the gypsy moth feeding-induced volatile blend of Populus trichocarpa. Phytochemistry 2011, 72, 897–908. [Google Scholar]
  57. Frost, C.J.; Mescher, M.C.; Dervinis, C.; Davis, J.M.; Carlson, J.E.; De Moraes, C.M. Priming defense genes and metabolites in hybrid poplar by the green leaf volatile cis-3-hexenyl acetate. New Phytol. 2008, 180, 722–734. [Google Scholar]
  58. Frost, C.J.; Appel, H.M.; Carlson, J.E.; De Moraes, C.M.; Mescher, M.C.; Schultz, J.C. Within-plant signalling via volatiles overcomes vascular constraints on systemic signalling and primes responses against herbivores. Ecol. Lett. 2007, 10, 490–498. [Google Scholar]
  59. Yoneya, K.; Kugimiya, S.; Takabayashi, J. Can herbivore-induced plant volatiles inform predatory insect about the most suitable stage of its prey? Physio. Entomol. 2009, 34, 379–386. [Google Scholar]
  60. Giorgi, A.; Panseri, S.; Nanayakkara, N.N.M.C.; Chiesa, L.M. HS-SPME-GC/MS analysis of the volatile compounds of Achillea collina: Evaluation of the emissions fingerprint induced by Myzus persicae infestation. J. Plant Biol. 2012, 55, 251–260. [Google Scholar]
  61. Schwartzberg, E.G.; Böröczky, K.; Tumlinson, J.H. Pea aphids, Acyrthosiphon pisum, suppress induced plant volatiles in broad bean, Vicia faba. J. Chem. Ecol. 2011, 37, 1055–1062. [Google Scholar] [CrossRef] [PubMed]
  62. Blande, J.D.; Korjus, M.; Holopainen, J.K. Foliar methyl salicylate emissions indicate prolonged aphid infestation on silver birch and black alder. Tree Physiol. 2010, 30, 404–416. [Google Scholar] [CrossRef] [PubMed]
  63. Ye, J.; Jiang, Y.; Veromann-Jürgenson, L.-L.; Niinemets, Ü. Petiole gall aphid (Pemphigus spyrothecae) infestation of Populus × petrovskiana leaves alters foliage photosynthetic characteristics and leads to enhanced emissions of both constitutive and stress-induced volatiles. Trees 2019, 33, 37–51. [Google Scholar] [CrossRef] [PubMed]
  64. Turlings, T.C.J.; Bernasconi, M.; Bertossa, R.; Bigler, F.; Caloz, G.; Dorn, S. The induction of volatile emissions in maize by three herbivore species with different feeding habits: Possible consequences for their natural enemies. Biol. Control 1998, 11, 122–129. [Google Scholar] [CrossRef]
  65. Frago, E.; Mala, M.; Weldegergis, B.T.; Yang, C.; McLean, A.; Godfray, H.C.J.; Gols, R.; Dicke, M. Symbionts protect aphids from parasitic wasps by attenuating herbivore-induced plant volatiles. Nat. Commun. 2017, 8, 1860. [Google Scholar] [CrossRef] [Green Version]
  66. Rudgers, J.A.; Strauss, S.Y.; Wendel, J.F. Trade-offs among anti-herbivore resistance traits: Insights from Gossypieae (Malvaceae). Am. J. Bot. 2004, 91, 871–880. [Google Scholar] [CrossRef] [Green Version]
  67. Koricheva, J.; Nykänen, H.; Gianoli, E. Meta-analysis of trade-offs among plant antiherbivore defenses: Are plants jacks-of-all-trades, masters of all? Am. Nat. 2004, 163, E64–E75. [Google Scholar] [CrossRef]
  68. Wei, J.; Wang, L.; Zhao, J.; Li, C.; Ge, F.; Kang, L. Ecological trade-offs between jasmonic acid-dependent direct and indirect plant defences in tritrophic interactions. New Phytol. 2011, 189, 557–567. [Google Scholar] [CrossRef] [Green Version]
  69. Ballhorn, D.J.; Kautz, S.; Lion, U.; Heil, M. Trade-offs between direct and indirect defences of lima bean (Phaseolus lunatus). J. Ecol. 2008, 96, 971–980. [Google Scholar]
  70. Niinemets, Ü. Costs of production and physiology of emission of volatile leaf isoprenoids. In Advances in Plant Physiology; Hemantaranjan, A., Ed.; Scientific Publishers: Jodhpur, India, 2004; Volume 7, pp. 241–278. [Google Scholar]
  71. Robert, C.A.M.; Erb, M.; Hiltpold, I.; Hibbard, B.E.; Gaillard, M.D.P.; Bilat, J.; Degenhardt, J.; Cambet-Petit-Jean, X.; Turlings, T.C.J.; Zwahlen, C. Genetically engineered maize plants reveal distinct costs and benefits of constitutive volatile emissions in the field. Plant Biotechnol. J. 2013, 11, 628–639. [Google Scholar] [CrossRef] [Green Version]
  72. Miresmailli, S.; Gries, R.; Gries, G.; Zamar, R.H.; Isman, M.B. Population density and feeding duration of cabbage looper larvae on tomato plants alter the levels of plant volatile emissions. Pest Manag. Sci. 2012, 68, 101–107. [Google Scholar] [CrossRef] [PubMed]
  73. De Backer, L.; Megido, R.C.; Fauconnier, M.-L.; Brostaux, Y.; Francis, F.; Verheggen, F. Tuta absoluta-induced plant volatiles: Attractiveness towards the generalist predator Macrolophus pygmaeus. Arthropod Plant Interact. 2015, 9, 465–476. [Google Scholar] [CrossRef]
  74. Horiuchi, J.-I.; Arimura, G.-I.; Ozawa, R.; Shimoda, T.; Takabayashi, J.; Nishioka, T. A comparison of the responses of Tetranychus urticae (Acari: Tetranychidae) and Phytoseiulus persimilis (Acari: Phytoseiidae) to volatiles emitted from lima bean leaves with different levels of damage made by T. urticae or Spodoptera exigua (Lepidoptera: Noctuidae). Appl. Entomol. Zool. 2003, 38, 109–116. [Google Scholar]
  75. De Boer, J.G.; Posthumus, M.A.; Dicke, M. Identification of volatiles that are used in discrimination between plants infested with prey or nonprey herbivores by a predatory mite. J. Chem. Ecol. 2004, 30, 2215–2230. [Google Scholar] [CrossRef] [PubMed]
  76. Rioja, T.; Ceballos, R.; Holuigue, L. Herbivore-induced plant volatiles emitted from avocado shoots infested by Oligonychus yothersi (Acari: Tetranychidae) increases the attraction of micro-coleopterans. Chil. J. Agric. Res. 2018, 78, 447–458. [Google Scholar] [CrossRef] [Green Version]
  77. Tun, K.M.; Clavijo McCormick, A.; Jones, T.; Minor, M. The potential of harlequin ladybird beetle Harmonia axyridis as a predator of the giant willow aphid Tuberolachnus salignus: Voracity, life history and prey preference. BioControl 2020, 65, 313–321. [Google Scholar]
  78. Scala, A.; Allmann, S.; Mirabella, R.; Haring, M.A.; Schuurink, R.C. Green leaf volatiles: A plant’s multifunctional weapon against herbivores and pathogens. Int. J. Mol. Sci. 2013, 14, 17781–17811. [Google Scholar] [CrossRef] [Green Version]
Figure 1. Volatile organic compound (VOC) sampling from willow foliage using a portable volatile assay system. Branches were enclosed in oven cooking bags, into which carbon-filtered air was circulated through a push-pull system.
Agronomy 10 01404 g001
Figure 2. Non-metric Multi-Dimensional Scaling (NMDS) plot of similarities in VOC profiles released by the fifteen willow species and hybrids. Bray–Curtis dissimilarities were calculated on the square-root transformed VOC profiles containing 19 compounds. Each point represents a headspace sample (replicate). Most samples at the left side of the vertical dotted line correspond to shrub willows, whereas most samples at the right of the dotted line are tree willows.
Agronomy 10 01404 g002
Figure 3. Relative proportions of each major VOC class: (a) aldehydes, (b) GLVs, (c) monoterpenes and (d) sesquiterpenes, emitted by the fifteen willow species and hybrids. The values and error bars are means ± SE. Different letters represent statistically significant differences (α = 0.05) after post-hoc comparisons using Tukey’s HSD test.
Agronomy 10 01404 g003
Figure 4. Total VOCs emitted by fifteen willow species and hybrids in the control and aphid-infested treatments. The values and error bars indicate means ± SE. Asterisks indicate significant differences between the treatments within a species/hybrid, Tukey’s HSD test, α = 0.05.
Agronomy 10 01404 g004
Figure 5. Total emissions of (a) aldehydes, (b) GLVs, (c) monoterpenes and (d) sesquiterpenes by the fifteen willow species and hybrids in the control and aphid-infested treatments. Values and error bars indicate means ± SE. Asterisks indicate significant differences between the treatments within each species/hybrid, Tukey’s HSD test, α = 0.05. Detailed multiple comparisons can be seen in Table S3.
Agronomy 10 01404 g005
Figure 6. Proportion of willow plants hosting different population levels of T. salignus as monitored on 15 March 2019. The numbers on the right side represent mean proxy-log scales, with different letters indicating statistically significant differences among species; Tukey’s HSD test, α = 0.05.
Agronomy 10 01404 g006
Table 1. Willow species and hybrids used in this study.
Species/HybridCodeTypeSexGeographical Origin
S. candidaPN 385ShrubMaleNorth America
S. eriocephalaPN 376ShrubMaleNorth America
S. lasiolepisPN 751ShrubMaleNorth America
S. lasiolepis × S. viminalisNZ 04-106-073ShrubMaleHybridized in New Zealand
S. purpureaPN 249ShrubFemaleEurope, North Africa
S. schweriniiPN 386ShrubMaleEastern Asia
S. viminalisPN 220ShrubMaleEurope, Western Asia
S. × reichardtiiPN 714ShrubMaleEurope
S. albaPN 357TreeMaleEurope, Western and Central Asia
S. lasiandraPN 747TreeMaleNorth America
S. matsudanaPN 227TreeFemaleEastern Asia
S. matsudana × S. alba (1)NZ 1040TreeFemaleHybridized in New Zealand
S. matsudana × S. alba (2)NZ 1184TreeMale/femaleHybridized in New Zealand
S. matsudana × S. lasiandraNZ 03-003-073TreeMaleHybridized in New Zealand
S. × fragilisPN 218TreeFemaleEurope and Western Asia
Numbers (1) and (2) represent two different cultivars of S. matsudana × S. alba (NZ 1040) and (NZ 1184), and will be used in subsequent tables and figures. Code corresponds to the Plant & Food Research (Palmerston North, NZ) willow collection numbers.
Table 2. Gas chromatography-mass spectrometry (GC-MS) analysis of VOCs released from the foliage of fifteen willow species and hybrids.
Major VOC Groups
AldehydeGLVsMonoterpenesSesquiterpenes
Species and Hybrids Nonanal(Z)-3-hexenol(Z)-3-hexenyl acetate(Z)-3-hexenyl benzoate(Z)-3-hexenyl-α-methylbutyrate(Z)-β-ocimene(E)-β-ocimeneα-ocimeneβ-myrceneα-cubebene(E,E)-α-farnesene(Z,E)-α-farnesene(E)-β-farneseneGermacrene Dβ-caryophylleneCedreneCopaeneδ-cadinene(E)-α-bergamoteneNumber of VOCs Emitted
S. candida+++++o++++++o++++oo15
S. eriocephalao++o+o+oo+++oo+o+oo9
S. lasiolepisoo+ooo++o+++o+++++o11
S. lasiolepis × S. viminalis+++ooo+ooo++ooooooo6
S. purpureao++ooo++oo+oooooooo5
S. schwerinii+o+o++++++++oo+++++15
S. viminaliso++oo++++o+++ooooo+10
S. × reichardtii+++ooo+ooo++oo+oooo7
S. albao++o+o+ooo++oo+ooo+8
S. lasiandra+o+ooo+ooo++ooooooo5
S. matsudanaoo+oo+++ooooooooooo4
S. matsudana × S. alba (1)o++oo+++ooooooooooo5
S. matsudana × S. alba (2)+o+oo+++oo+oooooooo6
S. matsudana × S. lasiandra+o+oo+++oo++oooooo+8
S. × fragilis+++ooo++oo+o+oooooo7
Number of species and hybrids891514615103413102263424
The “+” and “o” symbols indicate the presence and absence of the compounds in the headspace samples, respectively. Compounds found in all replicates were used to show their presence or absence in VOC blend of each willow species and hybrid.

