Article

The Antifungal Activity of Gallic Acid and Its Derivatives against Alternaria solani, the Causal Agent of Tomato Early Blight

by
Asmaa El-Nagar
1,†,
Abdelnaser A. Elzaawely
1,
Naglaa A. Taha
2 and
Yasser Nehela
1,3,*,†
1
Department of Agricultural Botany, Faculty of Agriculture, Tanta University, Tanta 31511, Egypt
2
Vegetable Disease Research Department, Plant Pathology Research Institute, Agricultural Research Center, Giza 12619, Egypt
3
Department of Plant Pathology, Citrus Research and Education Center, University of Florida, 700 Experiment Station Rd., Lake Alfred, FL 33850, USA
*
Author to whom correspondence should be addressed.
These authors contributed equally to this work.
Agronomy 2020, 10(9), 1402; https://doi.org/10.3390/agronomy10091402
Submission received: 26 August 2020 / Revised: 13 September 2020 / Accepted: 14 September 2020 / Published: 16 September 2020
(This article belongs to the Section Pest and Disease Management)

Abstract

:
Tomato (Solanum lycopersicum L.) is among the most important vegetable crops worldwide. Early blight disease, caused by Alternaria solani, is a destructive foliar disease of tomato and other Solanaceae species. Herein, we investigated the in vitro antifungal properties of gallic acid and two of its derivatives (syringic and pyrogallic acids) against A. solani during 2019 and 2020 seasons. The physiological and biochemical effects of these compounds on infected tomato plants were also investigated using the whole plant bioassay. The in vitro investigation showed that all tested compounds showed fungistatic action and inhibited the mycelial radial growth of A. solani in a dose-dependent manner. In two separate pot-experiments, those compounds efficiently suppressed the development of the disease symptoms and area under disease progress curve (AUDPC), without any phytotoxic effects on the treated tomato plants. Additionally, all tested compounds positively enhanced the biochemical traits of treated plants including the chlorophyll content, the total soluble phenolics, the total soluble flavonoids, and the enzymatic activities of catalase, peroxidase, and polyphenol oxidase during 2019 and 2020 seasons. Moreover, the treatment with gallic acid and its derivatives significantly increased all yield components of A. solani-infected tomato plants such as the total number of flowers and fruits, and the fruit yield for each tomato plant in both experiments. Considering the fungitoxicity of phenolic acids against A. solani with no phytotoxicity on treated tomato plants, we believe that gallic acid and its derivatives might be a sustainable eco-friendly control strategy to reduce the usage of chemical fungicides partially or entirely against A. solani particularly, and fungal diseases in general.

Graphical Abstract

1. Introduction

Tomato (Solanum lycopersicum L.) is one of the most important vegetable crops worldwide and the second most consumed vegetable crop after potato. Although tomato is considered a tropical plant, it grows in temperate climates in almost every country worldwide under a broad range of production systems. In 2017, Egypt was among the top five tomato producing countries after China, India, Turkey, and the United States [1]. Fresh tomatoes, as a functional food, meet basic nutritional needs of the human body because it has a conservable amount of minerals, and antioxidant compounds, such as polyphenols [2,3].
According to the compendium of tomato diseases and pests, tomato plants might be threatened by more than 60 phytopathogens, including viruses, bacteria, fungi, and oomycetes, which cause serious diseases and considerable yield losses [4]. Among these diseases, early blight disease is considered one of the most destructive foliar diseases of tomato plants and other plant species in the family Solanaceae, including potato, eggplant, and pepper [4,5,6,7]. Early blight disease is caused by the formal deuteromycetous fungus Alternaria solani (Ellis and G. Martin) Sorauer (recently belonging to Ascomycota: Pleosporaceae) [4,6,8]. A. solani reproduces asexually by multicellular conidia which can form visible necrotic lesions 2–3 days postinfection and reproduce new conidia 3–5 days later [6,9]. This relatively short disease cycle allows for polycyclic infection [6,9]. Moreover, A. solani is commonly known to be a necrotrophic fungus that kills the host’s tissues using enzymes and producing numerous toxins [6]. Subsequently, it feeds and derives nutrients from the dead tissues [6,10]. A. solani can infect all aerial parts of the plant including leaves, stem, twigs, and fruits, which ultimately affects the plant growth process. The most characteristic symptoms of early blight disease include severe necrotic lesions on the stem and occasionally on the fruits. On leaves, disease symptoms are observed firstly on lower and older leaves as dark-brown to black spots with concentric rings forming the unique “bullseye” patterned leaf spots. On tomato fruit, A. solani invades the area around the stem end and through cracks and wounds causing bullseye-patterned spots that are brown with dark concentric circles similar to those on leaves. Under favorable conditions, mature lesions are typically covered by a black mass of fungal mycelia and spores. A. solani might cause complete defoliation, substantial yield losses, and plant death, if not adequately managed [4,11].
Early blight disease is managed by growing resistant cultivars, crop rotation, sanitation, nutrition management, and mainly by using chemical fungicides because of their rapid effects. However, fungicide application is costly, has health risks, and is environmentally dangerous [12,13]. Moreover, the routine use of the same fungicide might boost the potential risk of developing aggressive fungicide-resistant strains [14,15] and might cause toxicity to nontarget beneficial microorganisms. In response to these concerns, more sustainable alternative control strategies are required to reduce the usage of fungicides entirely or partially by combining safe and environment-friendly methods.
Phenolic compounds could be a promising alternative strategy for crop protection. Phenolic compounds are a small group of secondary metabolites, synthesized from the amino acid, phenylalanine, through the shikimic acid and phenylpropanoid pathways [16]. They exist in either a soluble or a bound form in most plant tissues [14,15]. They are characterized by containing hydroxylated aromatic ring (phenol group) and could be divided into distinct subgroups based on their chemical structures including phenolic acids, flavonoids, tannins, coumarins, lignans, and curcuminoids [15]. They also play a key role in plant adaptation to biotic and abiotic stresses, particularly plant defense against fungal pathogens and insects [17].
During the last decade, significant efforts have been made using naturally produced phenolic compounds, particularly the phenolic-rich plant extracts, against different Alternaria species. Of which, an extract rich in caffeic, ferulic, and tannic acids prepared from Argemone mexicana exhibited significant in vitro antifungal efficacy against A. cajani, A. solani, Bipolaris sp., Cercospora sp., Curvularia sp., Fusarium udum, Helminthosporium sp., Sphaerotheca sp., and Ustilago cynodontis [18]. Moreover, the plant extract of wild pepper (Capsicum annuum), Momordica charantia, and lemon wastes exhibited significant antifungal activities against A. alternata [19,20,21,22]. Interestingly, those extracts were rich in their content of phenolic compounds, including gallic, chlorogenic, caffeic, ρ-coumaric, and ferulic acids [19,20,21,22]. However, the physiological and biochemical mechanisms behind this role are poorly understood.
Gallic acid [C6H2(OH)3COOH] is a trihydroxybenzoic acid, a natural polyphenol compound, found in several plant species, and has been shown to have antifungal and antibacterial properties [23]. For example, gallic acid and five of its derivatives including methyl gallate, (-)-Shikimic acid-3-O-gallate, 1-O-methyl-D-chiro-inositol, (-)-epi-catechin, (-)-epicatechin-3-gallate, and kaempferol-3-(6″-galloyl) glucoside) have been extracted and isolated from Mezoneuron benthamianum leaves and showed antimicrobial activities against Gram-positive bacteria (Staphylococcus aureus and Bacillus subtilis), Gram-negative bacteria (E. coli and Pseudomonas aeruginosa), and the fungus, Candida albicans [24]. Similarly, gallic acid and its derivatives isolated from the galls caused by the Chinese sumac aphid (Schlechtendalia chinensis) on the nutgall sumac tree (Rhus javanica) negatively affected the conidial germination and appressorium formation of Magnaporthe grisea, the causal agent of rice blast disease [25]. However, to the best of our knowledge, the potential antifungal roles of gallic acid and its derivatives are poorly studied.
Herein, we aimed to investigate the potential in vitro antifungal properties of gallic acid and two of its derivatives (syringic acid and pyrogallic acid) against A. solani. In addition, the physiological and biochemical effects of these compounds on A. solani-infected tomato plants were investigated under greenhouse conditions using the whole plant bioassay. Moreover, we believe that gallic acid and its derivatives are sustainable, alternative, and eco-friendly control strategies to reduce the usage of chemical fungicides partially or entirely against fungal diseases.

2. Materials and Methods

2.1. Tested Compounds

Gallic acid (GA), pyrogallic acid (PA), and syringic acid (SA) (Supplementary Figure S1) were purchased from Sigma-Aldrich, Germany. A 1000-ppm stock solution of each phenolic acid was obtained by dissolving in 100% dimethyl sulfoxide (DMSO).

2.2. Plant Materials and Growth Conditions

The tomato (Solanum lycopericum L.) susceptible cultivar Super strain B – F1 hybrid was used as an experimental model in all experiments throughout this study. Seeds were obtained from the Vegetable Disease Research Department, Plant Pathology Research Institute, Agricultural Research Center, Egypt, and sown into sterile seed starting pots for two weeks. Pots were placed on a benchtop in a climate-controlled greenhouse (27 ± 3 °C, 75 ± 5% RH, and 16:8 h L/D photocycle) located at Vegetable Disease Research Department, Sakha Agricultural Research Station, Sakha, Kafr El-Shaikh, Egypt (31.094059° N, 30.933899° E). After two weeks, seedlings (approximately 10 cm tall) were transplanted into plastic pots (30 cm diameter) filled with sterilized clay soil and maintained in the same growth conditions described above. Unless otherwise stated, treatments were applied 15 days post-transplanting (dpt). All other horticultural practices were performed as recommended for the summer season. All experiments were arranged in a randomized block design with six biological replicates (total of six plants per replicate).

2.3. Isolation and Identification of the Pathogen

Three isolates of A. solani were obtained from tomato commercial fields early in 2019. Briefly, tomato plants infected with early blight and showing its typical symptoms were collected from different localities of Kafrelsheikh Governorate, Egypt. Diseased leaves, stems, and fruits were cut into small pieces (5 mm), surface sterilized with 10% sodium hypo chloride solution for one minute, and then washed four times with sterilized distilled water (SDW). Samples were dried between two layers of sterilized filter papers and cultured on potato dextrose agar (PDA) medium in 9 cm Petri dishes at 25 °C for 7 days [26]. The developed fungal culture was purified by a single spore culture method. These isolates were microscopically examined and identified as A. solani based on their morphological features including conidia size, presence and size of a beak, the pattern of catenation, and longitudinal and transverse septation [27,28,29,30,31] (Supplementary Figure S2). Subsequently, these isolates were confirmed as A. solani based on their pathogenicity and characteristic symptoms of early blight disease on tomato plants.

2.4. Pathogenicity Test

The three purified isolates were tested for their pathogenicity on tomato susceptible cultivar (Super strain B–F1 hybrid) in pot experiments under greenhouse conditions. Briefly, 7-day old cultures of A. solani were ground in 50 mL SDW using a sterilized pestle and mortar; it was filtered through a sterilized muslin cloth in a clean test tube aseptically according to Pandey et al. (2002) [32]. Subsequently, cultural suspensions (106 spores mL−1) were separately prepared for each isolate in sterilized water. After transplanting, tomato seedlings were sprayed with spore suspension (30 mL plant−1), while the control plants were sprayed with the same amount of distilled water. The inoculated plants were covered with polythene bags for 24 h to increase the humidity and after that, the plants were kept under greenhouse conditions. Disease incidence (DI%) was evaluated and data were collected three times regularly (7, 14, and 21 days post-inoculation (dpi)) to observe the progress of early blight disease. The experiment was repeated twice with the same experimental design as described above.

2.5. Antifungal Activity

The agar diffusion method was used for antifungal activity [33]. Phenolic acids (GA, PA, and SA), as well as the fungicide difenoconazole 25 EC (commercial name Score, 25%) dissolved in DMSO, were mixed with 20 mL PDA medium in a sterilized Petri dish to obtain the desired concentration (20, 40, 60, 80, and 100 ppm), while 1% sterilized DMSO was used as a negative control. The final concentration of DMSO in the PDA was 1%. A 5 mm-diameter mycelial plug of the pathogenic fungus was inoculated on the Petri dishes, and the fungal growth was recorded after incubation at 27 °C for 7 days until the fungus grew to a full plate in the control. The experiment was repeated twice with the same experimental design as described above. The percentage of growth inhibition was calculated using the following equation:
Inhibition   ( % ) = C T C × 100
where “C” is mycelia growth in the control and “T” is mycelia growth in the treatment. The assay was performed with six replicates.

2.6. The Half-Maximal Inhibitory Concentration (IC50)

Serial concentrations of three compounds (0, 20, 40, 60, 80, and 100 ppm), were prepared by mixing appropriate volumes of each compound with the PDA medium. The half-maximal inhibitory concentration (IC50: the concentration required to inhibit 50% of the mycelial growth), as well as the IC99, were calculated. The probit regression analysis was used to fit the probit/logit sigmoid dose–response curves and to calculate different inhibitory concentrations with 95% confidence intervals (CI). The experiment was repeated twice with the same experimental design as described above.

2.7. Pot Experiment, Disease Assessments, and Collection of Samples

Two pot experiments were conducted to evaluate the effect of phenolic acids (GA, PA, and SA) and fungicide on the incidence of early blight disease on greenhouse-tomato in two seasons (2019 and 2020). Thirty cm pots filled with sterilized clay soil were arranged in a randomized complete block design. Plants (approximately 30 days old) were infected with the most aggressive isolate of A. solani. Inoculum (5 × 10⁴ conidia mL−1) was prepared in sterilized water from ten-day old culture of A. solani. Tomato plants were sprayed using a manual 1-gallon atomizer multipurpose pump sprayer (Chapin 20541, Chapin International Inc., Batavia, NY, USA) with operating pressure between 40 and 60 PSI and a 0.45 GPM flow rate. till runoff. Tomato plants were sprayed with phenolic compounds solution with 100 ppm concentration (30 mL plant−1) after 24 h post-inoculation (hpi). On the 7th, 14th, and 21st days post-treatment (dpt), the disease severity of early blight was evaluated, based on the five-point (0–5) score, as the percentage of leaf area covered by necrotic lesions: [34] 0 = free from infection; 1 = one or two necrotic spots on a few lower leaves of the plant; 2 = a few isolated spots on leaves, covering nearly 5–10% of the surface area of the plant; 3 = many spots coalesced on the leaves, covering 25% of the surface area of the plant; 4 = irregular, blighted leaves and sunken lesions with prominent concentric rings on the stem, petiole, and fruit, covering 40–50% of the surface area; 5 = the whole plant blighted, leaves and fruits starting to fall, and foliar part free of disease. For each treatment, six biological replicates were analyzed. For sampling, two leaves were collected from each plant (2nd and 3rd leaves) at 1, 3, and 5 dpt. The leaf tissues were quickly frozen in liquid nitrogen and stored at −80 °C until further analysis.

2.8. Enzymes Activity

For enzyme analysis, 0.5 g leaves tissues were homogenized in 3 mL of 0.05 M Tris buffer (pH 7.8), containing 0.001 M EDTA–Na2 and 7.5% Polyvinylpyrrolidone at 0–4 °C. The homogenates were centrifuged (12,000 rpm, 20 min, 4 °C), and the total soluble enzyme activity in the supernatant was measured colorimetrically using a UV-160A spectrophotometer (Shimadzu, Japan). Catalase (CAT) activity was determined according to Aebi (1984) [35]. The activity of guaiacol-dependent peroxidases (POX) was assayed by measuring the formation of the guaiacol-bound product at 436 nm [36]. Polyphenol oxidase (PPO) activity was determined according to the method described by Malik and Singh (1980) [37].

2.9. Chlorophyll Content

The chlorophyll content (chlorophyll index) when measuring the greenness in the fifth leaf tip fully expanded leaf using the SPAD-501 portable leaf chlorophyll meter (Japan Minolta) was measured according to the method described by Yadawa (1986) [38].

2.10. Total Soluble Phenolic Compounds

Total soluble phenolics were determined using Folin-Ciocalteu reagent (FCR) according to Kähkönen et al. (1999) [39] with slight modifications. Briefly, 1.0 mL FCR (10%) was added to 200 μL methanolic extract (80%) of a mixture of various fresh tomato leaves, then vortexed. After 3 min, 800 μL of 7.5% (w/v) sodium carbonate was added to the mixture. After shaking, the mixture was incubated at room temperature for 30 min, and the absorption was measured at 765 nm using a UV-160A spectrophotometer (Shimadzu, Japan). The concentration of phenolics was expressed as mg Gallic Acid Equivalents (GAE) per gram fresh weight (g FW).

2.11. Total Soluble Flavonoids

Total soluble flavonoids were determined according to the method described by Djeridane et al. (2006) [40]. Briefly, 1 of methanolic extract of each sample was mixed with 1 mL aluminum chloride (2% in methanol). After shaking, the mixture was vigorously shook and incubated for 15 min at room temperature, and then the absorption at 430 nm was measured using a UV-160A spectrophotometer (Shimadzu, Japan). Flavonoid concentration was expressed as mg Rutin Equivalent (RE) per g FW.

2.12. Vegetative Growth and Yield Assessment

Fresh and dry weight per plant, number of leaves per plant, and plant height (cm) were assessed for all treatments and control in both experiments after 45 dpt from a sample of six biological replicates each. After drying in an oven at 70 °C for three days, the shoots’ dry weight was recorded. The average number of flowers and fruits and weight of fruits of each plant for sale size were also measured.

2.13. Statistical Analysis

All experiments were designed using a randomized complete block design. All experiments were repeated twice with six biological replicates for each treatment. All data matrices were statistically analyzed according to the analysis of variance technique (ANOVA), followed by posthoc pairwise comparisons using the Tukey–Kramer honestly significant difference test (Tukey HSD), at p ≤ 0.05. Simple linear regression analysis was performed to better understand the relationship between disease severity and time post-treatment. The fitted regression model was stated as a regression equation, coefficient of determination (R2), and p-value as determined by the F-test (p ≤ 0.05).
Furthermore, principal component analysis (PCA) was performed using all data points of individual response variables, and its associated loading-plot was also generated. Moreover, similarities and variations in all response variables were presented as a heat map, combined with two-way hierarchical cluster analysis (HCA) using the standardized means of all data matrices for the studied treatments. Finally, correlation analysis was conducted to evaluate the relationships among all studied response variables (disease parameters, biochemical measurements, vegetative growth parameters, and yield components). Correlation coefficients (r) are presented as a heatmap.
Tree software used for data analysis in this study included: JMP Data analysis software—Version 14 [41] for ANOVA, HCA, and a heatmap; PAleontological STatistics (PAST)—Version 3 [42] for PCA analysis; and MedCalc statistical software—Version 19.3.1 [43] for the probit analysis.

3. Results

3.1. Pathogenicity Test of Different Isolates of A. solani on Tomato Plants

Although all obtained fungal isolates were able to infect tomato plants causing typical early blight symptoms (Figure 1A), isolate #1 was the most aggressive isolate in two separate experiments (Figure 1B,C, respectively). Isolate #1 had the highest disease severity (%) on tomato plants (25.02 ± 2.25, 47.92 ± 4.97, and 72.50 ± 7.52% in experiment I and 26.35 ± 3.36, 43.76 ± 5.57, and 69.03 ± 8.79% in experiment II at 7, 14, and 21 days postinoculation, respectively). Therefore, isolate #1 of A. solani was selected for subsequent studies.

3.2. In Vitro Antifungal Activity of Gallic Acid and Its Derivatives

The in vitro antifungal activity of gallic acid and its derivatives, pyrogallic acid, and syringic acid, indicated that all assessed compounds showed fungistatic action and significantly inhibited the mycelial radial growth of A. solani in a dose-dependent manner (Figure 2A), and the mycelial growth inhibition (%) was directly proportional to the concentration of different compounds. At the highest concentration (100 ppm), syringic acid was the most effective compound that recorded the highest inhibition of mycelia growth (90.74 ± 1.52 and 89.48 ± 5.62% in experiment I and experiment II, respectively) followed by gallic acid (82.96 ± 4.02 and 82.55 ± 5.86% in experiment I and experiment II, respectively), and pyrogallic acid (74.07 ± 2.87 and 72.08 ± 4.81% in experiment I and experiment II, respectively) (Figure 2B,C). It is worth noting that the susceptibility of A. solani to gallic acid (80 ppm) and syringic acid (100 ppm) were comparable to difenoconazole fungicide (positive control), without any significant difference between them, suggesting similar potency.
Furthermore, the probit regression lines (also known as dose–response plots) are presented in Figure 3. According to slope values, gallic acid (Figure 3B) and its derivatives—pyrogallic acid (Figure 3C) and syringic acid (Figure 3D)—exhibited the same trend. In addition, the high slope value of syringic acid (y =3.20x − 5.43, Cox and Snell R2 = 0.3799, p < 0.0001) indicates a potentiating effect on antifungal activity over the other tested compounds against A. solani.
Moreover, the half-maximal inhibitory concentration (IC50) and the IC99 of gallic acid and its derivatives were calculated and presented in Table 1. The bioassay indicated that gallic acid had potent antifungal effects against the radicle growth of A. solani (IC50 = 48.81 ppm), followed by syringic acid (IC50 = 49.75 ppm). However, syringic acid had the lowest IC99, followed by gallic acid (Table 1).

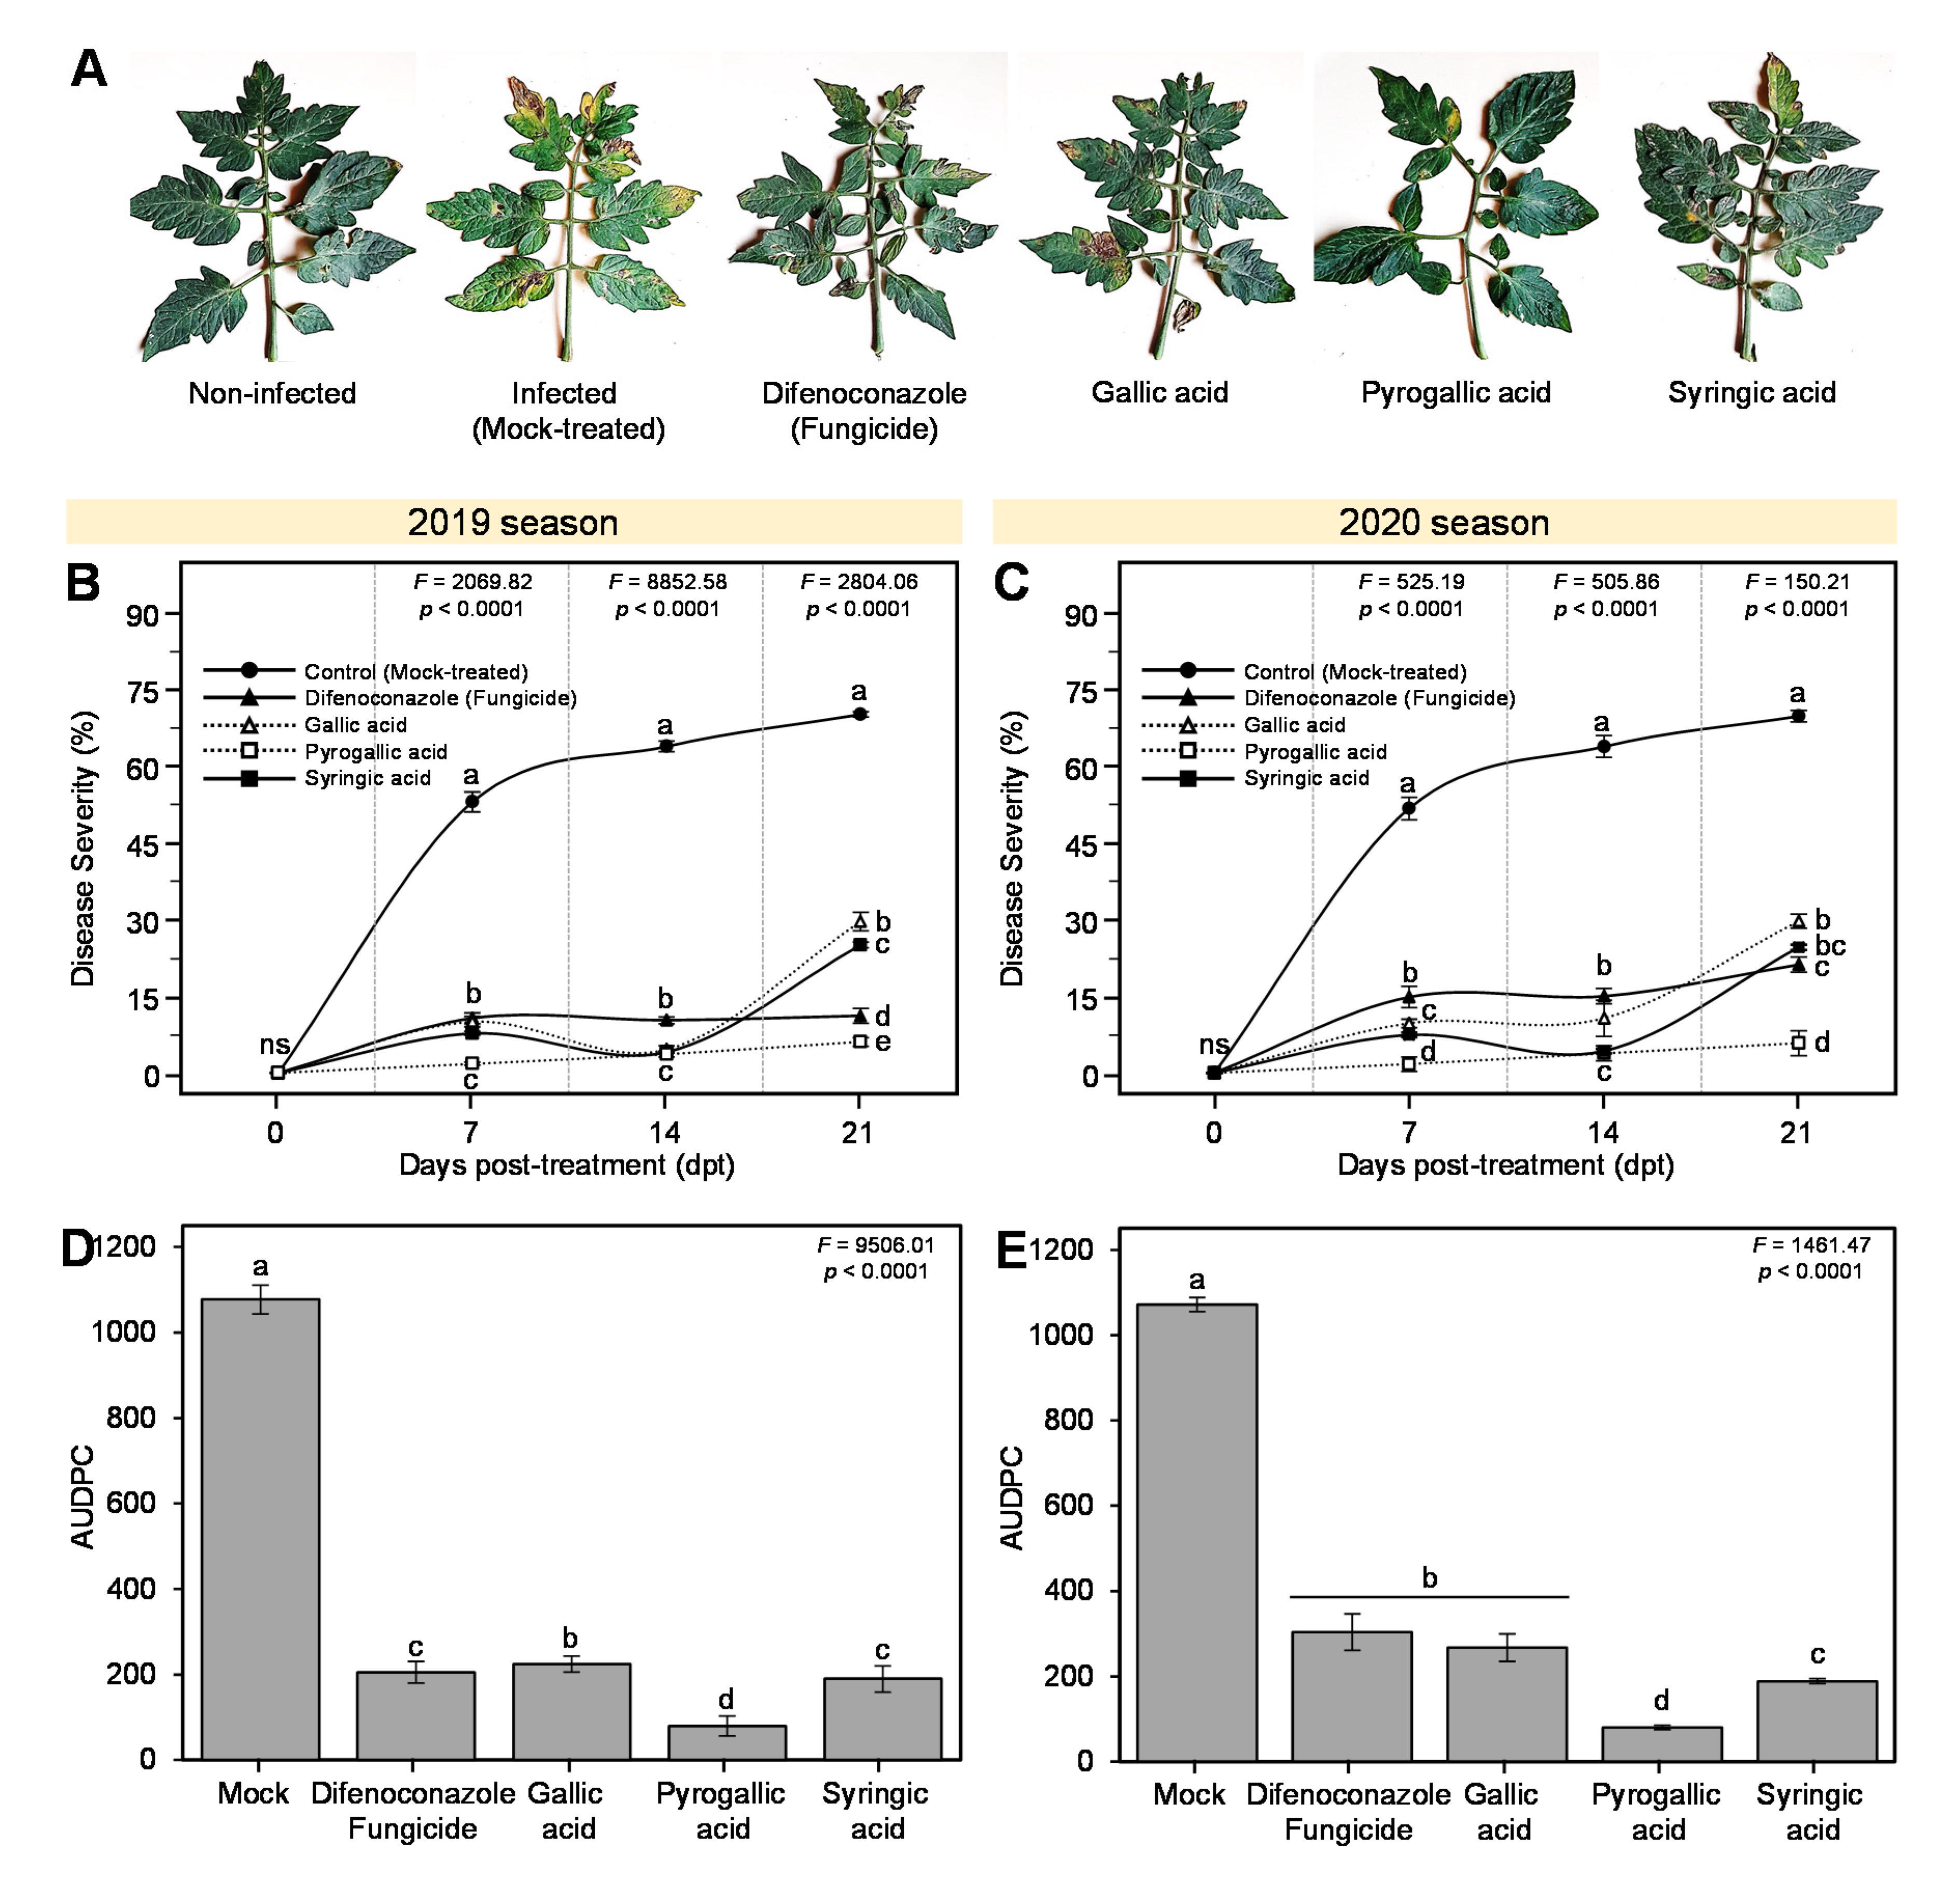
3.3. Effects of Gallic Acid and Its Derivatives on the Development of Early Blight Disease

Generally, both in vivo experiments in 2019 and 2020 seasons showed that the exogenous treatment with gallic acid and its derivatives efficiently suppressed the development of tomato early blight symptoms at 7 dpt (Figure 4A). Although the mock-treated infected control showed a clear progressive increase in disease severity (%) throughout the experiment, all tested compounds significantly reduced the disease severity (%) in two separate experiments (Figure 4B,C). Pyrogallic acid was the most effective compound and had the lowest disease severity (%) throughout the experiment (2.73 ± 0.31, 4.62 ± 0.52, and 6.99 ± 0.82%) in 2019 season and (2.70 ± 0.45, 4.83 ± 0.45 and 6.80 ± 0.43) in 2020 season at 7, 14, and 21 dpt, respectively, compared with mock control and difenoconazole fungicide (Figure 4B,C).
Moreover, simple linear regression between disease severity (%) and time post-treatment with gallic acid or its derivatives showed that exogenous treatment with gallic acid and its derivatives significantly reduced the slope/steepness of the regression lines. In both seasons, pyrogallic acid had the lowest slope value, followed by syringic acid, and gallic acid (Supplementary Figure S3A,B).
Furthermore, the area under the disease progress curve (AUDPC) was significantly reduced due to the treatment with gallic acid or its derivatives (Figure 4D,E). Although the highest values of AUDPC was recorded by the mock-treated control (1077.29 ± 33.98 and 1071.51 ± 16.98 in 2019 and 2020 seasons, respectively), pyrogallic acid had the lowest AUDPC value (79.42 ± 23.34 and 80.16 ± 5.18 in 2019 and 2020 seasons, respectively), which was significantly lower than the positive control (204.91 ± 25.50 and 303.69 ± 42.85 in 2019 and 2020 seasons, respectively). Taken together, these findings indicate that the exogenous treatment with gallic acid and its derivatives alleviates the harmful effects of A. solani on tomato leaves and suppresses the development of the disease symptoms.

3.4. Impact of Gallic Acid and Its Derivatives on Growth Parameters of A. solani-Infected Tomato Plants

Throughout our greenhouse experiment, no phytotoxic symptoms on the treated plants were observed. Additionally, no significant differences were noticed in plant height (Table 2) or the number of leaves per plant (Table 2) of treated plants, which support our observation that the application of gallic acid and its derivatives has no phytotoxic effect on tomato plants. Nevertheless, the exogenous treatment with gallic acid and its derivatives greatly increased both shoot fresh weight per plant and shoot dry weight per plant compared with the untreated and score-treated control plants (Table 2). Pyrogallic acid recorded the highest fresh and dry weight (38.63 ± 1.38 and 7.45 ± 0.16 g plant−1, respectively), followed by gallic acid (32.83 ± 1.97 and 6.11 ± 0.09 g plant−1, respectively), even higher than the difenoconazole fungicide (23.53 ± 1.89 and 5.05 ± 0.07 g plant−1, respectively). Moreover, exogenous treatment with pyrogallic acid significantly increased the chlorophyll content (36.68 ± 8.63) compared with mock-treated (10.55 ± 6.89) and was comparable to difenoconazole and syringic acid-treated plants (Table 2).

3.5. Effects of Gallic Acid and Its Derivatives on Chlorophyll, Total Phenolics, and Total Flavonoid Content of A. solani-Infected Tomato Plants

The total soluble phenolic content fluctuated after the treatment with gallic acid and its derivatives (Figure 5A). It is worth noting that the total soluble phenolic content increased after the treatment with gallic acid at 1 dpt (8.19 ± 0.32 and 8.62 ± 0.70 mg GAE g−1 FW during 2019 and 2020 seasons, respectively) and continued until it reached its highest peak after 3 dpt (14.51 ± 1.20 and 14.19 ± 1.26 mg GAE g−1 FW during 2019 and 2020 seasons, respectively), then plummeted again at 5 dpt (7.28 ± 1.07 and 8.70 ± 0.90 mg GAE g−1 FW during 2019 and 2020 seasons, respectively) (Figure 5A,B). Likewise, the total soluble flavonoid content fluctuated after the treatment with gallic acid and its derivatives (Figure 5C,D). In both seasons, the total soluble flavonoid content increased dramatically after 24 h post-treatment with syringic acid (1.34 ± 0.23 and 1.16 ± 0.08 mg RE g−1 FW during 2019 and 2020 seasons, respectively) and stabilized until 3 dpt (1.57 ± 0.16 and 1.44 ± 0.12 mg RE g−1 FW during 2019 and 2020 seasons, respectively), which was comparable with the positive control (difenoconazole fungicide; 1.69 ± 0.16 and 1.75 ± 0.08 mg RE g−1 FW during 2019 and 2020 seasons, respectively), but it dropped thereafter when measured at 5 dpt (0.82 ± 0.36 and 1.30 ± 0.14 mg RE g−1 FW during 2019 and 2020 seasons, respectively) (Figure 5C,D).

3.6. Effects of Gallic Acid and Its Derivatives on the Activity of Defense-Related Enzymes of A. solani-Infected Tomato Plants

The enzymatic activities of catalase, peroxidase, and polyphenol oxidase fluctuated after the treatment with gallic acid and its derivatives during 2019 and 2020 seasons. Catalase activity dramatically increased 1 dpt with gallic acid and 3 dpt with syringic acid (Figure 6A,B). On the other hand, exogenous treatment with gallic acid and its derivatives slightly increased the peroxidase activity after 3 dpt. However, peroxidase activity increased dramatically after 5 dpt, with superiority for pyrogallic acid over both controls and other treatments (Figure 6C,D). Although the treatment with difenoconazole fungicide dramatically elevated the activity polyphenol oxidase at 1 dpt, it suddenly dropped below other treatments with pyrogallic acid, gallic acid, and syringic acid at 3 dpt (Figure 6E,F). At 5 dpt, the activity polyphenol oxidase reached its highest peak after the treatment with syringic acid.

3.7. Impact of Gallic Acid and Its Derivatives on Yield Components of A. solani-Infected Tomato Plants

Generally, the treatment with gallic acid and its derivatives significantly increased all yield components of A. solani-infected tomato plants including the total number of flowers per plant, the number of fruits per plant, fruit yield (kg) per plant, and fruit yield increase over the control compared with the mock-treated plants during 2019 and 2020 seasons (Table 3). Among all tested compounds and difenoconazole fungicide, A. solani-infected tomato plants treated with pyrogallic acid had the highest number of flowers (9.67 ± 1.37 and 11.00 ± 1.41 flowers plant−1 during 2019 and 2020 seasons, respectively), number of fruits (19.67 ± 1.21 and 21.33 ± 4.03 fruits plant−1 during 2019 and 2020 seasons, respectively), and fruit yield (2.07 ± 0.06 and 2.50 ± 0.17 kg plant−1 during 2019 and 2020 seasons, respectively) with an average increase over the mock-treated control of 243.05 ± 7.01 and 272.10 ± 18.63% during 2019 and 2020 seasons, respectively (Table 3).

3.8. PCA and HCA Analyses Revealed the Differences between Gallic Acid and Its Derivatives

The PCA-associated scatter plot showed a clear separation among all studied compounds (gallic acid, pyrogallic acid, and syringic acid) and the two controls (mock control and difenoconazole fungicide) in both seasons with respect to PC1 (49.71% and 55.58% during 2019 and 2020 seasons, respectively) and PC2 (21.23% and 20.56% during 2019 and 2020 seasons, respectively) (Figure 7A,B). Interestingly, the data matrices of gallic acid, pyrogallic acid, and difenoconazole fungicide were clustered together in the center of the scatter plot and separately from other treatments in both seasons 2019 and 2020 (Figure 7A,B). On the other hand, the data matrix of syringic acid was clustered separately at the top of the scatter plot (Figure 7A,B). Moreover, the PCA-associated loading plot showed that while AUDPC and disease severities at 7, 14, and 21 dpt were positively correlated with the mock treatment, all other growth traits, yield components, phytochemical responses, and enzymatic activities were positively correlated with the application of gallic acid and its derivatives (Figure 7C,D).
In addition, the HCA and its associated heatmap were performed using the individual responding variables (Figure 7E,F). In agreement with our PCA findings, gallic acid and pyrogallic acid were clustered together separately from the mock control (Figure 7E,F). On the other hand, the HCA-associated dendrogram among the responding variables showed that all tested parameters were separately clustered into five distinct clusters. Cluster “I” included all disease parameters (disease severities and AUDPC), and total phenolics at 5 dpt was higher in mock-treated plants but significantly reduced in other treatments (Figure 7E,F). Cluster “II” included only three traits which were total soluble phenolics (1 and 3 dpt) and catalase activity (1 dpt), which were higher in gallic acid-treated plants than other treatments. Cluster “III” included CAT activity at 5 dpt, PPO activity at 1 dpt, and total flavonoids at 3 dpt, which were higher after the treatment with difenoconazole fungicide than other treatments (Figure 7E,F).
Whereas cluster “IV” included all growth traits (i.e., plant height, the number of leaves per plant, shoot fresh and dry weight per plant), all yield components (i.e., number of flowers per plant, the number of fruits per plant, fruit yield (kg) per plant), two phytochemical responses (i.e., chlorophyll content and total soluble flavonoid content at 5 dpt), and enzymatic activities of POX at 3 and 5 dpt and PPO at 3 dpt were higher in pyrogallic acid-treated plants than other treatments (Figure 7E,F). Cluster “V” included the CAT activity at 3 dpt, POX activity at 1 dpt, PPO activity at 5 dpt, and total soluble flavonoid content at 1 dpt, which were higher in the syringic acid-treated plants than other treatments (Figure 7E,F).

3.9. Correlation Analysis between Disease Parameters, Growth Traits, Yield Components, and Other Phytochemical Responses of A. solani-Infected Tomato Plants

The relationship between disease parameters (i.e., disease severity and AUDPC), growth traits (i.e., plant height, the number of leaves per plant, shoot fresh and dry weight per plant), yield components (i.e., number of flowers per plant, the number of fruits per plant, fruit yield (kg) per plant), and other phytochemical responses (i.e., chlorophyll content; total soluble phenolic content; total soluble flavonoid content; enzymatic activities of catalase, peroxidase, and polyphenol oxidase activity) of A. solani-infected tomato plants was determined during 2019 and 2020 seasons using correlation analysis (Figure 8). In mock-treated plants, disease parameters were negatively correlated with yield components during 2019 and 2020 seasons (Figure 8A,B). However, treatment with difenoconazole fungicide, gallic acid, and its derivatives significantly weakened this correlation.
In gallic acid-treated plants, the shoot dry weight was highly and positively correlated with the number of fruits per plant and fruit yield, whereas fruit yield was positively correlated with catalase activity at 1 dpt and peroxidase activity at 3 dpt during both experiments. On the other hand, AUDPC was positively correlated with disease severity at 7 and 21 dpt, but negatively correlated with chlorophyll content, total soluble phenolic content at 1 and 3 dpt, total soluble flavonoid content at 3 dpt, catalase activity at 1 dpt, and peroxidase activity at 3 dpt during 2019 and 2020 seasons (Figure 8C,D, respectively).
In pyrogallic acid-treated plants, the fruit yield was positively correlated with shoot fresh weight per plant, the number of leaves per plant, catalase activity at 1 dpt, and peroxidase activity at 3 dpt. On the other hand, AUDPC was positively correlated with disease severity at 7 and 21 dpt, but negatively correlated with plant height; total soluble phenolic content at 3 and 5 dpt; total soluble flavonoid content at 1, 3, and 5 dpt; and polyphenol oxidase activity at 1 and 3 dpt during 2019 and 2020 seasons (Figure 8C,D, respectively).
In syringic acid-treated plants, fruit yield was positively correlated with the chlorophyll content; total soluble phenolics at 1 dpt; total soluble flavonoids at 1 and 3 dpt; peroxidase activity at 1, 3, and 5 dpt; and polyphenol oxidase activity at 1 dpt, whereas AUDPC was positively correlated with disease severity at 21 dpt but highly negatively correlated with total soluble flavonoids at 1 and 3 dpt, catalase activity at 3 dpt, and polyphenol oxidase activity at 1 dpt (Figure 8E,F, respectively).

4. Discussion

Phenolic compounds are ubiquitously distributed metabolites in higher plants [16,44], and they play an important role in plant defenses against biotic and abiotic stresses [45], particularly the phytopathogenic fungi [17,46]. Moreover, numerous phenolic acids and phenolic-rich extracts exhibited high inhibitory effects on the radial growth of fungi [18,47]. Although considerable attempts have been made using naturally phenolic-rich products against Alternaria alternata [19,20,21,22,48,49,50,51], very few reports are available about their roles against A. solani. Nevertheless, the physiological and biochemical mechanisms behind this role are poorly understood.
In this study, we tested the potential antifungal properties of gallic acid and its derivatives (syringic and pyrogallic acids) against A. solani. We also investigated the physiological and biochemical effects of these compounds on infected tomato plants using the whole plant bioassay. Syringic acid was the most effective compound against A. solani among tested phenolic acids that recorded the highest inhibition of mycelial growth, and it was comparable to difenoconazole fungicide (positive control), without any significant difference between them, suggesting similar potency. The difenoconazole fungicide has been proven to be effective in controlling tomato early blight disease and negatively affecting the radial growth and disease severity of A. solani [52]. In agreement with these findings, pyrogallic acid possessed antimicrobial activities against the human pathogen, Vibrio parahaemolyticus, and the plant pathogen, Fusarium oxysporum [53,54,55]. Likewise, gallic acid exhibited strong antifungal activity against Fusarium solani [56]. Collectively, and based on our in vitro observations, we suggest that all tested compounds might have fungistatic action and are able to inhibit the mycelial radial growth of A. solani in a dose-dependent manner.
Moreover, we showed that exogenous application of gallic acid and its derivatives efficiently suppressed the development of tomato early blight symptoms and significantly reduced the disease severity and area under the disease progress curve (AUDPC) of tomato early blight. This might be due to the elevated endogenous phenolic content. Previous studies showed that logarithmic regression of inverse correlation showed that the disease progression/AUDPC of spot blotch disease in bread wheat, caused by the hemibiotrophic fungus Bipolaris sorokiniana, was strongly negatively correlated with the pathogen-induced content of phenolic acids, syringic acid, chlorogenic acid, 4-hydroxybenzoic acid, and caffeic acid [57,58]. Interestingly, our findings showed that the total soluble phenolic content increased markedly after the treatment with gallic acid and its derivatives. We suggest that gallic acid and its derivatives might function as defensive phytochemicals with antifungal properties. Taken together, these findings indicate that the exogenous treatment with gallic acid and its derivatives alleviates the harmful effects of A. solani on the leaf surface of tomato plants and suppresses the development of the disease symptoms.
Phenolic acids might be fungitoxic in nature [59,60]. Previously, it has been shown that the elevated levels of endogenous syringic acid in infected plants were associated with an inhibitory effect on the pathogen growth [59,61,62,63]. For instance, syringic acid accumulation was fungitoxic to Ganoderma boninense, the causal agent of basal stem rot of oil palm [59,60], and Didymella applanate, the causal agent of spur blight of red raspberries [64]. In this study, we demonstrated that the exogenous application of gallic acid and its derivatives induced the accumulation of total phenolics, which were strongly negatively related to disease progression and could directly inhibit the A. solani growth in vitro and on infected plants. It is worth mentioning that throughout our experiment, no phytotoxic symptoms were observed in the treated tomato plants.
Furthermore, the exogenous spraying tomato plants with tested compounds greatly increased growth parameters and chlorophyll compared with the control plants (mock-treated plants) and fungicide-treated plants. In line with these results, it has recently been reported that phenolic compounds such as ferulic acid, chlorogenic acid, and protocatechuic acid significantly increased the endogenous content of photosynthetic pigments including chlorophyll a, and chlorophyll b in Rhododendron delavayi [65]. A similar study proved that those phenolic compounds and their derivatives are known for their various functions in plants, such as pigmentation, growth parameters, and resistance against plant pathogens such as fungi [48].
Plants under stress can produce reactive oxygen species (ROS). Scavenging overproduction of ROS could be achieved through the activity of a complex group of enzymatic and nonenzymatic antioxidants [66]. The chemical structure of phenolic compounds confers their antioxidant properties, where each molecule contains a hydroxylated aromatic ring, carboxylic group, and/or methoxyl group [67]. Therefore, our findings suggested that treatment with gallic acid and its derivatives decreases the oxidative stress resulting in A. solani-infected plants. For example, syringic acid as a phenolic compound possesses antioxidant where it could scavenge free radical and antimicrobial activities against various microorganisms [68]. Recently, it has been proven that phenolic acids enhanced the tolerance of tomato plants to infection with Botrytis cinerea through reducing oxidative stress [69]. Herein, we showed that total soluble phenolics and total soluble flavonoids were significantly increased in infected plants treated with gallic acid and its derivatives compared with control plants. Generally, these compounds were elevated under various stresses such as infection with plant pathogens, and they act as strong antioxidants, where they can function as scavengers of ROS and protect cells from oxidative stress [70].
Moreover, our findings showed that the total phenol and flavonoid contents were lower at 5 dpt, while the levels of both polyphenol oxidase and peroxidase were significantly increased at the same time point. We assume that phenolics might provide an adequate substrate for oxidative reactions catalyzed by polyphenol oxidase or peroxidase, which are consuming oxygen and producing fungitoxic quinones that make the medium unfavorable to the further development of pathogens [17].
The present investigation revealed that the activity of catalase significantly increased in inoculated tomato plants and those treated with gallic acid and its derivatives especially, at 1 dpt. In agreement with these findings, the level of antioxidant enzymes such as catalase and glutathione peroxidase was elevated under biotic stresses [71]. The increase in this activity might support stressed plants to cope with the overproduction of ROS, where catalase, the main enzyme for scavenging of hydrogen peroxide (H2O2), can regulate its concentration in cells through catalytic elimination of H2O2 during oxidative damage [72].
On the other hand, both peroxidase and polyphenol oxidase activities reached their highest peak after 5 dpt, with superiority over both controls. Peroxidase and polyphenol oxidase are related to plant defense against a wide range of plant pathogenic microorganisms [73]. Recently, it was reported that foliar application of phenolic acids on tomato plants raised the activities of phenylalanine ammonia-lyase and polyphenol oxidase [69]. Thus, phenolic acids can inhibit plant diseases, and induce the plant defense system [66]. In the present study, we observed that the activities of antioxidant enzymes slightly increased and then decreased, this may be explained by the fact that phenolic acids that reduced the oxidative stress of tomato plants resulted from inoculation with pathogenic fungus A. solani. Therefore, the severity of disease decreased as a result of foliar application.
Gallic acid and its derivatives, as well as difenoconazole fungicide, increased the yield components of tomato plants, among tested compounds pyrogallic acid recorded the highest values of all yield components. It is worth noting that the highest values of chlorophyll were achieved when tomato plants were sprayed with pyrogallic acid. Therefore, the increase in yield might be due to the high content of photosynthetic pigments in the treated leaves. In addition, foliar application with gallic acid and its derivatives reduce the disease severity and negative effect of A. solani. The correlation analysis between disease severity and yield components indicated that fruit yield had significant negative correlations with the disease severity. These results proved the negative impact of early blight disease on the fruit yield and growth traits of tomato plants in mock-treated plants, which agreed with previous studies [7]. However, treatment with difenoconazole fungicide or gallic acid and its derivatives significantly weakened this correlation, and we suggested that those compounds protected the tomato plants from pathogen attack. After using gallic acid and its derivatives, the yield components were positively correlated with enzymatic activity. Thus, the foliar application with the tested compounds plays a key role in reducing oxidative stress.
Although previous studies showed that gallic acid is relatively stable at high temperatures and ultraviolet C light (UV-C), to the best of our knowledge, it has never been tested under the field conditions. For example, degradation of polyphenols, including gallic acid, ranged from 15 to 30 % after 4 h of exposure to high temperatures (up to 100 °C), and it was about 50% after 3 h of UV-C exposure [74]. Interestingly, our finding showed that the disease progress curves of early blight disease on tomato leaves slightly increased at 21 dpt in gallic acid- and pyrogallic acid-treated plants. The thermal stability and UV-C stability of polyphenols might explain this phenomenon. In other words, the fungistatic effect of gallic acid and its derivatives fades away approximately 15 dpt, and it definitely needs to be renewed by another application. Taken together, these findings suggest that gallic acid and its derivatives might be promising therapeutic compounds against A. solani under field conditions; however, more studies are required to explore the best concentration, delivery method, and application time.

5. Conclusions

Generally, gallic acid and its derivatives (pyrogallic acid and syringic acid) inhibited the mycelial radial growth of A. solani and showed fungistatic activities in vitro in a dose-dependent manner. Moreover, they efficiently suppressed the development of tomato early blight in vivo without any phytotoxic symptoms on treated tomato plants. In addition to their positive effects on yield components, exogenous treatment with gallic acid and its derivatives enhanced the biochemical traits including chlorophyll content; total soluble phenolics; total soluble flavonoids; and the enzymatic activities of catalase, peroxidase, and polyphenol oxidase. The results obtained in this study suggest that gallic acid and its derivatives are a promising alternative eco-friendly control strategy for the early blight disease of tomato that might reduce the usage of fungicides entirely or partially.

Supplementary Materials

The following are available online at https://www.mdpi.com/2073-4395/10/9/1402/s1, Figure S1: Chemical structure of phenolic acids used in this study. (A) Gallic acid, (B) pyrogallic acid, and (C) syringic acid. Molecular weight/molar mass (g mol−1) is mentioned between parentheses beside the chemical formula of each compound. Figure S2: Morphological features of Alternaria isolates obtained from tomato commercial fields early in 2019. (A) Isolate #1, (B) isolate #2, and (C) isolate #3. Colonies were cultured on potato dextrose agar (PDA) medium in 9 cm Petri dishes and incubated at 25 °C for 7 days. Figure S3: Simple linear regression between disease severity (%) and time post-treatment with gallic acid or its derivatives during 2019 (A) and 2020 (B) seasons. Colored circles present the row data. The fitted regression line is presented as a solid-line, while the 95% confidence intervals for the estimated regression are color-shaded and edged by doted-lines. Regression equations, R2, and p-value based on the F test (p < 0.05) were also obtained and presented within the graph.

Author Contributions

A.A.E., together with A.E.-N. and Y.N., conceptualized the idea and designed the experiments. A.E.-N. and N.A.T. carried out the experiments, while Y.N. analyzed the data and prepared the figures. All authors worked together to write the original draft of the manuscript. A.A.E. and Y.N. revised and finalized the manuscript. All authors have read and agreed to the published version of the manuscript.

Funding

This research received no external funding or any specific grant from funding agencies in the public, commercial, or nonprofit sectors.

Acknowledgments

The authors wish to acknowledge the members of our department for helpful discussions and comments.

Conflicts of Interest

The authors declare there is no conflict of interest.

References

  1. FAOSTAT Food and Agriculture Organization of the United Nations. 2018. Available online: http://www.fao.org/faostat/en/#data/QC (accessed on 13 February 2020).
  2. Castagna, A.; Chiavaro, E.; Dall’Asta, C.; Rinaldi, M.; Galaverna, G.; Ranieri, A. Effect of postharvest UV-B irradiation on nutraceutical quality and physical properties of tomato fruits. Food Chem. 2013, 137, 151–158. [Google Scholar] [CrossRef]
  3. Htun, A.A.; Sein, L.L.A.; He, L.; Liu, H.F.; Deng, J.X. First report of Alternaria blumeae causing leaf blight on tomato in Myanmar. Plant Dis. 2020. [Google Scholar] [CrossRef]
  4. Jones, J.B.; Zitter, T.A.; Momol, T.M.; Miller, S.A. PART I: Infectious Diseases. In Compendium of Tomato Diseases and Pests, 2nd ed.; Jones, J.B., Zitter, T.A., Momol, T.M., Miller, S.A., Eds.; The American Phytopathological Society: Saint Paul, MN, USA, 2016; pp. 15–119. [Google Scholar]
  5. Neergaard, P. Danish Species of Alternaria and Stemphylium: Taxonomy, Parasitism, Economic Significance; Oxford University Press: London, UK, 1945. [Google Scholar]
  6. Chaerani, R.; Voorrips, R.E. Tomato early blight (Alternaria solani): The pathogen, genetics, and breeding for resistance. J. Gen. Plant Pathol. 2006, 72, 335–347. [Google Scholar] [CrossRef]
  7. Attia, M.S.; El-Sayyad, G.S.; Abd Elkodous, M.; El-Batal, A.I. The effective antagonistic potential of plant growth-promoting rhizobacteria against Alternaria solani-causing early blight disease in tomato plant. Sci. Hortic. (Amsterdam) 2020, 266, 109289. [Google Scholar]
  8. Louis, B.; Waikhom, S.D.; Singh, W.M.; Talukdar, N.C.; Roy, P. Diversity of Ascomycetes at the Potato Interface: New Devastating Fungal Pathogens Posing Threat to Potato Farming. Plant Pathol. J. 2014, 13, 18–27. [Google Scholar]
  9. Rogerson, C.T.; Sherf, A.E.; MacNab, A.A. Vegetable Diseases and Their Control. Brittonia 1987, 39, 378. [Google Scholar] [CrossRef]
  10. Palm, M.E.; Rotem, J. The Genus Alternaria: Biology, Epidemiology, and Pathogenicity. Mycologia 1997, 89, 347. [Google Scholar] [CrossRef]
  11. Van Der Waals, J.E.; Korsten, L.; Denner, F.D.N. Early blight in South Africa: Knowledge, attitudes and control practices of potato growers. Potato Res. 2005, 46, 27–37. [Google Scholar] [CrossRef]
  12. Aslam, M.; Habib, A.; Sahi, S.T.; Khan, R.R. Effect of bion and salicylic acid on peroxidase activity and total phenolics in tomato against alternaria solani. Pak. J. Agric. Sci. 2020, 57, 53–62. [Google Scholar]
  13. Sarfraz, M.; Khan, S.A.; Moosa, A.; Farzand, A.; Ishaq, U.; Naeem, I.; Khan, W.A. Promising Antifungal Potential of Selective Botanical Extracts, Fungicides and Trichoderma Isolates Against Alternaria solani. Cercet. Agron. Mold. 2018, 51, 65–74. [Google Scholar] [CrossRef] [Green Version]
  14. He, M.-H.; Wang, Y.-P.; Wu, E.-J.; Shen, L.-L.; Yang, L.-N.; Wang, T.; Shang, L.-P.; Zhu, W.; Zhan, J. Constraining Evolution of Alternaria alternata Resistance to a Demethylation Inhibitor (DMI) Fungicide Difenoconazole. Front. Microbiol. 2019, 10, 1609. [Google Scholar]
  15. Nottensteiner, M.; Absmeier, C.; Zellner, M. QoI Fungicide Resistance Mutations in Alternaria solani and Alternaria alternata are Fully Established in Potato Growing Areas in Bavaria and Dual Resistance against SDHI Fungicides is Upcoming. Gesunde Pflanz. 2019, 71, 155–164. [Google Scholar]
  16. de la Rosa, L.A.; Moreno-Escamilla, J.O.; Rodrigo-García, J.; Alvarez-Parrilla, E. Phenolic Compounds. In Postharvest Physiology and Biochemistry of Fruits and Vegetables; Yahia, E., Carrillo-Lopez, A., Eds.; Woodhead Publishing-Elsevier: Cambridge, UK, 2019; pp. 253–271. ISBN 9780128132784. [Google Scholar]
  17. Lattanzio, V.; Lattanzio, V.M.T.; Cardinali, A. Role of phenolics in the resistance mechanisms of plants against fungal pathogens and insects. In Phytochemistry: Advances in Research; Imperato, F., Ed.; Research Signpost: Cerala, India, 2006; pp. 23–67. ISBN 813-080-034-9. [Google Scholar]
  18. Singh, S.; Singh, A.; Jaiswal, J.; Singh, T.D.; Singh, V.P.; Pandey, V.B.; Tiwari, A.; Singh, U.P. Antifungal activity of the mixture of quaternary alkaloids isolated from Argemone mexicana against some phytopathogenic fungi. Arch. Phytopathol. Plant Prot. 2010, 43, 769–774. [Google Scholar] [CrossRef]
  19. Pane, C.; Fratianni, F.; Parisi, M.; Nazzaro, F.; Zaccardelli, M. Control of Alternaria post-harvest infections on cherry tomato fruits by wild pepper phenolic-rich extracts. Crop Prot. 2016, 84, 81–87. [Google Scholar]
  20. Pane, C.; Fratianni, F.; Raimo, F.; Nazzaro, F.; Zaccardelli, M. Efficacy of phenolic-rich extracts from leaves of pepper landraces against Alternaria leaf blight of tomato. J. Plant Pathol. 2017, 99, 239–244. [Google Scholar]
  21. Gupta, M.; Sharma, S.; Bhadauria, R. Phytotoxicity of Momordica charantia extracts against Alternaria alternata. J. Pharm. Sci. Res. 2017, 9, 28–34. [Google Scholar]
  22. Papoutsis, K.; Vuong, Q.V.; Tesoriero, L.; Pristijono, P.; Stathopoulos, C.E.; Gkountina, S.; Lidbetter, F.; Bowyer, M.C.; Scarlett, C.J.; Golding, J.B. Microwave irradiation enhances the in vitro antifungal activity of citrus by-product aqueous extracts against Alternaria alternata. Int. J. Food Sci. Technol. 2018, 53, 1510–1517. [Google Scholar]
  23. Li, Z.-J.; Liu, M.; Dawuti, G.; Dou, Q.; Ma, Y.; Liu, H.-G.; Aibai, S. Antifungal Activity of Gallic Acid In Vitro and In Vivo. Phyther. Res. 2017, 31, 1039–1045. [Google Scholar]
  24. Binutu, O.A.; Cordell, G.A. Gallic Acid Derivatives from Mezoneuron benthamianum Leaves. Pharm. Biol. 2000, 38, 284–286. [Google Scholar]
  25. Ahn, Y.-J.; Lee, H.-S.; Oh, H.-S.; Kim, H.-T.; Lee, Y.-H. Antifungal activity and mode of action of Galla rhois-derived phenolics against phytopathogenic fungi. Pestic. Biochem. Physiol. 2005, 81, 105–112. [Google Scholar]
  26. Benhamou, N.; Bélanger, R.R. Benzothiadiazole-mediated induced resistance to Fusarium oxysporum f. sp. radicis-lycopersici in tomato. Plant Physiol. 1998, 118, 1203–1212. [Google Scholar] [CrossRef] [Green Version]
  27. Ellis, M.B.; Ellis, P. Microfungi on Land Plants; Croom Helm Australia: Sydney, New South Wales, Australia, 1987. [Google Scholar]
  28. Joly, P. Le genre alternaria, recherches physiologiques, biologiques et systematiques. Encycl. Mycol. 1964, 33, 1–250. [Google Scholar]
  29. Simmons, E.G. Alternaria taxonomy: Current status, viewpoint, challenge. In Alternaria: Biology, Plant Diseases, and Metabolites; Chelkowski, J., Visconti, A., Eds.; Elsevier: Amsterdam, The Netherlands, 1992. [Google Scholar]
  30. Siciliano, I.; Gilardi, G.; Ortu, G.; Gisi, U.; Gullino, M.L.; Garibaldi, A. Identification and characterization of Alternaria species causing leaf spot on cabbage, cauliflower, wild and cultivated rocket by using molecular and morphological features and mycotoxin production. Eur. J. Plant Pathol. 2017, 149, 401–413. [Google Scholar] [CrossRef]
  31. Barnett, H.L.; Hunter, B.B. Illustrated Genera of Imperfect Fungi, 3rd ed.; Burgess Publishing Company: Minneapolis, MN, USA, 1972. [Google Scholar]
  32. Pandey, K.K.; Pandey, P.K.; Satpathy, S. Integrated Management of Diseases and Insects of Tomato, Chilli and Cole Crops; Indian Institute of Vegetable Research: Kelabela, Uttar Pradesh, India, 2002. [Google Scholar]
  33. Grover, R.; Moore, J.D. Toximetric studies of fungicides against the brown root organisms, Sclerotinia fructicola and S. laxa. Phytopathology 1962, 52, 876–880. [Google Scholar]
  34. Pandey, K.K.; Pandey, P.K.; Kalloo, G.; Banerjee, M.K. Resistance to early blight of tomato with respect to various parameters of disease epidemics. J. Gen. plant Pathol. 2003, 69, 364–371. [Google Scholar] [CrossRef]
  35. Aebi, H. Catalase in vitro. Methods Enzym. 1984, 105, 121–126. [Google Scholar]
  36. Rathmell, W.G.; Sequeira, L. Soluble Peroxidase in Fluid from the Intercellular Spaces of Tobacco Leaves. Plant Physiol. 1974, 53, 317–318. [Google Scholar] [CrossRef] [Green Version]
  37. Malik, C.P.; Singh, M.B. Plant Enzymology and Histo-Enzymology; Kalyani Publishers: Darya Ganj, New Delhi, India, 1980. [Google Scholar]
  38. Yadawa, U.L. A rapid and nondestructive method to determine chlorophyll in intact leaves. HortScience 1986, 21, 1449–1450. [Google Scholar]
  39. Kähkönen, M.P.; Hopia, A.I.; Vuorela, H.J.; Rauha, J.P.; Pihlaja, K.; Kujala, T.S.; Heinonen, M. Antioxidant activity of plant extracts containing phenolic compounds. J. Agric. Food Chem. 1999, 47, 3954–3962. [Google Scholar] [CrossRef]
  40. Djeridane, A.; Yousfi, M.; Nadjemi, B.; Boutassouna, D.; Stocker, P.; Vidal, N. Antioxidant activity of some algerian medicinal plants extracts containing phenolic compounds. Food Chem. 2006, 97, 654–660. [Google Scholar] [CrossRef]
  41. SAS Institute. JMP Data Analysis Software—Version 14. Available online: https://www.jmp.com (accessed on 15 December 2019).
  42. Natural History Museum-University of Oslo. PAleontological STatistics (PAST)—Version 3. Available online: https://folk.uio.no/ohammer/past/ (accessed on 18 May 2019).
  43. MedCalc Software Ltd. MedCalc Statistical Software—Version 19.3.1. Available online: https://www.medcalc.org (accessed on 22 March 2020).
  44. Gan, R.-Y.; Chan, C.-L.; Yang, Q.-Q.; Li, H.-B.; Zhang, D.; Ge, Y.-Y.; Gunaratne, A.; Ge, J.; Corke, H. Bioactive compounds and beneficial functions of sprouted grains. In Sprouted Grains: Nutritional Value, Production, and Applications; Feng, H., Nemzer, B., De Vries, J.W., Eds.; Woodhead Publishing and AACC International Press: Cambridge, UK, 2019; pp. 191–246. ISBN 9780128115251. [Google Scholar]
  45. Vondráková, Z.; Malbeck, J.; Trávníčková, A.; Černý, R.; Cvikrová, M. Phenolic acids in selected scab-resistant and mildew-tolerant apple cultivars. Acta Physiol. Plant. 2020, 42, 1–10. [Google Scholar] [CrossRef]
  46. Vagiri, M.; Johansson, E.; Rumpunen, K. Phenolic compounds in black currant leaves—An interaction between the plant and foliar diseases? J. Plant Interact. 2017, 12, 193–199. [Google Scholar] [CrossRef] [Green Version]
  47. Zheng, W.; Zheng, Q.; Xue, Y.; Hu, J.; Gao, M.T. Influence of rice straw polyphenols on cellulase production by Trichoderma reesei. J. Biosci. Bioeng. 2017, 123, 731–738. [Google Scholar] [CrossRef]
  48. Guleria, S.; Kumar, A. Azadirachta indica leaf extract induces resistance in sesame against Alternaria leaf spot disease. J. Cell Mol. Biol. 2006, 5, 81–86. [Google Scholar]
  49. Mvumi, C.; Ngadze, E.; Marais, D.; du Toit, E.S.; Mvumi, B.M. Moringa (Moringa oleifera) leaf extracts inhibit spore germination of Alternaria solani, causal agent of early blight disease of tomato (Solanum lycopersicum). S. Afr. J. Plant Soil 2017, 34, 161–165. [Google Scholar] [CrossRef]
  50. Dethoup, T.; Songkumarn, P.; Rueangrit, S.; Suesa-ard, S.; Kaewkrajay, C. Fungicidal activity of Thai medicinal plant extracts against Alternaria brassicicola causing black spot of Chinese kale. Eur. J. Plant Pathol. 2018, 152, 157–167. [Google Scholar] [CrossRef]
  51. Yuan, S.; Li, W.; Li, Q.; Wang, L.; Cao, J.; Jiang, W. Defense Responses, Induced by p-Coumaric Acid and Methyl p-Coumarate, of Jujube (Ziziphus jujuba Mill.) Fruit against Black Spot Rot Caused by Alternaria alternata. J. Agric. Food Chem. 2019, 67, 2801–2810. [Google Scholar] [CrossRef]
  52. Mandal, D.; Pal, R.; Mohanty, A.K. Management of early blight of tomato. Indian J. Hortic. 2019, 76, 548–551. [Google Scholar] [CrossRef]
  53. Gopi, K.; Renu, K.; Sannanaik Vishwanath, B.; Jayaraman, G. Protective effect of Euphorbia hirta and its components against snake venom induced lethality. J. Ethnopharmacol. 2015, 165, 180–190. [Google Scholar] [CrossRef]
  54. Baharuddin, N.; Abdullah, H.; Abdul Wahab, W.N. Anti-Candida activity of Quercus infectoria gall extracts against Candida species. J. Pharm. Bioallied Sci. 2015, 7, 15–20. [Google Scholar] [CrossRef]
  55. Hirasawa, M.; Takada, K. Multiple effects of green tea catechin on the antifungal activity of antimycotics against Candida albicans. J. Antimicrob. Chemother. 2004, 53, 225–229. [Google Scholar]
  56. Nguyen, D.M.C.; Seo, D.J.; Lee, H.B.; Kim, I.S.; Kim, K.Y.; Park, R.D.; Jung, W.J. Antifungal activity of gallic acid purified from Terminalia nigrovenulosa bark against Fusarium solani. Microb. Pathog. 2013, 56, 8–15. [Google Scholar]
  57. Sahu, R.; Sharaff, M.; Pradhan, M.; Sethi, A.; Bandyopadhyay, T.; Mishra, V.K.; Chand, R.; Chowdhury, A.K.; Joshi, A.K.; Pandey, S.P. Elucidation of defense-related signaling responses to spot blotch infection in bread wheat (Triticum aestivum L.). Plant J. 2016, 86, 35–49. [Google Scholar] [CrossRef]
  58. Sharma, S.; Sahu, R.; Navathe, S.; Mishra, V.K.; Chand, R.; Singh, P.K.; Joshi, A.K.; Pandey, S.P. Natural Variation in Elicitation of Defense-Signaling Associates to Field Resistance Against the Spot Blotch Disease in Bread Wheat (Triticum aestivum L.). Front. Plant Sci. 2018, 9, 636. [Google Scholar] [CrossRef]
  59. Chong, K.P.; Rossall, S.; Atong, M. In Vitro Antimicrobial Activity and Fungitoxicity of Syringic Acid, Caffeic Acid and 4-hydroxybenzoic Acid against Ganoderma Boninense. J. Agric. Sci. 2009, 1, 15. [Google Scholar]
  60. Chong, K.P.; Atong, M.; Rossall, S. The role of syringic acid in the interaction between oil palm and Ganoderma boninense, the causal agent of basal stem rot. Plant Pathol. 2012, 61, 953–963. [Google Scholar]
  61. Sánchez-Maldonado, A.F.; Schieber, A.; Gänzle, M.G. Structure-function relationships of the antibacterial activity of phenolic acids and their metabolism by lactic acid bacteria. J. Appl. Microbiol. 2011, 111, 1176–1184. [Google Scholar]
  62. Alves, M.J.; Ferreira, I.C.F.R.; Froufe, H.J.C.; Abreu, R.M.V.; Martins, A.; Pintado, M. Antimicrobial activity of phenolic compounds identified in wild mushrooms, SAR analysis and docking studies. J. Appl. Microbiol. 2013, 115, 346–357. [Google Scholar]
  63. Shi, C.; Sun, Y.; Zheng, Z.; Zhang, X.; Song, K.; Jia, Z.; Chen, Y.; Yang, M.; Liu, X.; Dong, R.; et al. Antimicrobial activity of syringic acid against Cronobacter sakazakii and its effect on cell membrane. Food Chem. 2016, 197, 100–106. [Google Scholar] [CrossRef]
  64. Kozlowska, M.; Krzywanski, Z. The possible role of phenolic compounds in red raspberry resistance to Didymella applanata (Niessl) Sacc. In Symposium on Natural Phenols in Plant Resistance; Geibel, M., Treutter, D., Feucht, W., Eds.; International Society for Horticultural Science: Weihenstephan, Germany, 1993; pp. 671–674. [Google Scholar]
  65. Fu, Y.H.; Quan, W.X.; Li, C.C.; Qian, C.Y.; Tang, F.H.; Chen, X.J. Allelopathic effects of phenolic acids on seedling growth and photosynthesis in rhododendron delavayi franch. Photosynthetica 2019, 57, 377–387. [Google Scholar] [CrossRef] [Green Version]
  66. Dangl, J.L.; Jones, J.D.G. Plant pathogens and integrated defence responses to infection. Nature 2001, 411, 826–833. [Google Scholar] [CrossRef] [PubMed]
  67. Bravo, L. Polyphenols: Chemistry, Dietary Sources, Metabolism, and Nutritional Significance. Nutr. Rev. 2009, 56, 317–333. [Google Scholar] [CrossRef] [PubMed]
  68. Srinivasulu, C.; Ramgopal, M.; Ramanjaneyulu, G.; Anuradha, C.M.; Suresh Kumar, C. Syringic acid (SA)—A Review of Its Occurrence, Biosynthesis, Pharmacological and Industrial Importance. Biomed. Pharmacother. 2018, 108, 547–557. [Google Scholar] [CrossRef] [PubMed]
  69. Hou, R.; Shi, J.; Ma, X.; Wei, H.; Hu, J.; Tsang, Y.F.; Gao, M.T. Effect of Phenolic Acids Derived from Rice Straw on Botrytis cinerea and Infection on Tomato. Waste Biomass Valorization 2020, 1–9. [Google Scholar] [CrossRef]
  70. Jia, L.G.; Sheng, Z.W.; Xu, W.F.; Li, Y.X.; Liu, Y.G.; Xia, Y.J.; Zhang, J.H. Modulation of anti-oxidation ability by proanthocyanidins during germination of arabidopsis thaliana seeds. Mol. Plant 2012, 5, 472–481. [Google Scholar] [CrossRef] [Green Version]
  71. Abdul-Maksoud, R.S.; Fouad, R.A.; Elsayed, T.G.; Ibrahem, R.A.; Badawi, A.E. The impact of catalase and glutathione peroxidase-1 genetic polymorphisms on their enzyme activities among Egyptian patients with keratoconus. J. Gene Med. 2020, 22, e3192. [Google Scholar] [CrossRef]
  72. Heller, J.; Tudzynski, P. Reactive Oxygen Species in Phytopathogenic Fungi: Signaling, Development, and Disease. Annu. Rev. Phytopathol. 2011, 49, 369–390. [Google Scholar] [CrossRef]
  73. Mahmoudi, N. Effect of beta-aminobutyric acid on activity of peroxidase and polyphenol oxidase enzymes in cucumber infected with nematode Meloidogyne javanica. Rudn J. Agron. Anim. Ind. 2019, 14, 7–17. [Google Scholar] [CrossRef]
  74. Volf, I.; Ignat, I.; Neamtu, M.; Popa, V. Thermal stability, antioxidant activity, and photo-oxidation of natural polyphenols. Chem. Pap. 2014, 68, 121–129. [Google Scholar] [CrossRef]
Figure 1. Pathogenicity test of different isolates of A. solani on tomato plants (Super strain B–F1 hybrid) under greenhouse conditions (n = 6). (A) Typical symptoms of early blight disease on tomato leaves after the infection with different isolates of A. solani. (B,C) Disease severity (%) of different isolates of A. solani in two separate experiments. Values represent the mean of six replicates ± standard deviation (Means ± SD). Different letters indicate statistically significant differences among treatments, while “ns” or the same letter signify no significant differences among treatments at the same time point using the Tukey–Kramer honestly significant difference test (Tukey HSD; p < 0.05). The experiment was repeated twice with similar results.
Agronomy 10 01402 g001
Figure 2. In vitro antifungal activity of gallic acid and its derivatives against A. solani (n = 6). (A) Antifungal activity of different concentrations (20, 40, 60, 80, or 100 ppm) of gallic acid and its derivatives against the most aggressive isolate of A. solani. (B,C) Inhibition (%) of the radial mycelial growth of A. solani after the treatment with different concentrations of gallic acid and its derivatives (20, 40, 60, 80, or 100 ppm) in petri dish experiments. The experiment was repeated twice with similar results. ND: not detected. Different letters indicate statistically significant differences among treatments.
Agronomy 10 01402 g002
Figure 3. Probit regression (dose–response analysis) of the inhibition effects of gallic acid and its derivatives against A. solani (n = 6). (A) Difenoconazole fungicide, (B) gallic acid, (C) pyrogallic acid, and (D) syringic acid. Probability was calculated for the inhibition of the radial mycelial growth (%) of A. solani after the treatment with different concentrations of gallic acid and its derivatives (0, 20, 40, 60, 80, or 100 ppm). Blue dots present the mean of six replicates of each concentration. The probit regression lines are presented as blue solid-lines. The 95% confidence intervals for the estimated regression are edged by red dashed-lines. Regression equations, Cox and Snell R2, and p-value based on the F test (p ≤ 0.05) were also obtained and presented within the graphs. The experiment was repeated twice with similar results.
Agronomy 10 01402 g003
Figure 4. Effects of gallic acid and its derivatives on the development of early blight disease caused by A. solani on tomato plants (Super strain B–F1 hybrid) under greenhouse conditions (n = 6). (A) Typical symptoms of early blight disease on tomato leaves at 7 days post-treatment (dpt) with 100 ppm of gallic acid and its derivatives. (B,C) Disease progress curves of early blight disease on tomato leaves after the treatment with gallic acid or its derivatives during 2019 and 2020 seasons, respectively. Values represent means of six replicates, while whiskers reflect the standard deviation (Means ± SD). Different letters indicate statistically significant differences among treatments, while “ns” or the same letter signify no significant differences among treatments at the same time point. (D,E) The area under disease progress curve (AUDPC) of early blight disease on tomato leaves after the treatment with gallic acid or its derivatives during 2019 and 2020 seasons, respectively. Bars represent means of six replicates, while whiskers reflect the standard deviation (Means ± SD). Different letters indicate statistically significant differences among treatments using the Tukey–Kramer honestly significant difference test (Tukey HSD; p < 0.05).
Agronomy 10 01402 g004
Figure 5. Effects of gallic acid and its derivatives on biochemical analysis of tomato plants (Super strain B–F1 hybrid) infected with A. solani under greenhouse conditions (n = 6). (A,B) Total soluble phenolics during 2019 and 2020 seasons, respectively; (C,D) total soluble flavonoids during 2019 and 2020 seasons, respectively. Values represent means of six replications, while whiskers reflect the standard deviation (Means ± SD). Different letters indicate statistically significant differences among treatments, while “ns” or the same letter signify no significant differences among treatments using the Tukey–Kramer honestly significant difference test (Tukey HSD; p < 0.05).
Agronomy 10 01402 g005
Figure 6. Effects of gallic acid and its derivatives on biochemical analysis of tomato plants (Super strain B–F1 hybrid) infected with A. solani under greenhouse conditions (n = 6). (A,B) Catalase activity, (C,D) peroxidase activity, and (E,F) and polyphenol oxidase activity during 2019 and 2020 seasons, respectively. Values represent means of six replications, while whiskers reflect the standard deviation (Means ± SD). Different letters indicate statistically significant differences among treatments, while “ns” or the same letter signify no significant differences among treatments using the Tukey–Kramer honestly significant difference test (Tukey HSD; p < 0.05).
Agronomy 10 01402 g006
Figure 7. Principal component analysis (PCA) and two-way hierarchical cluster analysis (HCA) of individual response variables assessed in A. solani-infected tomato plants (Super strain B–F1 hybrid) after the treatment with gallic acid and its derivatives under greenhouse conditions during 2019 and 2020 seasons (n = 6). (A,B) PCA-associated scatters plots during 2019 and 2020 seasons, respectively; (C,D) PCA-associated loading plots during 2019 and 2020 seasons, respectively; (E,F) two-way hierarchical cluster analysis (HCA) during 2019 and 2020 seasons, respectively. The differences in the response variables between all studied treatments are visualized in the heat map diagram. Rows represent the individual response variables, while columns represent the treatments. Lower numerical values are colored green, whereas higher numerical values are colored red (see the scale at the right corner of the bottom of the heat map).
Agronomy 10 01402 g007
Figure 8. Correlation analysis between individual response variables assessed in A. solani-infected tomato plants (Super strain B–F1 hybrid) under greenhouse conditions during 2019 and 2020 seasons. (A,B) Mock control and gallic acid and (C,D) pyrogallic acid and syringic acid (E,F).
Agronomy 10 01402 g008
Table 1. The half-maximal inhibitory concentration (IC50) and IC99 values (ppm) of difenoconazole fungicide, gallic acid, and its derivatives (syringic acid and pyrogallic acid) against A. solani (n = 6).
CompoundsIC50
(ppm)
95% Confidence IntervalIC99
(ppm)
95% Confidence IntervalOverall Model Fit
LowerUpperLowerUpperχ2p-ValueCox and Snell R2
Difenoconazole fungicide (Score)0.190.010.842572.24770.9326582.69364.52<0.00010.4553
Gallic acid48.8144.2953.44276.85213.61398.68282.10<0.00010.3751
Syringic acid49.7545.3054.31264.94206.83374.43286.73<0.00010.3799
Pyrogallic acid63.7557.1671.89552.61365.361041.11197.93<0.00010.2810
Table 2. Effects of gallic acid and its derivatives on the growth parameters and chlorophyll content of tomato plants (Super strain B–F1 hybrid) infected with A. solani under greenhouse conditions during 2019 and 2020 seasons (n = 6).
TreatmentPlant Height
(cm)
Number of Leaves per PlantShoot Fresh Weight
(g plant−1)
Shoot Dry Weight
(g plant−1)
Chlorophyll Content
(SPAD)
2019 season
Mock (Control)24.83 ± 5.08 ns7.67 ± 1.37 ns20.20 ± 1.27 e4.86 ± 0.07 e10.55 ± 6.89 c
Difenoconazole fungicide (Score)26.83 ± 3.76 ns8.33 ± 2.25 ns23.53 ± 1.89 d5.05 ± 0.07 d27.15 ± 4.67 ab
Gallic acid30.83 ± 3.31 ns9.00 ± 1.79 ns32.83 ± 1.97 b6.11 ± 0.09 b18.00 ± 5.44 bc
Pyrogallic acid29.50 ± 1.52 ns9.67 ± 0.82 ns38.63 ± 1.38 a7.45 ± 0.16 a36.68 ± 8.63 a
Syringic acid28.17 ± 5.95 ns7.50 ± 0.55 ns27.61 ± 1.43 c5.78 ± 0.08 c28.37 ± 9.84 ab
2020 season
Mock (Control)23.67 ± 4.68 b8.50 ± 2.26 ns21.52 ± 1.31 d4.90 ± 0.66 b12.20 ± 6.06 c
Difenoconazole fungicide (Score)27.67 ± 2.73 ab10.17 ± 2.40 ns24.99 ± 2.65 cd5.41 ± 0.51 b27.55 ± 4.51 b
Gallic acid30.83 ± 2.64 a9.83 ± 1.33 ns33.82 ± 1.51 b5.88 ± 0.71 b18.65 ± 5.43 bc
Pyrogallic acid31.17 ± 2.48 a10.83 ± 1.47 ns40.59 ± 2.99 a8.07 ± 0.84 a39.93 ± 6.52 a
Syringic acid26.50 ± 6.32 ab9.33 ± 1.03 ns27.96 ± 2.21 c5.83 ± 0.11 b26.90 ± 5.43 b
Values represent the mean of six replicates ± standard deviation (Mean ± SD). Different letters within the same column indicate statistically significant differences among treatments, while “ns” or the same letter signify no significant differences among treatments using the Tukey–Kramer honestly significant difference test (Tukey HSD; p <0.05).
Table 3. Effects of gallic acid and its derivatives on yield components of tomato plants (Super strain B–F1 hybrid) infected with A. solani under greenhouse conditions during 2019 and 2020 seasons (n = 6).
TreatmentNumber of Flowers per PlantNumber of Fruits per PlantFruit Yield
(Kg plant−1)
Fruit Yield Increase over Control (%)
2019 season
Mock (Control)5.00 ± 0.89 c10.33 ± 1.63 c0.85 ± 0.07 d-
Difenoconazole fungicide (Score)7.67 ± 1.21 b16.00 ± 0.89 b1.50 ± 0.04 bc176.32 ± 5.27
Gallic acid8.50 ± 0.55 ab15.67 ± 1.03 b1.55 ± 0.04 b182.39 ± 5.13
Pyrogallic acid9.67 ± 1.37 a19.67 ± 1.21 a2.07 ± 0.06 a243.05 ± 7.01
Syringic acid8.50 ± 1.52 ab15.17 ± 0.75 b1.46 ± 0.04 c171.04 ± 4.24
2020 season
Mock (Control)6.50 ± 1.97 b10.50 ± 1.87 c0.92 ± 0.10 c-
Difenoconazole fungicide (Score)8.17 ± 1.60 ab16.83 ± 1.94 b1.63 ± 0.19 b176.63 ± 21.07
Gallic acid9.33 ± 1.51 ab15.33 ± 2.34 b1.59 ± 0.21 b172.64 ± 23.14
Pyrogallic acid11.00 ± 1.41 a21.33 ± 4.03 a2.50 ± 0.17 a272.10 ± 18.63
Syringic acid9.33 ± 2.42 ab15.5 ± 1.05 b1.62 ± 0.12 b176.45 ± 13.45
Values represent the mean of six replicates ± standard deviation (Mean ± SD). Different letters within the same column indicate statistically significant differences among treatments, while “ns” or the same letter signify no significant differences among treatments using the Tukey–Kramer honestly significant difference test (Tukey HSD; p < 0.05).

