Abstract
The commercial Nigerian peanut cultivars Ex-Dakar, Samnut-22 and Samnut-26, the Egyptian cultivar Ismailia-1 and the American cultivar NC-7 were genetically differentiated and the cultivars’ effects on growth and yield components, total lipid contents, including saturated and unsaturated fatty acids, and oil body size and number were investigated. Experiments were carried out at Cairo University Research Station, Giza, Egypt, during the summer seasons of 2016 and 2017. All cultivars had high contents of total unsaturated fatty acids and low contents of saturated fatty acids. Variations among tested cultivars in oil body size and number were documented and cultivars were ranked based on their oil bodies’ size as Ismailia-1 > Samnut-26 > NC-7 > Ex-Dakar ≥ Samnut-22. Oil body size and number were inversely related. This variation can be explained by the different amounts of acidic amino acids and the protein structure on the surface of the oil bodies of these cultivars. The distributions of protein bodies and oil bodies seemed to be negatively correlated. Cultivar effect was significant, and variation was found in seed production and quality in addition to the size and number of oil bodies, oil productivity, and oil quality among cultivars. Seasonal effects were not evident due to the stability of the climatic conditions during the two seasons of the study.
1. Introduction
Peanuts are widely cultivated in the tropical and subtropical regions of the world. They are used in the form of seeds for human consumption and the haulm is used as fodder in the form of straw and hay for cattle. Peanut seeds can be eaten as snacks due to their many health benefits including a reduction in cardiovascular disease [1], colon, prostate, and breast cancer [2], osteoporosis [3] and diabetes [4]. They are a dietary source of calcium, magnesium, iron, zinc, phosphorus, vitamin E, riboflavin, thiamine and potash. For this reason, peanuts are used as a raw material in food and in the feed industry [5,6].
Genetic variation and relationships among genotypes or populations can be assessed using molecular markers. The efficiency of a marker technique in discriminating genotypes depends largely upon the polymorphisms detected among them. Cultivar differentiations have been documented in rice [7], broccoli and cauliflower [8], lettuce [9], banana [10], wheat [11], alfalfa [12] and tomato [13] with different molecular marker systems. The evaluation of marker parameters such as Polymorphism Information Content (PIC), Marker index (MI), I and F in populations has highlighted the informative or discriminatory power of primer combinations in genetic studies [14,15]. Moreover, the markers are useful in genetic diversity estimation, phylogenetic studies, gene tagging, genome mapping and evolutionary biology in a wide range of plant species [9,16]. Ramadan et al. [17] evaluated the genetic diversity of six Egyptian fennel cultivars using Inter Simple Sequence Repeat (ISSR) and Start Codon Targeted (SCoT) markers. They found more discriminating results with the ISSR marker because it had the highest percentage of polymorphisms compared to the SCoT marker. They concluded that the ISSR marker can be reliable for genetic diversity evaluation among cultivars. Random Amplified Polymorphic DNA (RAPD) was also found to be an effective tool in detecting genetic diversity. Five peanut cultivars were genetically differentiated using twenty RAPD primers by Samaha et al. [18]. They found that RAPD markers were distributed in the peanut genome and helped to detect the genetic diversity of the peanut cultivars. They also concluded that the RAPD marker can be a significant tool in in peanut breeding programs. Phylogenetic relationships among ten Hordeum vulgare L. varieties were tested using RAPD-PCR and ISSR-PCR by El Atroush et al. [19]. RAPD-PCR showed a 41.77% polymorphism, while ISSR-PCR showed a 62.02% polymorphism. They concluded that both RAPD and ISSR markers would be suitable tools, but ISSR markers were more viable than RAPD in the detection of genetic variability among Hordeum vulgare (barley) varieties.
Peanuts are an important source of edible oil [2]. About 43 to 59 percent of the peanut seed weight is oil [20,21,22,23]. The peanut oil content and composition vary among different genotypes [21,23]. The quality of the oil depends on the composition of fatty acids, especially the proportion of unsaturated fatty acids (mainly oleic and linoleic acids) to saturated fatty acids [24]. Unsaturated fatty acids in peanut oil have antioxidant properties and help by lowering cholesterol and, as a result, reduce the heart disease risk [25,26]. The major components of peanut oil are oleic (25.1–35.2%), linoleic (8.70–13.03%), palmitic (3.77–4.53%), stearic acids (1.53–1.93%), arachidic and behenic acids (2.40–3.47%) [27]. Oil is stored as oil bodies (also known as lipid droplets) which are subcellular structures in the cytoplasm. Oil bodies are generally considered to be circular to ovoid in shape, with different diameters relevant to different cultivars and/or species within the range of 0.5–2.5 µm [28]. Oil bodies are filled with triacylglycerols (TAGs) enclosed by a monolayer of phospholipid (PL) embedded with integral membrane oleosin proteins [29]. The size and shape of oil bodies are affected by species and environmental factors [30,31]. It was found that local peanut cultivars comparable to internationally grown peanut varieties in Pakistan are more suitable for oil extraction and peanut butter development because of their high oleic acid to linoleic acid ratio [32]. Yusuf et al. [33] studied the fatty acid composition of peanut oil from different Ethiopian varieties. Varieties from warmer locations were better in oil quality than those from cooler climate locations. In the marker-assisted backcrossing–introgression lines over the locations, the most significant outcome was the stable expression of oil content, oleic acid, linoleic acid, and palmitic acid [34,35]. The peanut protein and oil body extraction by the aqueous enzyme extraction process may affect the yield of peanut protein and oil bodies by breaking down cell wall enzymes and degrading the main cell wall components. A peanut protein yield of 78.60% and oil body yield of 48.44% were achieved under the optimal condition [36]. The observation of the formation of oil bodies in the endosperm and embryo in Paeonia ostii seeds by transmission electron microscopy indicated that few oil bodies were scattered at the cell periphery in the endosperm, but oil bodies were numerous in the embryo [37]. This revealed that the ultrastructure of the endosperm and embryo significantly changed with the accumulation process of the oil bodies and fatty acid composition during the development [38].
Therefore, the objective of this study was to evaluate the conformity of the molecular marker system, viz. RAPD and ISSR, in assessing and analyzing the nature and the extent of genetic diversity among peanut cultivars and its effect on the size and number of oil bodies, seeds, oil productivity, and oil quality.
2. Materials and Methods
Five peanut cultivars were used in this study. The commercial Nigerian cultivars Ex-Dakar, Samnut-22 and Samnut-26 were obtained from the Institute for Agricultural Research (IAR), Samaru, Zaria, Nigeria. The Egyptian cultivar Ismailia-1 and the American cultivar NC-7 were obtained from the Agricultural Research Center (ARC), Giza, Egypt. The experiment was carried out at the Western farm of the Agricultural Experimental and Research Station, Faculty of Agriculture, Cairo University, Giza, Egypt (30°02′ N and 31°13′ E, altitude 22.5 m above sea level), during the summer seasons of 2016 and 2017. Monthly mean temperature and monthly relative humidity were recorded (Table 1). Monthly mean temperature values increased gradually from 28.90 and 29.27 °C in May to 30.47 and 31.37 °C in July and August in the 2016 and 2017 seasons, respectively. The maximum relative humidity was 46.33 during July and August in both years. There was no rain in the first season, while there was only 2 mm of rain recorded in July and September during the second season.

Table 1.
Average temperature and relative humidity in the study area in Giza, Egypt, during the summer seasons of 2016 and 2017. Data obtained from the Central Laboratory for Agricultural Climate (CLAC), Agricultural Research Center (ARC), Egypt.
A randomized complete block design (RCBD) with three replications was used with plots 9.6 m2 and 0.6 m apart (two rows per plot). Soil samples were collected and tested in the lab. The soil was silty clay containing 3.4% sand, 47.1% silt, and 49.5% clay. The soil pH was 7.6 and electrical conductivity (EC) was 2.35 dSm−1. Cultural practices were conducted according to the recommendation of the Agricultural Research Center (ARC), Egyptian Ministry of Agriculture.
Seeding hills were prepared 10 cm apart, and seeds were sown manually on April 26 in both years. Seedlings were thinned to keep only two seedlings per hill to avoid competition and poor growth (18–20 plants per plot). Flood irrigation was used. Inorganic fertilizers were added and used in the form of superphosphate (15% P2O5) at a rate of 480 kg/ha before seeding. Potassium sulfate (48% K2O) at a rate of 240 kg/ha was added in 2 separate doses, the first one was added after the emergence and the second dose was added before flowering. Nitrogen was added at a rate of 72 units per hectare in the form of calcium nitrate (15% N). It was amended in two separate doses, one after emergence and the second three weeks later. A mixture of micronutrients, viz. boron, zinc, iron, and manganese, was sprayed three times as a foliar application after full emergence (40-day age) at 3-week intervals. Hoeing and hand pulling were relied upon in this experiment to control annual summer and perennial weeds. The experimental plots were maintained free of weeds throughout the growing season by hoeing four times at 20, 40, 60 and 80 days after sowing.
Data were collected on growth and yield components by randomly selecting five plants from the two inner ridges of each plot at harvest time to record plant height (cm), the number of branches/plant, the number of mature pods/plant, the weight of pods/plant and the weight of seeds/plant in grams. The quality characteristics of pods and seeds were assessed by determining the pod index (the weight of 100 pods in grams), seed index (the weight of 100seeds in grams), pod percentage (%) and shelling percentage (%). Biological yield (ton ha−1), pod yield (kg ha−1), seed yield (kg ha−1) and oil yield (kg ha−1) were assessed.
The total lipid content in peanut seeds for different cultivars was determined according to A.O.A.C [39]. Five grams of seeds were ground, and oil was extracted with petroleum ether (40–60 °C) using Soxhlet apparatus. Lipids obtained were converted into fatty acid methyl esters (FAMEs) according to Rozes et al. [40], where 100 µL of each oil sample was placed in a test tube, 0.5 mL hexane was added to the oil, then 0.5 mL sodium methoxide solution (CH3ONa) in anhydrous methanol (CH3OH) 0.4 N was added and mixed, then allowed to stand for 1 min. The upper phase (hexane layer) was removed after decanting and was injected onto the chromatograph. The GC-MS system (Agilent Technologies, Santa Clara, CA, USA), equipped with a gas chromatograph (7890B) and a mass spectrometer detector (5977A) with a HP-5MS column (30 m × 0.25 mm internal diameter and 0.25 μm film thickness), was used at the Central Laboratories Network, National Research Centre, Cairo, Egypt. Helium was used as a carrier gas at a flow rate of 1.0 mL/min at a split ratio of 1:30. One µL of sample was injected and the temperature was programmed to remain at 150 °C for 1 min, then to rise by 2 °C /min, up to 200 °C, then to remain at this temperature for 4 min. After the 4 min period, the temperature rose again by 5 °C/min, up to 300 °C, then remained at this temperature for 1 min. The injector and detector were held at 280 °C and 300 °C, respectively. The mass spectra were obtained by electron ionization (EI) at 70 eV and using a spectral range of m/z 40–450 and a solvent delay of 2 min. The identification of different constituents was determined by comparing the spectrum fragmentation pattern with those stored in Wiley and The National Institute of Standards and Technology (NIST)Mass Spectral Library data.
2.1. DNA Extraction, Primers and DNA Amplification
Genomic DNA was extracted from a small amount of young and fresh leaves (0.1 g) collected from the cultivars using the Biospain Plant Genomic DNA Extraction Kit (BioFlux). Twelve primers (Table 2) obtained from Pharmacia Biotech (Amersham Pharmacia Biotech UK Limited, England, HP79 NA) were used for the identification of different peanut genotypes.
Table 2.
Primers used and their annealing temperatures.
PCR reaction test was performed according to Weising et al. [41]. In total, 25-µL volume reaction mixture was used, containing: 5 µL of 5X green Taq DNA polymerase buffer, 100 µM of primer, 20 ng of total cellular DNA, 10 mM of each of dNTP, 25 mM MgCl2, 5 U/µL of GoTaq DNA polymerase (Promega), up to 25 µL by nuclease-free water. PCR was performed in a DNA thermo cycler (BioRad T100, Foster City, CA, USA) and subjected to 35 cycles of the followings (45 s at 94 °C, 45 s at 37 °C, 1.5 min at 72 °C).
Band Scoring and Analysis
Polymorphism was scored on a presence or absence basis and data were analyzed using GenAlEx [42]. The analysis of data was performed using the diploid binary data criterion (1, present and 0, absent) that can distinguish each band position that corresponds to a Hardy–Weinberg Equilibrium (q), q = (1 − band freq.)0.5 and =1 − q. For comparisons, heterozygosity was estimated differently [43,44]. Cluster analyses were based on similarity matrices using the unweighed pair group method arithmetic average (UPGMA) and relationships between cultivars were visualized as dendrograms. Differences between dendrograms were tested by generating cophenetic values for each dendrogram and via the assembly of a cophenetic matrix for each marker type.
For a genetic marker, the number of effective bands (Ne) was estimated according to the formula Ne = 1 ÷ (p2 + q2), whereas expected heterozygosity (He) was calculated from the sum of the squares of band frequencies (He = 2 × p × q; [45]), where Pi is the band frequency for the i-th band. Therefore, unbiased expected heterozygosity was estimated by the following equation: uHe = (2N ÷ (2N − 1) × He). Shannon’s Information Index was calculated by the formula I = −1 × (p × Ln(p) + q × Ln(q)).
2.2. The Transmission Electron Microscopy (TEM)
The seeds of the tested cultivars were fixed for 2 h in 2% (w/v) paraformaldehyde and 2.5% (v/v) glutaraldehyde in phosphate buffer 0.1 M, with a pH of 7.4. Following fixation, the seeds were washed with the phosphate buffer for 10 min, re-suspended in 1% (w/v) paraformaldehyde for 2 h, and rinsed three times with the phosphate buffer. Seeds were post fixed for 2 h with 1% (w/v) osmium tetroxide containing 0.8% (w/v) potassium hexacyanoferrate, prepared in phosphate buffer, followed by four washes with deionized water and sequential dehydration in acetone. All procedures were performed at 4 °C. Samples were embedded in Spurr’s Resin and polymerized at 60 °C for 48 h. Ultra -thin sections (70 nm) were obtained with a diamond knife (45°, Diatome). Sections were stained with uranyl acetate and Reynolds lead citrate for 10 min and examined with a JEOL 1400 transmission electron microscope equipped with a Gatan Ultrascan ES1000 CCD Camera (Gatan Inc., USA). Embryos from three individuals were used in each analysis. Grids were stained with uranyl acetate and Reynolds lead citrate solutions. Samples were viewed on a JEM-1400 transmission electron microscope (JEOL, Tokyo, Japan).
Size Measurements of Oil Bodies in the Peanut Cell
In order to determine the oil body diameters, 80–140 measurements of oil body diameter and 15–20 measurements of protein body diameter were taken from each image (10 images per sample type) obtained from TEM at the same magnification (5 µm or 6000×) by a Nano Measurer 1.2. The determination of the mean diameter of the oil bodies and protein bodies was based on the results of 10 images.
2.3. Statistical Analysis
Data were statistically analyzed according to the procedures outlined by Steel et al. [46] using the MSTAT-C program [47]. Two-way ANOVA was used to test cultivar and year effects and their interactions. Means were compared and separated using the least significant difference test (Fisher’s LSD) at a 5% level of probability. Regression analysis was performed to test the association between oil body number and size.
3. Results and Discussion
3.1. Agronomic Traits
3.1.1. Growth and Yield Components
The analysis of variance indicated no significant differences between the two years of the study, nor the interaction between years and cultivars. Hence, data for the two years were pooled together. Significant differences among cultivars in relation to the tested agronomic traits were evident (Table 3).
Table 3.
Combined mean squares and treatments of the studied traits.
Significant differences among cultivars in all growth and yield parameters were observed (Table 4). Samnut-26 and Ex-Dakar cultivars achieved a higher plant height (56.33 and 53.75 cm, respectively), and there was no significant difference between them. The Ismailia-1 cultivar had the greatest number of branches per plant (6.17). NC-7 and Ismailia-1 cultivars achieved the highest number of pods per plant (130.50 and 121.50, respectively) and the highest pod weight per plant (40.85 and 39.73 g, respectively). The NC-7 cultivar had the highest seed weight per plant (27.65 g), followed by Samnut-22 and Ismailia-1 (25.90 and 25.50 g, respectively).
Table 4.
Mean of studied traits of peanut treatments tested at field experiments in Giza, Egypt—combined data from 2016 and 2017 seasons.
3.1.2. Quality Traits
The results indicated a significant difference among cultivars in terms of seed index, shelling percentage, oil content percentage, pops percentage and pod index (Table 4). NC-7 and Ismailia-1 cultivars had the highest values of seed index (60.08 and 55.90 g, respectively), shelling percentage (65.82 and 64.52%, respectively) and oil percentage (44.63 and 46.85%, respectively) and the lowest values of pops percentage (2.12 and 2.51%, respectively). The Samnut-22 cultivar achieved the highest value of pod index (188.20 g) followed by Samnut-26 (171.90 g).
3.1.3. Yields
Significant differences among cultivars in biological yield, pod yield, seed yield and oil yield were observed (Table 4). NC-7 and Ismailia-1 cultivars had the greatest pod yield (1414 and 3572 kg ha−1, respectively), the greatest seed yield (2729 and 2307 kg ha−1, respectively) and the greatest oil yield (1219 and 1082 kg ha−1, respectively). Samnut-22 achieved the highest biological yield (12.39 tons ha−1).
In agreement with our findings, Abdel-Motagally et al. [48] found significant variations among Egyptian peanut cultivars in terms of yield components and quality traits and Iledun et al. [49] reported variations among Nigerian cultivars in terms of biomass yields, pod yield/ha, effective pods, 100-seed weight and seed yield/ha. Shams El-Din and Ali [50] found significant differences among Egyptian peanut cultivars in terms of the shelling percentage, as well as oil and protein yields. Tarawali [51] recommended the Samnut 22 cultivar for better seed and fodder production. The variation among peanut cultivars in yield components and quality can be explained by the genetic variation among cultivars, along with the environmental conditions [52]. Variations in oil content and oil composition among peanut cultivars were explained by the variation in the environmental conditions, the genetic structure and their interactions [20,53,54,55]. There was no drastic change in climatic conditions between the summer season of 2016 and that of 2017 (Table 1) and, as a result, there was no significant difference between the two seasons in relation to quality traits.
3.2. Fatty Acid Profiles of Seed Oil
The quality of the oil fraction varies considerably among cultivars. The oil fraction quality depends on the fatty acid composition (Table 5), especially the proportion of unsaturated fatty acids—mainly oleic, linoleic and linolenic acids [24].
Table 5.
Mean of fatty acids composition of seed oils produced by the cultivars tested at field experiments in Giza, Egypt—combined data from 2016 and 2017 seasons.
The major components of peanut oil were oleic, linoleic, palmitic, stearic and behenic acids in all cultivars (Table 5). Looking at the unsaturated fatty acids, oleic acid (C18:1) content ranged from 39.19 to 44.98%, linoleic acid content (C18:2) ranged from 31.65 to 34.60%, and the contents of saturated fatty acids such as palmitic (C16:0), stearic (C18: 0) and behenic acid (C22:0) were lower in all cultivars compared with the unsaturated fatty acids (oleic and linoleic acids). Palmitic acid content ranged from 12.07 to 14.54%, Stearic acid content ranged from 2.69 to 4.1%, and behenic acid content ranged from 3.22 to 4.31%. All cultivars had higher contents of unsaturated fatty acids (74.59% to 77.44%) compared to their saturated fatty acid content (22.25% to 24.74%).
The analysis of variance indicated a significant difference among cultivars in terms of fatty acid contents. The Ismailia-1 cultivar had the highest content of oleic acid (44.98%), followed by Samnut-26 (41.78%), Samnut-22 (41.25%), NC-7 (40.71%), and Ex-Dakar which had the lowest content (39.19%). The cultivars Ex-Dakar, Samnut-22 and NC-7 had almost similar relatively high contents of linoleic acid (34.6%, 34.09% and 34.12%), respectively), followed by Samnut-26 and Ismailia-1 (32.54% and 31.65%). Overall, the cultivar Ismailia-1 produced the highest amount of unsaturated fatty acids (77.74%), followed by Samnut-22 (77.34%). The highest contents of palmitic and stearic acids were observed in the cultivars Ex-Dakar and Samnut-22, while the lowest contents were found in the cultivars NC-7 and Ismailia-1. The highest content of behenic acid was found in the cultivar Samnut-22 (4.31%) and the lowest was found in Ismailia-1 (3.22%). The highest content of Lignoceric acid was achieved by Samnut-22 (1.96%), followed by NC-7 (1.85%), Ex-Dakar (1.31%), Ismailia-1 (1.26%) and Samnut-26 (1.16%). Overall, the cultivar Ismailia-1 produced the lowest amount of saturated fatty acids (22.25%), followed by Samnut-22 (22.65%) while the cultivar Ex- Dakar produced the highest amount of saturated fatty acids (25.4%).
In general, all cultivars were found to have a high content of total unsaturated fatty acids and a low content of saturated fatty acids. This indicates the importance of peanut seeds in human nutrition. The differences between peanut cultivars were also reported by Bell et al. [56], Anderson et al. [53], Ishag [57], Weiss [58], Ozcan and Seven [27], Hassan et al. [59], Carrin and Carelli, [23] and Manaf et al. [60]. Additionally, high unsaturated fatty acid levels provide antioxidant properties and support several metabolic processes [28]. Variations among cultivars could be attributed to the genotypic as well as the phenotypic characters of each cultivar and the variations in their branching patterns [6].
3.3. Genetic Variations Revealed by RAPD and ISSR Analysis
The RAPD analysis revealed a total of 30amplified fragments (ranging from four to 10 bands) with 46.7% polymorphism. The polymorphism of primers OP-B18 and RMN-P1 was equal (37.5%), while that of primer RMN-P3 was 75% (Table 6). ISSR primers showed a total of 36 amplified fragments (ranging from four to seven bands) with a polymorphism of 28.9%. The polymorphism ranged from 0.0% in the primer UBC-810 to 60% in both the UBC-812 and UBC-814 primers. The Polymorphism Information Content (PIC) was used to evaluate the informative potential of markers in different accessions and germplasms [14,15,61,62]. The average PIC for RAPD was 0.21, while that of ISSR was 0.19. With the primer RMN-P3, the PIC of RAPD was 0.37 and the minimum PIC value of 0.15 was recorded with the OP-B18 primer with ISSR; the highest PIC record was 0.30 for primers UBC-812 and UBC-814, while the lowest was 0.0 for the primer UBC-810, with an average of 0.25. Ramadan et al. [17] found more discriminating results with the ISSR marker than the SCoT marker among fennel cultivars. RAPD was also found to be an effective tool in detecting genetic diversity in peanut cultivars [18]. El Atroush et al. [19] compared RAPD and ISSR’s efficacy and found that both RAPD and ISSR markers are suitable tools, but ISSR is a more viable marker than RAPD in the detection of the genetic variability among Hordeum vulgare (barley) varieties.
Table 6.
Details of marker parameters calculated for RAPD and ISSR primers.
The unbiased heterozygosity (uHe) ranged from 0.41 with the RMN-P3 primer to 0.16 with the primer OP-B18, with a mean record of 0.23 with ISSR; the uHe ranged from 0.0 with the UBC-810 primer to 0.33 with the UBC-812 and UBC-814 primers, with an average of 0.21.
The Polymorphism Information Content (PIC) was classified into three classes [63]. The highly informative markers achieve PIC values > 0.50, the reasonably informative markers have PIC values between 0.25 and 0.50 and the slightly informative markers have PIC values < 0.25. The Polymorphism Information Content (PIC) is a very important measure of DNA polymorphism, genetic variation and gene mapping. In addition, the PIC is the measure of marker informativeness, ranging from zero to one. According to this classification, the PIC value of a locus close to 1.0 with many alleles is the desirable marker for genetic diversity evaluations and analysis. Markers with PIC values lower than 0.5 are moderate informative tools, whereas those with PIC ≥ 0.5 are highly informative to detect unique loci/alleles.
The effective number of alleles (Ne) is a reciprocal of gene homozygosity [64] and, as a result, the effective number of alleles can be used to predict the He. When heterozygosity is high, Ne is also high. The Ne of RAPD primers ranged from 1.27 with OP-B18 to 1.73 with RMN-P3, with an average of 1.39 over all primers, while it varied from 1.0 with UBC-810 to 1.59 with UBC-812 and UBC-814, with an average of 1.36 over all ISSR primers.
The difference in the rate of variation among different marker systems may be related to the differences in the source of the detected diversity. Each molecular marker analysis targets a different locus or different loci in the genome. The evaluation and characterization of accessions at the molecular level help in the identification of genetic variations present in the germplasm that can be used to improve the desired traits. Morphological (phenotypic) characters are usually affected by environmental conditions [65]; therefore, their use for classification would be misleading. The use of molecular markers has become a common practice in studies of population structure, genetic diversity for pre-breeding, marker-assisted crop breeding and in distinguishing proprietary genotypes for breeding and intellectual property rights [66].
Based on the RAPD analysis, the highest pair similarity was recorded for Samnut-26 and NC-7 (0.89), followed Samnut-22 and Samnut-26 (0.86). The lowest pair similarity was recorded for Ismailia-1 and Ex-Dakar (0.62) (Table 7a). The similarity matrices based upon ISSR showed a maximum pair similarity of 0.97 for Samnut-22 and Samnut-26, followed by Samnut-26 and NC-7 (0.94). The lowest pair similarity of 0.60 was recorded for Ismailia-1 and NC-7 (Table 7b). Based on both RAPD and ISSR analyses (Table 7c), the highest pair similarity of 0.92 was recorded for Samnut-26 and NC-7 and for Samnut-22 and Samnut-26. The lowest pair similarity of 0.63 was recorded for Ismailia-1 and NC-7.
Table 7.
Similarity matrices among peanut cultivars according to Jaccard Coefficient based on RAPD and ISSR analyses.
Figure 1 shows the clustering of cultivars from the phenogram generated by UPGMA cluster analysis. The RAPD analysis formed two groups at a distance of 0.678. The first one includes Ismailia-1 only. The second group is further divided into two sub-groups at a distance of 0.842. The first sub-group includes Samnut-22 and Ex- Dakar cultivars at a distance of 0.862, while the second sub-group consists of NC-7 and Samnut-26 cultivars at a distance of 0.889. ISSR analysis revealed two groups at a distance of 0.645.
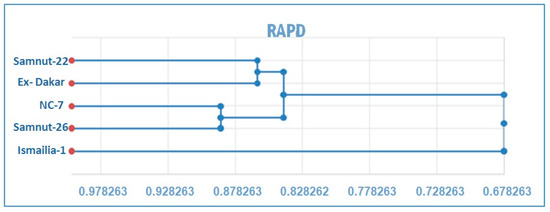
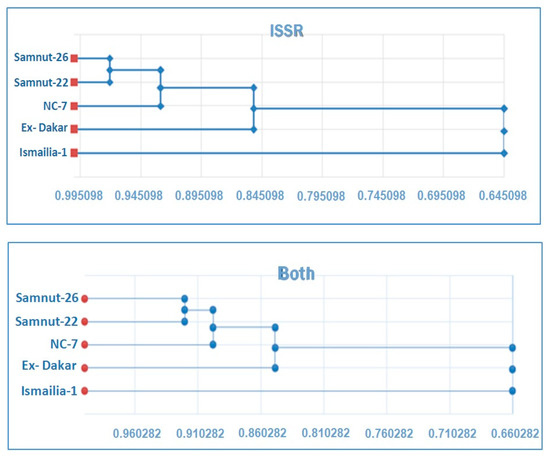
Figure 1.
Phenogram generated by unweighed pair group method arithmetic average (UPGMA) cluster analysis, based on Nei and Li Coefficient, showing the cluster of peanut cultivars.
The first group consists of Ismailia-1 only, while the second group is further divided into two subgroups at a distance of 0.852. The first subgroup includes Ex-Dakar, while the other subgroup is further split into two sub-subgroups at a distance of 0.929. The first one includes NC-7 only, whereas the other one includes Samnut-22 and Samnut-26 at a distance of 0.971. The combined molecular analyses split the cultivars into two groups at a distance of 0.66. The first group consists of Ismailia-1 only, while the other group is further split into two subgroups at 0.849 with Ex-Dakar itself, while the other subgroup is further divided into two sub-subgroups at a distance of 0.898. The first one consists of NC-7 only and the second right sub-subgroup includes Samnut-26 and Samnut-22 at a distance of 0.921. In fact, the ISSRs have a high capacity to reveal polymorphisms and offer great potential to determine intra and inter genomic diversity compared to other arbitrary primers like RAPDs [67]. Studies on Jatropha curcas [68] and Lactuca sativa L. [9] indicated a similar difference between RAPDs and ISSRs’ resolution. The two-marker techniques target different portions of the genome. The ability to resolve genetic variation among different genotype maybe more directly related to the number of polymorphisms detected with each marker technique rather than a function of which technique is employed. The differences found among the dendrogram generated by RAPDs and ISSRs could be partially explained by the different number of PCR products analyzed (735 for RAPD and 646 for ISSR), again reinforcing the importance of the number of loci and their coverage of the overall genome. Loarce et al. [69] observed the importance of the number of markers in determining the genetic relationships between rye genotypes. Another explanation could be the low reproducibility of RAPDs [70]. In this respect, Osman and Ali [71] indicated that ISSR and SCoT markers are considered powerful markers for the discrimination and identification of five studied Lathyrus species. Moreover, in a study by Akçal-Giachino [72], the RAPD and ISSR marker systems were found to be useful for determining genetic diversity in P. anisum L. and identifying variations among landraces. The differences in the clustering patterns of genotypes using RAPD and ISSR markers may be attributed to marker sampling errors and/or the level of polymorphism detected, again reinforcing the importance of the number of loci and their coverage of the overall genome in obtaining reliable estimates of genetic relationships among cultivars [69].
3.4. Size and Number of Oil Bodies
The morphological profiles of oil bodies of all cultivars exhibited spherical or ovoid shapes, except Samnut-22, where the oil bodies were rectangular in shape. Generally, there was a negative relationship between size (diameter) and the number of oil bodies in all tested cultivars (R2 = 0.82). Ex-Dakar and Samnut-22 showed a high number of oil bodies compared to other cultivars, with median diameters (D50) of 2.7 and 2.9 µm, respectively (Table 8 and Figure 2). Samnut-26 and NC-7 cultivars showed a narrower distribution, with about 50% of the oil bodies compared to other cultivars, but bigger in size. Ismailia-1 contained large oil bodies with D50 of 6.7 μm. The number of existing oil bodies in a slide measurement indicated the difference in abundance among cultivars (17, 59 and 63% in Ismailia-1, Samnut-26 and NC-7, respectively). Samnut-22 and Ex-Dakar had a higher abundance (82 and 80%, respectively) (Table 8).
Table 8.
Mean diameter and number of oil bodies in seed cells of different peanut cultivars.
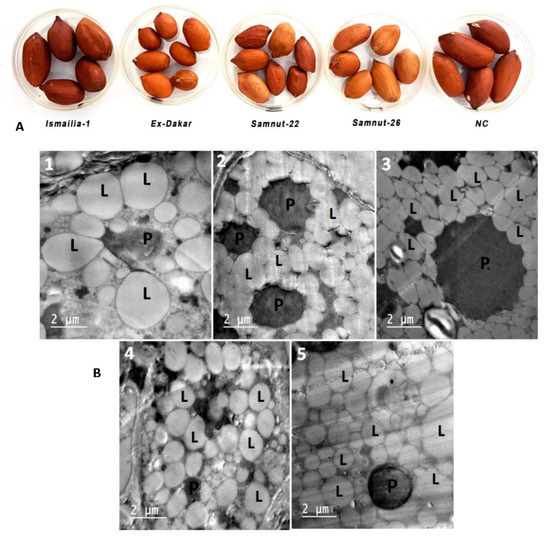
Figure 2.
(A) Picture of five cultivar seeds. (B) Transmission electron microscope (TEM) picture of five peanut cultivars: (1) Ismailia-1, (2) Ex-Dakar, (3) Samnut-22, (4) Samnut-26, and (5) NC-7. Bars represent 2 μm (P—protein bodies; L—oil bodies).
The morphological characterization of peanut seeds revealed that Ismailia-1, NC-7, and Samnut-26 cultivars had bigger sizes. Ex-Dakar and Samnut-22 were smaller in size (Figure 2A). The mean diameters and numbers of oil bodies were significantly different among cultivars. Ismailia-1 oil bodies had the largest size and smallest number (6.80 μm in diameter and 17 in number), followed by Samnut-26 (4.27 μm in diameter and 59 in number), NC-7 (3.30 μm in diameter and 63 in number), Ex-Dakar (2.95 μm in diameter and 82 in number), and Samnut-22 (2.77 μm in diameter and 80 in number) (Table 8 and Figure 2B).
Oil bodies can be found in different sizes in the same seed, but in different cells [73]. It is likely that the size of the oil bodies is affected by environmental factors such as the nutritional status of the plants (e.g., available nitrogen for oleosins and phosphate for PL). Variations among tested cultivars in terms of oil body size and number were documented in this study. In terms of oil body size, cultivars can be ranked as follows: Ismailia-1 > Samnut-26 > NC-7 > Ex-Dakar ≥ Samnut-22. This variation can be explained by the different amounts of acidic amino acid and protein structure on the surface of the oil bodies among cultivars [74]. For example, Ismailia-1 and Samnut-26 showed a wider diameter distribution than Ex-Dakar and Samnut-22, because Ex-Dakar contained more protein, and NC-7 contained much more oil. More protein was attached to oil bodies in Ex-Dakar and Samnut-22. The distributions of protein bodies and oil bodies seemed to be negatively correlated. A high oil content could mean a low protein content, and vice versa. The peanut protein and oil body extraction method may affect the yield of peanut protein and oil bodies. A peanut protein yield of 78.60% and an oil body yield of 48.44% were achieved under the optimal condition [36]. Oil bodies accumulate more in seeds’ embryo than in the endosperm [37]. This revealed that the ultrastructure of the endosperm and embryo significantly changed with the accumulation process of the oil bodies and fatty acid composition during the development [38].
In conclusion, the cultivar effect was evident in relation to seed production, quality, the size and number of oil bodies, and oil production. The effect of season was not evident, likely due to the stability of climatic conditions during the two seasons of the study. Genetic variations among peanut cultivars is of great importance in genotype selection based on stable segregating markers and could be very helpful in the conservation of germplasm resources. The cultivar Ismailia-1 had the highest oil yield and content of oleic acid in the present study, and could be a better choice for use as a parent in future breeding efforts to enhance oleic acid and oil content in peanut. The size of the oil body has been reported on in relation to the high oil yield of the Ismailia-1 cultivar compared to the number of oil bodies in Ex-Dakar and Samnut-22 cultivars, which reported low oil yields.
Author Contributions
Conceptualization, M.A. data acquisition, M.H. design of methodology H.E.-S., M.H., H.W. writing and editing, M.S. and M.A. All authors have read and agreed to the published version of the manuscript.
Funding
This research received no external funding.
Conflicts of Interest
The authors declare no conflict of interest.
References
- Etherton Kris, E.P.; Pearson, T.; Wan, Y.; Hargrove, R.; Moriarty, K.; Fishell, V.; Etherton, T. High monounsaturated fatty acid diets lower both plasma cholesterol and triacylglycerol concentrations. Am. J. Clin. Nutr. 1999, 70, 1009–1015. [Google Scholar] [CrossRef] [PubMed]
- Smith, A.F. Peanuts: The Illustrious History of the Goober Pea; University of Illinois Press: Chicago, IL, USA, 2002; pp. 8–13. [Google Scholar]
- Messina, M. Legumes and soybeans: Overview of their nutritional profiles and health effects. Am. J. Clin. Nutr. 1999, 70, 439–450. [Google Scholar] [CrossRef]
- Jiang, R.; Manson, J.; Stampfer, M.; Liu, S.; Willett, W.; Hu, F. Nut and peanut butter consumption and risk of type 2 diabetes in women. J. Am. Med. Assoc. 2000, 20, 2554–2560. [Google Scholar] [CrossRef]
- Onyeike, E.N.; Oguike, J.U. Influence of heat processing methods on the nutrient composition and lipid characterization of peanut seed pastes. Niger. Soc. Exp. Biol. 2003, 15, 34–43. [Google Scholar]
- Sevgi, C.; Mehmet, E.C.; Mehmet, A. Genotypic differences for reproductive growth, yield and yield components in peanut (Arachis hypogaea L.). Turk. J. Agric. 2008, 32, 415–424. [Google Scholar]
- Mackill, D.J. Classifying japonica rice cultivars with RAPD markers. Crop. Sci. 1995, 35, 889–894. [Google Scholar] [CrossRef]
- Hu, J.; Quiros, C.E. Identification of broccoli and cauliflower cultivars with RAPD markers. Plant Cell Rep. 1991, 10, 505–511. [Google Scholar] [CrossRef]
- Mahdy, E.M.B. Genetic Studies on some Vegetable Crops (Corchorus olitorius L. and Lactuca sativa L.). Master’s Thesis, Faculty of Agriculture, Zagazig University, Zagazig, Egypt, 2012. [Google Scholar]
- Howell, E.C.; Newbury, H.J.; Swennen, R.L.; Withers, L.A.; Ford-Lloyd, B.V. The use of RAPD for identifying and classifying Musa germplasm. Genome 1994, 37, 328–332. [Google Scholar] [CrossRef]
- Chandrashekhar, P.; Joshi, P.; Nguyen, H.T. Application of the random amplified polymorphic DNA technique for the detection of polymorphism among wild and cultivated tetraploid wheats. Genome 1993, 36, 602–609. [Google Scholar] [CrossRef]
- Yu, K.; Pauls, K.P. Rapid estimation of genetic relatedness among heterogeneous populations of alfalfa by random amplification of bulked genomic DNA samples. Theor. Appl. Genet. 1993, 86, 788–794. [Google Scholar] [CrossRef]
- Williams, C.E.; Clair, D.A.S. Phenetic relationships and levels of variability detected by restriction fragment length polymorphism and random amplified polymorphic DNA analysis of cultivated and wild accessions of Lycopersicon esculentum. Genome 1993, 36, 619–630. [Google Scholar] [CrossRef] [PubMed]
- Tatikonda, L.; Wani, S.P.; Kannan, S.; Beerelli, N.; Sreedevi, T.K.; Hoisington, D.A.; Devi, P.; Varshney, R.K. AFLP-Based molecular characterization of an elite germplasm collection of Jatropha curcas L., a biofuel plant. Plant Sci. 2009, 176, 505–513. [Google Scholar] [CrossRef] [PubMed]
- Mahdy, E.M.B. Genetical Studies on DNA Storage and Preservation on some Accessions of Cowpea Plant. Ph.D. Thesis, Faculty of Agriculture, Al Azhar University, Cairo, Egypt, 2018. [Google Scholar]
- El-Ghadban, E.A.E.; Abou El-leel, O.F.; Mahdy, E.M.B. Morphological, phytochemical and molecular characterization on some Jatropha species cultivated in Egypt. Int. J. Pharm. Sci. Sci. Res. 2017, 3, 1–13. [Google Scholar]
- Ramadan, W.; Ali, R.; Abdel-Samea, N. Assessment of genetic diversity among some fennel cultivars (Foeniculum vulgare Mill.) by ISSR and SCoT Markers. Afr. J. Biol. Sci. 2019, 15, 219–234. [Google Scholar] [CrossRef]
- Samaha, G.M.; Ahmed, M.A.; Abd El-Hameid, A.R. Assessment of growth and productivity of five peanut cultivars and genetic diversity using RAPD markers. Bull. Natl. Res. Cent. 2019, 43, 1–11. [Google Scholar] [CrossRef]
- El-Atroush, H.; El-Ashry, Z.; Osman, S. Phylogenetic relationships between ten genotype of Hordeum vulgare L. using molecular markers. Egypt. Acad. J. Biol. Sci. 2020, 12, 65–81. [Google Scholar] [CrossRef]
- Gulluoglu, L.; Bakal, H.; Onat, B.; EL Sabagh, A.; Arioglu, H. Characterization of peanut (Arachis hypogaea L.) seed oil and fatty acids composition under different growing season under Mediterranean environment. J. Exp. Biol. Agric. Sci. 2016, 4 (Suppl. V), 564–571. [Google Scholar] [CrossRef]
- O’Brien, R.D. Fats and Oils Formulating and Processing for Applications; Technomic Publishing Co., Inc.: Lancaster, PA, USA, 1998. [Google Scholar]
- Din, U.N.; Mehmood, A.; Khattak, G.S.; Saeed, I.; Hassan, M.F. High yielding peanut (Arachis hypogaea L.) variety Golden. Pak. J. Bot. 2009, 41, 2217–2222. [Google Scholar]
- Carrin, M.E.; Carelli, A.A. Peanut oil: Compositional Data. Eur. J. Lipid Sci. Technol. 2010, 112, 679–707. [Google Scholar] [CrossRef]
- Somerville, C.; Browse, J. Plant Lipids: Metabolism, Mutants, and Membranes. Plant Lipids 1991, 252, 80–87. [Google Scholar] [CrossRef]
- Griffiths, H.R.; Lunce, J. Ascorbic acid in the 21st century- move than a simple antioxidant. Environ. Toxic Pharmacol. 2001, 10, 173–182. [Google Scholar] [CrossRef]
- Mzimbiri, R.; Shi, A.E.; Liu, H.; Wang, Q. A review: Peanut fatty acids determination using hyper spectroscopy imager and its significance on food quality and safety. Food Sci. Qual. Manag. 2014, 28, 90–97. [Google Scholar]
- Ozcan, M.; Seven, S. Physical and chemical analysis and fatty acid compostion of peanut, peanut oil and peanut butter COM and NC-7 Cultivars. Grasas y Aceites 2003, 54, 12–18. [Google Scholar]
- Wang, X.D.; Song, Y.; Sheahan, M.B.; Garg, M.L.; Rose, R.J. From embryo sac to oil and protein bodies: Embryo development in the model legume Medicago truncatula. New Phytol. 2012, 193, 327–338. [Google Scholar] [CrossRef]
- Tzen, J.T.C. Integral proteins in plant oil bodies. Int. Sch. Res. Not. 2012, 2012, 173954. [Google Scholar] [CrossRef]
- Huang, A.H.C. Oleosins and oil bodies in seeds and other organs. Plant Physiol. 1996, 110, 1055–1061. [Google Scholar] [CrossRef]
- Tzen, J.T.C.; Cao, Y.Z.; Laurent, P.; Ratnayake, C.; Huang, A.H.C. Lipids, proteins, and structure of seed oil bodies from diverse species. Plant Physiol. 1993, 101, 267–276. [Google Scholar] [CrossRef]
- Shibli, S.; Siddique, F.; Raza, S.; Ahsan, Z.; Raza, I. Chemical composition and sensory analysis of peanut butter from indigenous peanut cultivars of Pakistan. Pak. J. Agric. Res. 2019, 32, 159–169. [Google Scholar] [CrossRef]
- Yusuf, Z.; Hugo, A.; Zeleke, H.; Mohammed, W.; Hussein, S. Fatty acid profile of groundnut (Arachis hypogaea L.) cultivars in Ethiopia. Int. J. Hortic. Sci. Ornam. Plants 2019, 5, 86–91. [Google Scholar]
- Bera, S.K.; Kamdar, J.H.; Kasundra, S.V.; Patel, S.V.; Jasani, M.D.; Maurya, A.K.; Dash, P.; Chandrashekar, A.B.; Rani, K.; Manivannan, N.; et al. Steady expression of high oleic acid in peanut bred by marker-assisted backcrossing for fatty acid desaturase mutant alleles and its effect on seed germination along with other seedling traits. PLoS ONE 2019, 14, e0226252. [Google Scholar] [CrossRef]
- Zahran, H.A.; Tawfeuk, H.Z. Physicochemical properties of new peanut (Arachis hypogaea L.) varieties. OCL 2019, 26, 1–7. [Google Scholar] [CrossRef]
- Liu, C.; Hao, L.; Chen, F.; Yang, C. Study on extraction of peanut protein and oil bodies by aqueous enzymatic extraction and characterization of protein. J. Chem. 2020, 2020. [Google Scholar] [CrossRef]
- Zou, Y.; Wang, Y.; Zhu, M.; Li, S.; Ma, Q. The development of Paeonia ostii seeds and oil quality formation. HortScience 2020, 55, 1210–1215. [Google Scholar] [CrossRef]
- Xu, L.; Yu, F.; Secundo, F. Ultrastructural changes in oil bodies accumulation and fatty acids composition during seed development of Styrax tonkinensis. Int. J. Agric. Biol. 2020, 24, 927–934. [Google Scholar] [CrossRef]
- AOAC. Association of Official Agricultural Chemists Methods of Analysis, 12th ed.; AOAC: Washington, DC, USA, 1995. [Google Scholar]
- Rozes, N.; Garbay, S.; Denayrolles, M.; Lonvaud-Funel, A. A rapid method for the determination of bacterial fatty acid composition. Lett. Appl. Microbiol. 1993, 17, 126–131. [Google Scholar] [CrossRef]
- Weising, K.; Nybom, H.; Wolff, K.; Kahl, G. DNA Fingerprinting in Plants, Principles, Methods, and Applications, 2nd ed.; Taylor and Francis: Abingdon, UK, 2005. [Google Scholar]
- Peakall, R.; Smouse, P.E. GenAlEx 6: Genetic analysis in Excel. Population genetic software for teaching and research. Mol. Ecol. Notes 2006, 6, 288–295. [Google Scholar] [CrossRef]
- Li, Z.; Furnier, G.R. Comparison of allozyme, RFLP, and RAPD markers for revealing genetic variation within and between trembling aspen and bigtooth aspen. Theor. Appl. Genet. 1993, 87, 97–105. [Google Scholar] [CrossRef]
- Peakall, R.; Smouse, P.E.; Huff, D.R. Evolutionary implications of allozyme and RAPD variation in diploid populations of dioecious buffalo grass Buchloe dactvloides. Mol. Ecol. 1995, 4, 135–147. [Google Scholar] [CrossRef]
- Nei, M. Analysis of gene diversity in subdivided populations. Proc. Natl. Acad. Sci. USA 1973, 70, 3321–3323. [Google Scholar] [CrossRef]
- Steel, R.G.D.; Torrie, J.H.; Dickey, D.A. Principles and Procedures of Statistics: A Biometrical Approach, 3rd ed.; McGraw-Hill: New York, NY, USA, 1997. [Google Scholar]
- Freed, R.; Einensmith, S.P.; Guetz, S.; Reicosky, D.; Smail, V.W.; Wolberg, P. User’s Guide to MSTAT-C Analysis of Agronomic Research Experiments; Michigan State University: East Lansing, MI, USA, 1989. [Google Scholar]
- Abdel-Motagally, F.M.F.; Mahmoud, M.W.S.; Ahmed, E.M. Response of two peanut varieties to foliar spray of some micronutrients and sulphur application under East of El-Ewinat Conditions. Assiut J. Agric. Sci. 2016, 47, 14–30. [Google Scholar]
- Iledun, O.C.; Harira, S.; Tanko, M.U. Sustainable crop production: Growth and yield response of three varieties of groundnut (Arachis hypogeal L.) sown to three weeding regimes and two plant spacing in Anyigba, Kogi State, Nigeria. J. Int. Sci. Publ. 2016, 4, 373–385. [Google Scholar]
- Shams El-Din, G.M.; Ali, E.A. Upgrading productivity of two peanut (Arachis hypogaea L.) varieties through applying optimum plant spacing and micronutrients application. Arab Univ. J. Agric. Sci. Ain Shams Univ. Cairo 1996, 4, 53–67. [Google Scholar]
- Tarawali, A. Response of groundnut (Arachis hypogaea L) varieties to phosphorous in three agro ecologies in Sierra Leone. Int. J. Agric. For. 2014, 4, 106–111. [Google Scholar] [CrossRef]
- Abd-Alla, M.M. Effect of certain agricultural practices on productivity of peanut I- Influence of sowing dates and potassium application on yield and yield attributes of some peanut cultivars. Zagazig J. Agric. Res. 2004, 31, 843–866. [Google Scholar]
- Andersen, P.C.; Gorbet, D.W. Influence of year and planting date on fatty acid chemistry of high oleic acid and normal peanut genotypes. J. Agric. Food Chem. 2002, 50, 1298–1305. [Google Scholar] [CrossRef] [PubMed]
- Isleib, T.G.; Tillman, B.L.; Pattee, H.E.; Sanders, T.H.; Hendrix, K.W.; Dean, L.O. Genotype-by-environment interaction for seed composition traits of breeding lines in the uniform peanut performance test. Peanut Sci. 2008, 35, 130–138. [Google Scholar] [CrossRef]
- Chaiyadee, S.; Jogloy, S.; Songsri, P.; Singkham, N.; Vorasoot, N.; Sawatsitang, P.; Holbrook, C.C.; Patanothai, A. Soil moisture affects fatty acids and oil quality parameters in peanut. Int. J. Plant Prod. 2013, 7, 81–96. [Google Scholar] [CrossRef]
- Bell, M.J.; Shorter, R.; Mayer, R. Cultivar and environmental effect on growth and development of peanuts (Arachis hypogaea) 11. reproductive development. Field Crop. Res. 1991, 27, 35–49. [Google Scholar] [CrossRef]
- Ishag, H.M. Phenotypic and yield response of irrigated peanut cultivar in a hot environment. Exp. Agric. 2000, 36, 303–312. [Google Scholar] [CrossRef]
- Weiss, E.A. Oil Seed Crops; Black Well Science Ltd.: Paris, France; Tokyo, Japan; Berlin, Germany; Victoria, Australia, 2000; p. 364. [Google Scholar]
- Hassan, F.U.; Manaf, A.; Ejaz, M. Determinants of oil and fatty acid accumulations in peanut. Int. J. Agric. Biol. 2005, 7, 895–899. [Google Scholar]
- Manaf, A.; Muhammad, N.A.; Muhammad, T.S.; Muhammad, I.; Humair, A. Yield quality of peanut genotypes as effected by different sources of sulphur under rainfed conditions. Soil Environ. 2017, 36, 166–173. [Google Scholar] [CrossRef]
- Gomes, S.; Martins-Lopes, P.; Lopes, J.; Guedes-Pinto, H. Assessing genetic diversity in Olea europaea L. using ISSR and SSR markers. Plant Mol. Biol. Rep. 2009, 27, 365–373. [Google Scholar] [CrossRef]
- Grativo, C.; Lira-Medeiros, C.d.; Hemerly, A.S.; Ferreira, P.C.G. High efficiency and reliability of inter-simple sequence repeats (ISSR) markers for evaluation of genetic diversity in Brazilian cultivated Jatropha curcas L. accessions. Mol. Biol. Rep. 2011, 38, 4245–4256. [Google Scholar] [CrossRef]
- Botstein, D.; White, R.L.; Skolnick, M.; Davis, R.W. Construction of a genetic map in man using restriction fragment length polymorphism. Am. J. Hum. Genet. 1980, 32, 314–331. [Google Scholar]
- Hartl, D.L.; Clark, A.G. Principles of Population Genetics, 3rd ed.; Sinauer Associates, Inc.: Sunderland, MA, USA, 1997. [Google Scholar]
- Abdel Kalil, K.; Abd El-Twan, M.; Galal, R. Genetic diversity and relationships among Egyptian Galium (Rubiaceae) and related species using ISSR and RAPD markers. Biologia 2014, 69, 300–310. [Google Scholar] [CrossRef]
- Langridge, P.; Chalmers, K.J. The Principle: Identification and Application of Molecular Markers. In Molecular Marker Systems in Plant Breeding and Crop Improvement; Biotechnology in Agriculture and Forestry 55; Lörz, H., Wenzel, G., Eds.; Springer: Berlin/Heidelberg, Germany, 2004; Chapter 1.1; pp. 3–22. [Google Scholar]
- Zietkiewicz, E.; Rafalski, A.; Labuda, D. Genome fingerprinting by simple sequence repeat (SSR)-anchored polymerase chain reaction amplification. Genomics 1994, 20, 176–183. [Google Scholar] [CrossRef]
- Gupta, S.; Srivastava, M.; Mishra, G.P.; Naik, P.K.; Chauhan, R.S.; Tiwari, S.K.; Kumar, M.; Singh, R. Analogy of ISSR and RAPD markers for comparative analysis of genetic diversity among different Jatropha curcas genotypes. Afr. J. Biotechnol. 2008, 7, 4230–4243. [Google Scholar]
- Loarce, Y.; Gallego, R.; Ferrer, E. A comparative analysis of genetic relationships between rye cultivars using RFLP and RAPD markers. Euphytica 1996, 88, 107–115. [Google Scholar] [CrossRef]
- Karp, A.; Edwards, K.; Bruford, M.; Vosman, B.; Morgante, M.; Seberg, O.; Kremer, A.; Boursot, P.; Arctander, P.; Tautz, D.; et al. Newer molecular technologies for biodiversity evaluation: Opportunities and challenges. Nat. Biotechnol. 1997, 15, 625–628. [Google Scholar] [CrossRef] [PubMed]
- Osman, S.A.; Ali, H.B.M. Genetic Diversity of Five Lathyrus Species using RAPD, ISSR and SCoT Markers. Asian J. Plant Sci. 2020, 19, 152–165. [Google Scholar] [CrossRef]
- Akçal-Giachino, R.R. Investigation of the genetic variation of anise (Pimpinella anisum L.) using RAPD and ISSR markers. Genet. Resour. Crop. Evol. 2020, 67, 763–780. [Google Scholar] [CrossRef]
- Trelease, R.N. Changes and Characteristics of Lipid Bodies during Development. Ph.D. Thesis, University of Texas, Austin, TX, USA, 1969. [Google Scholar]
- Wang, L.; Wang, Q.; Liu, H.; Liu, L.; Du, Y. Determining the contents of protein and amino acids in peanuts using nearinfrared reflectance spectroscopy. J. Sci. Food Agric. 2013, 93, 118–124. [Google Scholar] [CrossRef]
© 2020 by the authors. Licensee MDPI, Basel, Switzerland. This article is an open access article distributed under the terms and conditions of the Creative Commons Attribution (CC BY) license (http://creativecommons.org/licenses/by/4.0/).