Article

Soil-Mediated Effects on Weed-Crop Competition: Elucidating the Role of Annual and Perennial Intercrop Diversity Legacies

by
Uriel D. Menalled
1,*,
K. Ann Bybee-Finley
1,
Richard G. Smith
2,
Antonio DiTommaso
1,
Sarah J. Pethybridge
3 and
Matthew R. Ryan
1
1
Soil and Crop Sciences Section, School of Integrative Plant Science, Cornell University, Ithaca, NY 14853, USA
2
Department of Natural Resources and the Environment, University of New Hampshire, Durham, NH 03824, USA
3
Plant Pathology and Plant-Microbe Biology Section, School of Integrative Plant Science, Cornell University, Geneva, NY 14456, USA
*
Author to whom correspondence should be addressed.
Agronomy 2020, 10(9), 1373; https://doi.org/10.3390/agronomy10091373
Submission received: 18 August 2020 / Accepted: 11 September 2020 / Published: 12 September 2020
(This article belongs to the Special Issue Conservation Agriculture and Agroecological Weed Management)

Abstract

:
Crop diversity may mediate the intensity of weed-crop competition by altering soil nutrient availability and plant-soil microbe interactions. A greenhouse experiment was conducted to analyze weed-crop competition in soils with varying crop diversity legacies. Soil greenhouse treatments included field soils (i.e., soil nutrient and microbial legacies), a sterile greenhouse potting mix inoculated with microorganisms of the field soils (i.e., microbial legacies), and a sterile greenhouse potting mix. Soils for the greenhouse experiment were sampled and assessed after two-years of conditioning with annual and perennial cropping systems under four levels of intercrop diversity. The greenhouse experiment involved growing one sorghum sudangrass (Sorghum bicolor (L.) Moench × S. sudanese Piper) crop plant and zero to six common lambsquarters (Chenopodium album L.) weed plants in soil from each diversity and cropping system treatment. The weed density treatments created a weed-crop competition gradient, which was used to quantify legacy effects of crop diversity. Weed-crop competition increased with crop diversity in both the field soil and inoculated soil treatments in the annual system. In the perennial system, differences in weed-crop competition intensity were driven by crop yield potential. In the perennial field soil treatment, crop yield potential was greatest in the highest diversity treatment, whereas in the perennial inoculated soil treatment, crop yield potential was greatest in the lowest diversity treatment. Results show potential for negative effects from previous crop diversity on weed-crop competition, and the divergent impact of microbial and nutrient legacies on crop yield potential. Future research should aim to evaluate the consistency of legacy effects and identify principles that can guide soil and crop management, especially in conservation agriculture where soil tillage and its microbial legacy reducing effects are minimized.

1. Introduction

Agricultural systems can be enhanced by understanding the drivers of weed-crop competition. Weed-crop competition is a major constraint to yield [1]. Pimentel et al. [2] estimated that cropland weeds in Australia, Brazil, India, South Africa, the United Kingdom, and the United States have a combined annual cost of US$87.4 billion. Yet, despite decades of research on plant competition, our understanding of how specific farm management practices affect weed-crop competition remains limited. Research on the mechanisms that drive belowground competition and how management practices contribute to these effects is important for developing ecological weed management strategies that reduce the need for tillage and herbicides.
Conservation agriculture focuses on (1) reducing soil disturbance, (2) maintaining vegetative soil cover, and (3) diversifying crop rotations [3]. Many farmers use herbicide-based weed control for conservation agriculture [4,5]. Such overreliance on herbicides is problematic because of the development of herbicide-resistant weeds, non-target impacts on biodiversity, and human health concerns associated with exposure to herbicides [6]. Ecological weed management will facilitate the sustainable intensification of conservation agriculture by reducing farmer reliance on herbicides. One approach to ecological weed management is to use cultural practices such as intercropping to reduce competition from weeds on the crop [7]. However, the effect of soil and crop management practices on the belowground biotic processes that influence weed-crop competition is understudied [8,9].
The resource pool diversity hypothesis (RPDH) states that both the diversity of crops and farm management practices (e.g., fertility types, tillage events, and machinery used) influence weed-crop competition, with reduced weed-crop competition in diversified systems [10]. Ryan et al. [11] found support for the RPDH’s postulation that farm management influences soil resources, reporting increased soil carbon and faster crop growth in organic cropping systems with legume or manure-based fertility compared to a conventional system with a less diverse crop rotation. Despite four- to seven-fold greater weed biomass in the organic systems, maize yields in the organic and conventional systems were similar. These results suggest that soils of the organic cropping systems, which had greater crop rotation diversity and organic fertility sources, reduced weed-crop competition. Correspondingly, in their comparison of nine organic and conventional cropping systems that varied in crop diversity and fertility sources, Smith et al. [10]. found that the intensity of weed-crop competition tended to decrease with increasing crop diversity.
The interactive effects of soil microbes and plant diversity on weed-crop competition is poorly understood. Soil microbes can mediate species-specific resource acquisition and influence belowground niche partitioning. The microbial-mediated resource hypothesis postulates that diverse microbe-plant associations allow for the exploitation of more soil-resources [12]. This theory is supported by work suggesting that plant-microbe interactions affect plant community composition [12,13,14,15,16,17], and competition dynamics [18].
The reciprocal interactions between plants and their rhizosphere microbes is referred to as plant-soil feedback (PSF). Positive PSFs can result from symbiotic plant-microbe relationships like rhizobacteria-mediated nitrogen fixation [19], whereas negative PSFs may arise from plant pathogens [20]. Agricultural management practices have notable effects on PSFs. The identity of species in a crop rotation can contribute up to 80% of variation in PSFs [18], and more diverse rotations can reduce plant pathogen densities and promote positive PSFs [21]. Furthermore, farm system management decisions like tillage intensity and the incorporation of livestock grazing can influence PSF magnitude and direction [22]. Understanding how farm practices influence PSFs is important because soils with positive crop PSFs may reduce the intensity of weed-crop competition [21]. Thus, managing farms to enhance beneficial PSFs for crops may improve weed management and farm sustainability by reducing the need for external inputs.
We sought to elucidate the role of intercrop diversity legacies on weed-crop competition in a greenhouse study using soils conditioned by differing levels of crop diversity in annual and perennial cropping systems. The analysis of soils from annual and perennial cropping systems is particularly relevant for conservation agriculture because the perennial system, which had no soil disturbance, closely aligns with the conservation agriculture principle of minimizing soil tillage. We hypothesized that following the RPDH and the microbial-mediated resource hypothesis, weed-crop competition intensity would be greater in soils from lower (i.e., low and conspecific) compared with higher (i.e., heterospecific and high) diversity treatments.

2. Materials and Methods

2.1. Soil Conditioning Treatments

The conditioning phase was conducted as part of a field experiment in which annual and perennial crops were grown under four levels of cropping system diversity from the summer of 2016 to the fall of 2018 on a Honeoye (fine-loamy, mixed, semiactive, mesic Glossic Hapludalfs) and Lima (fine-loamy, mixed, semiactive, mesic Oxyaquic Hapludalfs) silt loam. The field site (42°44′10.5″ 76°39′11.3″ W) has a mean monthly temperature range between −4 and 22 °C and an average of 92 cm of precipitation each year, with the majority of precipitation in the spring to early summer [23]. The diversity treatments in both the annual and perennial cropping system were established following a replacement design with seeding rates proportional to the recommended monoculture rate [24]. In the annual system, the ‘low’ diversity treatments were monocultures of sorghum sudangrass (Sorghum bicolor (L.) Moench × S. sudanese Piper) planted in spring and triticale (× Triticosecale Wittm. ex A. Camus) in fall; one variety of alfalfa (Medicago sativa L.) was grown in the perennial ‘low’ diversity treatment (Table 1). Four varieties of the aforementioned crops were planted in the ‘conspecific’ diversity treatments. The ‘heterospecific’ diversity treatment included four species: sudangrass (Sorghum bicolor (L.) Moench), pearl millet (Pennisetum glaucum (L.) R. Br.), sorghum sudangrass, and annual ryegrass (Lolium multiflorum Lam.) in the spring, and triticale, red clover (Trifolium pratense L.), winter pea (Pisum sativum L.), and cereal rye in the fall. In the perennial system, the ‘heterospecific’ treatment included intercropped alfalfa, orchardgrass (Dactylis glomerata L.), timothy (Phleum pratense L.), and white clover (Trifolium repens L.). The ‘high’ diversity treatment included four varieties of each of the different species in the ‘heterospecific’ treatment. Throughout the conditioning phase, USDA certified organic practices were used. Diversity treatment plots for both the annual and perennial cropping systems measured 9.1 × 15.2 m and were replicated four times in a randomized complete block design.
Fertilization and tillage were consistent within the annual and perennial systems throughout the conditioning phase. Annual crops were fertilized primarily based on nitrogen requirements while potassium requirements drove fertility decisions in the perennial crops (Table S1). Fertilization rates were dependent on yearly soil recommendations and were carried out with 5-4-3 and 8-2-2 poultry manure applications (Kreher’s, Clarence, NY, USA). The annual system was chisel plowed and roller harrowed before each seeding event, whereas in the perennial system, no additional tillage was used after crop establishment in 2016. In the annual system, crops were planted and harvested based on the maturity of the cultivar in the low diversity treatment. The winter annuals were harvested when the triticale was in Zadok’s growth stage 47 [25]; summer annuals were cut when the sudangrass was 0.91 m tall [26]. In the perennial system, herbage was cut when the alfalfa had one to two buds per node [27]. Herbage was removed from the entire plot at each harvest.

2.2. Conditioning Phase Crop Sampling

Data from the last harvest of the conditioning phase were used to contextualize results from the subsequent greenhouse experiment. Crop species abundance was sampled with two 0.25 m2 quadrats that were randomly placed within each plot (n = 32). While sampling, a 1 m margin was maintained to minimize edge effects. Biomass was clipped at the soil surface and sorted by species at the subplot level (n = 32). Annual crops were sampled on 8 August 2018 and perennial crops on 3 October 2018. Samples were dried at 60 °C for one week and weighed.

2.3. Soil Sampling and Testing

Soil was sampled in all treatment replicates in both the annual and perennial systems at the end of the conditioning phase on 26 October 2018. Four samples were collected from randomly selected areas in each plot (n = 32) with a 10.8-cm-diameter soil probe to a depth of 20 cm. Soil was homogenized and stored at approximately 5 °C in the shade during the sampling event. Immediately after sampling, soils were sent to Dairy One (Ithaca, NY, USA) and the Cornell Soil Health Testing Laboratory (Ithaca, NY, USA) for physiochemical characterization.
A second set of soil samples for microbial analysis and the greenhouse experiment were taken on 6 November 2018. During this sampling event, all equipment was sterilized with 70% ethanol between plots to avoid cross-contamination. Four samples were taken from each plot with a 10.8-cm-diameter soil probe at a depth of 20 cm. Immediately after collection, soil was homogenized and placed on ice. Once back in the laboratory, soils were stored in a −10 °C freezer or mailed in a cooler with dry ice for microbial enzyme analysis no later than 48 h after sampling.
Microbial enzyme activity was determined following the procedures of Saiya-Cork et al. [28] and Neher et al. [29]. Briefly, 200 μL of 4-methylumbelliferyl-b-D-glucoside (BG) and 4-methylumbelliferyl-N-acetyl-b-D-glucosaminide (NAG) substrates were fluorogenically labeled with methylumbelliferone (MUB) and methylcoumarin (MC). Quench standards were 50 μL of standard (10 mM MUB, or MC in the case of leucine) + 200 μL sample suspension. Each blank, negative control, and quench had eight 50 μL of standard + 200 μL acetate buffer replicate wells. Fluorescence was analyzed with a FLx800 microplate fluorometer (BioTek Instruments, Inc., Winooski, VT, USA) fit with 360 nm excitation and 460 nm emission filters. Enzyme activity calculations were corrected with the standards and buffers. Refer to Saiya-Cork et al. [28] and Neher et al. [29] for more details about enzyme testing.
Percent gravel was calculated after sieving soil to 2 mm. Gravimetric moisture was calculated by measuring soil weight before and after 24 h in a 100 °C oven. Soil organic matter, mineral fraction, and pH were measured at Dairy One (Ithaca, NY, USA). Briefly, all soils were dried at 50 °C and ground to pass through a 2 mm sieve. Soil organic matter was calculated based on loss on ignition at 500 °C. Phosphorous, potassium, magnesium, and calcium were calculated using a Morgan extraction with sodium acetate at pH 4.8. Morgan extractions were analyzed with a thermal iCAP 6000 (ThermoFisher Scientific, Waltham, MA USA). Soil pH was quantified with a lab fit AS3010D robotic pH meter (LabFit, Bayswater, Australia). Bulk density, aggregate stability, and respiration were quantified at the Cornell Soil Health Laboratory following protocols in the Comprehensive Assessment of Soil Health [30].

2.4. Greenhouse Experiment

Weed-crop competition was quantified in two soil treatments: (1) a 50:50 mix of conditioned soil and sterile potting mix (referred to as the “field” soil treatment) and (2) a 5:95 mix of conditioned soil and sterile potting mix (referred to as the “inoculated” soil treatment). A 50:50 mix of conditioned soil and sterile potting mix for the field soil treatment was chosen to ensure adequate water infiltration through the pots. The field soil treatment was intended to maintain the nutrient legacies and microbial communities from the conditioning phase. Conversely, the 5:95 mix of conditioned soil and sterile potting mix for the inoculated soil treatment was used to minimize nutrient differences between treatments while maintaining their unique microbial communities. While this inoculation technique may potentially weaken the effects of soil microbes [19], various studies report measurable PSFs using this method [18,21,22,31]. Furthermore, because the 50:50 ratio of conditioned soil and sterile potting mix is well above the accepted amount of conditioned soil used to isolate soil microbiota for PSF studies, the field soil treatment was assumed to have both nutrient and microbial legacies of the field experiment treatments. A control was established with 100% sterile potting mix (referred to as the “inert” soil treatment).
The main greenhouse treatment was cropping system legacy (annual or perennial), the subplot treatment was diversity legacy (low, conspecific, heterospecific, or high), and the sub-subplot competition treatment was weed density (0, 1, 3, or 6 weeds). A total of 272 pots were used in the greenhouse experiment ((2 systems × 4 diversity treatments × 4 weed density treatments × 4 replications = 128 field soil treatment pots) + (2 systems × 4 diversity levels × 4 weed density treatments × 4 replications = 128 inoculated soil treatment pots) + (4 weed density treatments × 4 replications = 16 inert soil treatment pots)) (Figure 1). Pots were 6.3 L and had been sterilized by autoclaving and rinsing in 70% ethanol. The potting mix was 60% autoclaved vermiculite and 40% triple washed and kiln dried sand (Quikrete®, Atlanta, GA, USA). To ensure plant growth, 2.34 g (112 kg ha−1) of 15-9-12 Osmocote Plus 3–4 month was added to all pots (The Scotts Company, Marysville, OH, USA).
All pots were seeded with five sorghum sudangrass crop seeds. Except for pots in the weed-free treatment, all samples were seeded with approximately 100 common lambquarters (Chenopodium album L.) weed seeds. Common lambquarters was selected because it is a summer annual broadleaf agronomic weed [32]. Furthermore, depending on emergence timing, common lambsquarters can reduce summer annual grass crop yields up to 70% [33]. Considering the prevalence of common lambsquarters in sorghum sudangrass production and its yield reducing effect on related crops, it likely competes with sorghum sudangrass for similar resources and weed-crop competition could be affected by changes in soil conditioning. While common lambquarters is nonmycorrhizal [34,35], its competitiveness is affected by soilborne pathogen density [36]. At plant emergence, one sorghum sudangrass plant and one, three, or six common lambquarters per pot were allowed to grow. All other seedlings were removed prior to cotyledon development. The greenhouse was maintained at 25 °C and a 16 h photoperiod. Plants were watered to keep soil moist throughout the experiment. Eleven weeks after seeding, crop and weed plants were cut at the soil surface, dried at 60 °C for one week, and weighed.

2.5. Statistical Analysis

All statistical analyses were done in R version 3.6.1 [37]. The ‘lmerTest’ package [38] was used for linear mixed-effects models. All linear mixed-effects models were assessed with type III analysis of variance (ANOVA) tests from the R ‘stats’ package [37] and post-hoc FisherLSD least-squares means comparisons with the ‘emmeans’ package [39]. Assumptions of homoscedasticity and normality were confirmed before model analysis. All non-linear analyses were conducted with the ‘nlme’ package [40].
Soil nutrient, chemical, and physical characteristics and conditioning phase crop biomass data were used to interpret the results of the greenhouse competition study. Linear mixed-effects models were fit to the 2018 soil health data where system and diversity treatments and their interaction were fixed effects and field block was a random effect. To broadly describe the crop functional legacies of the conditioning phase, crop biomass data were pooled by the ability of crops to fix nitrogen (e.g., grass or legume). Separate linear mixed-effects models were fit to the grass, legume, and total crop biomass data. In each model, fixed effects were system and diversity treatments and their interaction; field block was a random effect.
Data from the field and inoculated soil treatments were analyzed separately to account for the effect of the different soil media on plant growth. Yield potential was assessed through linear mixed-effects models that projected crop biomass in the weed-free treatment as a function of system and diversity treatments and their interaction as fixed effects and greenhouse block as a random effect.
Crop biomass data in the inoculated and inert soil treatments were compared to assess the effect of soil microbes on crop growth. Microbial effects on plant growth were calculated following the plant-soil feedback (PSF) equation proposed by Brinkman et al. [19] and used by Johnson et al. [21], Menalled, Seipel, and Menalled [22], and Miller and Menalled [18]:
P S F s d w b = l n ( b i o m a s s s d w b ( B A + ) b i o m a s s w b ( B A ) ) ,
where biomasssdwb (BA+) denotes the biomass of sorghum sudangrass grown in the inoculated soil treatment from management system s, conditioned by diversity level d, and subjected to weed density level w of block b; biomasswb (BA−) denotes the biomass of sorghum sudangrass grown in the inert soil treatment subjected to weed density level w in block b. Positive PSF values indicate that soil microbial communities enhanced crop growth relative to a sterile soil medium while negative PSFs indicate that soil microbes suppressed crop growth relative to a sterile soil medium [19]. PSF values were modeled through linear mixed-effects models with system and diversity treatments and their interaction as fixed effects and greenhouse block as a random effect.
Weed-crop competition was assessed through an inverse hyperbolic function [11,41]:
Y c = 1 a 0 N c 1 + i w N w ,
where crop yield (Yc; g pot−1) is modeled as the reciprocal of a crop yield potential parameter (a0; pots g−1) per unit of crop density (Nc; plants pot−1) divided by the yield-reducing effect of weeds (iw; plants g−1) per unit of weed biomass (Nw; g pot−1). Weed biomass values were a product of the four common lambsquarters weed density treatments. The crop yield-reducing effect of weeds (iw; plants g−1) describes competitive intensity and a higher iw value denotes more intense weed-crop competition (i.e., the negative effect of weeds on the crop). Curves were compared using an F-test [11]:
F = ( S S E C o m b i n e d S S E S e p a r a t e ) / ( d f C o m b i n e d d f S e p a r a t e ) S S E S e p a r a t e / d f S e p a r a t e ,
where SSECombined is the sum of squares of a curve from a full model with data from two diversity treatments; SSESeparate is the sum of squares of two reduced models where curves were fit to each diversity treatment separately; dfCombined is the degrees of freedom of the full model and; dfSeparate is the sum of degrees of freedom of the reduced models. The resulting F-statistic was contrasted against an F-distribution to determine significance.

3. Results and Discussion

3.1. Conditioning Phase Soil Characteristics and Crop Biomass

After two years of conditioning by the continuous growth of crops differing in intercrop diversity, soil properties only differed at the cropping systems (annual versus perennial) level (Table 2). Of the 12 soil metrics quantified, only bulk density, pH, gravimetric moisture, phosphorus, potassium, and calcium differed between systems.
Differences in management at the cropping systems-level likely caused the observed differences between soil properties. The lower bulk density of the annual system (p < 0.01) was likely driven by greater tillage in the 20 cm soil sampling zone. Previous comparisons of topsoil in tilled and no-till systems report tillage-induced reduction of bulk density [42,43,44,45]. In turn, greater gravimetric moisture in the annual soil may have been a product of its reduced bulk density. However, despite statistical significance, the bulk density and gravimetric moisture differences between cropping systems were small and likely of limited ecological relevance.
Soil nutrient differences between systems may have been due to contrasting fertilization practices used in the two cropping systems. Throughout the conditioning phase, more poultry manure was applied to the annual cropping system compared to the perennial cropping system (Table S1). The annual crops required more poultry manure because there were less legumes, and consequently greater nitrogen requirements. Given the high proportion of phosphorous in poultry manure, it is likely that the higher phosphorous levels in the annual soils (p < 0.001) were a product of fertilization. In the perennial soils, there was more potassium applied than nitrogen and phosphorous (Table S1), likely causing higher soil potassium concentrations in the perennial soils (p < 0.001). Greater poultry manure application rates to the annual soils and greater potassium sulfate applications in the perennial soils may have contributed to differences in pH between systems (p < 0.001) [46].
Table 2. Soil characteristics from 2018 field sampling. Soil samples were taken within 11 days of soil sampling for the greenhouse experiment. During both sampling events, soil was taken to a depth of 20 cm. In the table, SOM is soil organic matter, BG is β-1,4-glucosidase, and NAG is β-1,4-N-acetylglucosaminidase; P, K Mg, and Ca stand for phosphorus, potassium, magnesium, and calcium, respectively. BG influences cellulose decomposition and NAG affects the degradation of chitin [47]. Numbers following the diversity, system, and diversity × system effects are p-values obtained from linear mixed effects models; bold font indicates p < 0.05. Numbers following the annual and perennial system are cropping system mean values.
SOMBulk DensitypHAggregate StabilityGravimetric MoistureRespirationPKMgCaBGNAG
Effectp-value
Diversity (D)0.740.080.450.400.520.920.320.400.630.760.330.30
System (S)0.960.0010.00020.400.010.45>0.0001>0.00010.300.040.950.72
D × S0.940.500.470.520.910.960.260.160.700.380.230.24
System(%)(g/cm3) (%)(%)(mgC/g)(ppm)(ppm)(ppm)(ppm)(nmol/h/g)(nmol/h/g)
Annual3.811.327.92270.200.757.044332230588617
Perennial3.801.337.85290.190.735.066130927778718
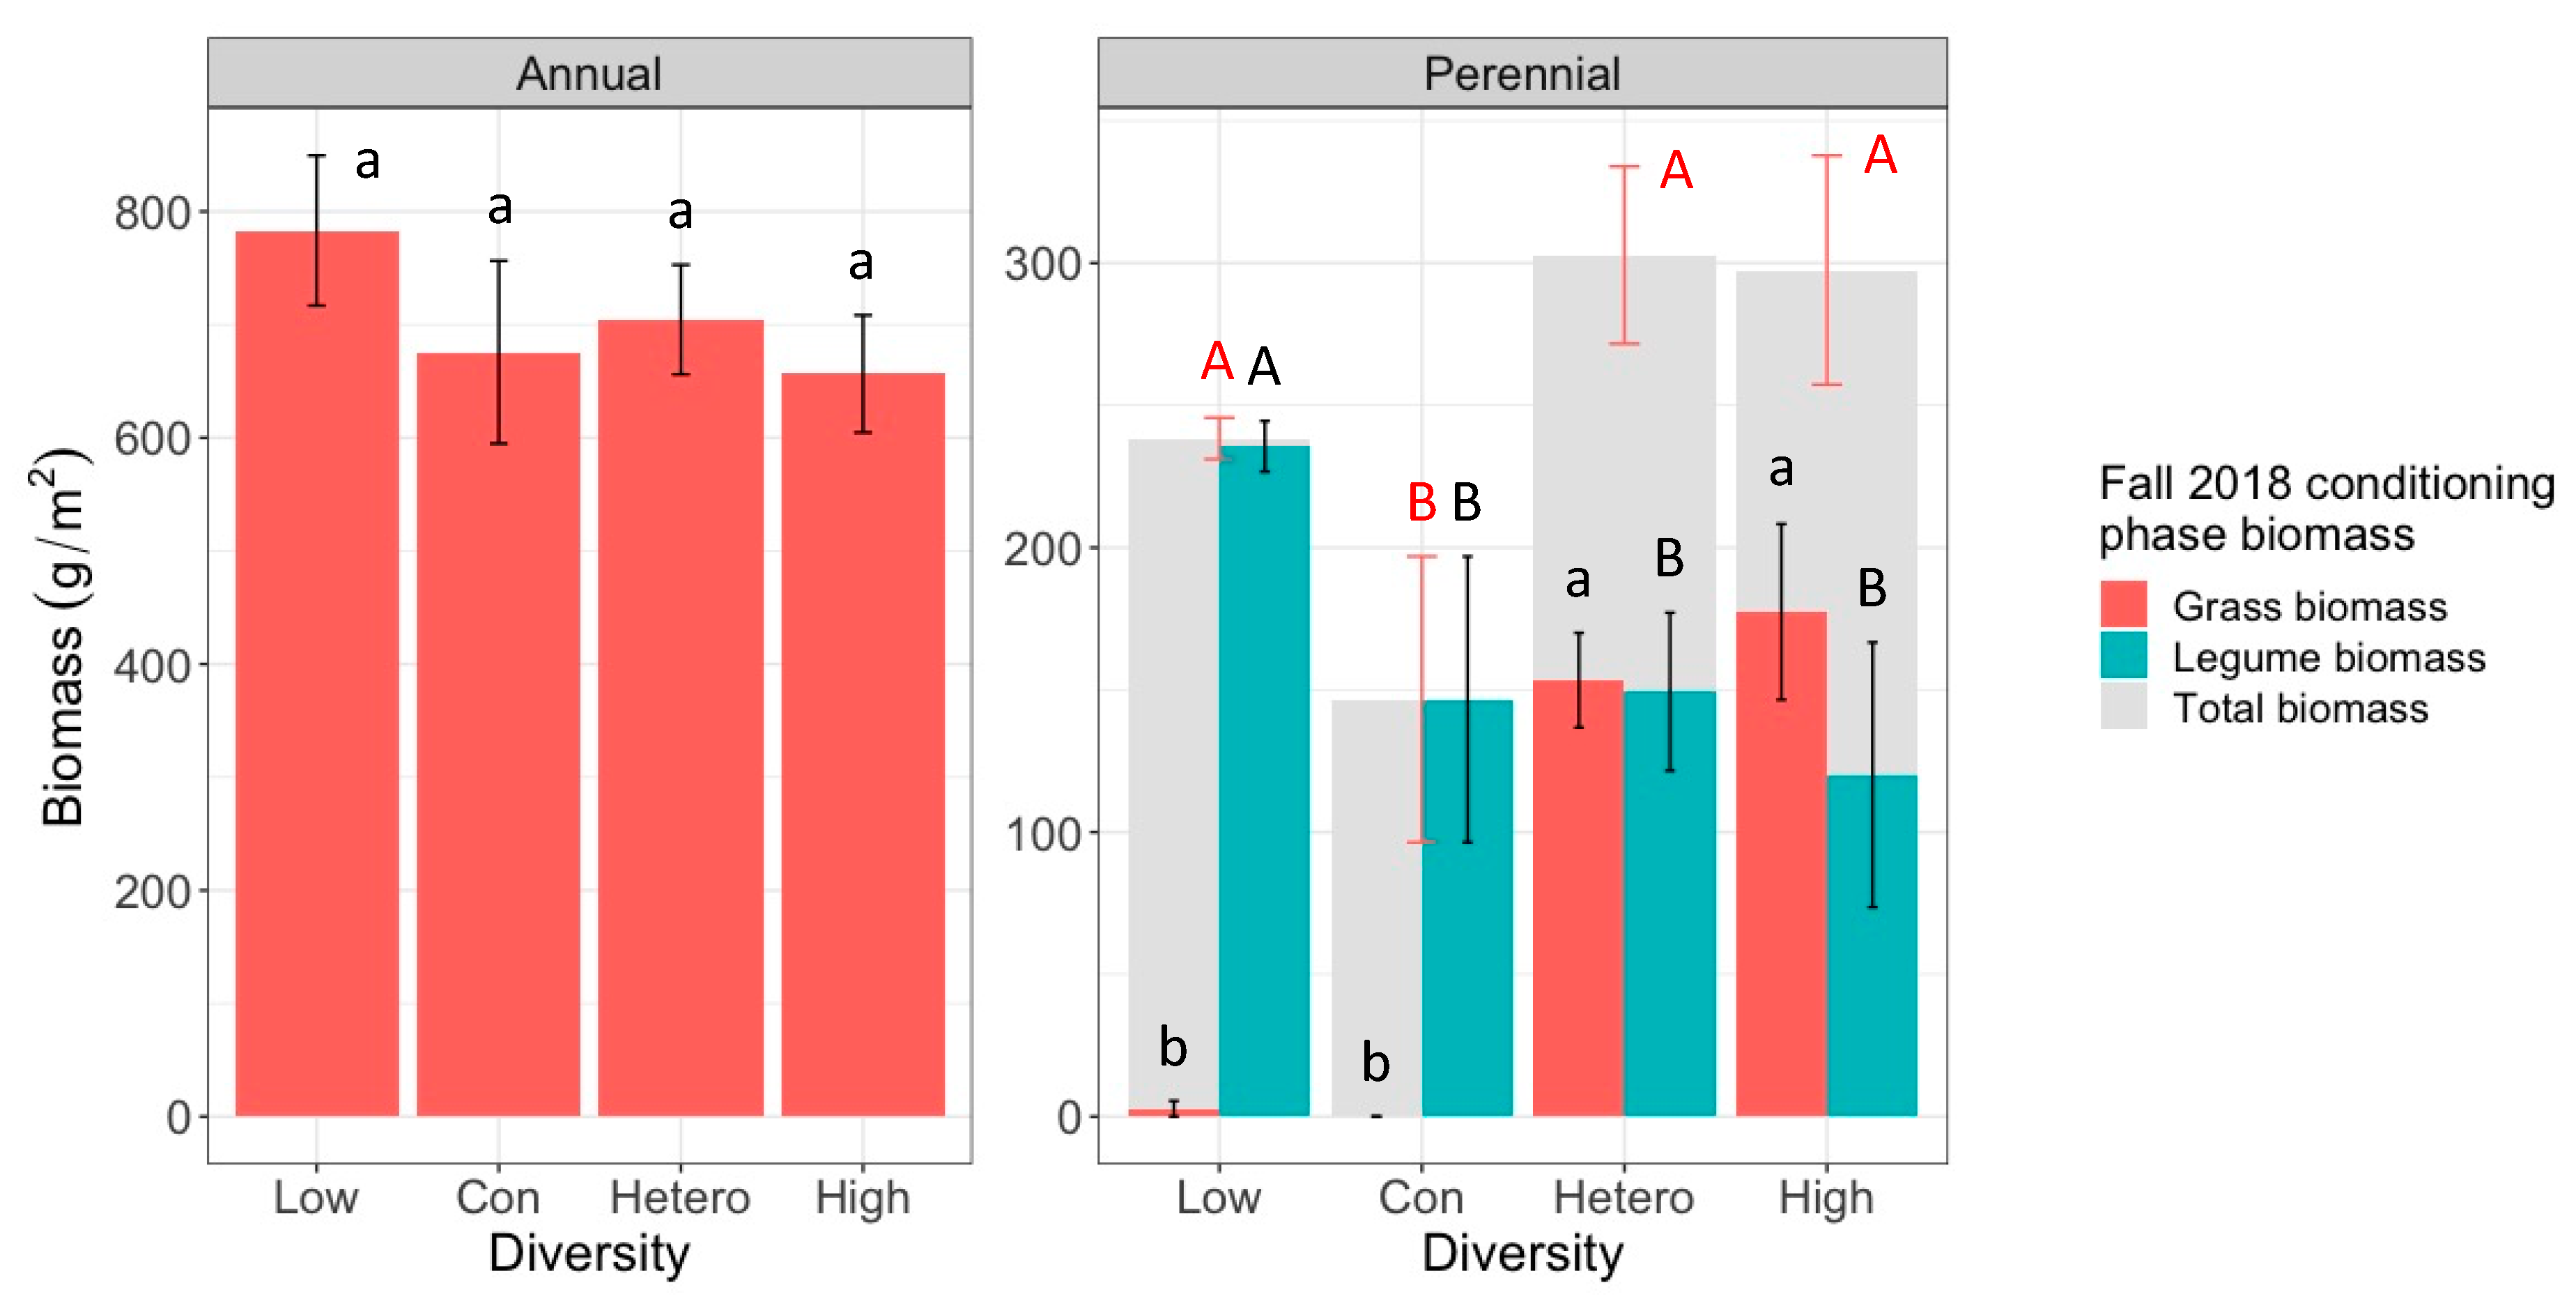
In the final harvest of the conditioning phase, the total biomass of annual crops did not differ across diversity treatments (Figure 2). In the perennial system, total biomass was greater in the low, heterospecific, and high diversity treatments than in the conspecific treatment (p < 0.05). Furthermore, in the perennial system, the low diversity treatment had the greatest legume biomass (p < 0.05) whereas the heterospecific and high diversity treatments had the greatest grass biomass (p < 0.001).

3.2. Crop Diversity Legacy Effects on Weed-Crop Competition

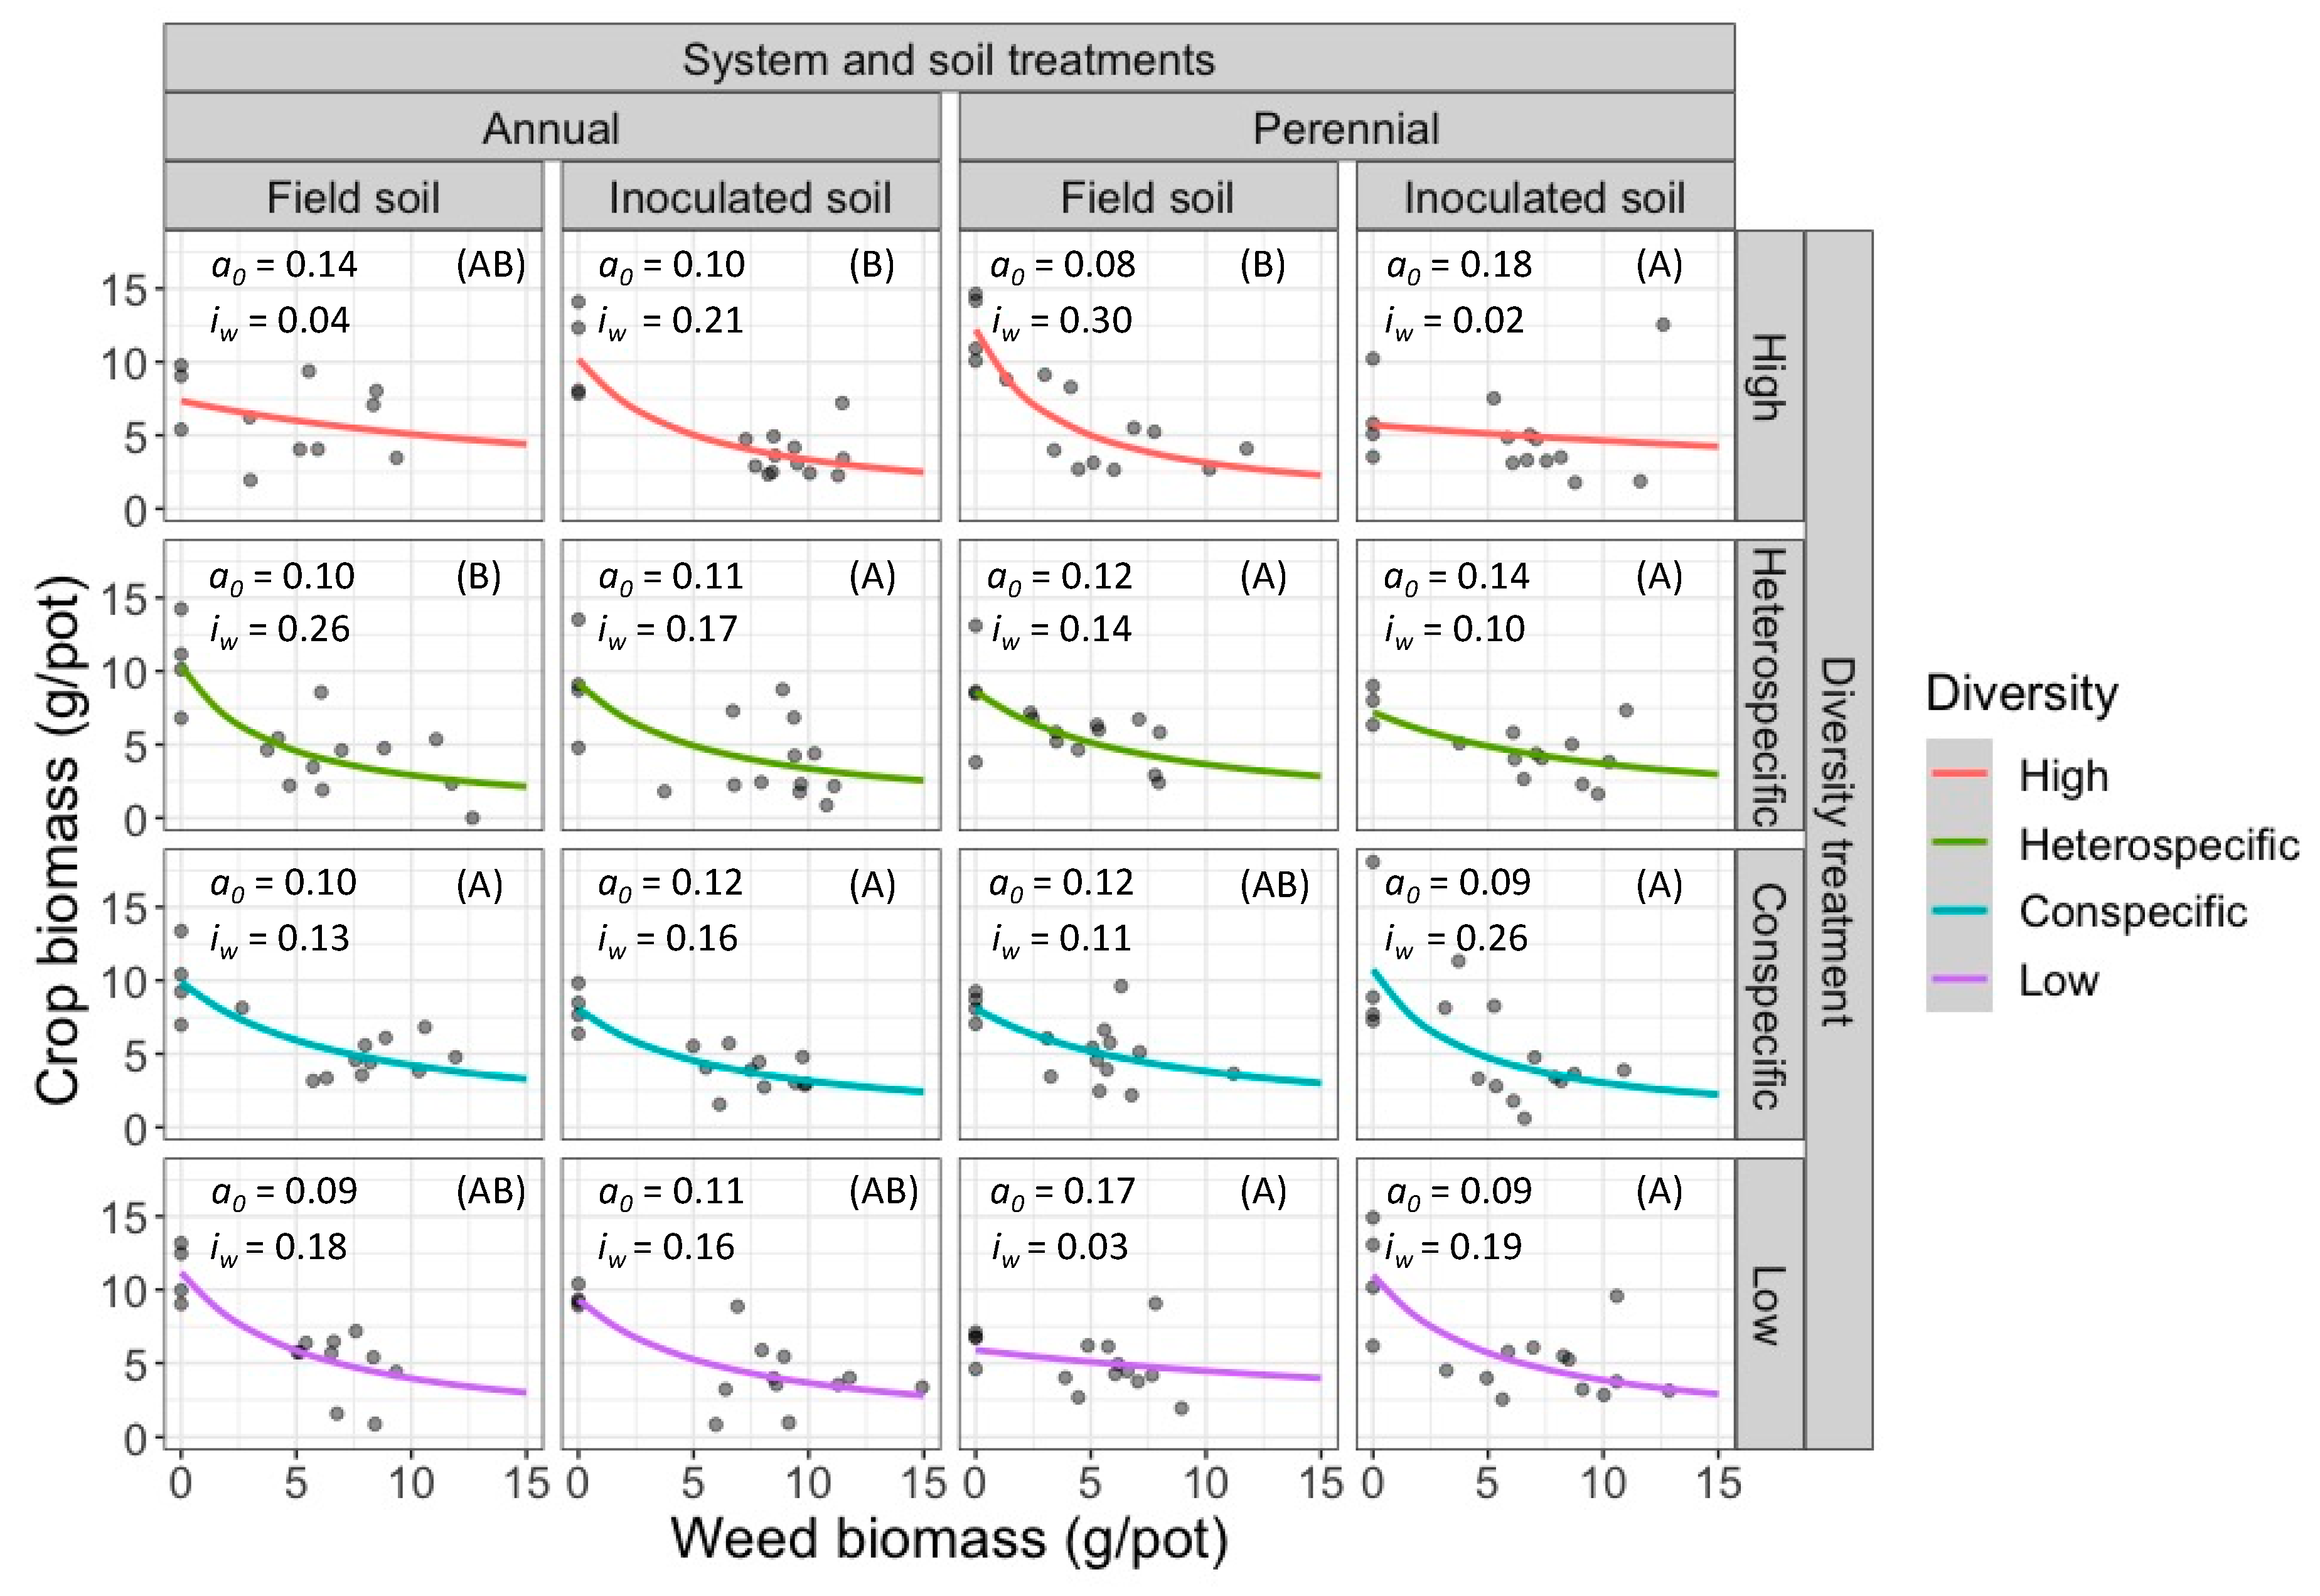
To account for differences in the soil medium resulting from our field and inoculated soil treatments, weed-crop competition was compared across diversity treatments (i.e., low, conspecific, heterospecific, and high) within each cropping system (i.e., annual and perennial) and soil treatment (i.e., field and inoculated) (Figure 3; also see Table S2 for standard error and p-values of parameter estimates). Competition curve F-test comparisons showed that in the field soil treatment of the annual cropping system, curves differed between the conspecific and heterospecific diversity treatments. In the inoculated soil of the annual system, both the conspecific and heterospecific diversity treatments differed from the high diversity treatment. In the perennial cropping system, the competition curves of the low and heterospecific diversity treatments differed from the competition curve of the high diversity treatment in the field soil. In all instances when F-tests showed differences between diversity treatments, the soil conditioned with the higher diversity treatment fostered greater weed-crop competition (Figure 3). The greater weed-crop competition that was observed in the annual system is a result of larger iw values in more diverse compared to less diverse treatments. However, greater weed-crop competition in the field soil of the perennial system is primarily a result of a smaller a0 value in the more diverse compared to less diverse treatments. Although the high diversity treatment in field soil of the perennial system had the largest iw value, it had the smallest a0 value (Figure 3) and produced a similar amount of crop biomass at the upper level of weed biomass (i.e., x = 15 g pot−1). This indicates that the apparent greater competition in high diversity treatment in field soil of the perennial system was due to an increased crop yield in the absence of weeds (i.e., at x = 0) in the high diversity treatment, rather than an enhanced tolerance to weed-crop competition in the heterospecific and low diversity treatments (Figure 3). No differences in the relationship between crop and weed biomass were observed in the inoculated soil of the perennial system.
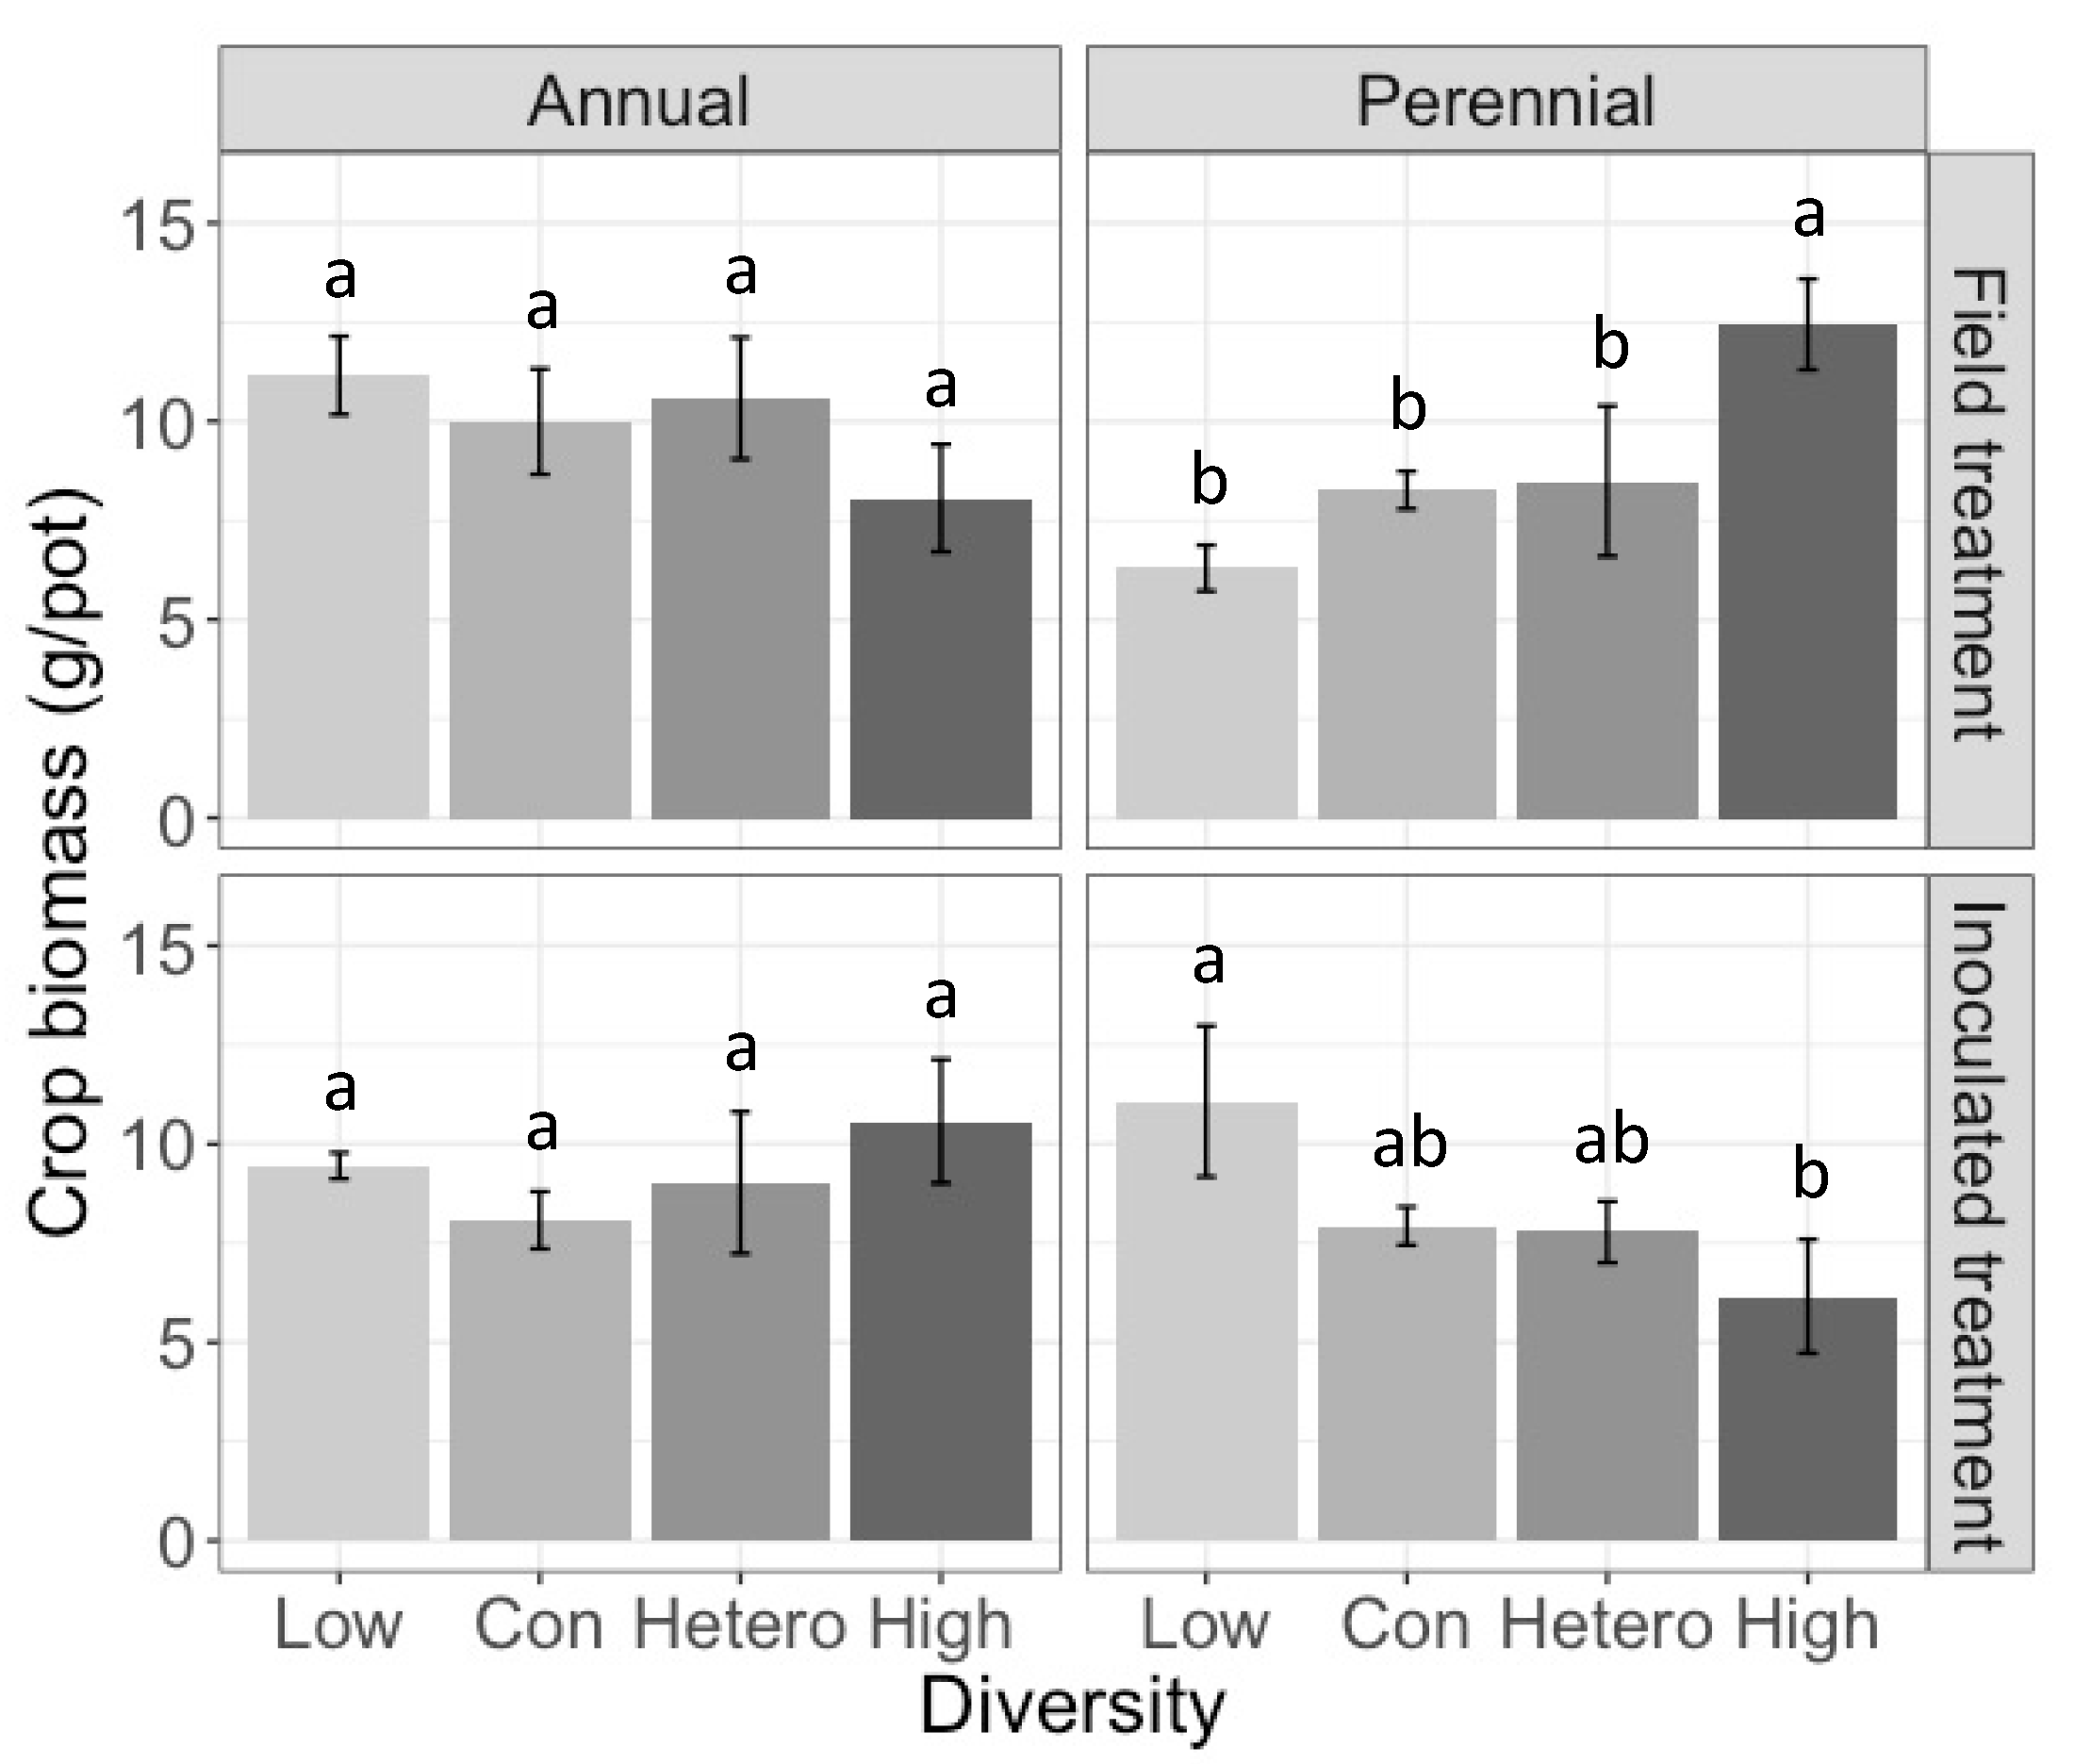
Crop yield potential, understood as the yield of sorghum sudangrass in the weed-free treatment, provides insight into weed-crop competition. In annual soils, crop yield potential did not vary by diversity treatment in either field or inoculated soil treatments (Figure 4). However, in soils conditioned with perennial crops, the effect of crop diversity on yield potential had opposite effects in the field and inoculated soil treatments (Figure 4). In the field soil treatment, when the soil nutrient and microbial legacies of the conditioning phase were maintained, yield potential increased with greater perennial crop diversity. The average crop yield potential in soils from the high diversity treatment was nearly twice that of soils from the low diversity treatment in the perennial system (98% higher; p < 0.01). Conversely, in the inoculated treatment, where nutrient differences between soils were minimized but microbial communities were maintained, there was a reduction in crop yield with greater perennial crop diversity, and the average crop yield potential in the high diversity treatment was nearly two times less than the low diversity treatment (44% lower; p < 0.05).
Crop biomass production during the conditioning phase contextualizes the yield potential results we observed during the greenhouse phase of the study. The lack of a diversity treatment effect on yield potential in the annual cropping system (Figure 4) may be due to the lack of crop functional diversity between diversity treatments in the field experiment. Prior to soil sampling for the greenhouse experiment, the annual cropping system produced only grasses with similar biomass across diversity treatments (Figure 2). In the perennial system, grass and legume biomass production varied across diversity treatments, with greatest legume biomass in the perennial low diversity treatment (Figure 4). Differences in legume biomass within the perennial cropping system may have influenced soil nitrogen and crop yield potential. Although legume crops like alfalfa and red clover can provide nitrogen to a subsequent crop [48], nitrogen availability is typically greatest when legume aboveground biomass is not removed from the field [49,50]. In this research, crop harvest procedures in the perennial systems during the conditioning phase may have reduced crop yield potential in the field soil treatment in the greenhouse experiment. Perennial crops were cut twice in 2017 and four times in 2018. During each cut, crop biomass was removed from the field. Fernandez et al. [51] reported that two or three annual removals of alfalfa biomass can reduce soil mineral nitrogen between 11.5 and 12.6% without increasing nitrogen availability. However, cutting perennial grasses has been shown to stimulate nutrient turnover through increased root rhizodeposition [52,53] with indication of greater soil nitrogen cycling after perennial grass defoliation [52]. Increased soil nitrogen availability has also been reported after herbivory of a perennial-dominated grassland [54]. Therefore, the increased perennial grass biomass production in the perennial heterospecific and high diversity treatments during the conditioning phase may have resulted in soils with more available nitrogen at the time of soil sampling than the low and conspecific treatments of the perennial cropping system, which only included alfalfa.
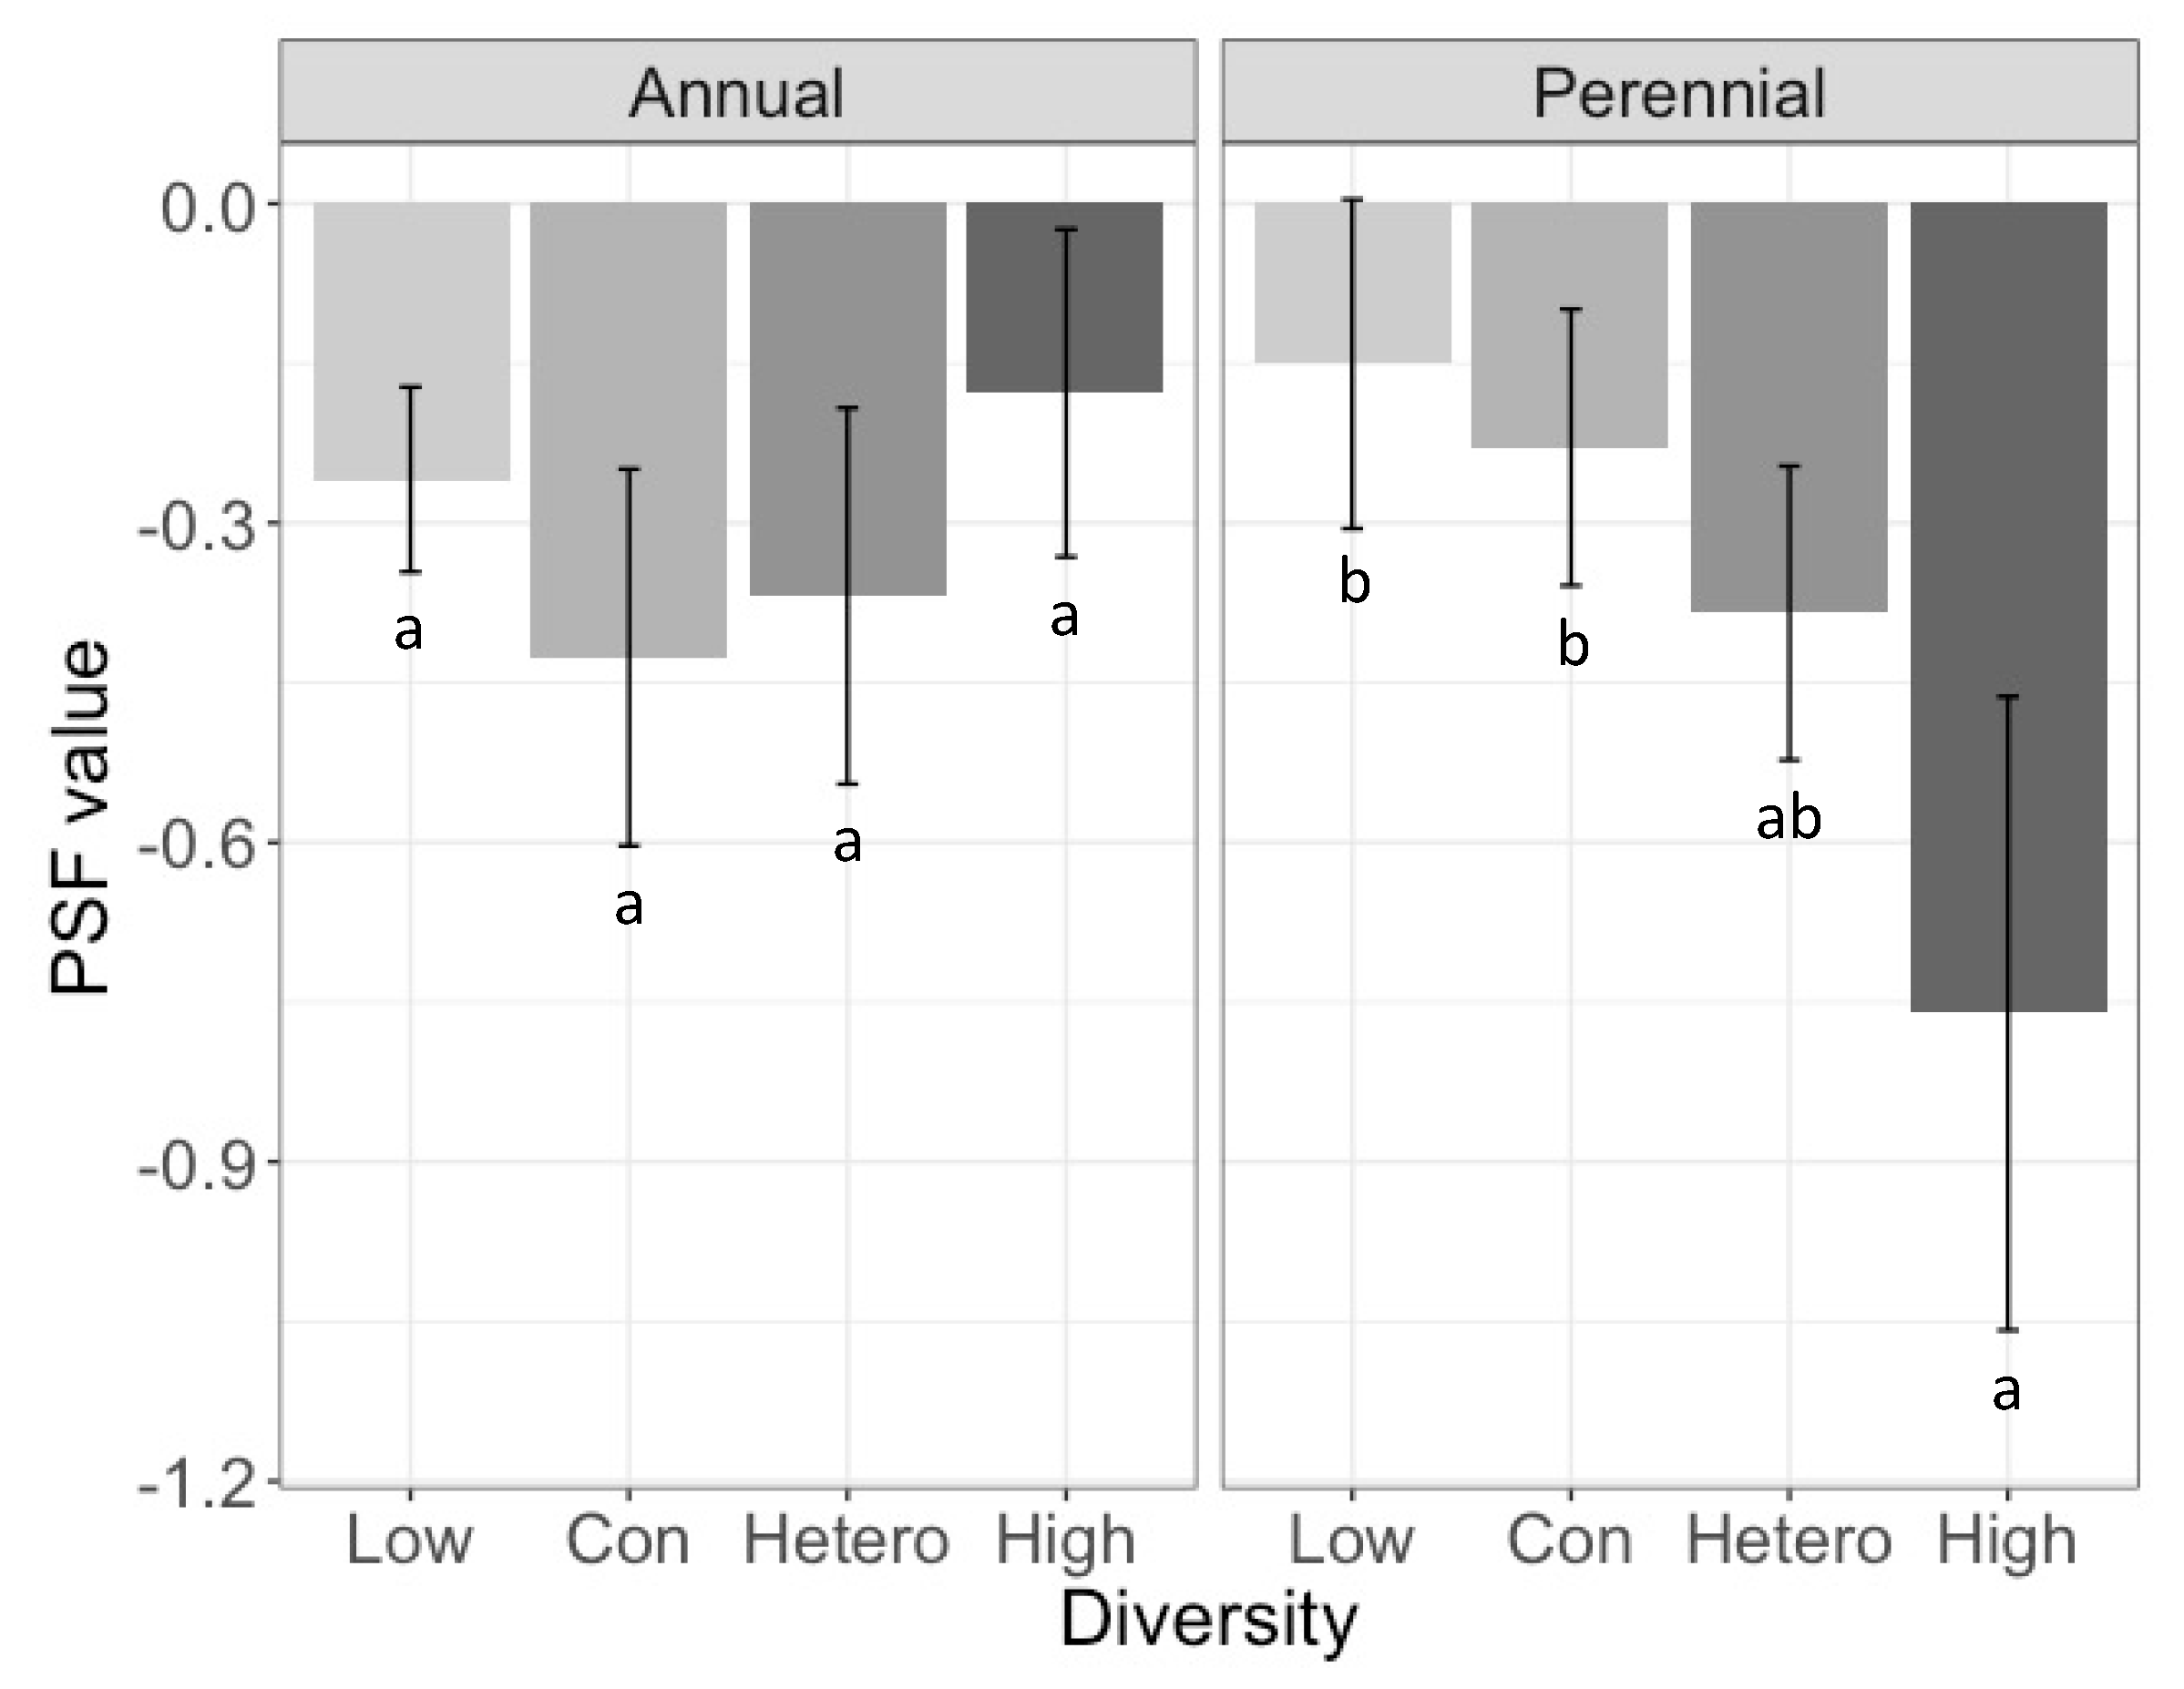
In contrast to the field soil treatment, sorghum sudangrass yield potential in the inoculated soil treatment from the perennial cropping system decreased with increasing crop diversity (Figure 4). Negative PSFs from the perennial grass crop legacies in the heterospecific and high diversity treatments were likely responsible for the reduction in yield potential in the inoculated soils (Figure 5). Miller and Menalled [18] reported the identity of previous and currently planted crops can cause over 80% of the variation in PSF direction and magnitude. In that research, the effect of plant species identity on PSFs was attributed to increased plant-pathogenic organisms in the soil that occurred when phylogenetically similar plants were planted after one another. In our research, the presence of a grass legacy in the heterospecific and high diversity treatments (Figure 2; p < 0.001) may have contributed to more negative PSFs for the sorghum sudangrass. Analysis of the PSFs in the inoculated treatment supports this inference, with 2.3 and 1.8 times more negative PSFs in the perennial high and heterospecific diversity treatments compared with the low diversity treatment, respectively (Figure 5; 128% lower p < 0.05 and 83% lower p = 0.39).

4. Conclusions

This experiment sought to test the legacy effects of crop diversity on weed-crop competition. A weed-crop competition gradient in the field and inoculated soil treatments (Figure 1) allowed us to isolate the effects of soil microbes (i.e., inoculated soil treatment) from soil microbes and soil nutrients (i.e., field soil treatment). Regardless of soil treatment, when weed-crop competition differed between diversity treatments, competition intensity was greater in the higher diversity treatments (Figure 3), which did not support our hypothesis.
In the annual cropping system, greater crop diversity had a negative effect on weed-crop competition (Figure 3). Greater crop diversity in the annual system could have increased resource depletion during the conditioning phase and affected soil microbe-plant interactions. However, yield potential (Figure 4), soil nutrients (Table 2), and PSFs (Figure 5) were not affected by diversity treatments in the annual system, indicating that diversity driven resource depletion and PSFs do not explain the observed differences in weed-crop competition. In the annual system of this experiment, crop diversity during the conditioning phase was limited to only grass species. Thus, our ability to evaluate the effects of crop diversity were constrained and results may not translate to systems with greater crop functional diversity.
In the perennial cropping system, differences in weed-crop competition in the field soil treatments (Figure 3) can be explained by the greater crop yield potential that was observed in the high diversity treatment (Figure 4). This positive effect of crop diversity may have been driven by increased nutrient availability at the time of soil sampling as a result of increased microbial activity and nitrogen cycling associated with perennial grass crop defoliation in the high diversity treatment. In the inoculated soil of the perennial system, crop diversity had a negative effect on crop yield potential, which was supported by PSF results (Figure 5). The opposing yield potential trends in the two soil treatments (i.e., greater yield potential with increasing diversity in field soil vs. lower yield potential with increasing diversity in inoculated soil) indicate that soil nutrient availability and microbial communities may influence weed-crop competition independently (Figure 4).
Future studies should investigate the combined and separate effects of soil resources and soil microbes on weed-crop competition. Furthermore, repeating this study with differing greenhouse crop and weed species would allow researchers to vary the degree of niche overlap between competitors and better asses the RPDH. Quantifying weed-crop competition in a field setting would allow researchers to assess competition under standard conditions from an entire weed community. Field research would also eliminate the soil disturbance and impact of soil sampling on microbes, better matching the low soil disturbance conditions of conservation agriculture. As conservation agriculture expands, it is important to explore management options that minimize tradeoffs. Understanding the legacy effects of crop diversity on crop yield potential and weed-crop competition is particularly valuable in conservation agriculture and will contribute to its sustainable intensification.

Supplementary Materials

The following are available online at https://www.mdpi.com/2073-4395/10/9/1373/s1, Table S1, Fertilization during the conditioning phase; Table S2, Competition curve parameter estimates and curve fit.

Author Contributions

Conceptualization: U.D.M. and M.R.R.; methodology: U.D.M., K.A.B.-F., and M.R.R.; validation: M.R.R., R.G.S., A.D., and S.J.P.; formal analysis: U.D.M.; investigation: U.D.M.; K.A.B.-F.; data curation: U.D.M.; writing—original draft preparation: U.D.M.; writing—review and editing: K.A.B.-F., M.R.R., R.G.S., A.D., S.J.P.; visualization: U.D.M.; supervision: U.D.M., K.A.B.-F., and M.R.R.; project administration: U.D.M., K.A.B.-F., and M.R.R.; funding acquisition: U.D.M., K.A.B.-F., and M.R.R. All authors have read and agreed to the published version of the manuscript.

Funding

This research was funded by the USDA NIFA Organic Research and Extension Initiative, grant number 2016-25-8468: “Building resilience in the northeast through double cropping and forage diversity”, the US Dept. of Education McNair Scholars Program, grant number #P21A130148, and the Cornell Atkinson Center for Sustainability, award number 2019-SBF-udm3.

Acknowledgments

Thank you to Chris Pelzer and Sandra Wayman for field and greenhouse assistance and Deniz Akdemir for statistical assistance.

Conflicts of Interest

The authors declare no conflict of interest. The funders had no role in the design of the study; in the collection, analyses, or interpretation of data; in the writing of the manuscript, or in the decision to publish the results.

References

  1. Renton, M.; Chauhan, B.S. Modelling crop-weed competition: Why, what, how and what lies ahead? Crop Prot. 2017, 95, 101–108. [Google Scholar] [CrossRef]
  2. Pimentel, D.; McNair, S.; Janecka, J.; Wightman, J.; Simmonds, C.; O’Connell, C.; Wong, E.; Russel, L.; Zern, J.; Aquino, T.; et al. Economic and environmental threats of alien plant, animal, and microbe invasions. Agric. Ecosyst. Environ. 2001, 84, 1–20. [Google Scholar] [CrossRef]
  3. Garcia-Torres, L.; Benites, J.; Martinez-Viela, A.; Holgado-Cabrera, A. Conservation Agriculture Environment, Farmers Experiences, Innovations, Socio-Economy, Policy; Springer: Dordrecht, The Netherlands, 2003; ISBN 9781402011061. [Google Scholar]
  4. Kirkegaard, J.A.; Conyers, M.K.; Hunt, J.R.; Kirkby, C.A.; Watt, M.; Rebetzke, G.J. Sense and nonsense in conservation agriculture: Principles, pragmatism and productivity in Australian mixed farming systems. Agric. Ecosyst. Environ. 2014, 187, 133–145. [Google Scholar] [CrossRef]
  5. Lahmar, R. Adoption of conservation agriculture in Europe: Lessons of the KASSA project. Land Use Policy 2010, 27, 4–10. [Google Scholar] [CrossRef]
  6. Heap, I. Herbicide Resistant Weeds. In Integrated Pest Management: Pesticide Problems Volume 3; Pimentel, D., Peshin, R., Eds.; Springer: Dordrecht, The Netherlands, 2014; pp. 281–301. [Google Scholar]
  7. Bastiaans, L.; Paolini, R.; Baumann, D.T. Focus on ecological weed management: What is hindering adoption? Weed Res. 2008, 48, 481–491. [Google Scholar] [CrossRef]
  8. Médiène, S.; Valantin-Morison, M.; Sarthou, J.-P.; de Tourdonnet, S.; Gosme, M.; Bertrand, M.; Roger-Estrade, J.; Aubertot, J.-N.; Rusch, A.; Motisi, N.; et al. Agroecosystem management and biotic interactions: A review. Agron. Sustain. Dev. 2011, 31, 491–514. [Google Scholar] [CrossRef] [Green Version]
  9. Gaba, S.; Lescourret, F.; Boudsocq, S.; Enjalbert, J.; Hinsinger, P.; Journet, E.-P.; Navas, M.-L.; Wery, J.; Louarn, G.; Malézieux, E.; et al. Multiple cropping systems as drivers for providing multiple ecosystem services: From concepts to design. Agron. Sustain. Dev. 2015, 35, 607–623. [Google Scholar] [CrossRef] [Green Version]
  10. Smith, R.G.; Mortensen, D.A.; Ryan, M.R. A new hypothesis for the functional role of diversity in mediating resource pools and weed-crop competition in agroecosystems. Weed Res. 2010, 50, 37–48. [Google Scholar] [CrossRef]
  11. Ryan, M.R.; Mortensen, D.A.; Bastiaans, L.; Teasdale, J.R.; Mirsky, S.B.; Curran, W.S.; Seidel, R.; Wilson, D.O.; Hepperly, P.R. Elucidating the apparent maize tolerance to weed competition in long-term organically managed systems. Weed Res. 2010, 50, 25–36. [Google Scholar] [CrossRef]
  12. Reynolds, H.L.; Packer, A.; Bever, J.D.; Clay, K. Grassroots ecology: Plant-microbe-soil interactions as drivers of plant community structure and dynamics. Ecology 2003, 84, 2281–2291. [Google Scholar] [CrossRef] [Green Version]
  13. Klironomos, J.N. Feedback with soil biota contributes to plant rarity and invasiveness in communities. Nature 2002, 417, 67–70. [Google Scholar] [CrossRef] [PubMed]
  14. Bever, J.D. Feedback between plants and their soil communities in an old field community. Ecology 1994, 75, 1965–1977. [Google Scholar] [CrossRef] [Green Version]
  15. Bever, J.D.; Westover, K.M.; Antonovics, J. Incorporating the soil community into plant population dynamics: The utility of the feedback approach. J. Ecol. 1997, 85, 561–573. [Google Scholar] [CrossRef]
  16. Ehrenfeld, J.G.; Ravit, B.; Elgersma, K. Feedback in the plant-soil system. Annu. Rev. Environ. Resour. 2005, 30, 75–115. [Google Scholar] [CrossRef] [Green Version]
  17. Johnson, N.C.; Pfleger, F.L.; Crookston, R.K.; Simmons, S.R.; Copeland, P.J. Vesicular-arbuscular mycorrhizas respond to corn and soybean cropping history. New Phytol. 1991, 117, 657–663. [Google Scholar] [CrossRef]
  18. Miller, Z.J.; Menalled, F.D. Impact of species identity and phylogenetic relatedness on biologically-mediated plant-soil feedbacks in a low and a high intensity agroecosystem. Plant Soil 2015, 389, 171–183. [Google Scholar] [CrossRef] [Green Version]
  19. Brinkman, P.; Van der Putten, W.H.; Bakker, E.-J.; Verhoeven, K.J.F. Plant–soil feedback: Experimental approaches, statistical analyses and ecological interpretations. J. Ecol. 2010, 98, 1063–1073. [Google Scholar] [CrossRef]
  20. van der Putten, W.H.; Bradford, M.A.; Pernilla Brinkman, E.; van de Voorde, T.F.J.; Veen, G.F. Where, when and how plant–soil feedback matters in a changing world. Funct. Ecol. 2016, 30, 1109–1121. [Google Scholar] [CrossRef]
  21. Johnson, S.P.; Miller, Z.J.; Lehnhoff, E.A.; Miller, P.R.; Menalled, F.D. Cropping systems modify soil biota effects on wheat (Triticum aestivum) growth and competitive ability. Weed Res. 2017, 57, 6–15. [Google Scholar] [CrossRef]
  22. Menalled, U.D.; Seipel, T.; Menalled, F.D. Farming system effects on biologically mediated plant–soil feedbacks. Renew. Agric. Food Syst. 2020, 1–7. [Google Scholar] [CrossRef] [Green Version]
  23. Northeast Regional Climate Center, Climod2: Monthly Summarized Data. Available online: http://climod2.nrcc.cornell.edu (accessed on 20 May 2020).
  24. Bybee-Finley, K.; Ryan, M. Advancing intercropping research and practices in industrialized agricultural landscapes. Agriculture 2018, 8, 80. [Google Scholar] [CrossRef] [Green Version]
  25. Ketterings, Q.; Ort, S.; Swink, S.; Godwin, G.; Kilcer, T.; Miller, J.; Verbeten, W. Winter cereals as double crops in corn rotations on New York dairy farms. J. Agric. Sci. 2015, 7, 18–25. [Google Scholar] [CrossRef] [Green Version]
  26. Darby, H.M.; Madden, R.; Cummings, E.; Gervais, A.; Halteman, P. 2010 Warm Season Annual Forage Performance Trials; University of Vermont: Burlington, VT, USA, 2011. [Google Scholar]
  27. Undersander, D.; Cosgrove, D.; Cullen, E.; Grau, C.; Rice, M.E.; Renz, M.; Sheaffer, C.; Shewmaker, G.; Sulc, M. Alfalfa Management Guide; Amer Society of Agronomy: Madison, WI, USA, 2011; ISBN 9780891181798. [Google Scholar]
  28. Saiya-Cork, K.R.; Sinsabaugh, R.L.; Zak, D.R. The effects of long term nitrogen deposition on extracellular enzyme activity in an Acer saccharum forest soil. Soil Biol. Biochem. 2002, 39, 1309–1315. [Google Scholar] [CrossRef]
  29. Neher, D.A.; Cutler, A.J.; Weicht, T.R.; Sharma, M.; Millner, P.D. Composts of poultry litter or dairy manure differentially affect survival of enteric bacteria in fields with spinach. J. Appl. Microbiol. 2019, 126, 1910–1922. [Google Scholar] [CrossRef]
  30. Moebius-Clune, B.; Moebius-Clune, D.J.; Gugino, B.K.; Idowu, O.J.; Schindelbeck, R.; Ristow, A.J.; van Es, H.; Thies, J.E.; Shayler, H.A.; McBride, M.B.; et al. Comprehensive Assessment of Soil Health: The Cornell Framework, 3.2 ed.; Cornell University: Geneva, NY, USA, 2017; ISBN 0967650763. [Google Scholar]
  31. Hol, W.H.G.; de Boer, W.; ten Hooven, F.; van der Putten, W.H. Competition increases sensitivity of wheat (Triticum aestivum) to biotic plant-soil feedback. PLoS ONE 2013, 8, e66085. [Google Scholar] [CrossRef] [Green Version]
  32. Uva, R.H.; Neal, J.C.; DiTomaso, J.M. Weeds of the Northeast; Comstock Pub.: Ithaca, NY, USA, 1997; ISBN 0801433916. [Google Scholar]
  33. Sarabi, V.; Nassiri-Mahallati, M.; Nezami, A.; Rashed Mohassel, M.H. Effects of common lambsquarters (Chenopodium album L.) emergence time and density on growth and competition of maize (Zea mays L.). Aust. J. Crop Sci. 2013, 7, 532–537. [Google Scholar]
  34. Tester, M.; Smith, S.; Smith, F. The phenomenon of “nonmycorrhizal” plants. Can. J. Bot. 2011, 65, 419–431. [Google Scholar] [CrossRef]
  35. Vatovec, C.; Jordan, N.; Huerd, S. Responsiveness of certain agronomic weed species to arbuscular mycorrhizal fungi. Renew. Agric. Food Syst. 2005, 20, 181–189. [Google Scholar] [CrossRef]
  36. Chen, J.; Bird, G.W.; Renner, K.A. Influence of Heterodera glycines on interspecific and intraspecific competition associated with glycine max and chenopodium album. J. Nematol. 1995, 27, 63–69. [Google Scholar]
  37. R Core Team. R: A Language and Environment for Statistical Computing; R Foundation for Statistical Computing: Vienna, Austria, 2019. [Google Scholar]
  38. Kuznetsova, A.; Brockhoff, P.B.; Christensen, R.H.B. lmerTest Package: Tests in linear mixed effects models. J. Stat. Softw. 2017, 82, 1–26. [Google Scholar] [CrossRef] [Green Version]
  39. Lenth, R. Emmeans: Estimated Marginal Means, Aka Least-Squares Means. R Package Version 1.4. Available online: https://cran.r-project.org/web/packages/emmeans/index.html (accessed on 20 May 2020).
  40. Pinheiro, J.; Bates, D.; DebRoy, S.; Sarkar, D. nlme: Linear and Nonlinear Mixed Effects Models. R package version 3.1-149. Available online: https://cran.r-project.org/web/packages/nlme/index.html (accessed on 11 September 2020).
  41. Spitters, C.J.T. An alternative approach to the analysis of mixed cropping experiments. 1. Estimation of competition effects. Neth. J. Agric. Sci. 1983, 31, 1–11. [Google Scholar] [CrossRef]
  42. Bruce, R.R.; Langdale, G.W.; Dillard, A.L. Tillage and crop rotation effect on characteristics of a sandy surface soil. Soil Sci. Soc. Am. J. 1990, 54, 1744–1747. [Google Scholar] [CrossRef]
  43. Rhoton, F.E.; Bruce, R.R.; Buehring, N.W.; Elkins, G.B.; Langdale, C.W.; Tyler, D.D. Chemical and physical characteristics of four soil types under conventional and no-tillage systems. Soil Tillage Res. 1993, 28, 51–61. [Google Scholar] [CrossRef]
  44. Khan, A.R. Influence of tillage on soil aeration. J. Agron. Crop Sci. 1996, 177, 253–259. [Google Scholar] [CrossRef]
  45. Vyn, T.J.; Raimbult, B.A. Long-term effect of five tillage systems on corn response and soil structure. Agron. J. 1993, 85, 1074. [Google Scholar] [CrossRef]
  46. Haynes, R.J.; Judge, A. Influence of surface-applied poultry manure on topsoil and subsoil acidity and salinity: A leaching column study. J. Plant Nutr. Soil Sci. 2008, 171, 370–377. [Google Scholar] [CrossRef]
  47. Talbot, J.M.; Treseder, K.K. Interactions among lignin, cellulose, and nitrogen drive litter chemistry–decay relationships. Ecology 2012, 93, 345–354. [Google Scholar] [CrossRef] [Green Version]
  48. Lawrence, J.; Ketterings, Q.; Cherney, J. Effect of nitrogen application on yield and quality of silage corn after forage legume-grass. Agron. J. 2008, 100, 73–79. [Google Scholar] [CrossRef]
  49. Singh, K.; Ch, S.; Swarnalakshmi, K.; Ganeshamurthy, A.; Kumar, N. Influence of legume residues management and nitrogen doses on succeeding wheat yield and soil properties in Indo-Gangetic Plains. J. Food Legum. 2012, 25, 116–120. [Google Scholar]
  50. Garside, A.; Berthelsen, J.E. Management of legume biomass to maximise benefits to the following sugarcane crop. Proc. Aust. Soc. Sugar Cane Technol. 2004, 26, 30–56. [Google Scholar]
  51. Fernandez, A.L.; Fabrizzi, K.P.; Tautges, N.E.; Lamb, J.A.; Sheaffer, C.C. Cutting management and alfalfa stand age effects on organically grown corn grain yield and soil N availability. Renew. Agric. Food Syst. 2017, 34, 144–154. [Google Scholar] [CrossRef]
  52. Pugliese, J.Y.; Culman, S.W.; Sprunger, C.D. Harvesting forage of the perennial grain crop kernza (Thinopyrum intermedium) increases root biomass and soil nitrogen cycling. Plant Soil 2019, 437, 241–254. [Google Scholar] [CrossRef]
  53. Paterson, E.; Sim, A. Rhizodeposition and C-partitioning of Lolium perenne in axenic culture affected by nitrogen supply and defoliation. Plant Soil 1999, 216, 155–164. [Google Scholar] [CrossRef]
  54. Klumpp, K.; Fontaine, S.; Attard, E.; Le Roux, X.; Gleixner, G.; Soussana, J.-F. Grazing triggers soil carbon loss by altering plant roots and their control on soil microbial community. J. Ecol. 2009, 97, 876–885. [Google Scholar] [CrossRef]
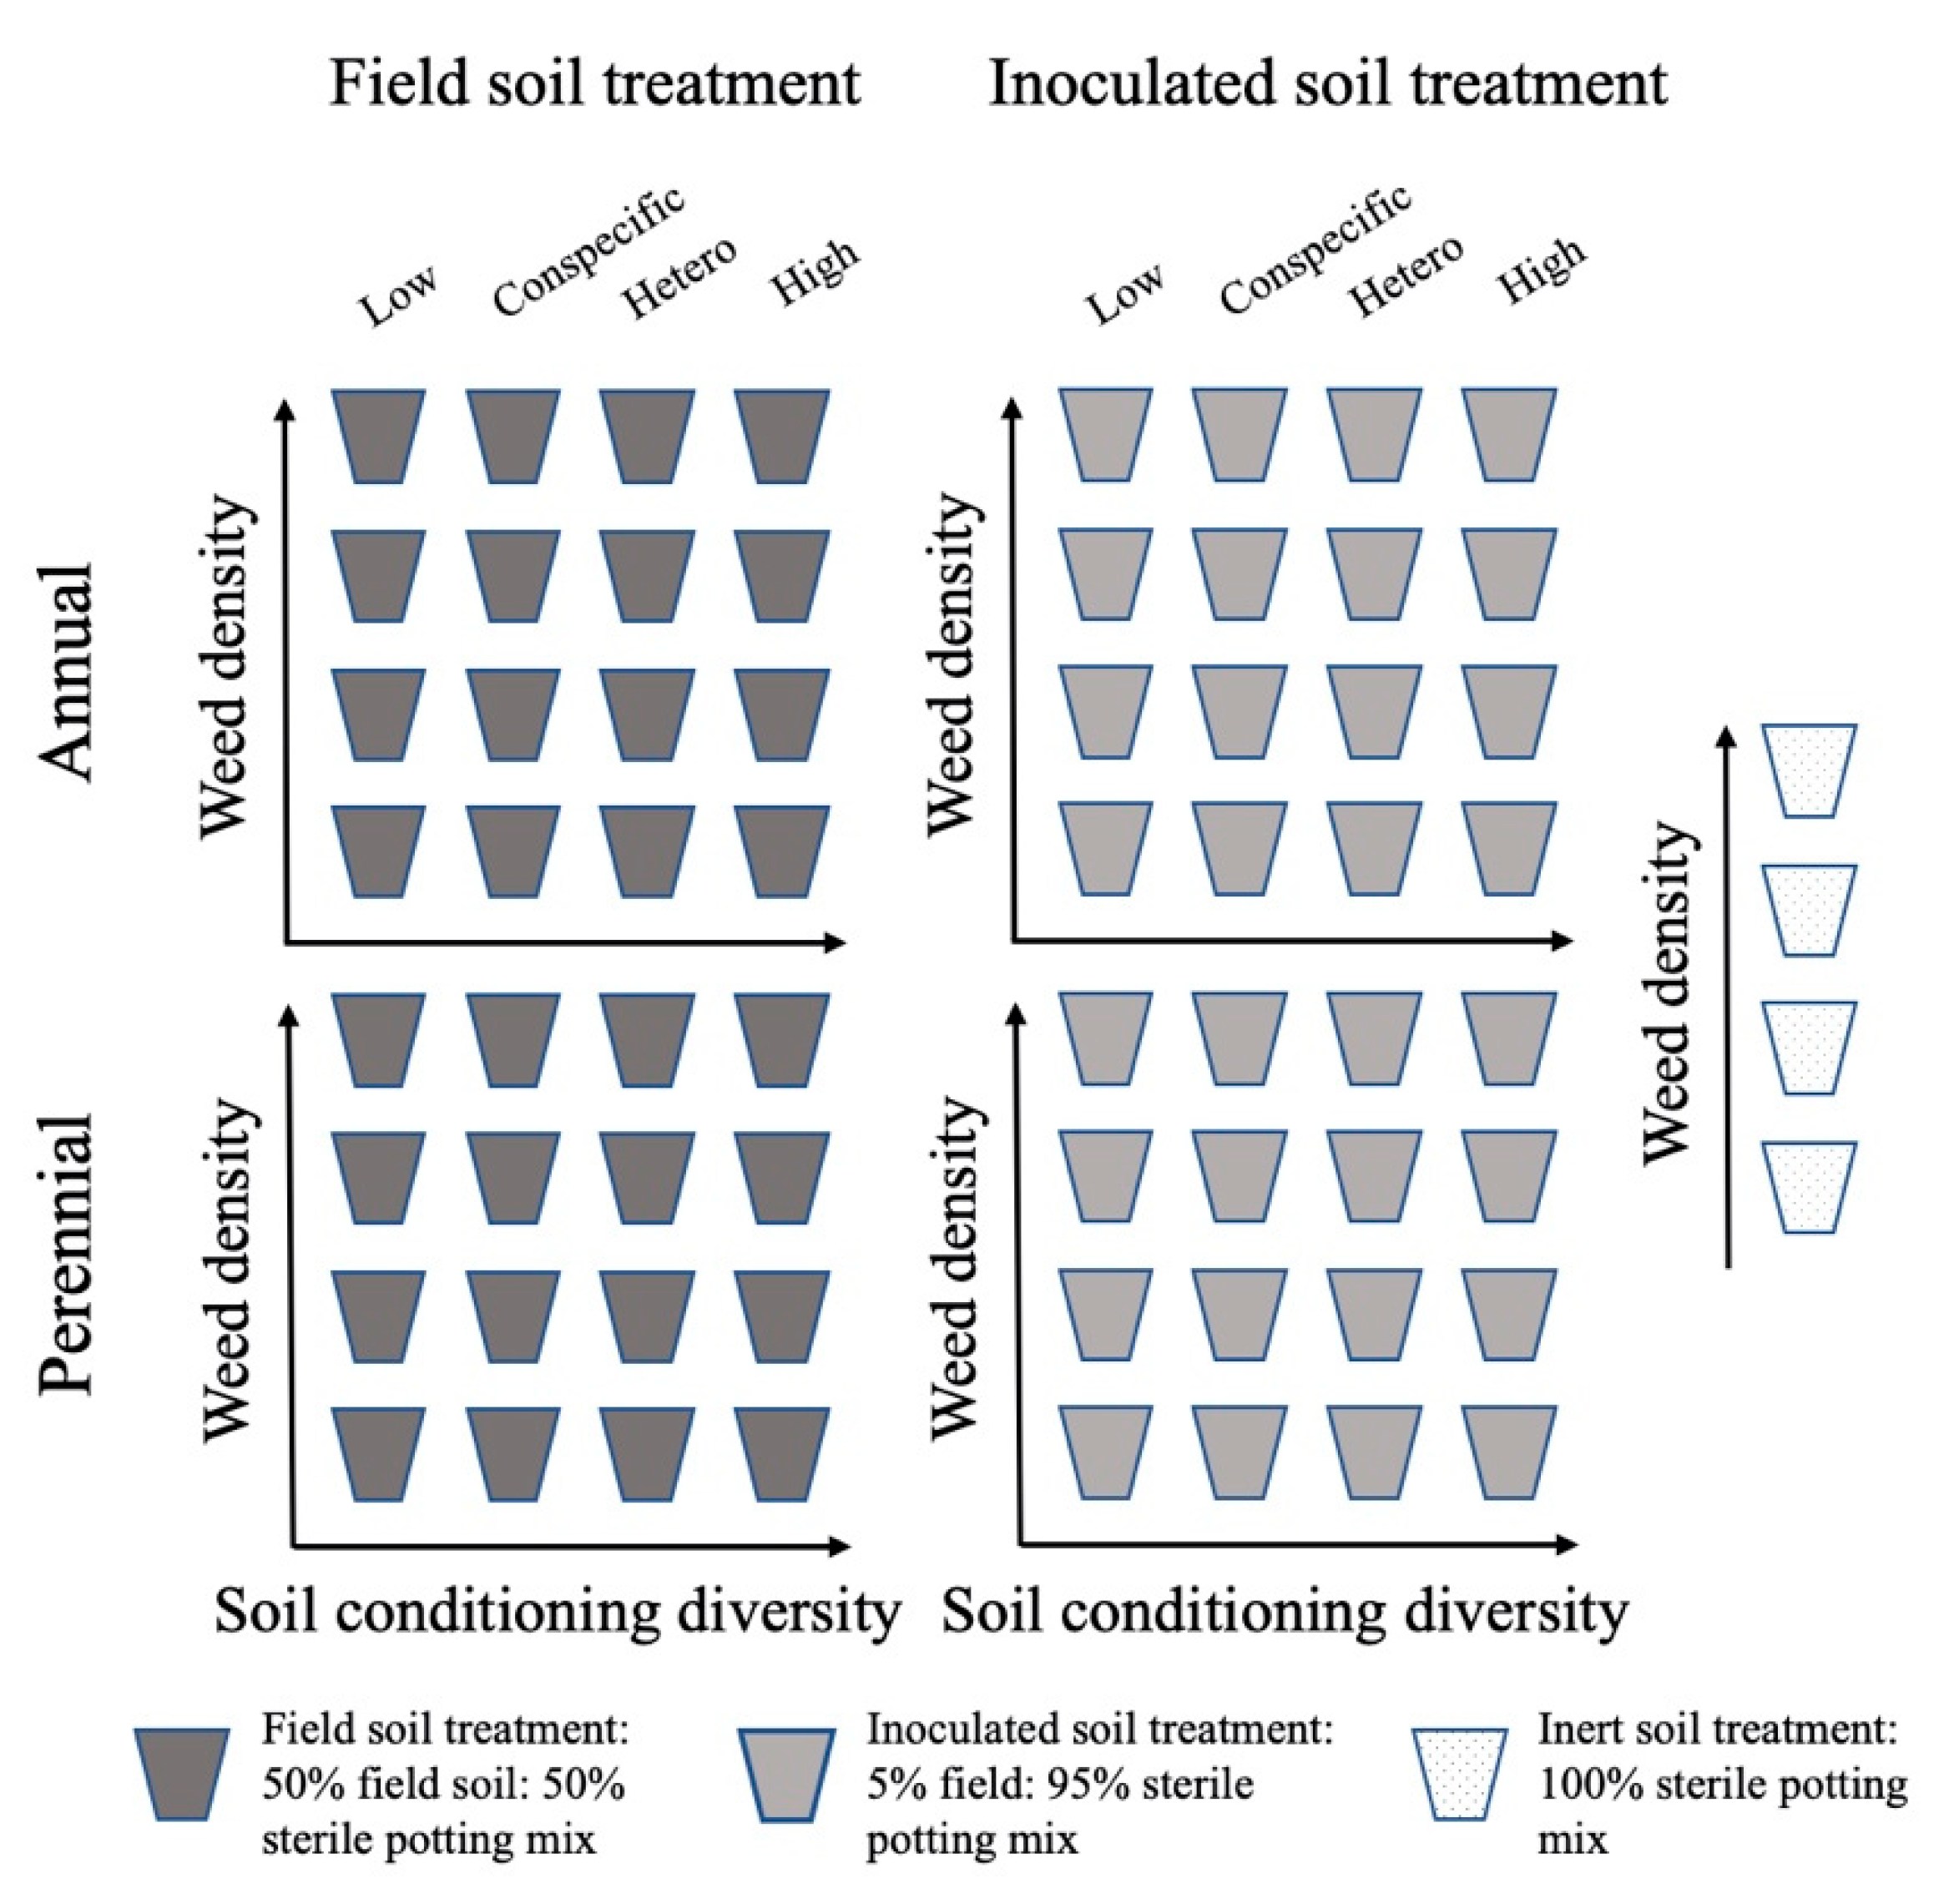
Figure 1. Treatments included in the greenhouse experiment. Four weed-crop competition treatments were applied to soils conditioned by four crop diversity treatments in annual and perennial cropping system treatments. The illustrated design was randomized and replicated four times for a 272-pot greenhouse experiment.
Agronomy 10 01373 g001
Figure 2. Crop yield as a function of diversity level and cropping system at the end of the conditioning phase in 2018. Data from the harvest in the perennial system was separated in to grass and legume biomass to describe functional diversity. Only grasses were seeded in the annual system in summer 2018. Bars represent mean biomass and letters denote results from FisherLSD mean comparisons where similar letters within a panel indicate no significant differences between treatments (p > 0.05). In the perennial system, capital letters correspond to comparisons of legume biomass, lowercase letters correspond to comparisons of grass biomass, and letters in red font correspond to comparisons of total biomass. Error bars show standard error.
Agronomy 10 01373 g002
Figure 3. Weed-crop competition curves across diversity treatments within cropping systems and soil treatments. The a0 (pots g−1) term is the inverse of crop yield potential, lower a0 values indicate higher crop yield potential. The iw (plants g−1) term describes weed competitiveness and higher iw values indicate more intense weed-crop competition. Letters in the figure describe results of F-test comparisons between curves across diversity levels within the same cropping system and soil treatment and should be read vertically within each column. Similar letters within a column indicate no significant differences between curves (p > 0.05). The field soil treatment had both soil nutrient and microbial legacies while the inoculated soil treatment had microbial legacies.
Agronomy 10 01373 g003
Figure 4. Greenhouse experiment crop yield potential across diversity treatments within cropping systems and soil treatments. Yield potential is the yield of sorghum sudangrass in the weed-free treatment. FisherLSD least-squares means comparisons are restricted to soils from the same cropping system (annual or perennial) and soil treatment (field or inoculated). Similar letters within a panel indicate no significant differences (p > 0.05) and error bars show standard error. The field soil treatment had both soil nutrient and microbial legacies while the inoculated soil treatment had microbial legacies.
Agronomy 10 01373 g004
Figure 5. Yield potential plant-soil feedbacks (PSFs). PSFs were calculated using soils from the inoculated and inert soil treatments (Equation (1)) and compared within cropping system treatments. Similar letters within a panel indicate no significant differences between mean PSF values (p > 0.05) and error bars show the standard error.
Agronomy 10 01373 g005
Table 1. Diversity treatments across the annual and perennial cropping systems during the conditioning phase.
Diversity Treatments
LowConspecificHeterospecificHigh
Cropping system treatmentsAnnualsSummer annualsOne cultivar of sorghum sudangrassFour cultivars of sorghum sudangrassOne cultivar each of sorghum sudangrass, pearl millet, annual ryegrass, and sudangrassFour cultivars each of sorghum sudangrass, pearl millet, annual ryegrass, and sudangrass
Winter annualsOne cultivar of triticaleFour cultivars of triticaleOne cultivar each of triticale, cereal rye, red clover, and winter peaFour cultivars each of triticale, cereal rye, red clover, and winter pea
PerennialsOne cultivar of alfalfaFour cultivars of alfalfaOne cultivar each of alfalfa, white clover, orchardgrass, and timothyFour cultivars each of alfalfa, white clover, orchardgrass, and timothy