1. Introduction
The symbiosis of soil bacteria, generally called rhizobia, with Fabaceae plants is one of the best known [
1]. Nitrogen, as a component of amino acids and nitrogen bases, is essential for the functioning of organisms. About 98% of the Earth’s nitrogen (from the pool of 1.6 × 10
7 tons) occurs in a form not available for living organisms. Bioavailable nitrogen forms occur in four main reservoirs (atmosphere, biosphere, oceans and geological domains) [
2]. Molecular nitrogen (N
2) accounts for 78% of atmospheric air, but in this form, it cannot be absorbed by plants, which assimilate nitrogen mainly in the form of NO
3− ions. The most beneficial form of nitrogen for plants are NH
4+ ions, as they are not subject to energy-intensive reduction. A characteristic feature of Fabaceae plants is the ability to form symbiotic association with bacteria of various genera, such as
Rhizobium,
Bradyrhizobium and
Ensifer. The possibility of creating such symbiotic systems is related to the ability of Fabaceae to form root nodules in which the process of nitrogen fixation occurs. Plants, belonging to Fabaceae, fix about 200 million tons of atmospheric nitrogen annually [
3]. The amount of fixed nitrogen is regulated by several factors such as the Fabaceae’s ability for nodule formation, the level of nitrogen fertilisation of soils, the water content of soil or temperature. The symbiosis of Fabaceae with rhizobia has great benefits for agriculture, the greatest being the possibility to reduce the amount of fertiliser used on fields [
4].
The symbiosis itself is a multistage process and, in the case of some rhizobia, is highly specific. One strain of bacteria can trigger effective nodule formation on many species of
Trifolium, while another is effective with only one plant species [
5]. Some species have less specificity in relation to the host plant. The root’s nodule formation is a result of the exchange of signal factors between symbiotic partners [
6]. The fixation of molecular nitrogen occurs in nodules, in which it is reduced by the enzymatic nitrogenase complex, and is carried out by bacteroids, i.e., transformed cells of Rhizobiaceae [
7]. Rhizobia are defined as bacteria that have the ability to fix nitrogen in symbiosis with Fabaceae.
The taxonomic classification of rhizobia has changed over the last few years. Initially, the described rhizobia were classified exclusively as alpha-proteobacteria, currently, beta-proteobacterial rhizobia are also described. The current phylogenetic classification is based on the analysis of the 16S rRNA sequence [
8]. These bacteria have the ability to grow in different climatic conditions and in a great range of soil types [
9]. The
Trifolium genus, consisting of approximately 225 species, is one of the largest in the Fabaceae family [
10]. One of the species belonging to the
Trifolium genus is
Trifolium rubens. According to current data,
T. rubens has considered a rare or endangered species in several European countries where it has been endemic so far. These countries may include Bulgaria (critically endangered) [
11], Spain (critically endangered) [
12], Luxembourg (critically endangered) [
13] and Czech Republic (vulnerable) [
14]. In Poland,
T. rubens is listed as a vulnerable species in the territory of lubelskie voivodship [
15]. In addition, progressive climate change is reducing species such as
T. rubens, which can lead to their complete extinction. An additional aspect in favour of research on this plant is that it is highly nectariferous and honeycomb, which is of great importance in these times of protecting pollinating insects, such as bees. As for other clover species,
T. rubens is also capable of symbiosis with Rhizobiaceae, but little is known about the characteristics of its symbionts. Previous research indicated a narrow host range of natural microsymbionts of this clover [
16]. There is some research on genotypic and phenotypic characteristics of microsymbionts of other Fabaceae, including red clover [
17],
Kummerowia striata [
18],
Astragalus glycyphyllos [
19] and
Medicago sativa L. [
20]. Several genetic tests are used for characterisation and differentiation of bacterial strains. Enterobacterial Repetitive Intergenic Consensus Polymerase Chain Reaction (ERIC-PCR) analysis is a quick technique and an effective fingerprint method. ERIC sequences are mobile DNA fragments, present in a huge number of microorganism genomes. There are different numbers of ERIC sequence copies among different bacterial strains. The unique band patterns obtained in the electrophoresis image after the PCR reaction allows for genetic differentiation of the tested bacterial strains [
21]. The Rep-PCR method allows for the differentiation of closely related bacterial strains based on the repetitive elements present in the bacterial genome [
22]. The BOX-PCR method is based on the analysis of the distribution in the genome of three repeating BOX sequences (
boxA, boxB and
boxC) [
23].
The primary goal of this study was the analysis of genetic (ERIC-PCR) and phenotypic differentiation of bacteria isolated from root nodules of clover Trifolium rubens in Poland. The symbiosis of this clover species with rhizobia has been poorly described so far; therefore, such a study was considered important. Taking into account the fact that T. rubens is a rare species, it is necessary to search for a natural way to maintain or increase its population, which is a key element of natural biodiversity protection. The study of the ability of microsymbionts to grow under different conditions (pH = 6–10, 0.5–3% NaCl, different carbon and nitrogen sources) allows determination of the potential usefulness of the tested strains as biological agents used in the environment. For that purpose, two types of phenotypic analyses were applied: (i) classical plate methods with the use of different growth media; and (ii) modern methods using 96-well plate microarrays (BIOLOG® system, GenIII plates), allowing comparison of these methods and conclusions about the effectiveness of their application in phenotypic analyses to be reached. Moreover, the symbiotic compatibility of selected isolates with two agronomically important plants, red clover (Trifolium pratense L.) and pea (Pisum sativum L.), was also investigated, to see if isolated strains are capable of inducing symbiosis with different species of Fabaceae. So far, there has been limited research on T. rubens microsymbionts in terms of genetic and phenotypic diversity.
2. Materials and Methods
2.1. Bacterial Strains
Several bacterial strains were isolated from root nodules of
T. rubens L. (Red Feathers) plants (at flowering stage), grown in meadows in Poland, in the region of Lublin (Lubelskie voivodeship). Roots were washed in sterile distilled water (3 × 1 min), sodium chlorite (1 × 3 min), again in water (3 × 1 min), 70% ethanol (1 × 1 min) and again in water (3 × 1 min). The sterile nodules were then crushed with a sterile spatula on a Petri dish, and the bacteria were spread on a selective 79CA solid medium plate (1000 mL: mannitol—10 g, K
2HPO
4—0.5 g, MgSO
4 × 7 H
2O—0.2 g, NaCl—0.1 g, CaCO
3—0.1 g, yeast extract—1 g, peptone—1 g, agar—14 g, distilled H
2O; pH = 7.2–7.4) and incubated at 28 °C for 48 h. Water from the last washing was spread into the culture medium to ensure sterile conditions of the isolation process. Single clones were transferred to sterile plates with 79CA medium [
24]. The spatula was sterilised with 70% ethanol and a flame. The negative control of the isolation process was sterile water stirred with the spatula and spread onto the culture medium.
2.2. ERIC-PCR
ERIC-PCR was applied for genetic differentiation of 59 bacterial strains isolated from root nodules. Bacterial DNA was isolated using the method described by Biswas (2014) [
25]. DNA was then diluted (1 in 50) using sterile water. The DNA concentration was measured using BioRad’s SmartSpec™ 3000 at 260 nm and 280 nm. To perform the PCR reaction, individual DNA samples were diluted to 100 ng µL-1 using sterile water. The PCR mixes were prepared as follows: Ready Mix Taq PCR Reaction (Sigma)—10 µL, ERIC1R primer (5′-CACTTAGGGGTCCTCGAATGTA-3′), ERIC2R primer(5′-ACTTAGGGGTCCTCGAATGTA-3′)—0.3 µL [
26], DNA—1.5 µL, H
2O—7.9 µL. PCR reaction was carried out according to the following protocol: 1 cycle: 5 min/95 °C; 35 cycles: 30 sec/94 °C, 1 min/52 °C, 8 min/65 °C, 1 cycle: 4 min/65 °C. The PCR product was applied on 1% agarose gel and electrophoresis was carried out for 3 h at 100 V. The GeneRulerTM DNA Ladder Mix was used as a standard. The obtained images were analysed using the bioinformatics platform, Bionumerics (GelCompar II, Saint-Martens-Latem, Kortrijk, Belgium). A phylogenetic tree was prepared using the UPGMA (Bray—Curtis) method, using Past3 v3.25 (Øyvind Hammer, Natural History Museum, University of Oslo) and RStudio packages (Northern Ave, Boston, MA, USA).
2.3. 16S rRNA Sequencing (Sanger)
Single colonies of selected strains were suspended in 30 µL of sterile water. The PCR mixtures were prepared in the following proportions: Silver Hot Start DNA Polymerase (Syngen)—4 µL, Primer I and II—0.5 µL, bacterial suspensions—1 µL, H
2O—14 µL. PCR reaction was carried out according to the following protocol: 1 cycle: 15 min/95 °C; 30 cycles: 30 sec/95 °C, 1 min/52 °C, 1.5 min/72 °C; 1 cycle: 7 min/72 °C. The PCR product was applied on 1.5% agarose gel and electrophoresis was carried out for 40 min at 90 V. The GeneRuler 1 kb DNA Ladder (Thermo Scientific) was used as a standard. The obtained PCR products were sequenced at Genomed S.A. (Warsaw, Poland). Bioinformatics analyses were made with the use of FinchTV v.1.4.0 (Geospiza, Inc., Seattle, WA, USA), Unipro UGENE v.1.32.0 (Unipro, Novosibirsk, Russia) and SEED v.2.1.05 (Institute of Microbiology CAS, Prague, Czech Republic) software, and the obtained sequences were compared to the GTDB-Tk database [
27] and GenBank.
2.4. Phenotyping Tests
There were 64 different phenotypic tests performed: utilization of 21 carbon and 18 nitrogen sources, 10 enzymatic tests, growth under 15 different conditions (pH, temperature, NaCl). Each strain in 79CA liquid medium (2 mL, OD550 = 0.8) was centrifuged (5488× g for 10 min) and the pellet was suspended in 1 mL of sterile NaCl (0.95%). All samples were in three repetitions. Sterile NaCl (0.95%) was the negative control for all analyses. The results were analysed using Past3 v3.25 (Øyvind Hammer, Natural History Museum, University of Oslo) and RStudio packages (Northern Ave, Boston, MA, USA).
2.5. Utilisation of Different Carbon and Nitrogen Sources
Modified Bergersen’s synthetic (BS) medium (Sherwood, 1970) (1000 mL: NH4Cl—0.27 g, K2HPO4—0.22 g, MgSO4—0.25 g, FeCl3—0.02 g, CaCl2—0.04 g, carbon/nitrogen source—10 g, agar—14 g, H2O distilled, bromothymol blue—10 mL, pH = 6.8) containing single carbon/ nitrogen compound was used for analysis of utilisation of different carbon and nitrogen sources. The following compounds (concentration 1%) were used: D-glucose, dulcitol, dextrin, glycerol, lactose, L-rhamnose, sodium citrate, sodium hypurate, starch, sucrose, D-galactose, inulin, raffinose, mannitol, mannose, maltose, salicin, Tween 20, D-xylose, sodium tartrate, D-arabinose, glutamine, L-tyrosine, L-leucine, L-valine, L-phenylalanine, L-methionine, L-histidine, L-asparagine, L-glutamic acid, serine, NaNO3, L-ornithine, L-arginine, L-cysteine, L-isoleucine, L-lysine, glycine or alanine. The media were then spilled on Petri plates and 5 µL of the tested strain was applied to each medium. The plates were incubated at 28 °C for 96 h. After this time, the growth of bacteria on individual plates was observed.
2.6. Urease Activity
Strain cultures (5 µL) were applied to plates with BS medium containing urea at a concentration of 2% instead of NH
4Cl. Plates were incubated at 28 °C for 96 h. After this time, the ability of bacteria to grow on individual plates was observed [
28].
2.7. Catalase Activity
Strain cultures (5 µL) were applied on plates with 79CA medium, incubated at 28 °C for 48 h. After the growth of the culture, 5 µL 1% perhydrol solution was applied to the cultures. The appearance of gas bubbles indicated catalase activity [
28].
2.8. Nitrate Reductase Activity
Bacterial strains were cultured in liquid BS medium in which NH
4Cl was replaced by 0.2% KNO
3 and incubated at 28 °C for 48 h. Then, the cultures were divided into two equal parts. The Griess I reagent (8 g of sulphanilic acid in 1000 mL 5 mol l-1 acetic acid), in a volume of 1 mL of reagent per 1.5 mL of culture, was added successively to the first group and the same volume of Griess II reagent (5 g α—naphthylamine in 1000 mL 5 mol l-1 acetic acid) was added with drops. Changes in the colour of the culture were observed. The presence of a red colour testified to the reductase activity. In the absence of a colour change, an additional test was carried out. To the second group of cultures, a small quantity of zinc in dust was first added and then the same reagents (in the same amounts) as in the first part of the experiment were used. The appearance of a red colour indicates a zinc reduction and a lack of nitrate reductase activity. The lack of colouration indicates the reduction of nitrates to ammonia or free nitrogen [
28].
2.9. Cytochrome Oxidase Activity
Strain cultures (5 µL) were applied on plates with 79CA medium, incubated at 28 °C for 48 h. After growth, 2 µL of the oxidase reagent A (1 g of p-aminodimethylaniline oxalate in 100 mL distilled H
2O) and 2 µL of reagent B (1 g of α-naphthol in 100 mL 95% ethanol) were applied successively. The appearance of a blue colour indicates the activity of cytochrome oxidase [
28].
2.10. β-galactosidase Activity
The bacteria were cultured in liquid BS medium with the addition of 1% lactose with 0.01% mannitol. After 18 h of incubation at 28 °C, a drop of toluene was added to the culture, which was stirred and placed in ice for 5 min at 37 °C. Then, the cultures were placed in a thermoblock at 37 °C and ortho-nitrophenyl-β-galactoside (ONPG) in the amount of 0.2 mL of substrate per 1 mL of culture was added. The cultures were incubated in the thermoblock with shaking. The change of colour to yellow was a sign of the enzyme activity [
28].
2.11. Indole Production Ability
The bacteria were cultured in minimal Tris-YMRT medium (1000 mL: mannitol—10 g, CaCl
2 × 7 H
2O—0.2 g, MgSO
4 × 7 H
2O—0.25 g, Tris HCl—1.21 g, yeast extract—0.2 g, L-tryptophan—0.061 g, distilled H
2O; pH = 6.8–7.0), incubated at 28 °C for 48 h. Kovac’s reagent (10 g p-dimethylaminobenzaldehyde, 150 mL n-amyl alcohol, 50 mL HCl) was then added to the tubes with drops in 1 mL of reagent per 2 mL of culture. The presence of a red ring in the tube indicated the ability to produce indole [
29].
2.12. Melanin Production Ability
Strain cultures (5 µL) were applied on plates with 79CA medium enriched with L-tyrosine (600 µg mL-1) and CuSO
4 (40 µg mL-1), incubated at 28 °C for 48 h. After growth, 50 µL of sodium dodecyl sulfate (SDS) in Tris-Borate-EDTA (TBE) buffer was applied. The appearance of a brown colour indicated the ability of the bacteria to produce melanin [
30].
2.13. Precipitation of Calcium Glycerophosphate
Strain cultures (5 µL) were applied on plates with Hoffer’s solid medium (1000 mL: mannitol—20 g, KNO
3—5 g, NaCl—3.8 g, KCl—0.1 g, MgCl
2 × 7 H
2O—1 g, MgSO
4 × 7 H
2O—0.6 g, calcium glycerophosphate—0.8 g, agar—14 g, distilled H
2O; pH = 6.8–7.0), incubated at 28 °C for 96 h. After this time, the growth of bacteria and the ability to precipitate calcium glycerophosphate was observed [
31].
2.14. Calcium Phosphate (TCP) Solubilisation
Strain cultures (5 µL) were applied on plates with medium containing TCP (1000 mL: glucose—10 g, NH
4Cl—5 g, NaCl—1 g, MgSO
4—1 g, Ca
3(PO
4)
2—4 g, agar—14 g, distilled H
2O; pH = 6.8–7.0) and incubated at 28 °C for 96 h. After this time, the changes that occurred on the plates were observed, the brightness indicated the ability to reduce TCP [
32].
2.15. Congo Red Adsorption
Strain cultures (5 µL) were applied on plates with 79CA medium containing Congo red at a concentration of 0.025% and incubated at 28 °C for 48 h. After this time, the dye adsorption ability of bacteria was observed [
33].
2.16. Growth at Different pH
The strains’ growth at pH = 4 and 5 was observed in the liquid 79CA medium. The bacterial suspensions were prepared and their OD550 was measured. Then, the bacterial cultures were incubated at 28 °C for 96 h. After this time, OD550 was measured again and the obtained results were compared. The increase in OD550 indicated an increase in bacterial growth at a given pH. The strains’ growth at pH = 6, 7, 8, 9 and 10 were analysed on plates with 79CA medium, 5 µL of the tested strain was applied on plates with a suitable pH and then incubated at 28 °C for 96 h. After this time, the ability of bacteria to grow on individual plates was observed.
2.17. Growth in Different Temperatures
The ability to grow in different temperatures was studied in the liquid 79CA medium. The bacterial suspensions were prepared and their OD550 was measured. Bacterial cultures were then incubated at 6 °C for 96 h, 28 °C for 96 h, 37 °C for 96 h or 42 °C for 96 h. After this time, the OD550 was measured again and the obtained results compared. The increase in OD550 indicated an increase in bacterial growth at a given temperature.
2.18. Growth on Media with Different NaCl Concentration
Strain cultures (5 µL) were applied on plates with 79CA medium containing 0.5%, 1%, 2% or 3% NaCl and incubated at 28 °C for 96 h. After this time, the ability to grow bacteria on individual plates was observed.
2.19. BIOLOG ® GENIII MicroPlate Analysis
Microplates were prepared according to the manufacturer’s instructions according to the protocol C2. Liquid cultures (79CA medium, 48 h with 120 rpm in 28 °C to OD550 = 0.8) of selected bacterial isolates were prepared, 2 mL of culture was centrifuged (5488× g for 10 min) and the pellet was suspended in 1 mL of sterile NaCl (0.85). The mixture was applied to inoculating fluid C (IF-C, composition restricted by the producer) to a cell density of 60–70%. The suspensions were applied to GEN III plates at a volume of 100 µL per well. The plates were incubated in an OmniLog incubator (25 °C for 96 h). Each plate was read every 15 min.
2.20. Biotest
Plant tests were carried out on two legume plants—red clover (Trifolium pratense L.) and pea (Pisum sativium L., variety Hubal)—as one of the most important agricultural species in Poland, which were inoculated with 15 strains selected based on ERIC-PCR results. Seeds were surface disinfected in 3% hydrogen peroxide solution for 15 min with 100 rpm, threefold washed in sterile distilled water. The seeds were placed in 2 L pots filled with 1.5 kg of horticultural soil (commercially available) in the number of 20 clover seeds/pot and 6 pea seeds/pot. After germination, part of plants was removed, so 10 clovers and 3 peas were left in one pot (10 plant repetitions for each strain/control). After 8 days of plant growth, the plants were inoculated with suspensions of the tested bacteria in the volume of 5ml/pot. The suspensions were prepared according to the following procedure: sterile 79CA medium was inoculated with the tested strain, cultured at 28°C for 48h with 120rpm. After this time OD550 of cultures were measured. The cultures were diluted with sterile medium to OD550 = 0.8. The experiment was conducted in the presence of negative control in which plants were inoculated with sterile medium. Plants were irrigated with sterile distilled water. The test was carried out for 8 weeks, under greenhouse conditions (day/night temperature: 28°C/18°C, mean humidity: 40–50%). After this time all plants were weighed (divided into above and underground parts) and a number of root nodules was counted.
2.21. Statistical Analysis
The results of plant tests results were statistically analysed. The first step was to determine whether the distribution of the obtained results was similar to the normal distribution (Shapiro–Wilk test). Then the differences between the results in particular research groups were analysed. For this purpose, depending on the results of the Shapiro–Wilk test, the Mann–Whitney U test, Fisher test (to determine the similarity of variance), T-student test or T-student test with the Welsch correction were used. Correlation analysis was carried out with Spearman or Pearson correlation test, depending on Shapiro–Wilk test results. All statistical analysis was carried out with the use of RStudio packages (Northern Ave, Boston, MA, USA) and GraphPad Prism 8 (San Diego, CA, USA).
3. Results
3.1. Genetic Diversity of Trifolium Rubens Root Nodule Isolates
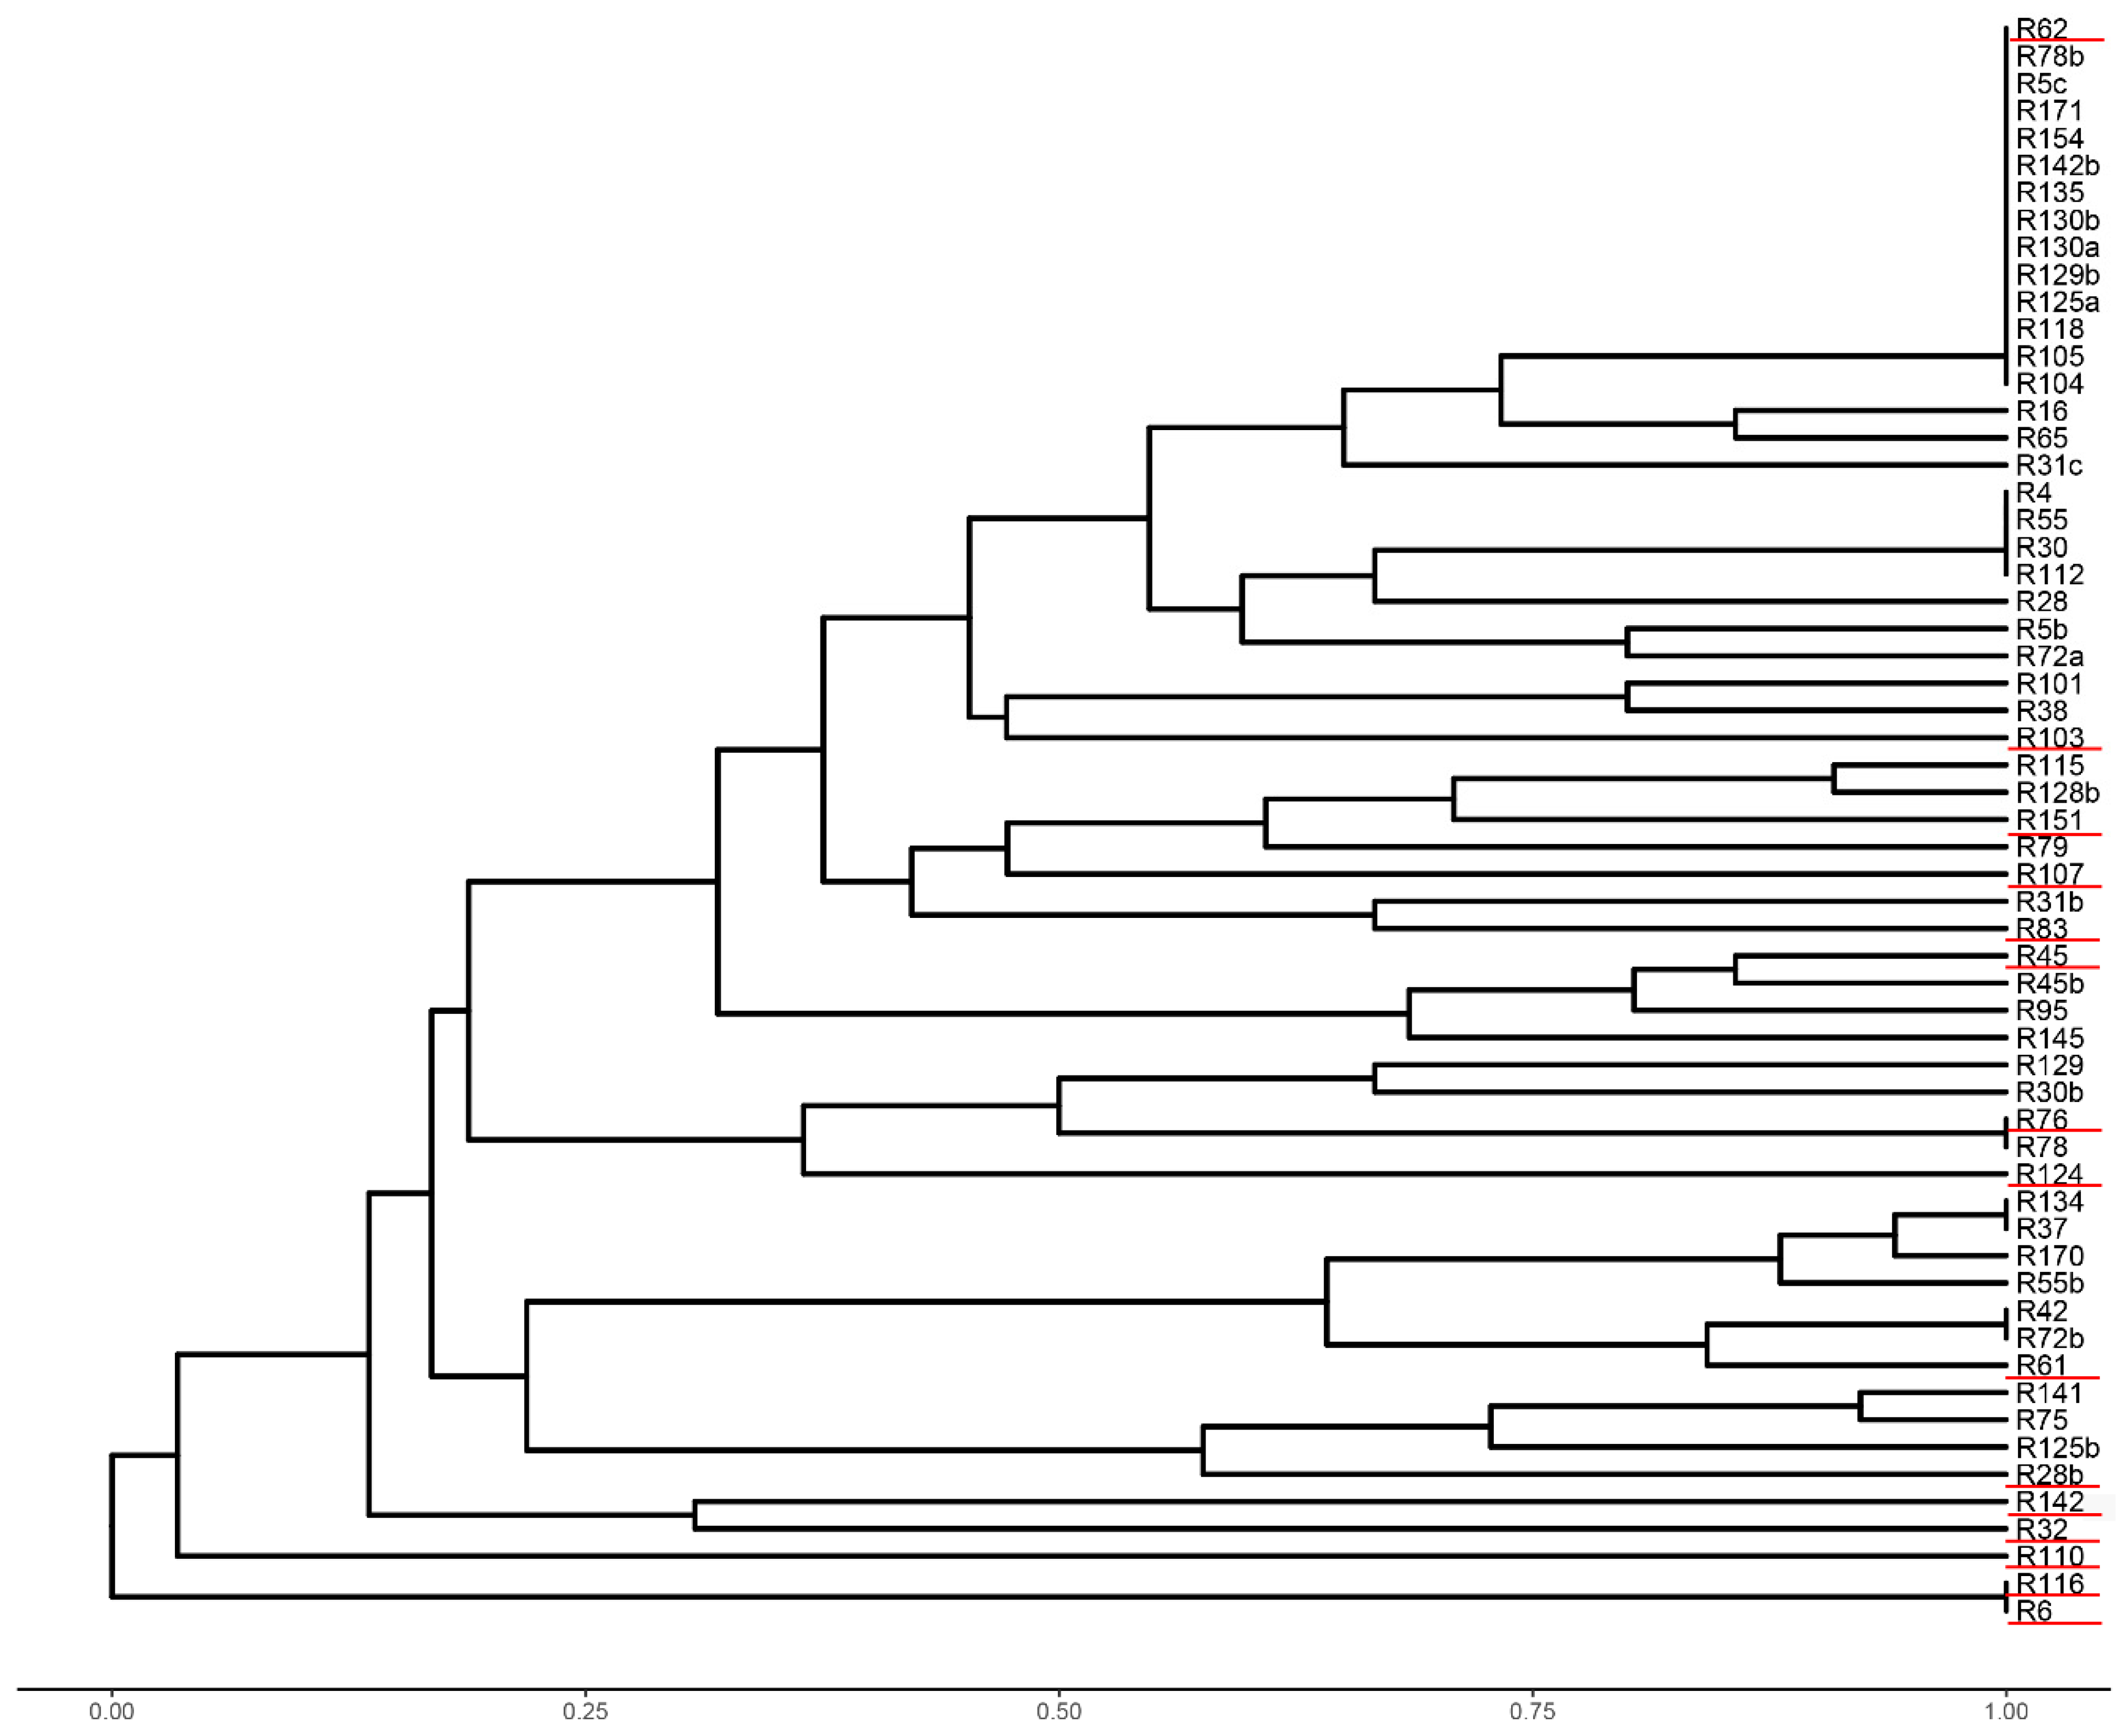
Genomic DNA of 59 bacterial strains isolated from nodules of
T. rubens was used in the ERIC-PCR test. In total, 39 different DNA profiles were found. The analysed strains formed 12 groups from which 15 isolates with a similarity level of less than 50% were selected. The only exceptions were isolates R6 and R116, which formed one branch, but differed 100% from other strains (
Figure 1). Selected strains were further used in phenotyping tests, GenIII analysis and 16S rRNA sequencing.
3.2. 16S rRNA Sequencing
Comparison of 16S rRNA sequences are presented in
Table 1. A phylogenetic tree constructed based on these sequences is presented in
Figure 2. Of the 15 analysed strains, 13 were assigned to the
Rhizobium and two to the
Agrobacterium genus. Eighty per cent of selected strains were closely related to
R. leguminosarum. The 16S rRNA sequence of one strain (R142) was similar to
R. grahamii.
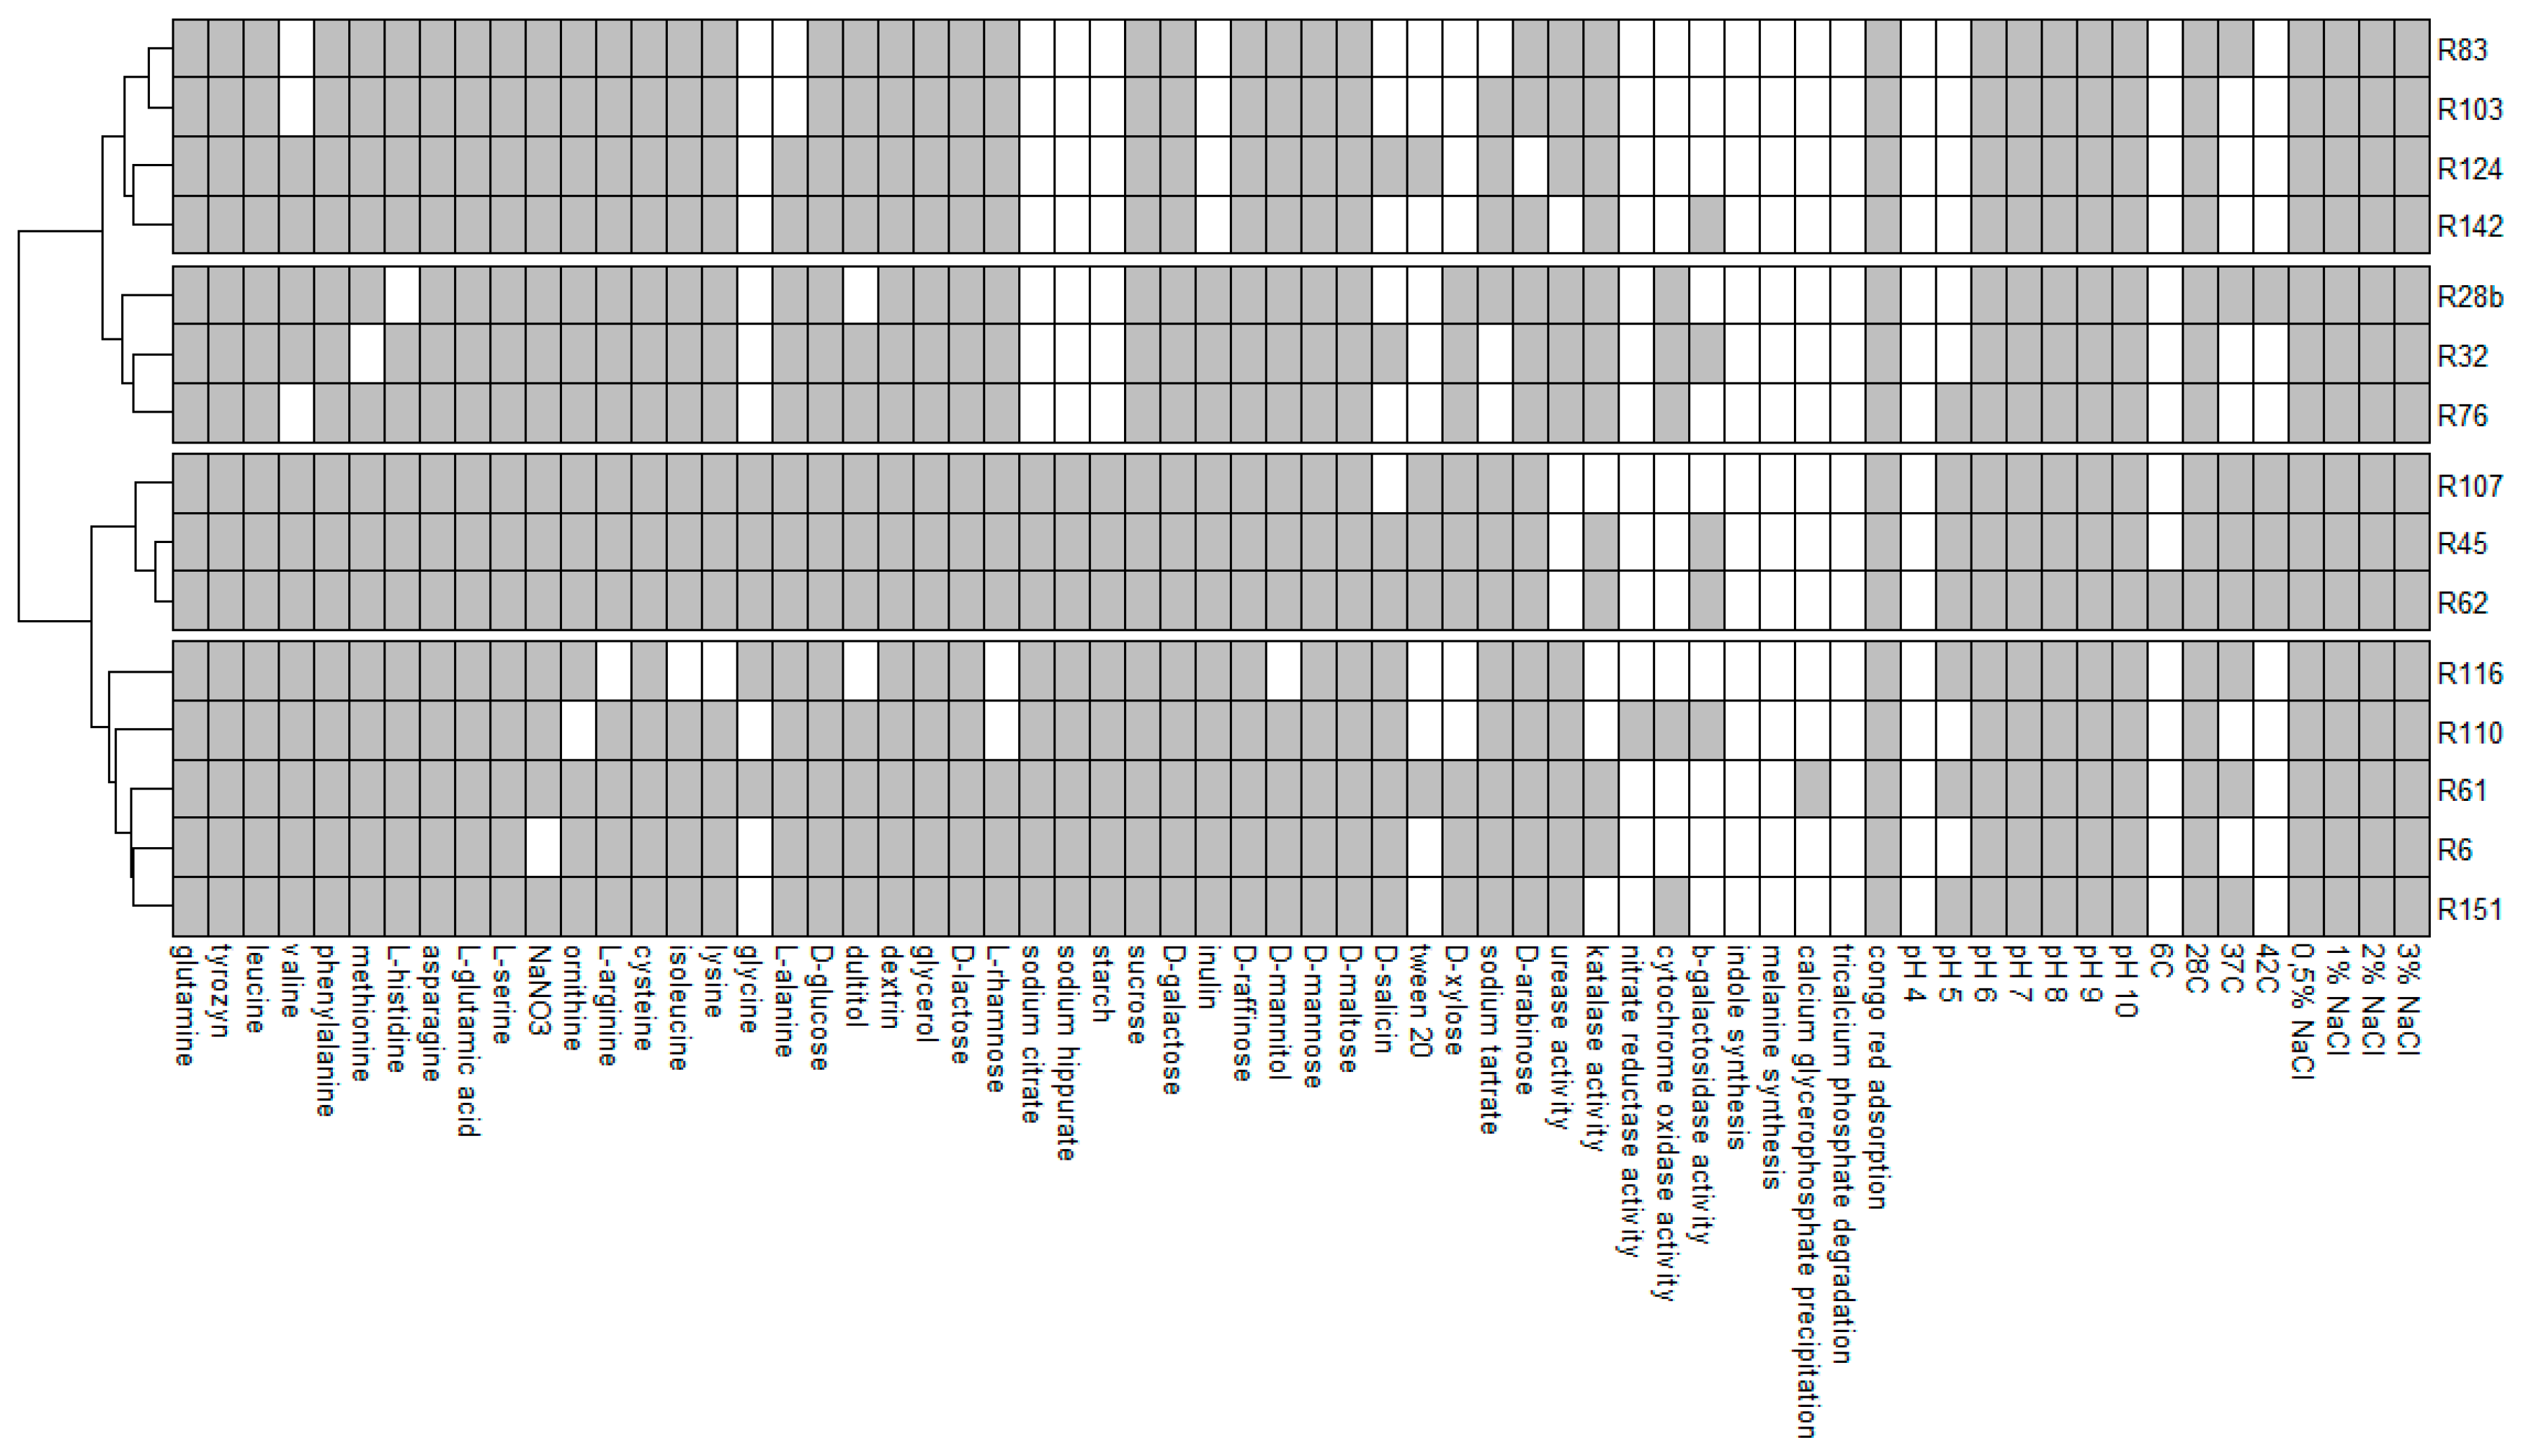
3.3. Phenotyping Tests: growth on Carbon and Nitrogen Sources, NaCl Concentration, Different pH and Temperature
All investigated strains showed an ability to absorb Congo red, grow on plates with media with a pH range of 6–10 and grow on media containing NaCl in concentrations from 0.5% to 3%. Growth on all media containing various compounds as the only source of carbon or nitrogen was observed in R45, R61, R62 and R45, R61, R62 and R107 strains, respectively. The substrates which were decomposed by the least number of strains (5) were glycine as a source of nitrogen and Tween 20 as a source of carbon. None of the analysed isolates showed an ability for indole synthesis, melanin synthesis, TCP degradation and growth at pH = 4. Only one strain had the ability to grow at 6 °C (R62) and to calcium glycerophosphate precipitation (R61). At the same time, R62 was the strain that grew in the highest number of phenotypic tests (56 out of 64). The strains with the lowest growth capacity in the tests were R83 and R103 (42 out of 64) (
Figure 3).
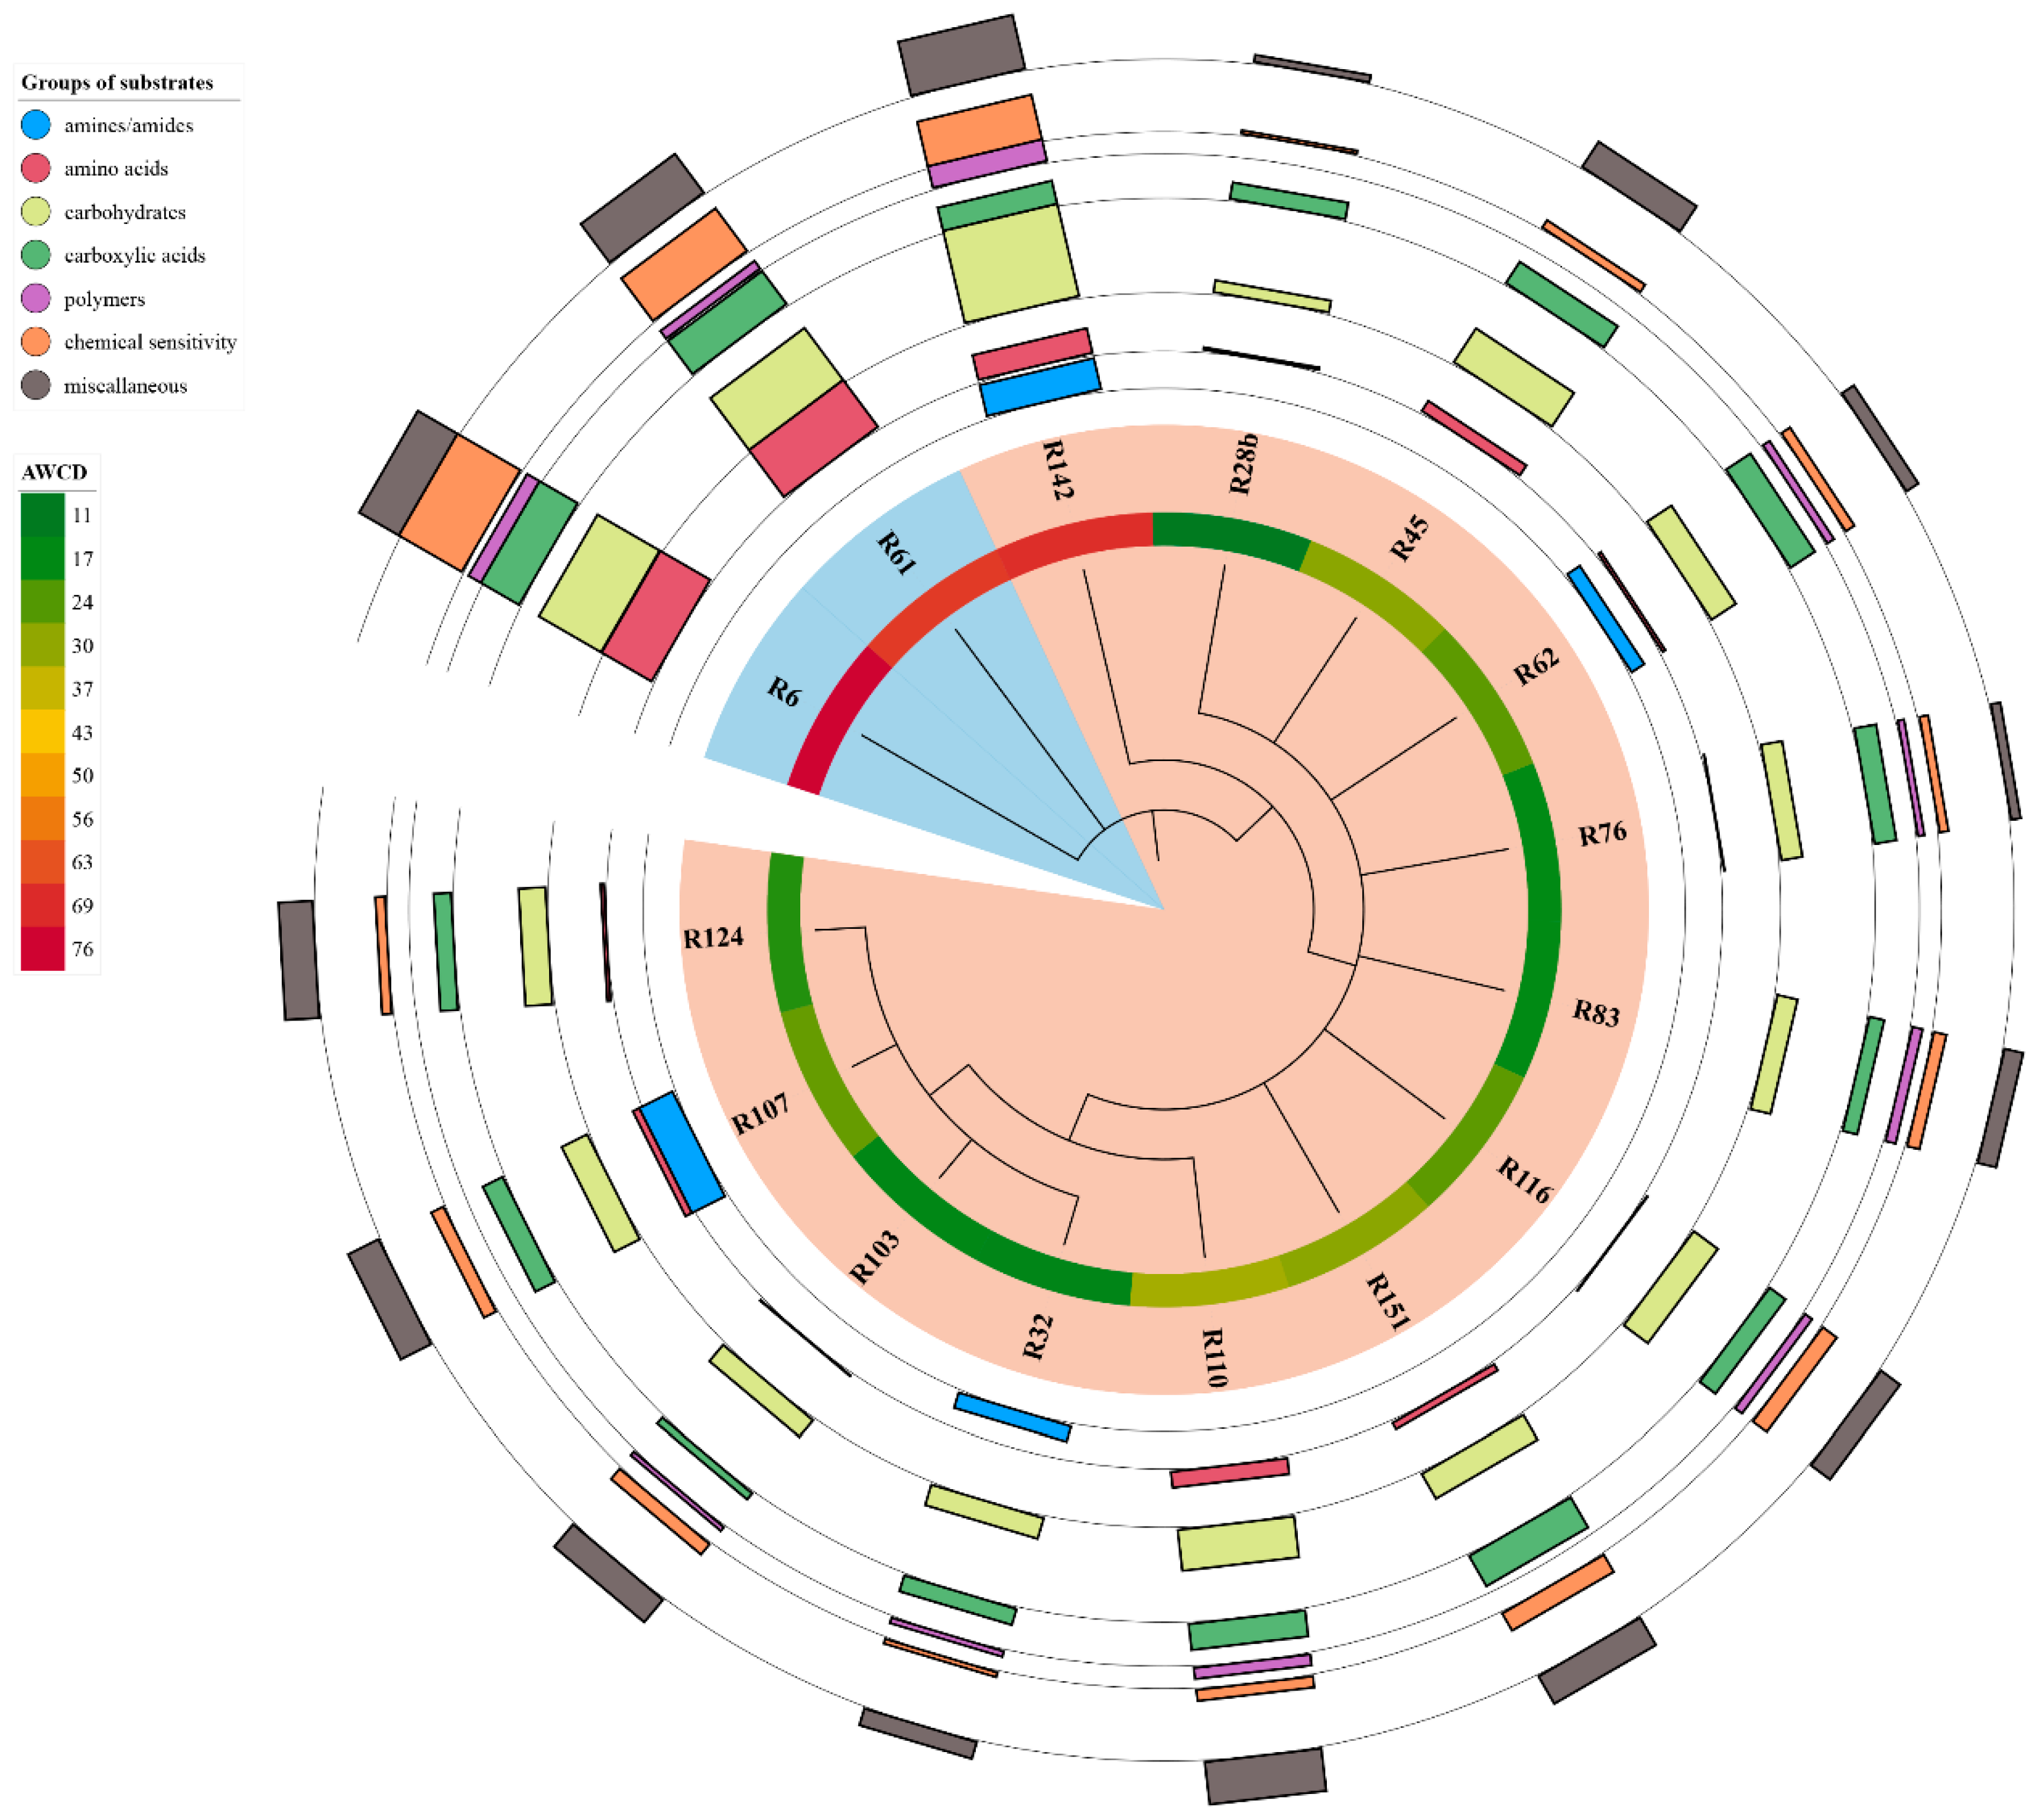
3.4. BIOLOG® GENIII MicroPlate Analysis
The growth of all analysed strains was observed on 13 media containing methyl-d-glucoside, D-salicin, D-mannose, D-fructose, D-galactose, D-fucose, L-fucose, L-rhamnose, D-mannitol, D-arabitol, lincomycin, lactic acid and nalidixic acid. None of the analysed isolates showed the ability to grow at pH = 5 and on media containing N-acetyl neuraminic acid, 8% NaCl, D-serine, D-aspartic acid, minocycline, gelatin, glycyl-l-proline, p-hydroxy-phenylacetic acid and Tween 40. The R6 strain grew on the highest number of media (71), while growth on the lowest number of media (28) was observed in the case of the R103 strain. Most of the analysed carbon sources (52 out of 71) were used by the R6 and R151 strains, and the least (22 out of 71) by the R103 strain. The R6 strain was the only one which grew on media containing fusidic acid, niaproof 4 and sodium bromate (
Figure 4).
Figure 4 shows the phylogenetic tree based on results of 16S rRNA sequencing with results of bacterial growth in the GENIII MicroPlate test at 96 h (
Figure 2).
GENIII MicroPlate analysis using the OmniLog platform and Retrospect software allows observation of the changes that occur over time and the kinetics of the decomposition of individual substrates. The results of the decomposition of the substrates were analysed at 12 h intervals (12 h to 96 h). After 12 h, decomposition was observed in 75 substrates (79.790%), after 24 h—80 substrates (85.106%), after 36 h—82 substrates (87.234%), after 48 h—84 substrates (89.362%), no changes in later hours were observed. The substrates that decomposed by the highest number of strains (14 out of 15) after 12 h of incubation were: D-sorbitol, D-arabitol and nalidixic acid. The substrates that decomposed with the highest average efficiency were D-fructose, D-galactose, D-fucose, L-fucose, D-mannitol, D-arabitol, nalidixic acid (decomposed by 15 strains), lincomycin, tetrazolium blue, L-malic acid (decomposed by 14 strains). The decomposition of fusidic acid and ketobutyric acid was observed at the latest. These substrates were decomposed by only one strain each (R6 and R61, respectively).
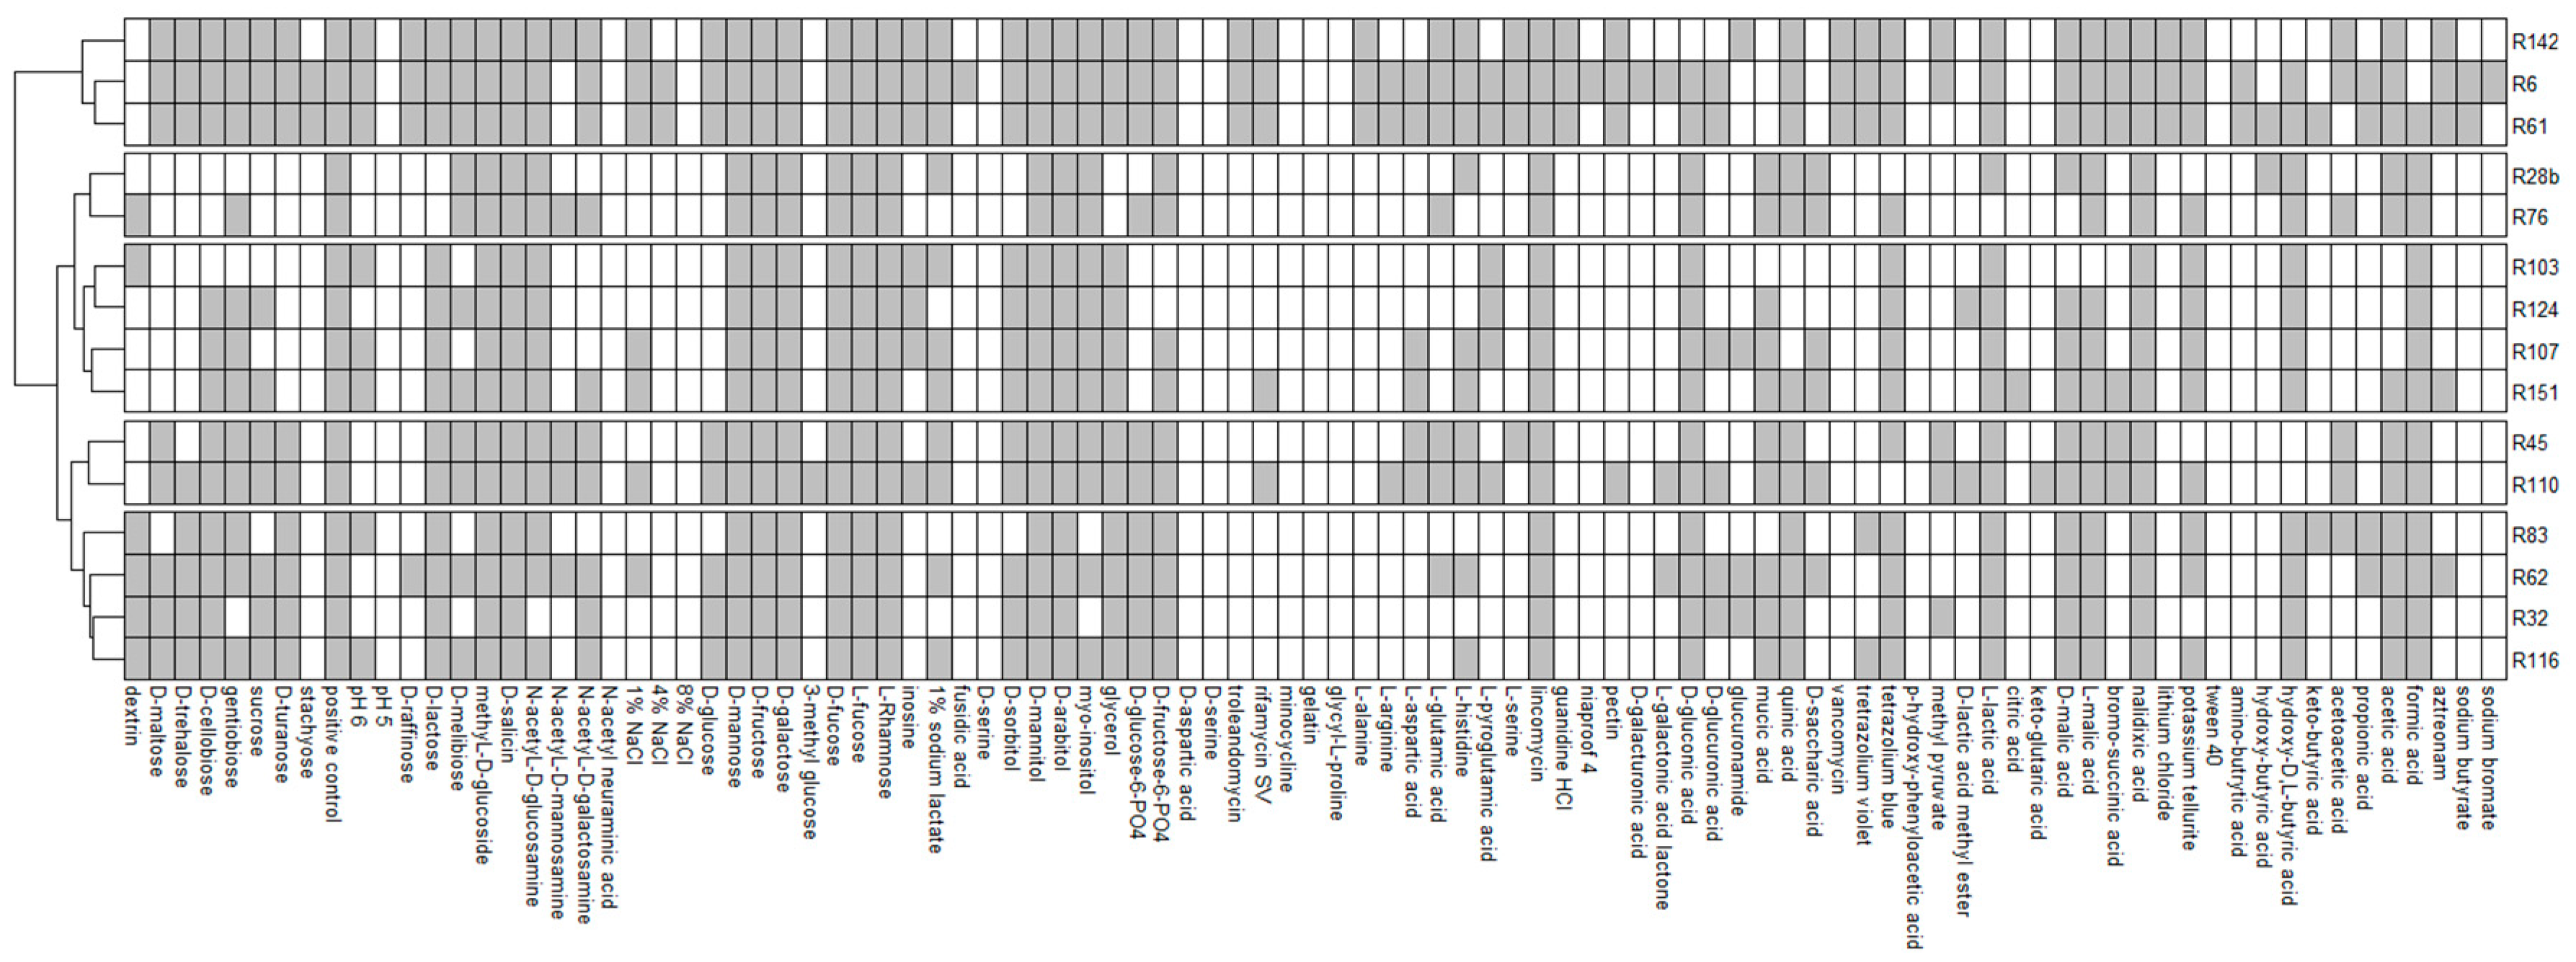
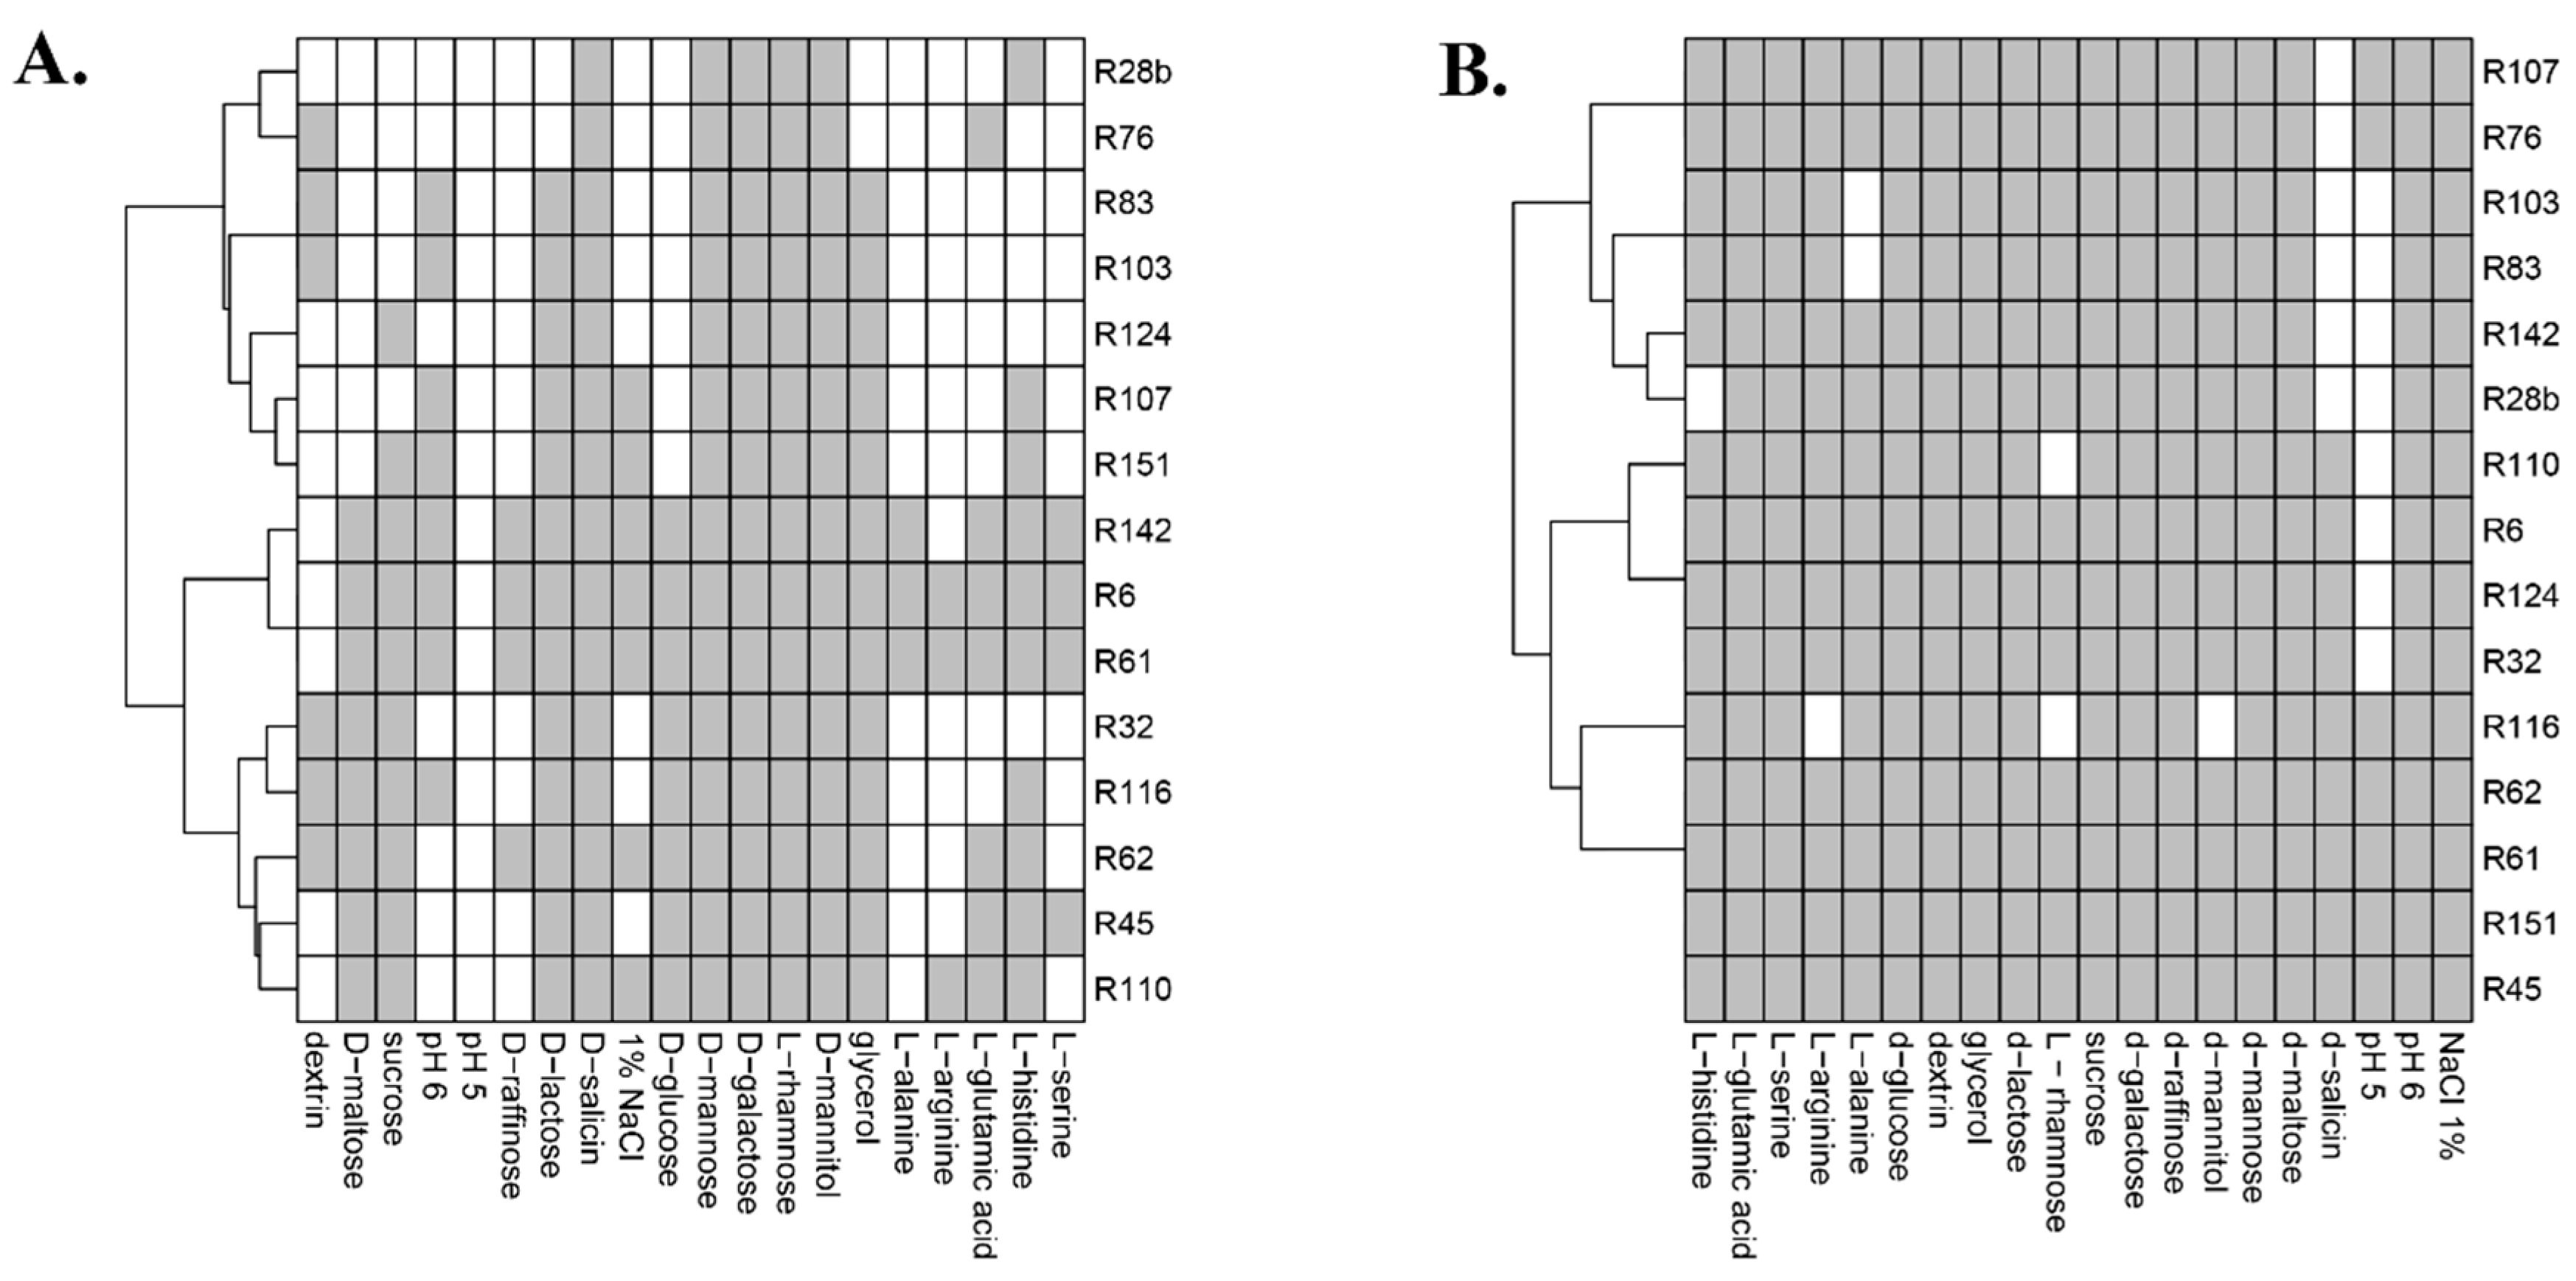
3.5. GENIII MicroPlate Analysis and Phenotypic Tests Results Comparison
Comparison of two phenotyping tests used in this study was possible due to the presence of the same 20 growth substrates/selective conditions in both methods. For D-galactose and D-mannose, growth of the same number of strains was observed in both analyses. Growth of a higher number of strains in phenotypic tests compared to BIOLOG analysis was observed in the case of media containing dextrin, D-glucose, D-lactose, D-maltose, D-raffinose, L-serine, glycerol, L-alanine, L-arginine, L-glutamic acid, L-histidine and sucrose. Growth of a higher number of strains in BIOLOG analysis compared to phenotypic tests was observed in the case of media containing D-mannitol, D-salicin and L-rhamnose. Phenotypic tests showed growth of all analysed strains on media containing 1% NaCl, whereas BIOLOG analysis showed growth of seven strains. Similarly, the higher number of growing strains in phenotypic tests compared to BIOLOG analysis was observed in the case of media with a pH = 5 (7 and 0, respectively) and pH = 6 (15 and 10, respectively) (
Figure 5).
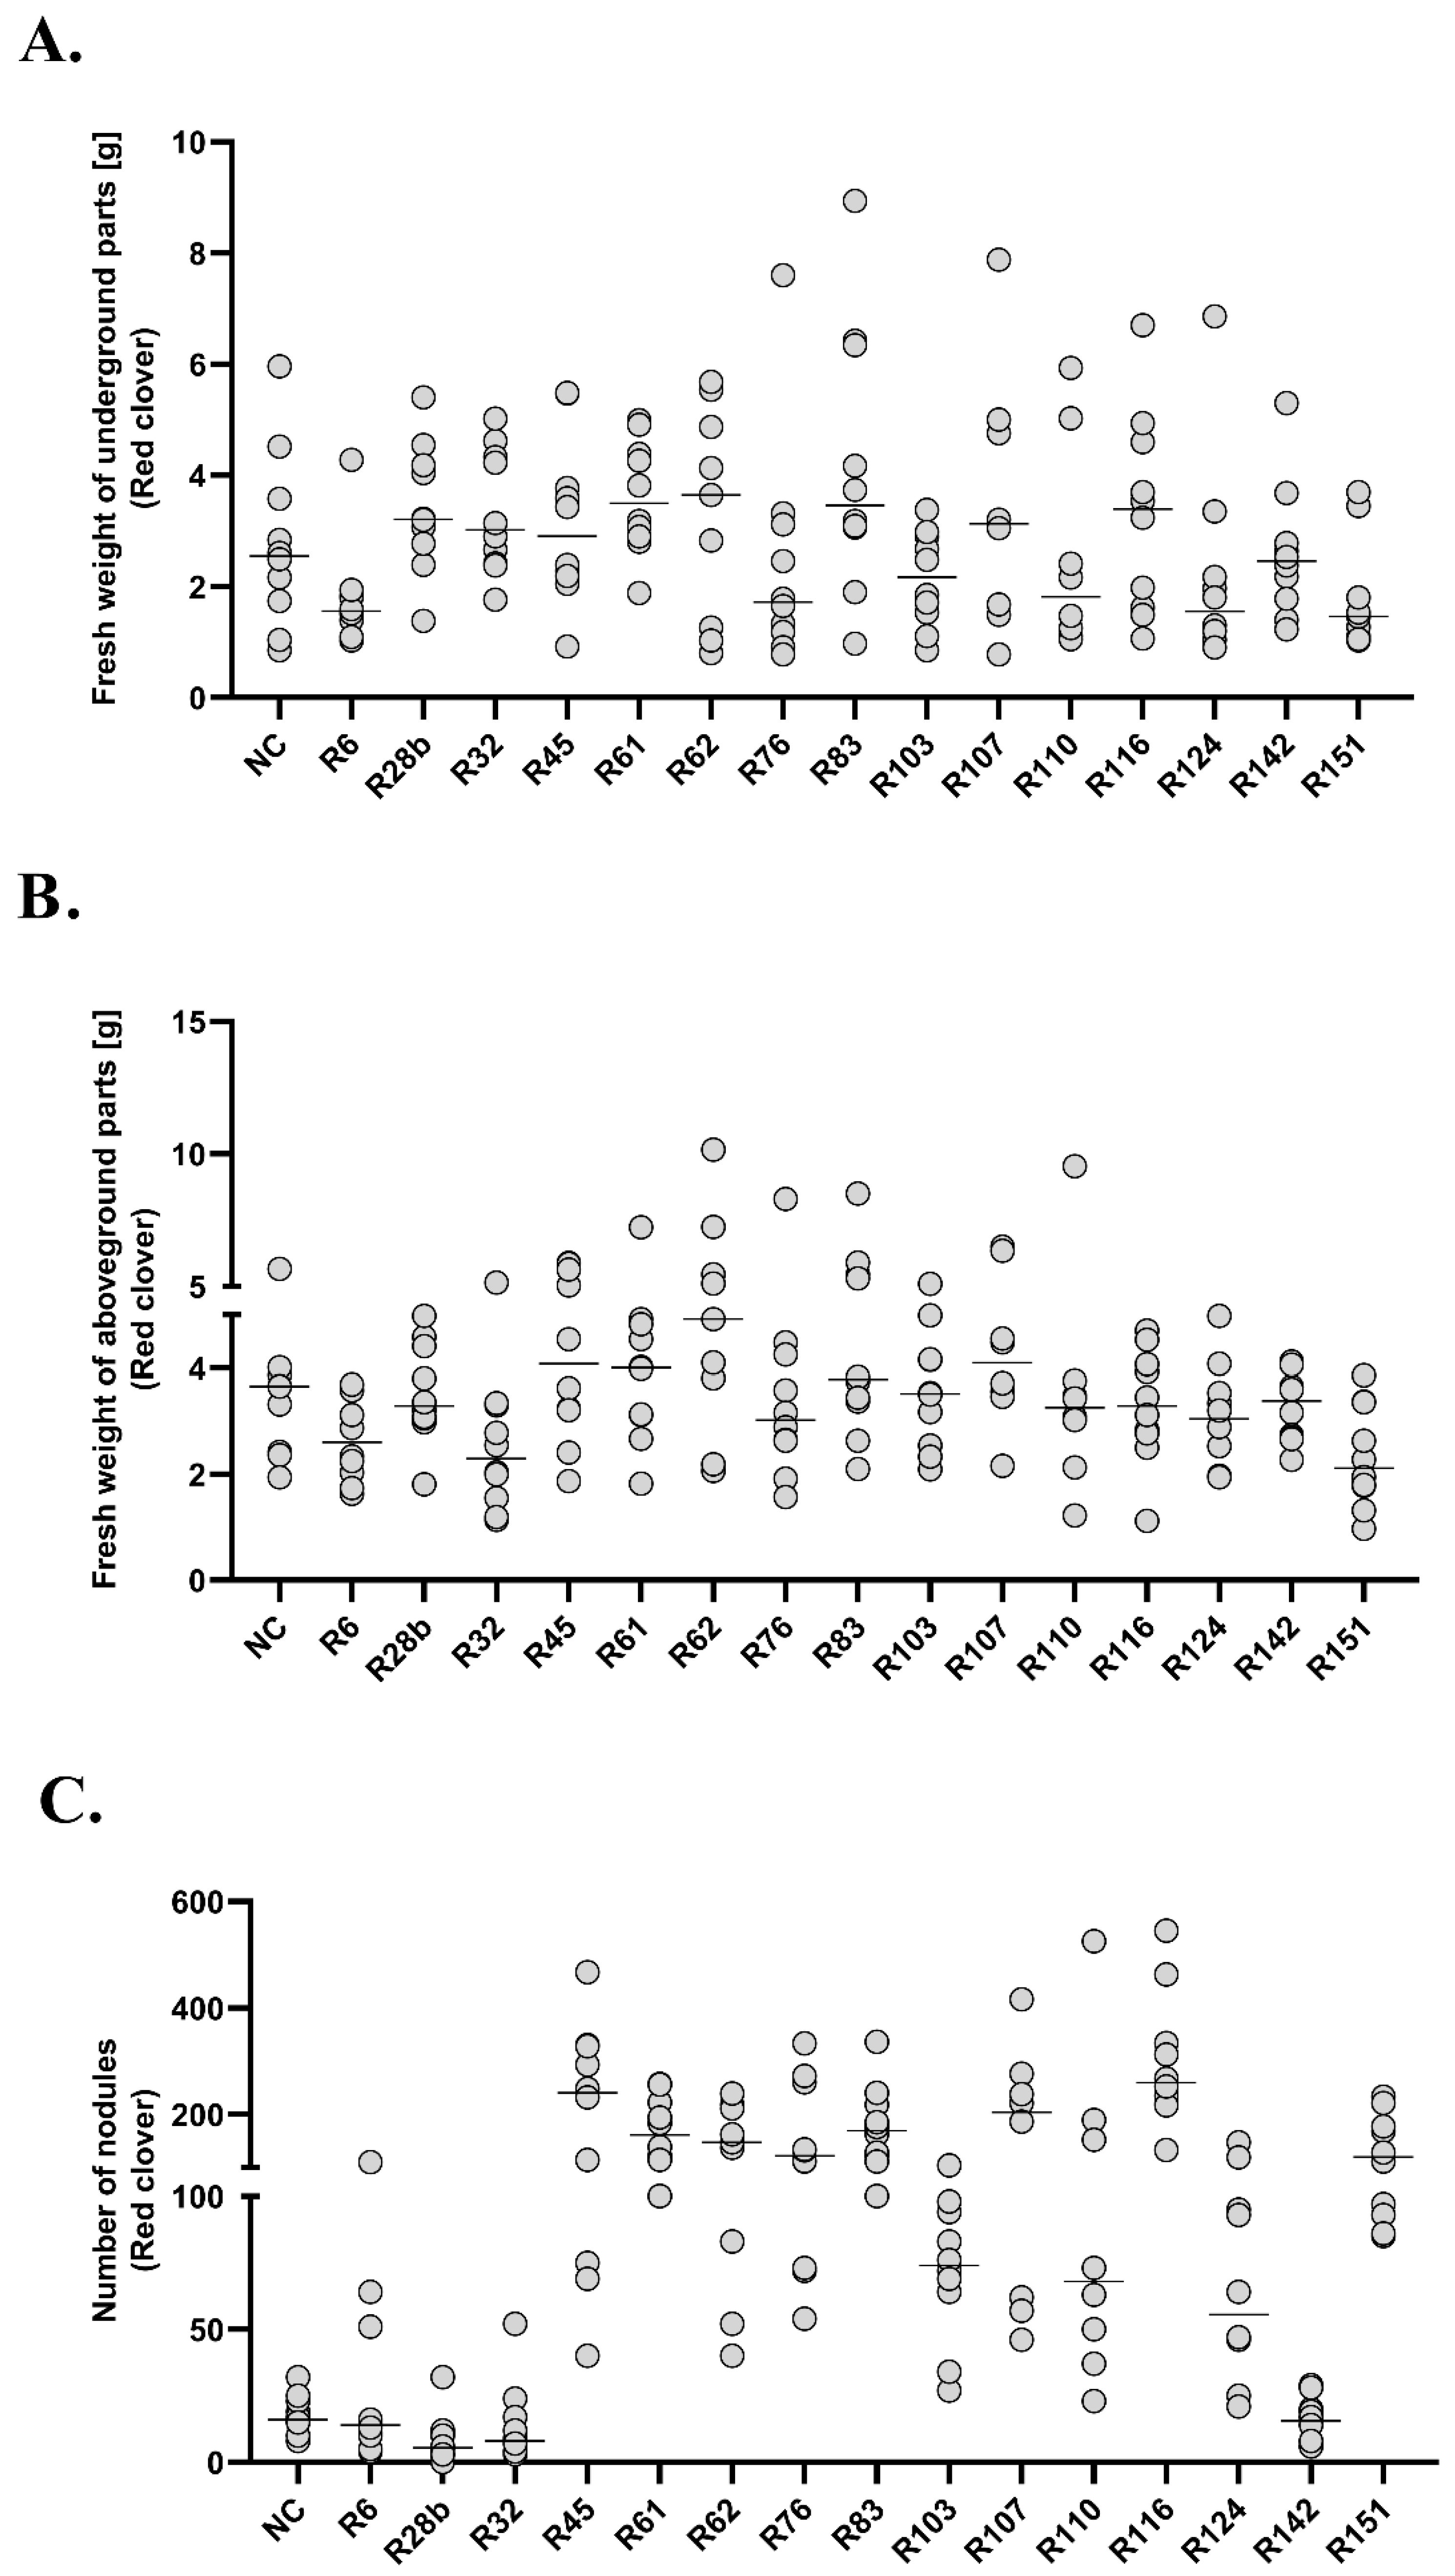
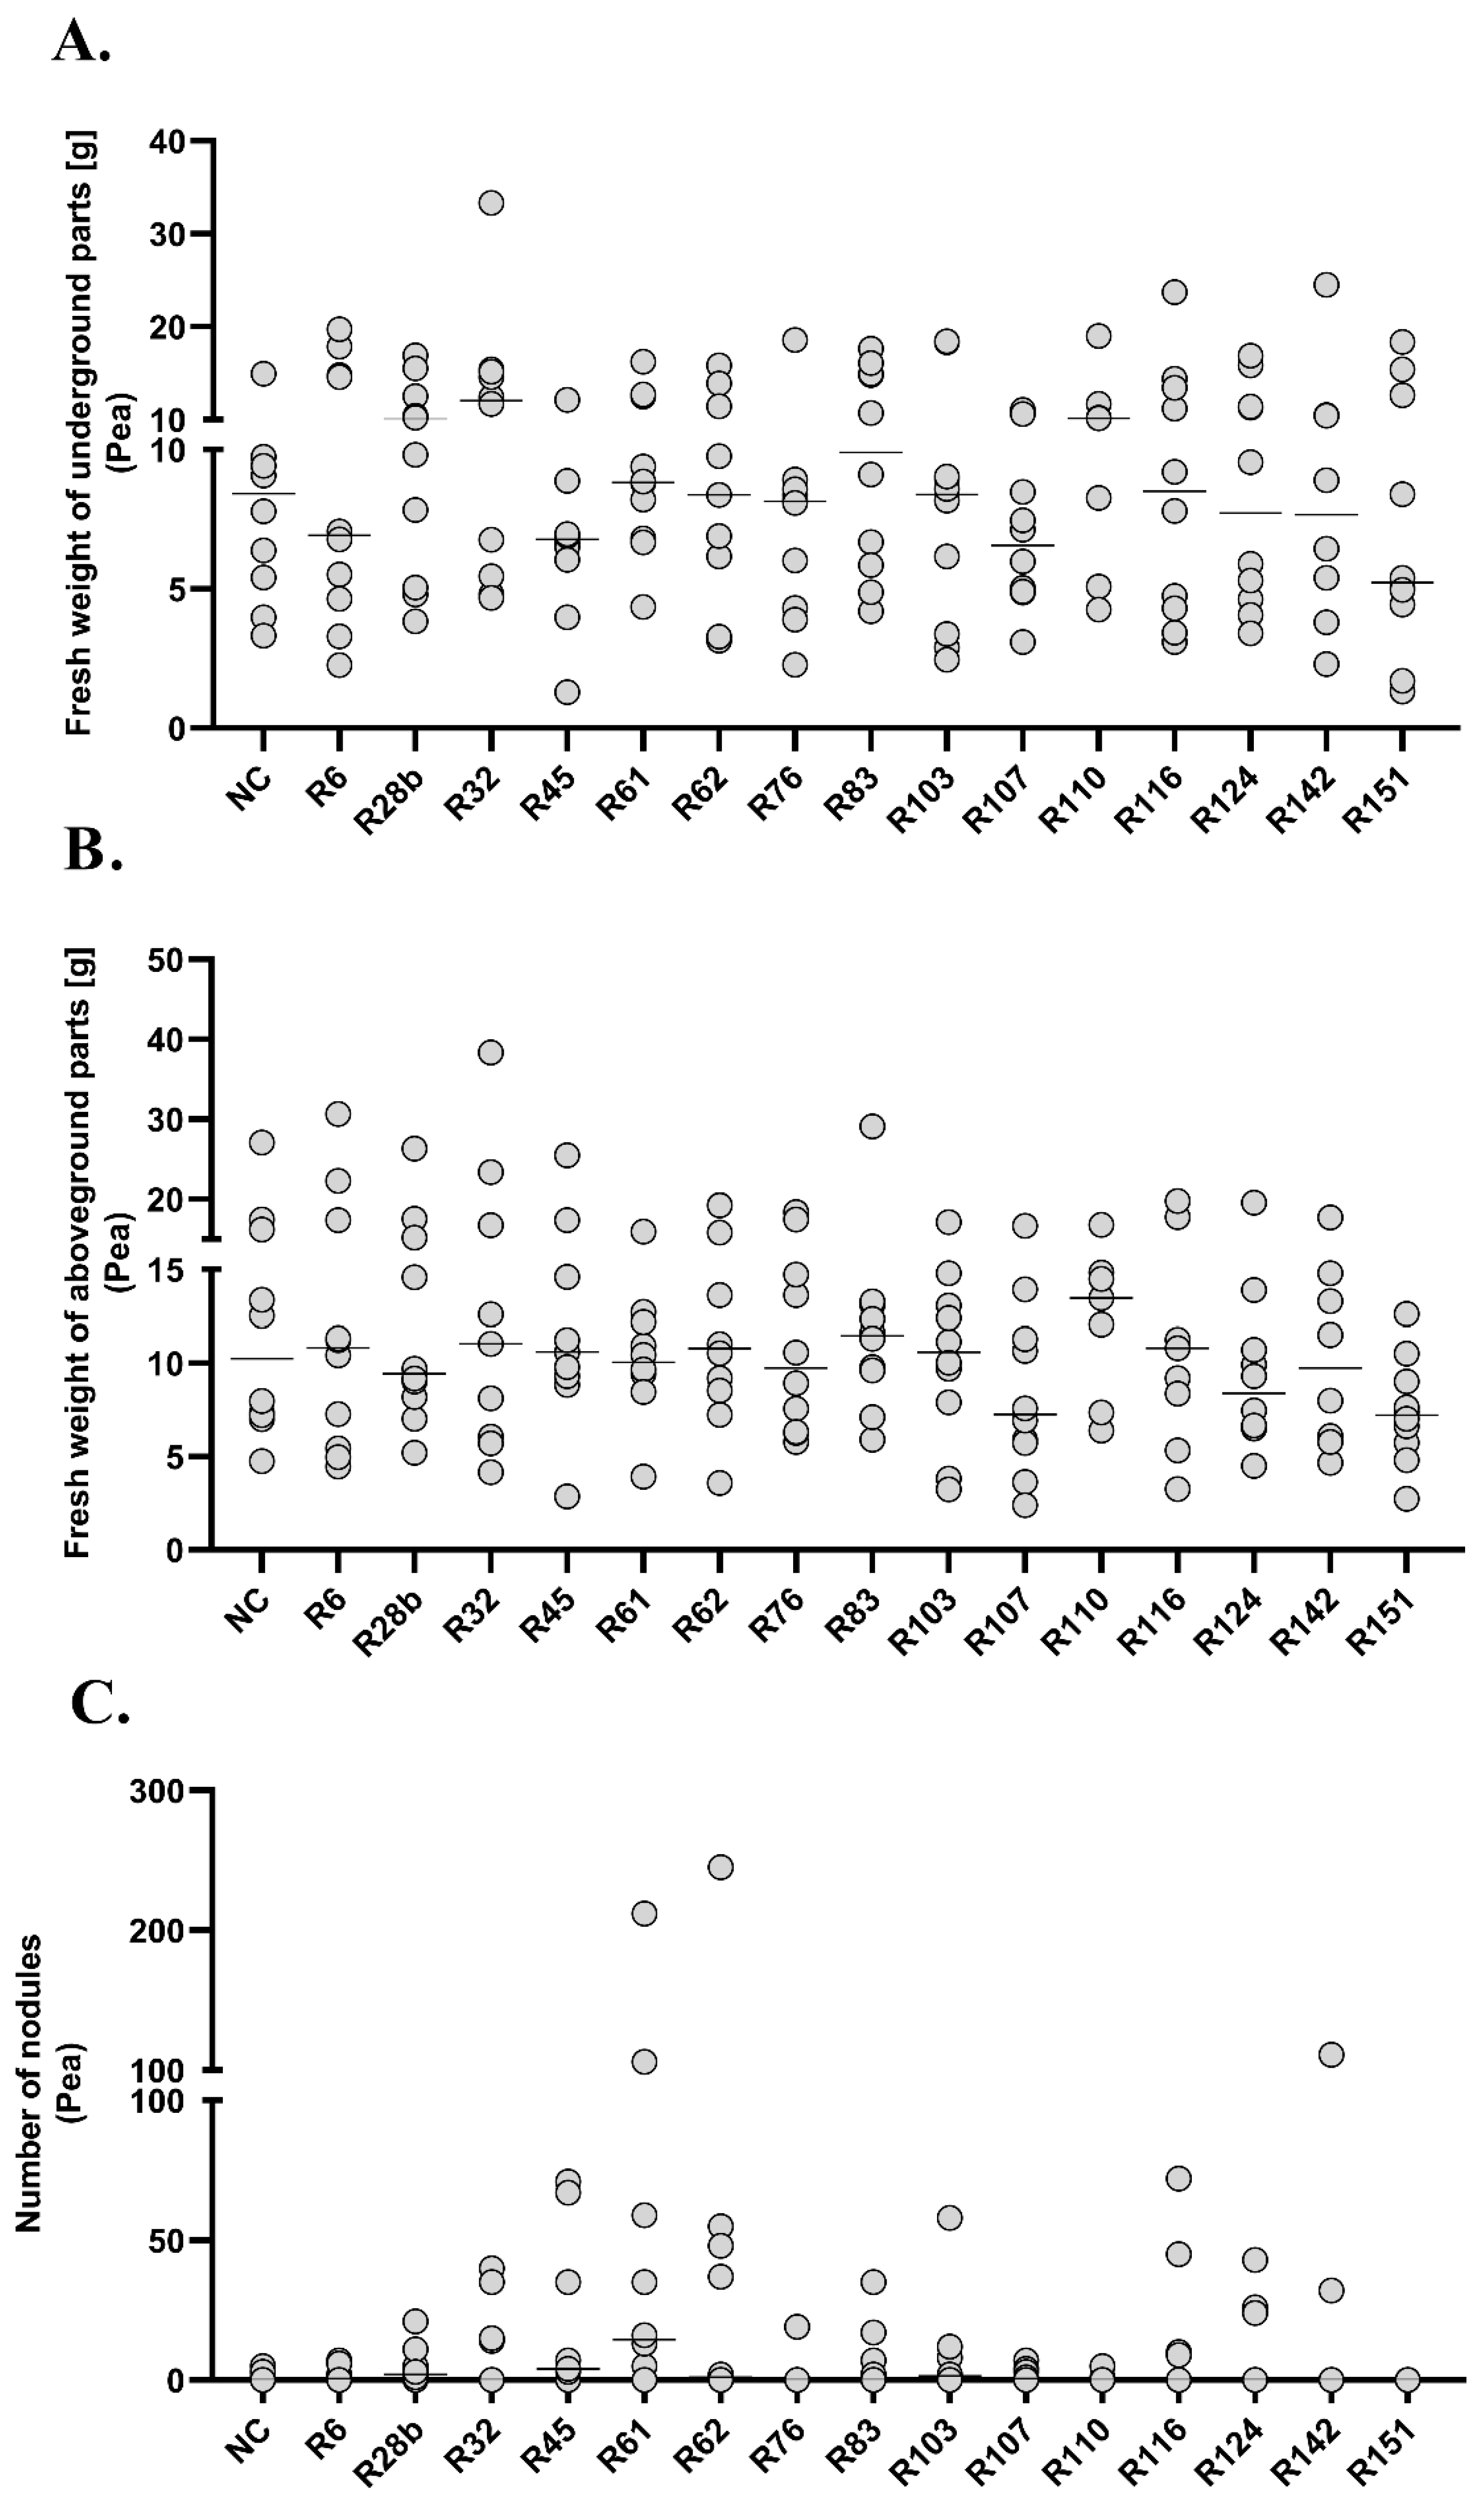
3.6. Biotest
The biotest was carried out using 15 selected isolates. Red clover (
Trifolium pratense L.) and pea (
Pisum sativum L., Hubal) were selected as model plants. The results are presented in figures (
Figure 6,
Figure 7) and
Table 2, while the tables (
Table 3,
Table 4) present the results of statistical analysis of the comparison between experimental groups.
A statistically significant decrease in the fresh weight of clover underground parts was observed in groups R6 and R151, compared to six experimental groups (R28b, R32, R45, R61, R83 and R116). In R61 group the analysed parameter increased in relation to the above-mentioned experimental groups (R6 and R151), and additionally to the R76, R103, R124 and R142 groups. The R151 group was characterized by the lowest fresh weight of underground (Me = 1.463, 95%CI = 1.05/3.45) and aboveground (Me = 2.115, 95%CI =1.32/3.37) parts. Fresh weight of clover underground parts in groups R62, R107 and R110 did not differ from any of the analysed groups. None of the groups showed any difference in comparison to the negative control. The R151 group differed statistically from 10 experimental groups in terms of fresh weight of aboveground parts. In groups R6 and R151, a decrease of analysed mass was observed in relation to the negative control. In groups R32, R62, R76 and R83, a positive correlation was observed between the fresh mass of underground and aboveground parts (R = 0.79, R = 0.85, R = 0.92 and R = 0.78, respectively). Each of the analysed experimental groups of clover differed in terms of the number of root nodules from at least five other groups. The number of root nodules in group R116 differed statistically from the highest number of groups (13). At the same time, it was the group with the highest number of nodules (Me = 259.5, 95%CI = 217/463). The lowest number of root nodules was observed in group R28b (Me = 5.5, 95%CI = 3/12). In 11 experimental groups, a statistically higher number of root nodules was observed in relation to the negative control (R45, R61, R62, R76, R83, R103, R107, R110, R116, R124 and R151). A positive correlation between the fresh weight of underground parts and the number of root nodules was observed in groups R62 (R = 0.93), R83 (R = 0.94), R116 (R = 0.69), R124 (R = 0.96) and in the negative control (R = 0.81). A positive correlation between the fresh weight of aboveground parts and the number of root nodules was observed in groups R62 (R = 0.7), R83 (R = 0.69). A strong positive correlation between all analysed variables in groups R62 and R83 and a statistically significant increase in the number of root nodules in these groups in relation to the negative control may indicate a positive influence of the tested strains on plant growth and the high specificity for the model organism.
The experiment carried out on the plant model of peas did not show any differences in fresh weight of underground parts between the analysed experimental groups. The only statistically significant differences in the weight of aboveground parts and the number of root nodules were observed in group R151. At the same time, it was the group in which the lowest fresh weight of underground parts (Me = 5.225, 95%CI = 1.7/15.4), aboveground parts (Me = 7.205, 95%CI = 4.8/10.5) and no root nodules were observed. Positive correlations between the fresh weight of underground and aboveground parts were observed in groups R6 (R = 0.83), R32 (R = 0.9), R45 (R = 0.89), R62 (R = 0.73), R124 (R = 0.71) and R142 (R = 0.9). In the R107 group, an increase in fresh weight of underground parts was observed together with an increase in the number of nodules (R = 0.71).
4. Discussion
The symbiosis of plants with microorganisms is one of the key processes in the environment. Due to the symbiosis with Rhizobiaceae bacteria, plants belonging to the Fabaceae family can use naturally inaccessible forms of nitrogen. The aim of this study was to analyse the genetic and phenotypic differentiation of bacteria isolated from root nodules of clover Trifolium rubens, which still represents a poorly described symbiosis. T. rubens is a locally rare species, therefore it is important to find a natural way to maintain or increase its population. The study of the ability of specific rhizobia strains to grow under different conditions allows researchers to find the strains with potential usefulness as biological agents used in the environment. The advantage of the presented paper is the application of many different research analyses for genetic (ERIC-PCR, 16S rRNA sequencing) and phenotypic (64 phenotyping tests using classical methods of cultivation on solid or liquid media, BIOLOG® GENIII MicroPlate analysis) differentiation of isolated bacterial strains.
The ERIC-PCR analysis was performed to determine the level of genetic diversity of the analysed strains. ERIC-PCR analysis has been commonly and successfully used for genetic differentiation of rhizobia [
34,
35]. Other genomic fingerprinting methods, such as PCR-RFLP [
19,
36], RAPD-PCR [
37] and BOX-PCR [
16], have also been used with great success for symbiotic bacteria genetic differentiation. The results obtained in this study and previous ones indicate that both ERIC-PCR and BOX-PCR are suitable for genetic differentiation of microsymbionts of
T. rubens. The ERIC-PCR method allowed us to obtain 39 DNA profiles among 59 strains, while the BOX-PCR method resulted in 41 DNA profiles among 63 strains [
16]. Previous studies have shown high genetic diversity of strains isolated from other legume plant species. The BOX-PCR method has allowed to obtain of 27 unique molecular patterns among 29 bacterial strains isolated from
Ononis arvensis nodules [
38], and 11 different amplification patterns within strains isolated from
Desmanthus paspalaceus [
39]. High genetic diversity of strains isolated from
Trifolium pratense root nodules was demonstrated by RAPD-PCR [
37]. Analysis of 16S rRNA is commonly used to define the taxonomy of the studied microorganisms [
33]. Research has shown that most of the bacterial strains isolated from root nodules of Fabaceae belong to
Rhizobium and
Mesorhizobium genera [
18,
19,
38]. In this study, sequencing of 16S rRNA of 15 strains selected based on ERIC-PCR analysis showed high similarity of isolates to
R. leguminosarum. Two strains, most effective in phenotyping tests, belong to the
Agrobacterium genus.
Genetically different strains also differ in metabolic and phenotypic properties [
36,
40]. In this study, rhizobia isolated from
T. rubens root nodules, selected based on genetic analysis, were subjected to a number of phenotypic tests commonly used in the taxonomic assignment of bacteria [
41,
42]. All analysed strains grew in a pH from 6 to 10, half of them also grew on media with a pH = 5, and none of the strains grew at pH = 4. It was previously described that most analysed microsymbionts of Fabaceae have been grown on media that range from slightly acidic to neutral (pH 5–7) [
43], with some exceptions being strains grown on media with a pH = 4 [
44], pH = 8–9 [
39], pH = 10 [
45] and pH = 12 [
18]. Most of the isolates grew at 28, 37 and 42 °C, with the optimal growth temperature being 28 °C. Only one strain grew at 6 °C. Analyses of microsymbionts of Fabaceae showed that the most suitable temperatures for Rhizobiaceae are 15–34 °C [
19] and 4–37 °C [
38]. However, there are exceptions showing growth of rhizobia at temperatures higher than 37 °C [
18,
39]. Similar to
O.arvensis symbionts [
38], all strains grew on media containing 0.5%, 1%, 2% and 3% NaCl. Previous studies indicated that the most tolerable salinity for Rhizobiaceae symbionts is NaCl% 0.5 [
19] or 1% [
18]; however, some isolates can grow on media containing 1.5% [
44], 2% [
39] or even 3% NaCl [
45]. The ability of the analysed strains to grow at higher temperatures, slightly acidic to alkaline pH, and on media containing NaCl in concentrations higher than 2%, indicates that strains can acclimate to different abiotic stress conditions, and at the same time shows the conditions preferred by
Trifolium rubens [
46]. Metabolic tests to verify enzyme activity [
40] and capacity for the production of various compounds [
20] are commonly used for phenotypic analysis of rhizobia. Similarly to previous studies, most of the analysed strains (11 out of 15) showed catalase activity [
47] and five isolates showed cytochrome oxidase activity [
48].
The metabolic profiling of selected strains was performed using BIOLOG microplates. The BIOLOG GENIII MicroPlate analysis allowed examination of strains’ ability to grow on 94 different media, 71 of which were carbon sources, and carry out 23 chemical sensitivity tests. The obtained phenotypes patterns indicated that analysed strains are capable of decomposition of variety of metabolic substrates, with carbohydrates being utilized in the highest number. The ability to decompose different substrates and activate multiple metabolic pathways may be the main factor determining the survival of microsymbionts in the soil environment [
49]. Successful plant root colonization is also dependent on the activation of the expression of genes encoding factors of appropriate metabolic strategies [
50]. The metabolically differentiated strains have also shown growth in a larger pH range and NaCl concentration, which indicates specific metabolic adaptation to different environmental conditions [
43]. Moreover, the comparison of strains obtained in phylogenetic and phenotypic analysis allows the conclusion to be made that the classification of rhizobia on the basis of their metabolic capacity corresponds to their genetic differentiation [
51]. BIOLOG analysis is commonly used to study the phenotype of bacterial strains. The most commonly used are BIOLOG EcoPlate™ plates, on which use of 31 carbon sources can be studied [
52]. The rhizobia studies also included GN2 MicroPlate™ for gram-negative bacterial analysis and PM MicroPlate™ for metabolic profile and analysis of the ability to grow under specific conditions [
43]. GENIII plates are commonly used to identify microorganisms [
53,
54], to determine the metabolic profiles of individual microorganisms [
55,
56] or whole consortia [
57]. The results of phenotypic tests indicated the presence of strains well adapted to different conditions of abiotic stress present in natural environments [
45]. Similar results were obtained in studies on
Desmanthus paspalaceus rhizobial microsymbionts [
39].
Comparison of conventional phenotyping test and BIOLOG analysis was possible due to the presence of the same 20 growth substrates/selective conditions in both methods. The growth of the same number of strains in both analyses was observed only for two substrates. Phenotyping tests performed using the conventional method gave more positive results than the microplate method. These differences are most likely due to their different operational modes. Conventional phenotypic tests are based on the assimilation of nutrients from the substrate, which can led to increased growth, while BIOLOG tests are based on the oxidation of compounds in the electron transport chain [
58]. However, an undeniable advantage of the microplate method is the analysis of the metabolism of compounds over time. The results of BIOLOG analysis allow for an in-depth differentiation analysis of the tested strains and identification of the most effective and growing in the greatest number of conditions. An additional aspect that supports this method is the possibility to study the metabolism of 94 sources at the same time, which significantly reduces the cost and time of analysis.
The study of symbiosis between Fabaceae and Rhizobiacea bacteria is very complex as it depends on the genetic and physiological properties of both partners [
6]. In our studies, a biotest was carried out using 15 selected isolates and two agronomically important plants belonging to different genera, i.e., red clover (
Trifolium pratense L.) and pea (
Pisum sativum L.). Fresh weight of underground and aboveground parts of plants was a factor indicating the influence of applied bacterial strains on the growth of experimental plants. Fresh weight of the plants in the experimental groups where the analysed strains were used differed from the control group by 0.66–1.38 times for clover and 0.76–1.31 times for pea. Previous studies have shown that strains isolated from root nodules give the best results in biotests carried out on native hosts [
36,
43]. However, studies carried out on the symbionts of
O. arvensis have shown some ability to enter into symbiosis with plants of other species [
38]. In the presented study, it was shown that 11 out of 15 isolates from
T. rubens formed root nodules on red clover in a statistically significantly higher number in comparison to the negative control. None of the analysed strains showed a positive effect on pea and the majority of plants did not form root nodules. Previous studies have shown that rhizobia isolated from root nodules of
T. rubens show a narrow host range and their symbiotic ability depends on both plant species and bacterial strain [
16]. Both the Rhizobiacea bacteria and the plants involved in the symbiosis show specific hosts range. One plant species can enter in the symbiosis with several species of bacteria, while another can form symbiotic relation only with one rhizobial species [
5,
59]. Positive correlations between the fresh weight of underground and aboveground parts and the number of root nodules, in which rhizobia fix nitrogen, may indicate the potential importance of the tested strains as natural bioproduct for red clover [
60]. Previous studies have shown that bacterial strains showing the ability to decompose multiple substrates give better results in experiments testing the ability to enter into symbiosis [
36]. In our research, the opposite results were obtained. The R6 strain, which used the highest number of substrates in the BIOLOG analysis and showed growth on the highest number of substrates in phenotypic tests, did not show a statistically significant effect on plants in the greenhouse test. The results obtained in this group were comparable with the negative control and statistically significantly lower than the results obtained in other experimental groups. At the same time, the best results in the biotest carried out on red clover were found in the group where R116 strain was used, which showed average growth in GENIII plates (44/94 substrates). On the basis of all the analyses carried out, at least five strains with a high metabolic potential were found. However, further research is needed to select the strains that could potentially be of application significance. Positive results obtained from such studies may become the basis for obtaining bacterial strains that can be successfully used in practice.


