Article

Chlorophyll Fluorescence Kinetics May Be Useful to Identify Early Drought and Irrigation Effects on Photosynthetic Apparatus in Field-Grown Wheat

1
Department of Plant Physiology, Slovak University of Agriculture, Nitra, Tr. A. Hlinku 2, 94901 Nitra, Slovakia
2
Department of Water Resources and Environmental Engineering, Slovak University of Agriculture, Nitra, Tr. A. Hlinku 2, 94901 Nitra, Slovakia
3
National Agricultural and Food Centre, Research Institute of Plant Production, 921 68 Piešťany, Slovakia
4
Institute of Landscape Ecology, Slovak Academy of Sciences, 814 99 Bratislava, Slovakia
5
Department of Botany and Plant Physiology, Faculty of Agrobiology, Food and Natural Resources, Czech University of Life Sciences, 165 00 Prague, Czech Republic
*
Author to whom correspondence should be addressed.
Agronomy 2020, 10(9), 1275; https://doi.org/10.3390/agronomy10091275
Submission received: 20 July 2020 / Revised: 25 August 2020 / Accepted: 25 August 2020 / Published: 28 August 2020
(This article belongs to the Section Crop Breeding and Genetics)

Abstract

:
To assess the reliability and sensitivity of non-invasive optical methods to detect the early effects of water deficit in the field, we analyzed the time-series of non-invasive measurements obtained in a dry season in a representative collection of wheat genotypes grown in small-plot field trials, in non-irrigated and irrigated variants. Despite a progressive water deficit and significant yield loss, the measurements indicated very minor changes in chlorophyll content or canopy cover. This corresponded well to the insignificant differences in spectral reflectance normalized difference vegetation index (NDVI) values. On the other hand, we identified the significant and rapid response of fast fluorescence kinetics data following the onset of irrigation. Analysis of parameters showed the main effects of drought were associated with changes in the amplitude of the I–P phase of the OJIP transient, indicating changes at the level of photosystem I and beyond. Statistical analyses identified the integrative parameter performance index PItot as the most sensitive parameter, which well-reflects the differences in responses of the genotypes to water deficit. Our results suggest that focusing on photosynthetic functions detected by the rapid chlorophyll fluorescence records can provide more accurate information on the drought stress level, compared to the structural data obtained by absorbance or reflectance measurements.

1. Introduction

Climate change and related environmental stress factors play an increasingly important role in the performance, vulnerability, and productivity of crop plants on a global scale, with important economic impacts [1,2] and associated effects on food security, along with the expected increase of the world population [3]. This has led to increased pressure on researchers to contribute towards increased food production and quality, through development and innovation in relevant fields [4,5].
Considering the sustainability of food production, crop breeding plays a central role in ensuring food security by developing new varieties which are higher yielding, disease resistant, drought tolerant, or regionally adapted to different environments and growing conditions [6]. As conventional plant-breeding progress will not be enough to cope with the increase in demand for food production as a result of population growth [7], there exists an urgent need to accelerate breeding through improved genotyping and phenotyping methods and by efficiently using the available genetic diversity in crop germplasm [4]. New technologies are expected to simultaneously monitor genotypic and phenotypic data in the near future [8,9]. In addition to simple morphological and growth parameters, a larger contribution of physiological traits and responses measured in field conditions are required [10,11].
Field conditions are diverse with little control of environmental factors, and field experiments provide important information which is often different to that obtained in controlled environments [12]. Plants experience a range of stresses throughout their life cycle, caused by a variety of factors. Phenotyping of drought stress effects is particularly challenging, as the soil environment plays a crucial role and is difficult to simulate under controlled conditions [13]. Phenotyping under field environmental conditions remains a bottleneck for future breeding advances. Therefore, it seems necessary to develop a high-throughput phenotyping tools with improved spatial and temporal resolution, which may unlock new prospects for non-destructive field-based phenotyping in plants for a large number of traits, including those related to physiological, biotic, and abiotic stresses [14].
Assessment of the photosynthetic phenomena and apparatus can play a very important role in plant phenotyping, as it is considered to be a good indicator of overall performance or stress sensitivity of crops and genotypes. Chlorophyll fluorescence techniques have many practical applications, providing non-invasive, fast, and economic methods for the measurement of photosynthetic performance [15,16]. They can provide a large set of data on the function of PSII photochemistry obtained in only a few seconds, providing information about plant vitality, which may serve as a screening criterion. Chlorophyll fluorescence emitted from plant leaves provides information on the effects of the environmental factors on the plant’s photosynthetic apparatus and the overall status of the photosynthetic systems within the leaf. Chlorophyll fluorescence can be used to measure the impact of different stress factors on photosynthesis, enabling us to detect the effects of stress before any visible external symptoms appear and before they might be detected by other methods [17,18].
Wheat (Triticum sp.) is the one of most dominant crop species in temperate countries, being used for human food and livestock feed. Wheat is the third most important crop to humankind, in terms of global production, and is a staple of many diets around the world [19]. Therefore, it is important to understand the different factors (e.g., soil fertility, availability of water, climate, diseases, or pests) affecting its crop photosynthetic activity and yield. In wheat, enormous genetic and phenotypic diversity can be observed, including a diversity in photosynthetic responses [20]; however, its efficient utilization in breeding is limited by a lack of efficient tools for testing the photosynthetic response in field collections.
In our previous studies, we identified specific parameters derived from the fast fluorescence kinetics which are useful to assess the level of nitrogen deficiency [21], effects of shading [22], or different PSII thermostability in different wheat genotypes [23]. In addition, in pot experiments, we have demonstrated that some fluorescence parameters, such as performance index, are sensitive to progressive dehydration in wheat, and thus may serve to recognize more sensitive or resistant genotypes [24]. The sensitivity of the fast fluorescence parameters to drought or osmotic stress has also been identified in barley [18], sorghum [25], rice [26], and maize [27]. There are several studies which have confirmed these findings, including a few studies using field conditions [28,29], but there is still insufficient information on the responses of PSII photochemistry on moderate, slowly progressing drought stress in field conditions and the specific effects of irrigation.
In this study, we focused on the effects of water deficit and additional water supply on the photosynthetic apparatus of wheat, indicated by the time-series of selected parameters derived from the chlorophyll fluorescence transient and additional leaf and canopy parameters, as recorded in a dry season in a collection of wheat genotypes. We compared the responses of the fluorescence parameters to water deficit and irrigation with the effects of stress on additional parameters measured at the leaf and canopy level. We also tested the ability of the techniques and parameters to recognize the different responses of the genotypes to stress and irrigation. The main objective of the present study was to identify the most suitable parameter(s) for the detection of drought stress effects and the responses of wheat genotypes under a drought stress scenario typical of a moderate climate zone.

2. Materials and Methods

2.1. Experimental Setup and Climate Conditions

Research Experiments were carried out with a field-grown wheat collection (field trials, Genebank of National Agricultural and Food Centre - Research Institute of Plant Production in Piešťany, Slovak Republic); including the genotypes Equinox (GBR), Dattel (FRA), Thesee (FRA), CGN 04265 (EGY), 16/26 (SVN), Magnif 27 (M.G.) (ARG), President Riverain (FRA), Landrace 1-96 (DEU), Rajve (SVN), Sloga (SRB), Japan 1620 (JPN), Zun 4 (CHN), San Pastore (ITA), Kotte (SWE), 2010K11-10 (CHN), GRC 867 (GRC) (Triticum aestivum L.), Dusan (SRB) (Triticum durum Desf.), AZESVK2009-97 (AZE), Spelt lijn 73 (BEL) (Triticum spelta L.), Roter Samtiger Kolbenweizen (DEU), Unmedpur Mummy (EGY), AZESVK2009-90 (GEO), NP 202 (New Pusa) (IND), AZESVK2009-88 (GEO) (Triticum turgidum L.), and GRCSVK2013-16 (GRC) (Triticum monococcum L.), which were realized in a regular growing season. The seeds were sown manually directly into the soil in autumn, into experimental plots of area 1.5 m2. The previous crop was field peas (Pisum sativum subsp. arvense). In the autumn, plants were fertilized with 330 kg ha−1 NPK (15-15-15), 150 kg ha−1 AMOFOS fertilizer (12% N, 52% P2O5), and 120 kg ha−1 potassium chloride (60% K2O). Spring fertilization was realized as 110 kg ha−1 of ammonium nitrate with limestone (27% N). Furthermore, in autumn and spring, spraying against weeds was performed using optimal doses.
The experiments were significantly affected by the weather (Table 1), as the growing season (2016–17) was dry. In particular, the spring season was very dry and warm; except for April, which was normal.
The crop moisture index (CMI), a drought index considering both temperature and precipitation to estimate the soil water balance [30], was calculated for the spring vegetation period, in order to recognize significant water deficits in field conditions.
The experimental plots were organized in two blocks: one block with a drip irrigation system (hereinafter indicated as the irrigated variant) and another block without irrigation (non-irrigated variant). The blocks were separated by a buffer (strip) of conventional wheat.
Drip irrigation was initiated in May, when the water reserves in soil decreased and the water deficit was recognized. Irrigation was then performed on regularly, once a week, with a dose of ~20 mm in the irrigated variant.

2.2. Chlorophyll Fluorescence Measurements

Chlorophyll a fluorescence measurements were performed both on control and stressed variants from April to June, in regular intervals. Intact flag leaves of wheat plants were adapted to darkness for 15 min using leaf clips. Chlorophyll a fluorescence was measured using a Handy PEA (Plant Efficiency Analyzer, Hansatech Instruments, Kings Lynn, UK). After the adaptation of leaves to darkness, a single strong 1 s light pulse (3500 µmol m−2 s−1) was applied, provided by three light-emitting diodes (650 nm). The fast fluorescence kinetics (F0 to FM) was recorded from 10 µs to 1 s. For each genotype and variant, at least 10 measurements were applied. The measured data were analyzed by the JIP test [31,32]. The state of PSII photochemistry was analyzed using the parameters listed in Table 2.

2.3. Measurements of Chlorophyll Content

Chlorophyll content was measured on the surface of the youngest fully developed leaf using a SPAD-502 chlorophyll meter (Konica-Minolta, Tokyo, Japan). The SPAD index values corresponding to the leaf chlorophyll content per leaf area were calculated based on the amount of light transmitted by the leaf in two wavelength regions (650 and 940 nm). The mean SPAD values were calculated as the average of ten measurements on the middle part of the leaf.

2.4. Assessment of Reflectance-Based Vegetation Index (NDVI)

The ASD FieldSpec 4 (Analytical Spectral Devices Inc., USA) broadband spectroradiometer was used to measure the spectral reflectance curves at wavelengths of 350–2500 nm. The measurements were performed directly in the field, where the sensor was held at a height of 60 cm above the plant. Measurements were performed in multiple replicates on one genotype.
In this study, we analyzed a main vegetation index—the normalized difference vegetation index (NDVI) (Equation (1)—obtained from the differential absorption of red and near-infrared reflectance bands [33], calculated as follows:
NDVI = (R900 − R680)/(R900 + R680)

2.5. Assessment of the Crop Water Status

As the technical possibilities and organization of the measurements did not enable realization of conventional invasive assessment of leaf or plant water content, we monitored the changes of the water-sensitive bands of the spectral reflectance records, as measured by the ASD FieldSpec 4 (Analytical Spectral Devices Inc., Boulder, CO, USA) broadband spectroradiometer.
In this experiment, as a measure of the canopy water status, we selected the water band index (WBI) (Equation (2) [34], based on near infra-red spectra:
WBI = R900/R970.
Although the WBI data could not be used for precise estimation of the water content, they provided rough information about the presence or absence of the differences in leaf water status between two variants.

2.6. Analysis of the Canopy Absorbance

The canopy absorbance was analyzed using the values of the light intensity measured above the canopy and near the soil level inside the canopy using a portable light sensor system Plant Canopy Analyzer (LICOR Inc, Lincoln, NE, USA).

2.7. Analysis of the Yield Components

In the spikes of individual plants, we assessed the number of grains per spike, thousand grain mass (g), and total grain mass per plant (g), representing grain yield.

2.8. Statistical Analyses

Statistical analysis was performed using two-way analysis of variance (ANOVA) followed by the post hoc Tukey HSD test (p < 0.05) using the Statistica version 9.0 software (Statsoft Inc., Tulsa, OK, USA). The factors analyzed were Irrigation (irrigated vs. non-irrigated variant) and Genotype (25 genotypes). The data presented in graphs represent mean value  ±  standard error. Measurements of all parameters in two variants were realized in 25 genotypes, performed nine times during the spring wheat season (March to June). Ten individuals of each genotype were analyzed using non-invasive methods. Analysis of statistical significance was performed also for a period of three analyses, before and after.

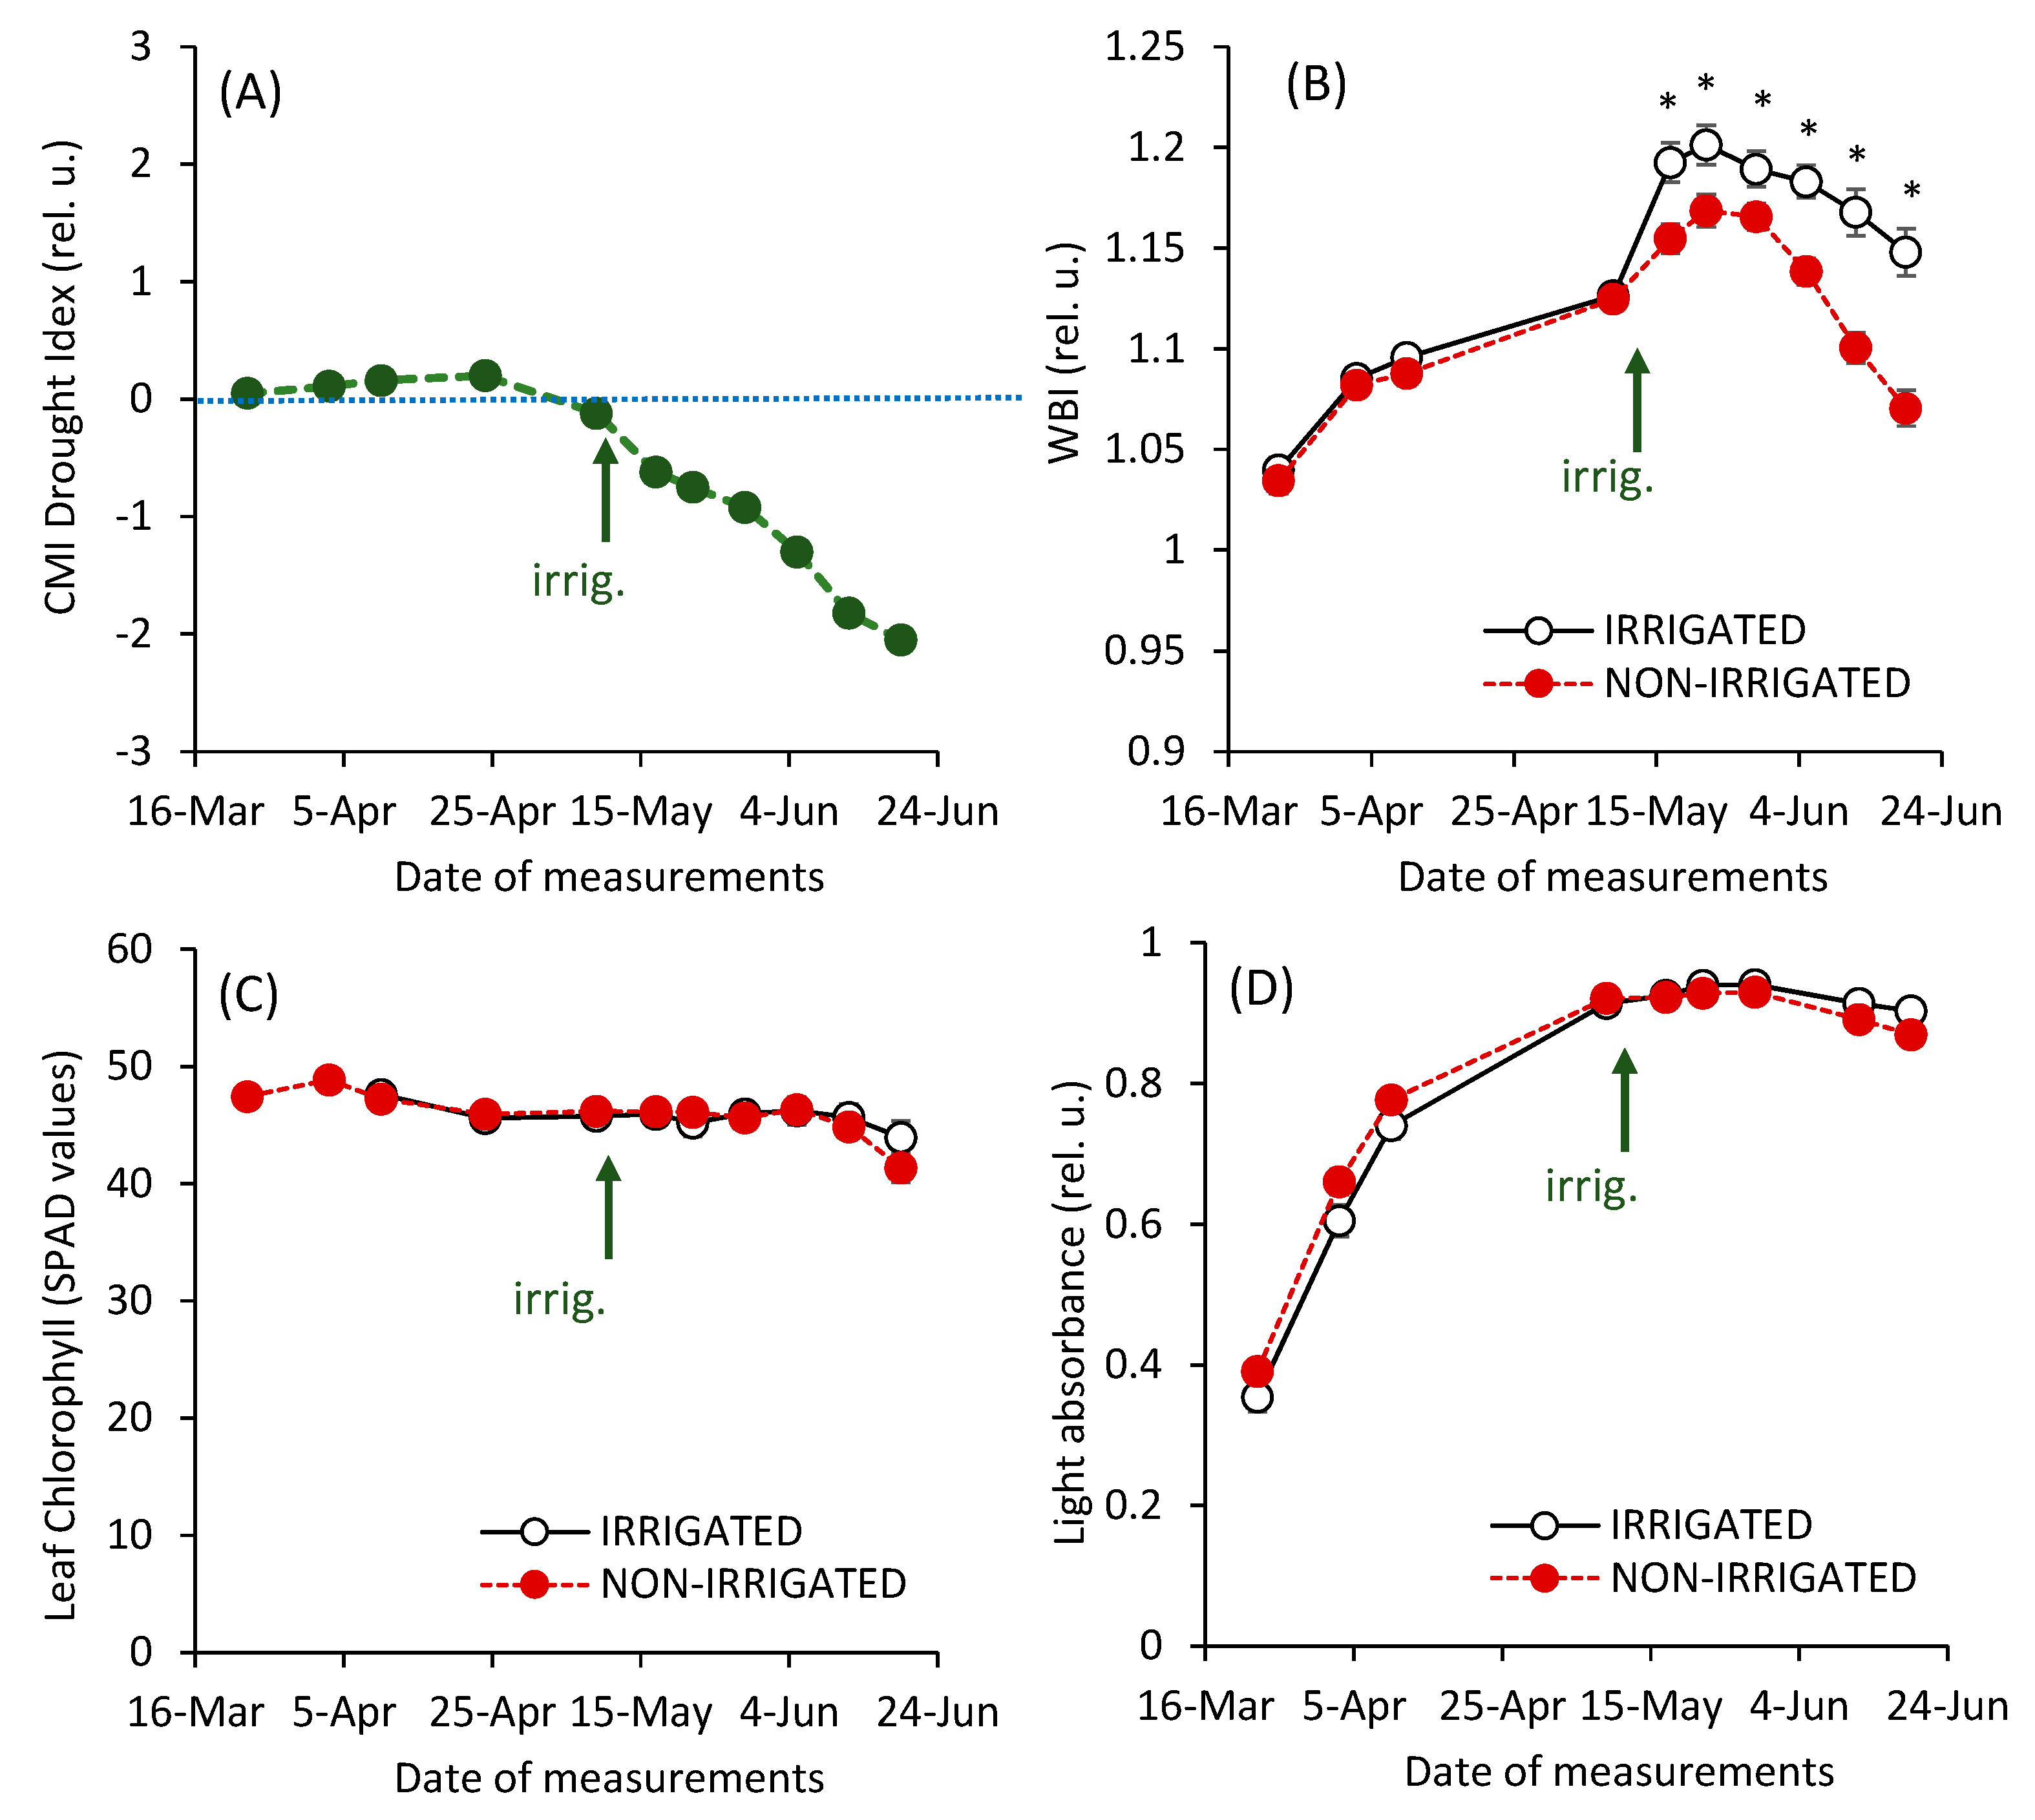
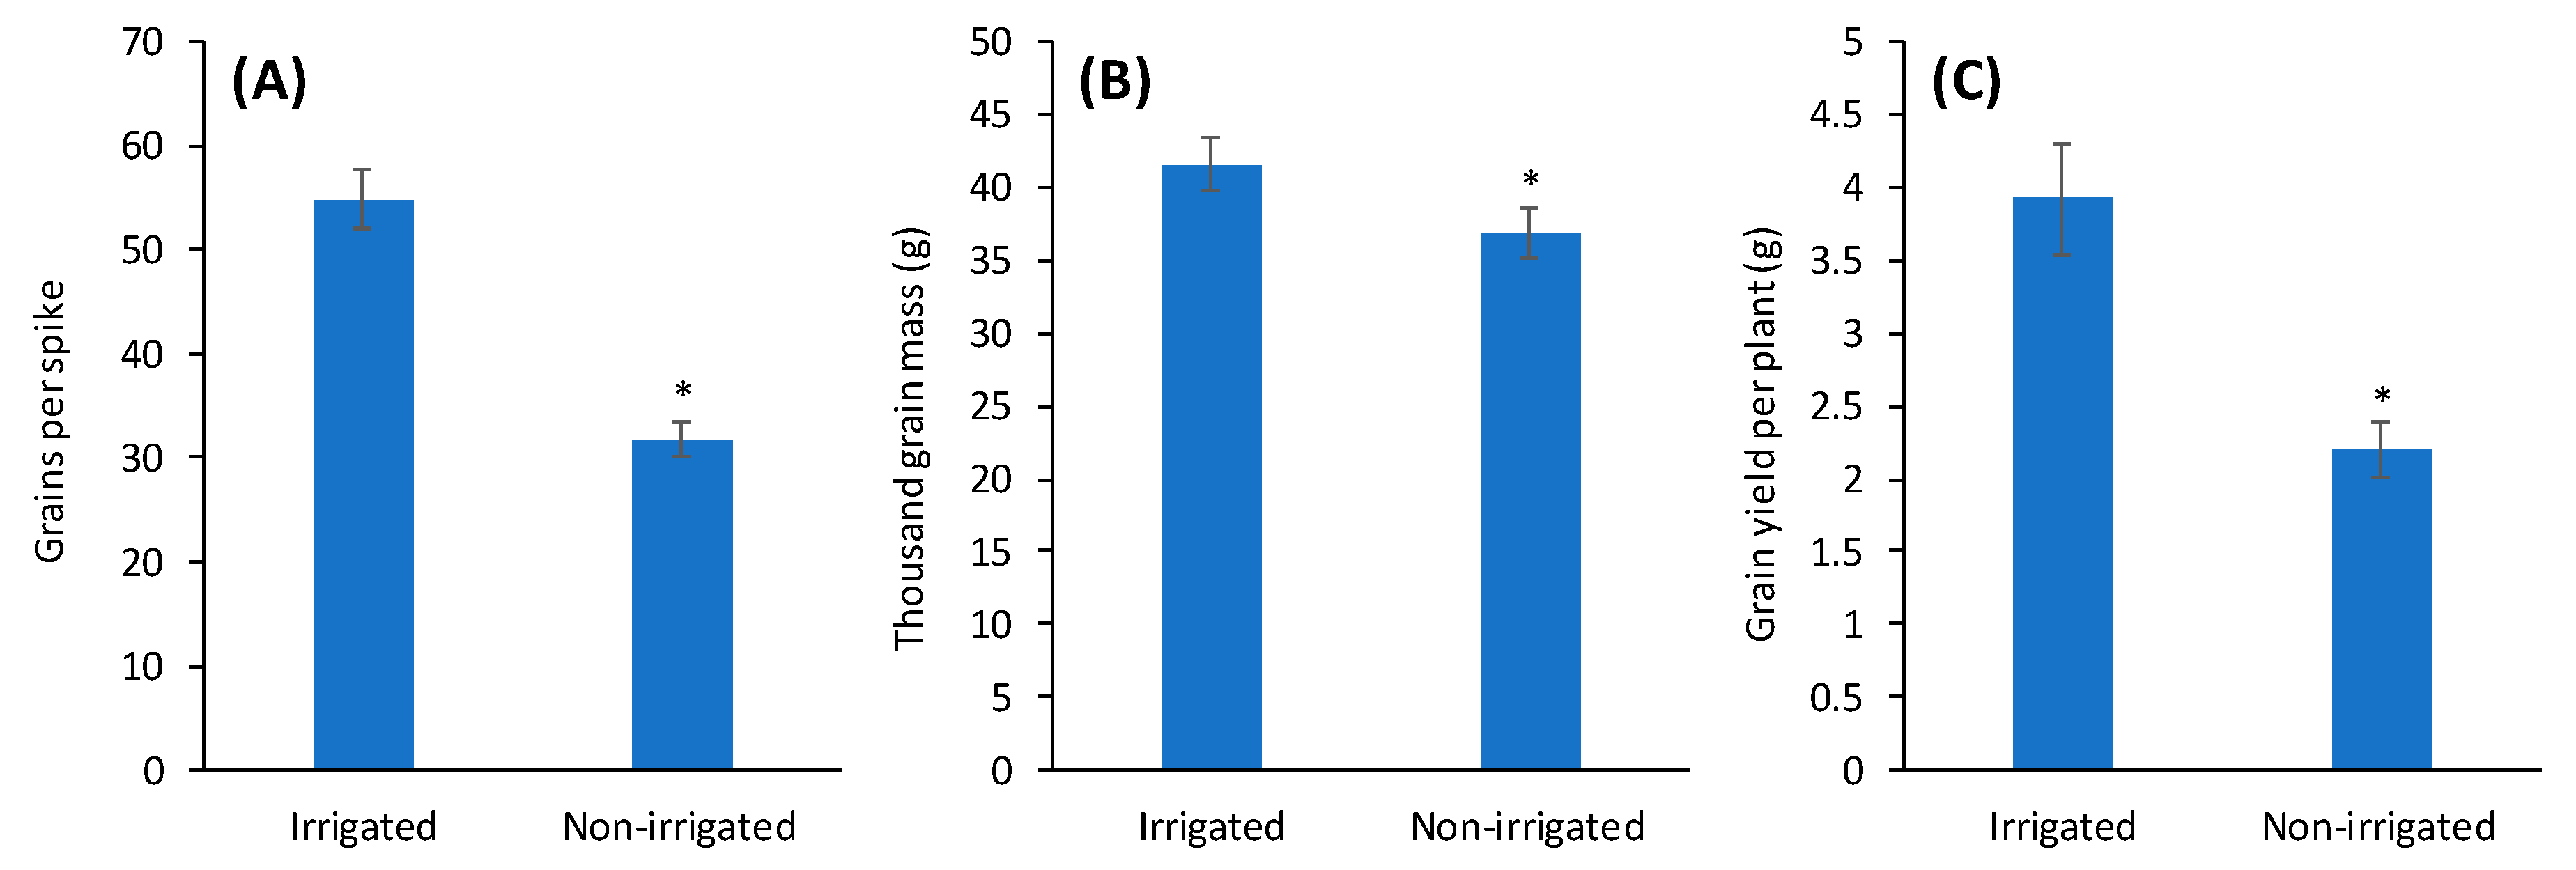
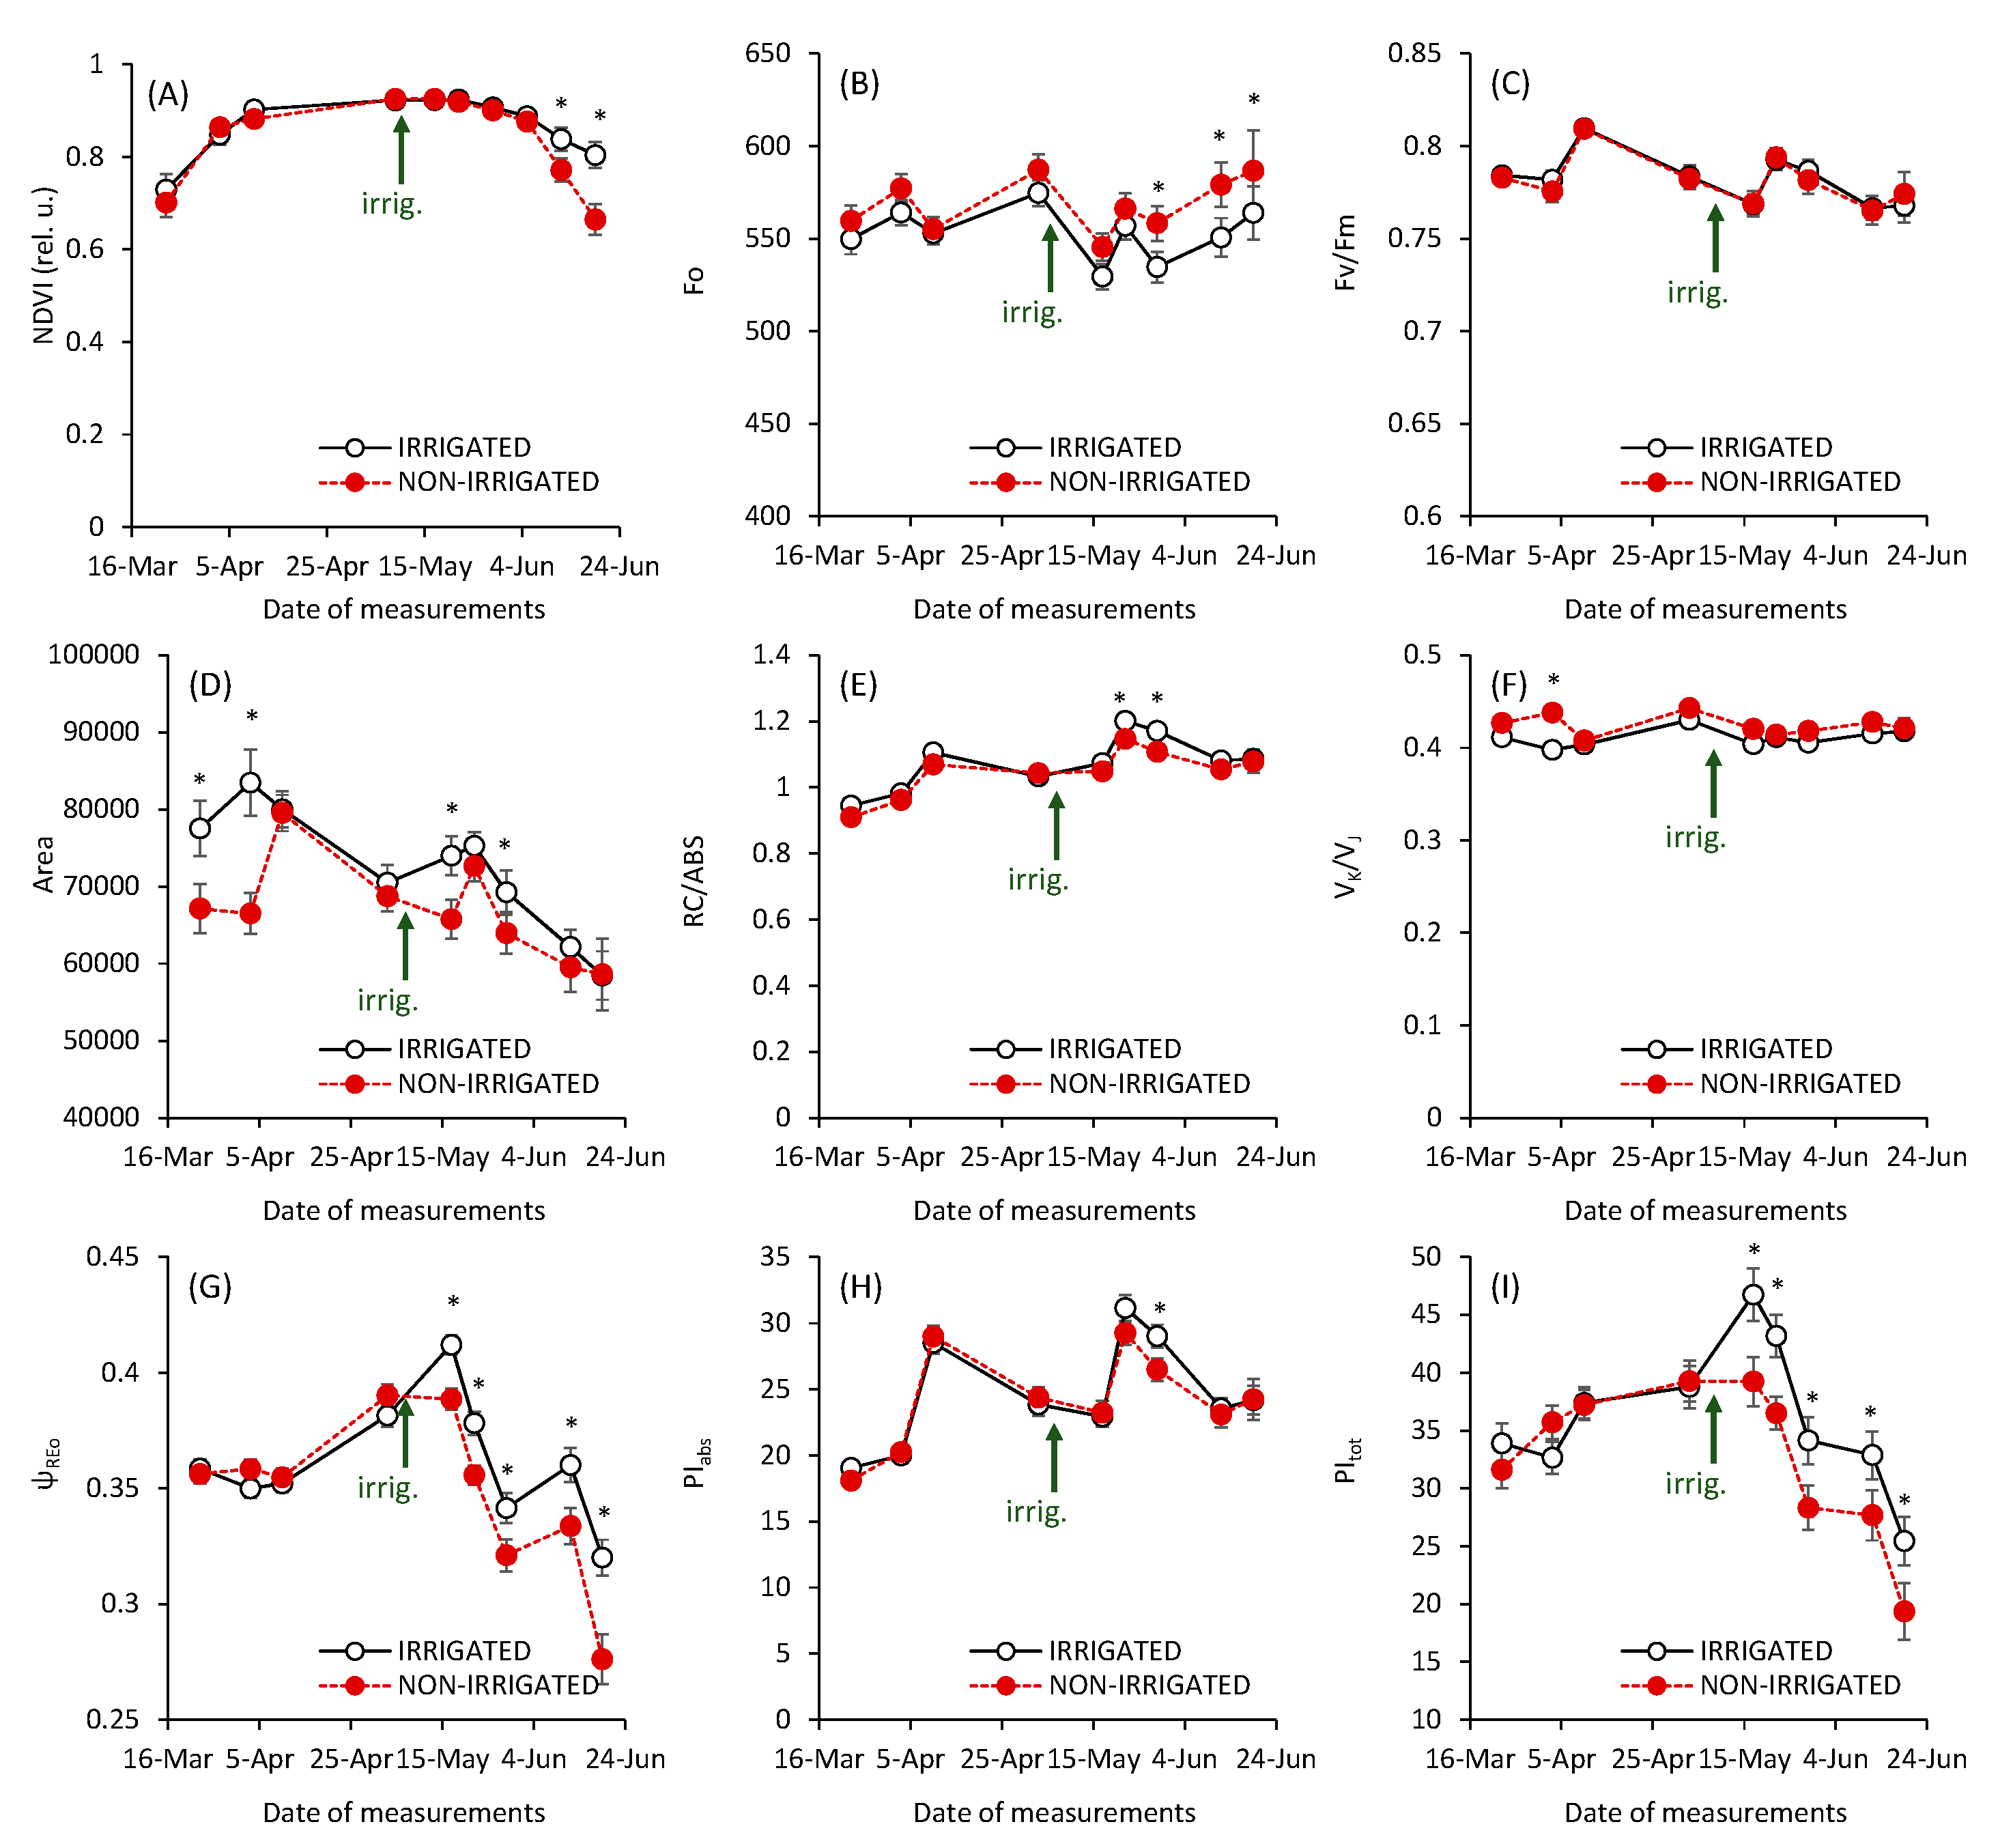
3. Results and Discussion

The relevance of drought is often underestimated for temperate climate regions of Central Europe, which is not generally characterized as a drought-prone region. However, water deficit frequently occurs, and drought is one of the most important climatic extremes, in terms of economic damage, along with its increasing trends associated with climate change [35,36]. A typical example was the season (Table 1) in which the presented study was performed, in which the autumn and winter period, with moderate water deficit, was followed by a dry and warm spring (partly alleviated by the weather in April), leading to the onset of soil water deficit, as shown by the values of CMI drought index (Figure 1A). The onset of irrigation was immediately reflected in the values of the water band index (WBI; Figure 1B), which has been previously shown to be an indicator of dynamic changes in the water supply in plants [37,38,39]. The significant increase of WBI due to irrigation applied approximately four days before the measurements indicated that the non-irrigated plants had been subjected to a water deficit and, in turn, the plant water status of irrigated plants was significantly improved. On the other hand, the measurements of the light absorbance realized on the leaf and canopy level indicated that the water deficit was not associated with a decrease of the chlorophyll content in upper leaf levels, as shown by SPAD values (Figure 1C), and that the canopy structure was not significantly disturbed (Figure 1D), providing a full leaf cover in water-deficient plots comparable to that in the irrigated variant, except during very late growth stages. This indicates that the plants were exposed to a slowly progressing moderate drought stress, which is typically associated with the absence of chlorophyll depletion [40] and, mostly, stomatal limitation of photosynthesis [41].
On the other hand, the analyses of yield components after the harvest (Figure 2) indicated a decrease of grain yield by almost 50% on average.
This indicates that, despite the moderate symptoms, the drought stress experienced was significant, which can be associated with a high economic impact. As the irrigation was initiated in a period when the number of plants and spikes were similar in both variants, the yield decrease was caused mostly by the decrease of grain number and grain weight (which was, however, less affected). The observed effects of the progressive moderate drought on yield components were fully in accordance with the results of other studies [42,43,44]. Based on the results presented above, we can conclude that we observed a drought stress scenario very typical for the temperate climate of Central Europe [36], with significant yield loss but without severe physiological symptoms observed at the leaf or canopy level. In such conditions, the assessment of simple traits such as leaf chlorophyll content or visual scoring may be insufficient in the breeding process. Therefore, there is an urgent need for fast and reliable methods to recognize the physiological effects of drought stress in a collection of genotypes in the field.
As a reference, we tested the trends of the NDVI parameter (Figure 3A).
This parameter represents the main and most frequently used spectral reflectance indicator, with broad application in both remote and proximal sensing [45]. However, the NDVI values followed the trends observed in leaf chlorophyll or canopy absorbance and significant effects under irrigation were observed only in the very late growth stage of the wheat, which may reflect the early onset of leaf senescence in water-limited plants.
The delayed response of NDVI to the onset of drought has been demonstrated in different species, as reported by several authors [46,47,48]. For example, Liu et al. [48] reported the delay of NDVI response by 18–20 days in grasses. This was in accordance with our study, in which the NDVI parameter was not suitable to detect the early effects of irrigation and differences between the irrigated and non-irrigated variants under the current drought stress scenario.
The second and the main method tested in our experiments was the analysis of fast fluorescence kinetics with analysis of the fluorescence transient using the model of Strasser [32,49]. Unlike the spectral reflectance, the fluorescence transient reflects the dynamic changes in the structure and functions of PSII photochemistry [50]; thus, providing completely different information, compared to methods based on the leaf absorbance or reflectance.
The fluorescence emitted by the chlorophyll molecules of the PSII antenna can serve as an intrinsic probe of the process of performing the successive steps of excitation energy use. The different steps and phases of the chlorophyll a fluorescence rise (O–J, J–I, and I–P) can be linked with the efficiencies of electron transfer in PSII, PSI, and between the two photosystems [49].
Continuous measurement of fast fluorescence kinetics produces two types of parameters: (1) The universal parameters provided by other fluorescence techniques (e.g., the PAM technique), such as Fo, Fm, and Fv/Fm; and (2) model-specific parameters such as specific quantum yields, efficiencies, probability parameters, and performance indices [18]. Parameters such as Fv/Fm have been broadly used and proved to be sensitive to very severe drought [51] or whether the drought stress is accompanied with heat stress [52]. In our experiments, we observed some fluctuations in the Fv/Fm values, which were attributed to differences in the actual weather during measurements. On the other hand, a similar Fv/Fm was found in irrigated and non-irrigated variants. This is in accordance with the previous results, in which a very low sensitivity of the Fv/Fm parameter was found under moderate drought stress conditions [24,53]. The trend of the F0 parameter was slightly different. We observed a small, but consistent, increase of F0 in the drought-stressed variant. A significant but different trend was observed by Roostaei et al. [28], who observed a lower value in drought-stressed plants. As the fluorescence signal F0 may depend on the chlorophyll content, the decrease may be associated with a loss of chlorophyll as a result of the drought stress, which was not the case in our experiment. In turn, the higher values of F0 found in our study may be caused by a slower relaxation of basal fluorescence in drought-stressed plants, which is more typical of heat stress conditions [54].
The group of specific “JIP-test” parameters can be also divided into two groups: (1) parameters with a specific physiological meaning; and (2) integrative parameters, represented mostly by performance indices. The parameter area (Figure 3D), related to the total pool of electron carriers at the PSII acceptor side [49], was found to be quite sensitive to drought stress; however, we also identified differences between two variants before irrigation was applied, which indicates the high sensitivity of this parameter to various factors, which limits its use. A similar situation was also observed in the case of the parameter related to the number of reaction centers, RC/ABS (Figure 3E). Moreover, the differences between the two variants were relatively small.
The parameter VK/VJ reflects the functional state of the oxygen-evolving complex, where an increase of this parameter indicates the damage of a fraction of the oxygen evolving complex (OEC) [23,55]. However, as expected, we observed only a small fluctuation of this parameter, mostly non-significant differences between the irrigated and non-irrigated variants.
In case of biophysically well-defined parameters, the most significant effects of irrigation were found in ψREo, which represents the efficiency/probability with which a PSII-trapped electron is transferred to PSI acceptors [50]. This parameter is estimated as an amplitude of the I–P step and, in some works, has been denoted by ΔVI-P. The parameter has been found to be sensitive to ozone [56,57], nitrogen deficit [58], and low light [21,56], but also to water deficit [22,59] and combined heat and drought stress [60,61]. The response at the level of the I–P step under irrigation was clearly evident (Figure 3G) and seems to be a specific stress-related response. Based on our previous results, the I–P step can be interpreted as the relative size of the pools of final PSI electron acceptors [62] and the change in I–P amplitude can be associated with the partitioning of part of PSI RCs into the cyclic electron flow, as an acclimation response to drought stress [21].
Performance indices are proposed to combine information on the status and activity of PSII and the efficiencies of specific electron transport reactions in the thylakoid membrane during the O–J–I–P rise, altogether providing a sensitive tool containing useful information beyond that provided by Fv/Fm, which has been broadly used to assess the effects of stress [63]. Most frequently used is the performance index calculated on absorption basis (PIabs), combining information on the number of reaction centers, efficiency of energy trapping, and electron transport from PSII to the plastoquinone pool [32]. More recently, the total performance index has been introduced [64], which contains also the efficiency with which an electron from the plastoquinone pool is transferred to the final PSI acceptors.
This study confirmed that PItot and PIabs are very sensitive indicators of the physiological status of wheat under field conditions; however, the effect of drought stress was much more significant in case of the total performance index (PItot). The changes that occurred in both performance indices may be interpreted as evidence for the considerable modulation of PSII function during the season; however, in our specific drought stress scenario, limitation of the electron transport chain at the PSI level represented the main effects determining the statistical significance of the differences in PItot between non-irrigated and irrigated variants. The idea to preferably use PItot was also proposed by Stirbet et al. [63], as this parameter is related to the function of the “whole” linear electron transport, whereas PIabs is related only to electron transport to the plastoquinone (PQ) pool. Moreover, it has been shown that PItot is less sensitive to diurnal changes and mid-day depression, compared to PIabs [21], which is important for practical applications, as the field measurements of a high number of genotypes can hardly be done within a narrow time window.
Considering the possible practical applications of the method, in addition to the sensitivity of response of the parameters, the differences in responses of individual genotypes need to be recognized. As the presentation of the values of multiple parameters in numerous genotypes and individual dates would be difficult and inefficient here, we address these issues through a summary statistical analysis of the significance of the factor genotype, in addition to analysis of the treatment effects (Table 3).
We also tested the interactions between the genotypes and treatment (irrigation). In the first step, the analysis was focused on the statistical significance of the differences between the two blocks in the period before the irrigation was initiated, in which no difference was expected. However, as blocks in the field are never completely identical, we found some significant effects in the parameters AREA and RC/ABS. This indicates that these parameters are very sensitive to minor side effects, which are difficult to explain. The sensitivity of these parameters to various environmental factors has been previously identified, including sensitivity to minor diurnal or developmental changes [18,22,26]. It has also been found that the number of active reaction centers (RC/ABS) changes during leaf development [65]. Similarly, a large seasonal variation in the fluorescence transient, with an apparent effect on the area above the fluorescence curve (indicated by the parameter AREA) has been found in cereal crop species [66]. In some other parameters (e.g., Fv/Fm and Vk/VJ), developmental variation was found only under conditions of severe leaf senescence [67]. We could only guess that there were coincidences in the minor factors (e.g., microclimate, soil temperature, and so on) which led to the slightly faster development of new leaves in one of the blocks in early spring, which was then detected by the sensitive fluorescence parameters (i.e., RC/ABS and AREA) during the early spring measurements. Such sensitivity is not desirable and hence, the suitability of these overly sensitive parameters for the assessment of drought effects in the next period was considered limited.
The second two-way analysis of variance assessed the significance of the factor “irrigation” and “genotype” in the period of three weeks after irrigation was initiated; that is, we assessed the statistical significance of the early effects. The statistical significance of the differences between two variants in three measurement cycles after irrigation were initiated by identifying the significant results in five parameters (PItot, ψREo, F0, AREA, and RC/ABS), whereas we did not find any statistical significance in three parameters (PIabs, Fv/Fm, and NDVI); in these parameters; therefore, we did not assess the effect of genotype and interaction.
As all the parameters were assessed in the same design and number of repetitions, we could also compare the power of the factors and interactions by comparing the F values. Although all presented effects in the five parameters were statistically significant, the power of the factors was not the same. We expect that a suitable parameter should be sensitive to drought/irrigation and able to recognize differences between the genotypes. A high interaction level for the parameter is also very convenient, as it means that the genotype differences in response to drought are shown by the values of this parameter. In this respect, the best values were found in the PItot and AREA parameters. However, the significant difference found in the period before irrigation excluded the parameter AREA. A high F-value for interaction between the factor genotype and irrigation indicated that the patterns of AREA and, especially, PItot were not fully identical but, in some genotypes, the differences were higher than in others. In the parameter F0, we identified a high F-value for the factors irrigation and genotype; however, the interaction was only moderate. This may be associated with the relatively low variation of F0 values between the variants observed in our study. Similarly, a low relative variation between the variants, together with the high variation between the dates observed in ψREo, might provide a reason for the lower F-values found in this parameter.
Thus, our statistical examination confirmed that the analysis of fast fluorescence kinetics may be used to recognize the early effects of moderate drought stress and irrigation on the photosynthetic apparatus of wheat. The integrative parameter performance index, PItot, was identified as the most suitable parameter for the comparison of genotype-related differences in drought response.

4. Conclusions

Analyses of the time-series of non-invasive measurements obtained in a dry season within a representative collection of wheat genotypes grown in small-plot field trials in non-irrigated and irrigated variants showed that, despite a progressive water deficit and significant yield loss, the measurements of leaf and canopy absorbance showed very minor changes in chlorophyll content or canopy structure in the non-irrigated variant, compared to the irrigated variant. This corresponded well to the insignificant differences in spectral reflectance NDVI values. On the other hand, we identified the significant and rapid response of fast fluorescence kinetics indicators following the onset of irrigation. Analysis of multiple fluorescence parameters indicated that the main effects of drought/irrigation were associated with changes in amplitude of the I–P phase in the OJIP transient, which documents the main changes of the linear electron transport chain at the level of photosystem I and beyond. The statistical analyses identified the integrative parameter performance index PItot, containing the information on the I–P amplitude as the most sensitive parameter, as well-reflecting the differences in responses of the considered genotypes to water deficit, which was not the case when using conventional parameters (e.g., Fv/Fm) or many kinetic parameters. Our results demonstrated that focusing on photosynthetic functions, as detected by rapid chlorophyll fluorescence records, can provide more accurate information on the drought stress level, compared to the structural data obtained by absorbance or reflectance measurements.

Author Contributions

Conceptualization, M.B. and M.Z.; methodology, M.Z., V.B. and A.H.; validation, M.B., P.H., and O.S.; formal analysis, L.B. and M.Z.; investigation, L.B., E.C. and A.H.; resources, M.B., V.B. and P.H.; data curation, L.B.; writing—original draft preparation, L.B. and M.Z.; writing—review and editing, O.S. and M.B.; visualization, M.Z.; supervision, M.Z. and M.B.; project administration, M.Z., V.B. and M.B.; and funding acquisition, M.B. All authors have read and agreed to the published version of the manuscript.

Funding

This work was supported by the Ministry of Education, Science, Research, and Sport of the Slovak Republic under the projects VEGA-1- 0589-19 and VEGA 1-0683-20 and the Slovak Research and Development Agency project APVV-18-465 and APVV-15-0562. This work has also received funding from the European Union‘s research and innovation programme H2020 under grant agreement No. 771367 and project OPVaI-VA/DP/2018/No. 313011T813.

Conflicts of Interest

The authors declare no conflict of interest.

References

  1. Fujimori, S.; Iizumi, T.; Hasegawa, T.; Takakura, J.Y.; Takahashi, K.; Hijioka, Y. Macroeconomic Impacts of Climate Change Driven by Changes in Crop Yields. Sustainability 2018, 10, 3673. [Google Scholar] [CrossRef] [Green Version]
  2. Nelson, G.C.; Valin, H.; Sands, R.D.; Havlik, P.; Ahammad, H.; Deryng, D.; Elliott, J.; Fujimori, S.; Hasegawa, T.; Heyhoe, E.; et al. Climate change effects on agriculture: Economic responses to biophysical shocks. Proc. Natl. Acad. Sci. USA 2014, 111, 3274–3279. [Google Scholar] [CrossRef] [Green Version]
  3. Carvalho, F.P. Agriculture, pesticides, food security and food safety. Environ. Sci. Policy 2006, 9, 685–692. [Google Scholar] [CrossRef]
  4. Tester, M.; Langridge, P. Breeding Technologies to Increase Crop Production in a Changing World. Science 2010, 327, 818–822. [Google Scholar] [CrossRef]
  5. Förch, W.; Kristjanson, P.; Cramer, L.; Barahona, C.; Thornton, P.K. Back to baselines: Measuring change and sharing data. Agric. Food Secur. 2014, 3, 13. [Google Scholar] [CrossRef] [Green Version]
  6. Eckardt, N.A.; Cominelli, E.; Galbiati, M.; Tonelli, C. The Future of Science: Food and Water for Life. Plant Cell 2009, 21, 368–372. [Google Scholar] [CrossRef]
  7. Godfray, H.C.J.; Crute, I.R.; Haddad, L.; Lawrence, D.; Muir, J.F.; Nisbett, N.; Pretty, J.; Robinson, S.; Toulmin, C.; Whiteley, R. The future of the global food system. Philos. Trans. R. Soc. B Biol. Sci. 2010, 365, 2769–2777. [Google Scholar] [CrossRef] [Green Version]
  8. Podlich, D.W.; Winkler, C.R.; Cooper, M. Mapping As You Go. Crop. Sci. 2004, 44, 1560–1571. [Google Scholar] [CrossRef] [Green Version]
  9. Govindaraj, M.; Vetriventhan, M.; Srinivasan, M. Importance of Genetic Diversity Assessment in Crop Plants and Its Recent Advances: An Overview of Its Analytical Perspectives. Genet. Res. Int. 2015, 2015, 1–14. [Google Scholar] [CrossRef] [Green Version]
  10. Araus, J.L.; Kefauver, S.C.; Zaman-Allah, M.; Olsen, M.S.; Cairns, J.E. Translating High-Throughput Phenotyping into Genetic Gain. Trends Plant Sci. 2018, 23, 451–466. [Google Scholar] [CrossRef] [Green Version]
  11. Prasanna, B.M.; Araus, J.L.; Crossa, J.; Cairns, J.E.; Palacios, N.; Mahuku, G.; Das, B.; Magorokosho, C. High-throughput and precision phenotyping in cereal breeding programs. In Cereal Genomics-II; Gupta, P.K., Varshney, R.K., Eds.; Springer: Dordrecht, The Netherlands, 2012; pp. 341–374. [Google Scholar]
  12. Xu, Y. Envirotyping for deciphering environmental impacts on crop plants. Theor. Appl. Genet. 2016, 129, 653–673. [Google Scholar] [CrossRef] [PubMed] [Green Version]
  13. Basu, S.; Ramegowda, V.; Kumar, A.; Pereira, A. Plant adaptation to drought stress. F1000Research 2016, 5, 1554. [Google Scholar] [CrossRef] [PubMed]
  14. Singh, A.; Ganapathysubramanian, B.; Singh, A.K.; Sarkar, S. Machine Learning for High-Throughput Stress Phenotyping in Plants. Trends Plant Sci. 2016, 21, 110–124. [Google Scholar] [CrossRef] [PubMed] [Green Version]
  15. Maxwell, K.; Johnson, G.N. Chlorophyll fluorescence—A practical guide. J. Exp. Bot. 2000, 51, 659–668. [Google Scholar] [CrossRef] [PubMed]
  16. Murchie, E.H.; Lawson, T. Chlorophyll fluorescence analysis: A guide to good practice and understanding some new applications. J. Exp. Bot. 2013, 64, 3983–3998. [Google Scholar] [CrossRef] [Green Version]
  17. Cen, H.; Weng, H.; Yao, J.; He, M.; Lv, J.; Hua, S.; Li, H.; He, Y. Chlorophyll Fluorescence Imaging Uncovers Photosynthetic Fingerprint of Citrus Huanglongbing. Front. Plant Sci. 2017, 8, 8. [Google Scholar] [CrossRef] [Green Version]
  18. Kalaji, H.M.; Rastogi, A.; Zivcak, M.; Brestic, M.; Daszkowska-Golec, A.; Sitko, K.; Alsharafa, K.Y.; Lotfi, R.; Stypinski, P.; Samborska, I.A.; et al. Prompt chlorophyll fluorescence as a tool for crop phenotyping: An example of barley landraces exposed to various abiotic stress factors. Photosynthetica 2018, 56, 953–961. [Google Scholar] [CrossRef] [Green Version]
  19. Shewry, P.R.; Hey, S.J. The contribution of wheat to human diet and health. Food Energy Secur. 2015, 4, 178–202. [Google Scholar] [CrossRef]
  20. Brestic, M.; Zivcak, M.; Hauptvogel, P.; Misheva, S.; Kocheva, K.; Yang, X.; Li, X.; Allakhverdiev, S.I. Wheat plant selection for high yields entailed improvement of leaf anatomical and biochemical traits including tolerance to non-optimal temperature conditions. Photosynth. Res. 2018, 136, 245–255. [Google Scholar] [CrossRef]
  21. Zivcak, M.; Kalaji, H.M.; Shao, H.-B.; Olsovska, K.; Brestic, M. Photosynthetic proton and electron transport in wheat leaves under prolonged moderate drought stress. J. Photochem. Photobiol. B Biol. 2014, 137, 107–115. [Google Scholar] [CrossRef]
  22. Zivcak, M.; Olsovska, K.; Slamka, P.; Galambošová, J.; Rataj, V.; Shao, H.B.; Brestic, M. Application of chlorophyll fluorescence performance indices to assess the wheat photosynthetic functions influenced by nitrogen deficiency. Plant Soil Environ. 2014, 60, 210–215. [Google Scholar] [CrossRef] [Green Version]
  23. Brestic, M.; Zivcak, M.; Kalaji, H.M.; Carpentier, R.; Allakhverdiev, S.I. Photosystem II thermostability in situ: Environmentally induced acclimation and genotype-specific reactions in Triticum aestivum L. Plant Physiol. Biochem. 2012, 57, 93–105. [Google Scholar] [CrossRef] [PubMed]
  24. Zivcak, M.; Brestic, M.; Olsovska, K.; Slamka, P. Performance index as a sensitive indicator of water stress in Triticum aestivum L. Plant Soil Environ. 2008, 54, 133–139. [Google Scholar] [CrossRef] [Green Version]
  25. Rastogi, A.; Kovar, M.; He, X.; Zivcak, M.; Kataria, S.; Kalaji, H.M.; Skalicky, M.; Ibrahimova, U.F.; Hussain, S.; Mbarki, S.; et al. Special issue in honour of Prof. Reto J. Strasser—JIP-test as a tool to identify salinity tolerance in sweet sorghum genotypes. Photosynthetica 2020, 58, 518–528. [Google Scholar] [CrossRef] [Green Version]
  26. Faseela, P.; Sinisha, A.K.; Brestic, M.; Puthur, J. Special issue in honour of Prof. Reto J. Strasser—Chlorophyll a fluorescence parameters as indicators of a particular abiotic stress in rice. Photosynthetica 2020, 58, 293–300. [Google Scholar] [CrossRef] [Green Version]
  27. Badr, A.; Bruggemann, W. Special issue in honour of Prof. Reto J. Strasser—Comparative analysis of drought stress response of maize genotypes using chlorophyll fluorescence measurements and leaf relative water content. Photosynthetica 2020, 58, 638–645. [Google Scholar] [CrossRef] [Green Version]
  28. Roostaei, M.; Mohammadi, S.A.; Amri, A.; Majidi, E.; Nachit, M.; Haghparast, R. Chlorophyll fluorescence parameters and drought tolerance in a mapping population of winter bread wheat in the highlands of Iran. Russ. J. Plant Physiol. 2011, 58, 351–358. [Google Scholar] [CrossRef]
  29. Chaichi, M.; Sanjarian, F.; Razavi, K.; Gonzalez-Hernandez, J.L. Phenotypic diversity among Iranian bread wheat landraces, as a screening tool for drought tolerance. Acta Physiol. Plant. 2019, 41, 90. [Google Scholar] [CrossRef]
  30. Palmer, W.C. Meteorologic Drought; Weather Bureau, Research Paper No. 45; US Department of Commerce, Weather Bureau: Washington, DC, USA, 1965.
  31. Strasser, R.J.; Srivastava, A.; Govindjee, G. Polyphasic chlorophyll a fluorescence transient inplants and cyanobacteria. Photochem. Photobiol. 1995, 61, 32–42. [Google Scholar] [CrossRef]
  32. Strasser, R.J.; Srivastava, A.; Tsimilli-Michael, M. The fluorescence transient as a tool to characterize and screen photosynthetic samples. In Probing Photosynthesis: Mechanism, Regulation & Adaptation; Yunus, M., Pathre, U., Eds.; Taylor & Francis: London, UK, 2000; pp. 443–480. [Google Scholar]
  33. Rouse, J.W.; Haas, R.H.; Shell, J.A.; Deering, D.W. Monitoring Vegetation Systems in the Great Plains with ERTS; NASA Scientific and Technical Information Office: Washington, DC, USA, 1974.
  34. Peñuelas, J.; Filella, I.; Biel, C.; Serrano, L.; Save, R. The reflectance at the 950–970 nm region as an indicator of plant water status. Int. J. Remote Sens. 1993, 14, 1887–1905. [Google Scholar] [CrossRef]
  35. Hlavinka, P.; Trnka, M.; Semerádová, D.; Dubrovský, M.; Zalud, Z.; Možný, M. Effect of drought on yield variability of key crops in Czech Republic. Agric. For. Meteorol. 2009, 149, 431–442. [Google Scholar] [CrossRef]
  36. Hänsel, S.; Ustrnul, Z.; Łupikasza, E.; Skalák, P. Assessing seasonal drought variations and trends over Central Europe. Adv. Water Resour. 2019, 127, 53–75. [Google Scholar] [CrossRef]
  37. Pu, R.; Ge, S.; Kelly, N.M.; Gong, P. Spectral absorption features as indicators of water status in coast live oak (Quercus agrifolia) leaves. Int. J. Remote Sens. 2003, 24, 1799–1810. [Google Scholar] [CrossRef]
  38. Claudio, H.C.; Cheng, Y.; Fuentes, D.A.; Gamon, J.A.; Luo, H.; Oechel, W.; Qiu, H.L.; Rahman, A.F.; Sims, D. Monitoring drought effects on vegetation water content and fluxes in chaparral with the 970 nm water band index. Remote Sens. Environ. 2006, 103, 304–311. [Google Scholar] [CrossRef]
  39. Ranjan, R.; Sahoo, R.N.; Chopra, U.K.; Pramanik, M.; Singh, A.K.; Pradhan, S. Assessment of Water Status in Wheat (Triticum aestivum L.) Using Ground Based Hyperspectral Reflectance. Proc. Natl. Acad. Sci. India Sect. B Biol. Sci. 2017, 87, 377–388. [Google Scholar] [CrossRef]
  40. Hailemichael, G.; Catalina, A.; González, M.R.; Martin, P. Relationships between Water Status, Leaf Chlorophyll Content and Photosynthetic Performance in Tempranillo Vineyards. S. Afr. J. Enol. Vitic. 2016, 37, 149–156. [Google Scholar] [CrossRef]
  41. Zivcak, M.; Brestic, M.; Balatova, Z.; Drevenakova, P.; Olsovska, K.; Kalaji, H.M.; Yang, X.; Allakhverdiev, S.I. Photosynthetic electron transport and specific photoprotective responses in wheat leaves under drought stress. Photosynth. Res. 2013, 117, 529–546. [Google Scholar] [CrossRef]
  42. Samarah, N.H. Effects of drought stress on growth and yield of barley. Agron. Sustain. Dev. 2005, 25, 145–149. [Google Scholar] [CrossRef] [Green Version]
  43. Kaur, V.; Behl, R.K. Grain yield in wheat as affected by short periods of high temperature, drought and their interaction during pre- and post-anthesis stages. Cereal Res. Commun. 2010, 38, 514–520. [Google Scholar] [CrossRef]
  44. Ahmed, N.; Chowdhry, M.A.; Khaliq, I.; Maekawa, M. The inheritance of yield and yield components of five wheat hybrid populations under drought conditions. Indones. J. Agric. Sci. 2016, 8, 53–59. [Google Scholar] [CrossRef] [Green Version]
  45. Hassan, M.A.; Yang, M.; Rasheed, A.; Yang, G.; Reynolds, M.; Xia, X.; Xiao, Y.; He, Z. A rapid monitoring of NDVI across the wheat growth cycle for grain yield prediction using a multi-spectral UAV platform. Plant Sci. 2018, 282, 95–103. [Google Scholar] [CrossRef] [PubMed]
  46. Jamali, S.; Seaquist, J.; Ardö, J.; Eklundh, L. Investigating temporal relationships between rainfall, soil moisture and MODIS-derived NDVI and EVI for six sites in Africa. Savanna 2011, 21, 38. [Google Scholar]
  47. Ahmed, M.; Else, B.; Eklundh, L.; Ardö, J.; Seaquist, J. Dynamic response of NDVI to soil moisture variations during different hydrological regimes in the Sahel region. Int. J. Remote Sens. 2017, 38, 5408–5429. [Google Scholar] [CrossRef]
  48. Liu, S.; Roberts, D.A.; Chadwick, O.A.; Still, C.J. Spectral responses to plant available soil moisture in a Californian grassland. Int. J. Appl. Earth Obs. Geoinf. 2012, 19, 31–44. [Google Scholar] [CrossRef]
  49. Strasser, R.J.; Tsimilli-Michael, M.; Srivastava, A. Analysis of the Chlorophyll a Fluorescence Transient. In Low-Oxygen Stress in Plants; Springer Science and Business Media LLC: Basel, Switzerland, 2004; Volume 19, pp. 321–362. [Google Scholar]
  50. Stirbet, A. Govindjee on the relation between the Kautsky effect (chlorophyll a fluorescence induction) and Photosystem II: Basics and applications of the OJIP fluorescence transient. J. Photochem. Photobiol. B Biol. 2011, 104, 236–257. [Google Scholar] [CrossRef]
  51. Zlatev, Z.S. Drought-Induced Changes in Chlorophyll Fluorescence of Young Wheat Plants. Biotechnol. Biotechnol. Equip. 2009, 23, 438–441. [Google Scholar] [CrossRef] [Green Version]
  52. Wang, G.P.; Li, F.; Zhang, J.; Zhao, M.R.; Hui, Z.; Wang, W. Overaccumulation of glycine betaine enhances tolerance of the photosynthetic apparatus to drought and heat stress in wheat. Photosynthetica 2010, 48, 30–41. [Google Scholar] [CrossRef]
  53. Li, G.L.; Wu, H.X.; Sun, Y.Q.; Zhang, S.Y. Response of chlorophyll fluorescence parameters to drought stress in sugar beet seedlings. Russ. J. Plant Physiol. 2013, 60, 337–342. [Google Scholar] [CrossRef]
  54. Brestic, M.; Zivcak, M.; Kunderlikova, K.; Sytar, O.; Shao, H.; Kalaji, H.M.; Allakhverdiev, S.I. Low PSI content limits the photoprotection of PSI and PSII in early growth stages of chlorophyll b-deficient wheat mutant lines. Photosynth. Res. 2015, 125, 151–166. [Google Scholar] [CrossRef]
  55. Srivastava, A.; Guissé, B.; Greppin, H.; Strasser, R.J. Regulation of antenna structure and electron transport in PSII of Pisum sativum under elevated temperature probed by the fast polyphasic chlorophyll a fluorescence transient: OKJIP. Biochim. Biophys. 1997, 1320, 95–106. [Google Scholar] [CrossRef] [Green Version]
  56. Cascio, C.; Schaub, M.; Novak, K.; Desotgiu, R.; Bussotti, F.; Strasser, R.J. Foliar responses to ozone of Fagus sylvatica L. seedlings grown in shaded and in full sunlight conditions. Environ. Exp. Bot. 2010, 68, 188–197. [Google Scholar] [CrossRef]
  57. Bussotti, F.; Nali, C.; Lorenzini, G. Chlorophyll fluorescence: From theory to (good) practice. An introduction. Environ. Exp. Bot. 2011, 73, 1–2. [Google Scholar] [CrossRef]
  58. Nikiforou, C.; Manetas, Y. Inherent nitrogen deficiency in Pistacia lentiscus preferentially affects photosystem I: A seasonal field study. Funct. Plant Biol. 2011, 38, 848–855. [Google Scholar] [CrossRef]
  59. Pollastrini, M.; Desotgiu, R.; Cascio, C.; Bussotti, F.; Cherubini, P.; Saurer, M.; Gerosa, G.; Marzuoli, R. Growth and physiological responses to ozone and mild drought stress of tree species with different ecological requirements. Trees 2010, 24, 695–704. [Google Scholar] [CrossRef]
  60. Pšidová, E.; Zivcak, M.; Stojnić, S.; Orlović, S.; Gömöry, D.; Kučerová, J.; Ditmarová, Ľ.; Střelcová, K.; Brestic, M.; Kalaji, H.M. Altitude of origin influences the responses of PSII photochemistry to heat waves in European beech (Fagus sylvatica L.). Environ. Exp. Bot. 2018, 152, 97–106. [Google Scholar] [CrossRef]
  61. Pollastrini, M.; Salvatori, E.; Fusaro, L.; Manes, F.; Marzuoli, R.; Gerosa, G.; Brüggemann, W.; Strasser, R.J.; Bussotti, F. Selection of tree species for forests under climate change: Is PSI functioning a better predictor for net photosynthesis and growth than PSII? Tree Physiol. 2020, tpaa084. [Google Scholar] [CrossRef]
  62. Zivcak, M.; Brestic, M.; Kunderlikova, K.; Olsovska, K.; Allakhverdiev, S.I. Effect of photosystem I inactivation on chlorophyll a fluorescence induction in wheat leaves: Does activity of photosystem I play any role in OJIP rise? J. Photochem. Photobiol. B Biol. 2015, 152, 318–324. [Google Scholar] [CrossRef]
  63. Stirbet, A.; Lazár, D.; Kromdijk, J.; Govindjee, G. Chlorophyll a fluorescence induction: Can just a one-second measurement be used to quantify abiotic stress responses? Photosynthetica 2018, 56, 86–104. [Google Scholar] [CrossRef]
  64. Tsimilli-Michael, M.; Strasser, R.J. In vivo Assessment of Stress Impact on Plant’s Vitality: Applications in Detecting and Evaluating the Beneficial Role of Mycorrhization on Host Plants. In Mycorrhiza; Springer: Berlin/Heidelberg, Germany, 2008; pp. 679–703. [Google Scholar]
  65. Zhu, Y.; Yu, L.; Fan, J.; Ruan, Y.; Cui, Z.; Hu, K.; Zhang, F. Characteristics of chlorophyll fluorescence parameters of leaves during leaf elongation of maize seedling. J. Henan Agric. Sci. 2011, 40, 36–42. [Google Scholar]
  66. Begovic, L.; Galic, V.; Abicic, I.; Loncaric, Z.; Lalic, A.; Mlinaric, S. Implications of intra-seasonal climate variations on chlorophyll a fluorescence and biomass in winter barley breeding program. Photosynthetica 2020, 58, 995–1008. [Google Scholar] [CrossRef]
  67. Wang, Y.W.; Xu, C.; Lv, C.F.; Wu, M.; Cai, X.J.; Liu, Z.T.; Song, X.M.; Chen, G.; Lv, C.G. Chlorophyll a fluorescence analysis of high-yield rice (Oryza sativa L.) LYPJ during leaf senescence. Photosynthetica 2016, 54, 422–429. [Google Scholar] [CrossRef]
Figure 1. (A) Crop moisture index (CMI) drought index for non-irrigated variant, based on weather and soil observations during the spring vegetation period of wheat; (BD) The trends of the indicators of the plant and canopy status measured at the leaf and canopy level during the spring vegetation season of wheat: (B) Water Band Index; (C) Leaf chlorophyll SPAD; and (D) light absorbance. The parameters were calculated using the records measured in wheat leaves in two variants of irrigation. The points represent the mean values ± standard error of 25 genotypes, 10 individuals per genotype (n = 250). An asterisk indicates significant differences between non-irrigated and irrigated variants (Tukey HSD post hoc tests, p < 0.05).
Agronomy 10 01275 g001
Figure 2. Mean values of studied yield traits for irrigated and non-irrigated variants: (A) Average number of grains per spike; (B) thousand grain mass; and (C) grain yield per plant. The mean values ± standard error of 25 genotypes, 4 repetitions per genotype (n = 100) are presented. An asterisk indicates significant differences between non-irrigated and irrigated variants (Tukey HSD post hoc tests, p < 0.05).
Agronomy 10 01275 g002
Figure 3. Parameters based on spectral reflectance and chlorophyll fluorescence records in wheat grown in field in two variants differing in water supply: (A) Normalized Difference Vegetation Index (NDVI); (B) Minimum fluorescence from dark-adapted leaf (F0); (C) Maximum quantum yield of primary photochemistry of photosystem II (Fv/Fm); (D) Proportion of QB-non-reducing PSII center (Area); (E) The number of reaction centers per absorbed light unit (RC/ABS); (F) Relative variable fluorescence in K-step (VK/VJ); (G) Probability with which the electron trapped by PSII will reach the secondary quinone electron acceptor QBETo); (H) Performance index on absorption basis (PIABS); and (I) Total performance index (PITOT). Days of the season are characterized on the x-axis; the period of initiation of irrigation is indicated. The points represent the mean values ± standard error of 25 genotypes, 10 individuals per genotype (n = 250). An asterisk indicates significant differences between non-irrigated and irrigated variants (Tukey HSD post hoc test, p < 0.05).
Agronomy 10 01275 g003
Table 1. Average monthly total precipitation (mm) and air temperature (°C) measured in location (Piešťany) in individual months of the growing season and the period 1951–2000 (long-term mean).
IXXXIXIIIIIIIIIVVVIIII-VI
Rainfall (mm)1951–200045424846303131415976207
Season39503415254919482720114
Difference−6+8−14−31−5+18−12+7−32−56−93 (−45%)
Temperature (°C)1951–200014.79.74.40.2−1.60.24.49.614.517.711.55
Season17.49.24.8−0.5−6.727.89.315.620.713.35
Difference+2.7−0.5+0.4−0.7−5.1+1.8+3.4−0.3+1.1+3+1.8
Table 2. Chlorophyll fluorescence parameters used in the study.
ParameterDefinitionFormula
Fo, Fm Minimum and maximum fluorescence intensity
FtFluorescence intensity in time t
MoInitial slope of the fluorescence curve
AreaArea between fluorescence curve and Fm
Fv/Fm = φPoMaximum quantum yield of PS II photochemistry Fv/Fm = (Fm – Fo)/Fm
VK, VJ, VIVariable fluorescence at time 0.3 ms (VK), 2 ms (VJ), and 30 ms (VI) Vt = (Ft – F0)/(Fm – F0)
VK/VJRelative variable fluorescence of K-step; an indicator of the damage of oxygen evolving complex in PSII
ψoProbability of electron transport from PSII RC to PSII acceptor side ψo = 1 – VJ
ψREo = ΔVI-PAmplitude of variable fluorescence in I-P phase; probability of electron transport from PSII acceptor side to the PSI electron acceptors ψREo = 1 – VI
RC/ABS Number of active PSII RCs per absorbed light RC/ABS = VJ × φPo × 1/Mo
PIabsPerformance Index on absorption base PIabs = (RC/ABS) × φPo/(1 – φPo) × (ψo/(1 – ψo)
PItotTotal performance index PItot = PIabs × (1 – VI)/(VI – VJ)
Table 3. Statistical assessment of the factor effects before and after irrigation was applied.
ParameterSignificance of Differences between the Variants (Irrigated vs. Non-irrigated)F Value of the Factor *
3 Weeks beforethe Start of Irrigation3 weeks after the Start of IrrigationIrrigationGenotypeInteraction (Irrigation x Genotype)
PItotns*** 53.48 21.59 8.77
ψREons***  13.1  11.1  3.4
Fons*** 62.4 21.4  2.5
AREA****** 65.3  18.2 10.2
RC/ABS******  12.7 24.5  7.5
PIabsnsns---
Fv/Fmnsns---
NDVInsns---
* The symbol *** indicates the statistical significance of the effect (p < 0.01); "ns" indicates a non-significant effect (p > 0.05). The color symbols represent the classification of the effects of the two factors and their interaction, based on the F-values (green circle = very high, orange triangle = high, and red rhombus = moderate effects). In all analyses in which the F-value of the factor is shown, the effect was significant with probability p < 0.01.

