Article

Evaluation of Cultivar Identification Performance Using Feature Expressions and Classification Algorithms on Optical Images of Sweet Corn Seeds

1
Academy of Contemporary Agriculture Engineering Innovations, Zhongkai University of Agriculture and Engineering, Guangzhou 510225, China
2
College of Automation, Guangdong Polytechnic Normal University, Guangzhou 510665, China
3
College of Biosystems Engineering and Food Science, Zhejiang University, Hangzhou 310058, China
*
Author to whom correspondence should be addressed.
Agronomy 2020, 10(9), 1268; https://doi.org/10.3390/agronomy10091268
Submission received: 6 July 2020 / Revised: 17 August 2020 / Accepted: 22 August 2020 / Published: 27 August 2020

Abstract

:
Cultivar identification of seeds is important for crop yield and quality. To study the impact of different features expressions and classification methods on cultivar identification, the performance of the feature expressions and classification algorithms affecting the accuracy of cultivar identification was evaluated by image processing techniques. A total of 448 samples of seeds from seven cultivars of sweet corn, namely, Orlando, Beiyasi, Jingketian 183, Jingtian 218, Suitian 1, CT76 and Lilixiangtian, were evaluated. The color, shape and texture features of the seeds were extracted from the images, and the class separability criterion was adopted to evaluate the separability of the features of the embryo side, nonembryo side and both of them combined. The results indicate that the class separability based on the features of the embryo side was higher than that based on the nonembryo side and both of them combined. Based on the embryo-side optical feature data, dimensionality reduction was conducted by two feature selection methods (stepwise discriminant analysis (SDA) and genetic algorithm (GA)) and two feature extraction methods (principal component analysis (PCA) and kernel principal component analysis (KPCA)). Performance evaluation of the feature reductions was conducted by constructing k-nearest neighbor (K-NN), naïve Bayes (NB), linear discriminant analysis (LDA) and support vector machine (SVM) classifiers. Compared to the PCA and KPCA algorithms, the SDA and GA algorithms were more conducive to the cultivar classification of sweet corn seeds; the critical features selected specifically by the SDA, K-NN, NB, LDA and SVM classifiers achieved the best classification accuracies (81.43%, 82.86%, 90%, and 87.14%, respectively). Analysis of variance (ANOVA) revealed that the approach for optical feature selection had a more significant effect on the identification of sweet corn seed cultivars than did the classifiers. Therefore, based on the optical images of the embryo side and the key features obtained by the feature selection method, a classification model was constructed for the accurate and nondestructive classification of different sweet corn seed cultivars.

1. Introduction

Sweet corn (Zea mays var. saccharata) is a subspecies of maize whose milky stage is rich in sugar, various amino acids, vitamins, minerals and dietary fiber. Based on its high nutritional and edible value [1,2,3], the economic benefit of sweet corn is twice that of ordinary corn. It has been reported that the planting area of sweet corn in China has gradually expanded, which accounted for approximately 25% of the world’s planting area in 2018 [4]. To meet the yield and quality requirements for crop production, the safety, high quality and reliability of seeds are important for planting. However, the mixing of different cultivars during the cultivation, harvest, transportation and storage of seeds can occur, especially with the widespread adoption of hybrid seed techniques. The optimal harvest period of sweet corn occurs in an extremely short time, and the corn quality changes rapidly after harvest [5]. In particular, the sweet corns are generally harvested at milk-ripe stage, about 20–22 days after pollinaiton, and the immature sweet kernel of ear endosperm is the main product; thus, pure seed is essential for uniform harvesting time, uniform maturity, appropriate shelf-life and timely consumption. Moreover, the economic value, nutritional value and pest resistance of sweet corn are related to the properties of the cultivars. To control seed quality and avoid repeat cultivation, rapid and accurate methods to measure the purity of sweet corn seed are highly important for industrial production of sweet corn.
Morphological identification, physical and chemical analyses, and molecular identification are the conventional methods for identifying plant cultivars [6,7,8]. However, these methods generally require the use of protein electrophoresis or DNA molecular markers, both of which are time consuming, expensive and destructive [9]. Therefore, these methods are generally used to measure a small number of sampled seeds. To develop accurate and nondestructive classification of a large number of seed samples, a series of research methods have been proposed by scholars, among which spectral imaging and optical imaging technology are widely used [10,11,12,13].
Spectral technology has been applied to seed feature analysis and cultivar classification by many scholars [14,15,16]. For example, in Qiu et al. (2019), a feature wavelength was selected for two sweet corn seed cultivars via a genetic algorithm (GA), and the classification models based on full spectral wavelengths were compared with models based on feature wavelengths; it was indicated that the model complexity could be reduced and the classification accuracy was still high after the feature wavelength selection [17]. In Zhao et al. (2018), 12,900 seeds of three maize cultivars were studied, and a radial basis function neural network based on the optimal wavelength selected by principal component analysis (PCA) was established. The experiment showed that the results of the small-size calibration model based on feature wavelengths were similar to those of the large-sample-size calibration model [18]. To enable an increased number of feature combinations, in Xia et al. (2019), spectral features and texture features were extracted from 1632 seeds of 17 different maize cultivars, and the optimal features were selected via uninformative variable elimination (UVE), the successive projections algorithm (SPA) and multilinear discriminant analysis (MLDA). The results showed that the least squares-support vector machine (LSSVM) classification model based on the features selected via MLDA gained the best performance, achieving the highest classification accuracy (99.13%) [19]. Miao et al. (2018) introduced t-distributed stochastic neighborhood embedding (t-SNE) for the classification of seeds from eight different waxy maize cultivars and found that the classification accuracy of the t-SNE models was improved by procrustes analysis (PA) preprocessing, and the models using the nonembryo-side data were more accurate than those using the embryo-side data [20]. In Liu et al. (2014), multispectral imaging technique was used to discriminate the non-transgenic seeds and transgenic rice seeds by combining with four chemometrics methods. By comparing the discrimination performance of different chemometrics methods, the best model for classifying the rice seeds was obtained [21]. In Shrestha et al. (2016), the classification model was investigated by multispectral imaging technique with the wavelengths ranging from 375 nm to 970 nm for five cultivars of tomato seeds, and a good classification accuracy for two independent test sets was obtained for all tomato cultivars irrespective of chemometric methods [22]. Hu et al. (2020) used multispectral imaging technology to separate sweet clover seeds from alfalfa seed. The performance of multispectral imaging with object-wise multivariate image analysis was evaluated, and the results demonstrated that the linear discriminant analysis (LDA) model based on a combination of spectral and morphological data showed the best classification performance, with an accuracy of up to 99% [23]. Seed cultivar classification can be achieved via spectral technology, but the spectral system requires stringent experimental conditions, and the computational complexity of the data processing is high. As economical, convenient and easily adoptable methods, many optical imaging technique-based seed classification methods have been proposed. These methods have been successfully applied to the seed cultivar identification of rice, wheat, corn and other crop species [24,25,26]. For example, to study the influence of different optical properties on the classification of rice seed cultivars, a neural network-based classification model based on the texture, shape and the combination of the two properties was proposed by Chaugule et al. (2014) [27], and a positive classification result based on seed shape features was reported. Wu et al. (2018) used digital image processing techniques to extract six typical kinds of optical shape features, such as the area, perimeter and rectangularity of ordinary corn seeds, and developed many kinds of classification models. Their results showed that, based on shape features, a support vector machine (SVM) classification model combining GA and particle swarm optimization (PSO) could effectively classify different cultivars of maize seeds [28]. Kiratiratanapruk et al. (2011) investigated the extraction problems associated with key optical attribute features and compared the performance of color (those based on red-green-blue (RGB) and hue-saturation-value (HSV) color histograms) and texture features (those based on a gray level co-occurrence matrix and local binary patterns) to classify maize seeds, and the results showed that the color and texture features combined gained the best classification performance [29]. With respect to the problem of adhesion between optical images of seeds, the foreground segmentation of a single typical corn seed is achieved by using the line contour segmentation algorithm in Li et al. (2019) [30]. Moreover, on the basis of their color and shape, normal and damaged corn seeds are classified by the maximum likelihood estimation. In Abbaspourgilandeh et al. (2020), the color, shape and texture features from the optical images of different rice cultivars with nonlinear relationship were extracted, and the rice cultivar classification model was established by discriminant analysis (DA) and artificial neural network (ANN); the results indicated that ANN achieved a better identification accuracy than that of DA [31].
The above classification models were generally established through feature extraction and classification algorithms; thus, features reduction algorithms and classification methods have a strong effect on identification accuracy, and improving these model components has been studied previously [15,16,17,18,28]. As the feature expressions and classification methods have different effects on the accuracy of cultivar identification, a performance evaluation on these two aspects should be performed first to determine the feature space that is most beneficial to cultivar identification; however, this concept has not been studied in the above research. In addition, most current research focuses on the features from a random section or part of the seed (they do not distinguish between the embryo side and nonembryo side) [12,14,15,16,18,28,29,30] or only the embryo side [17,
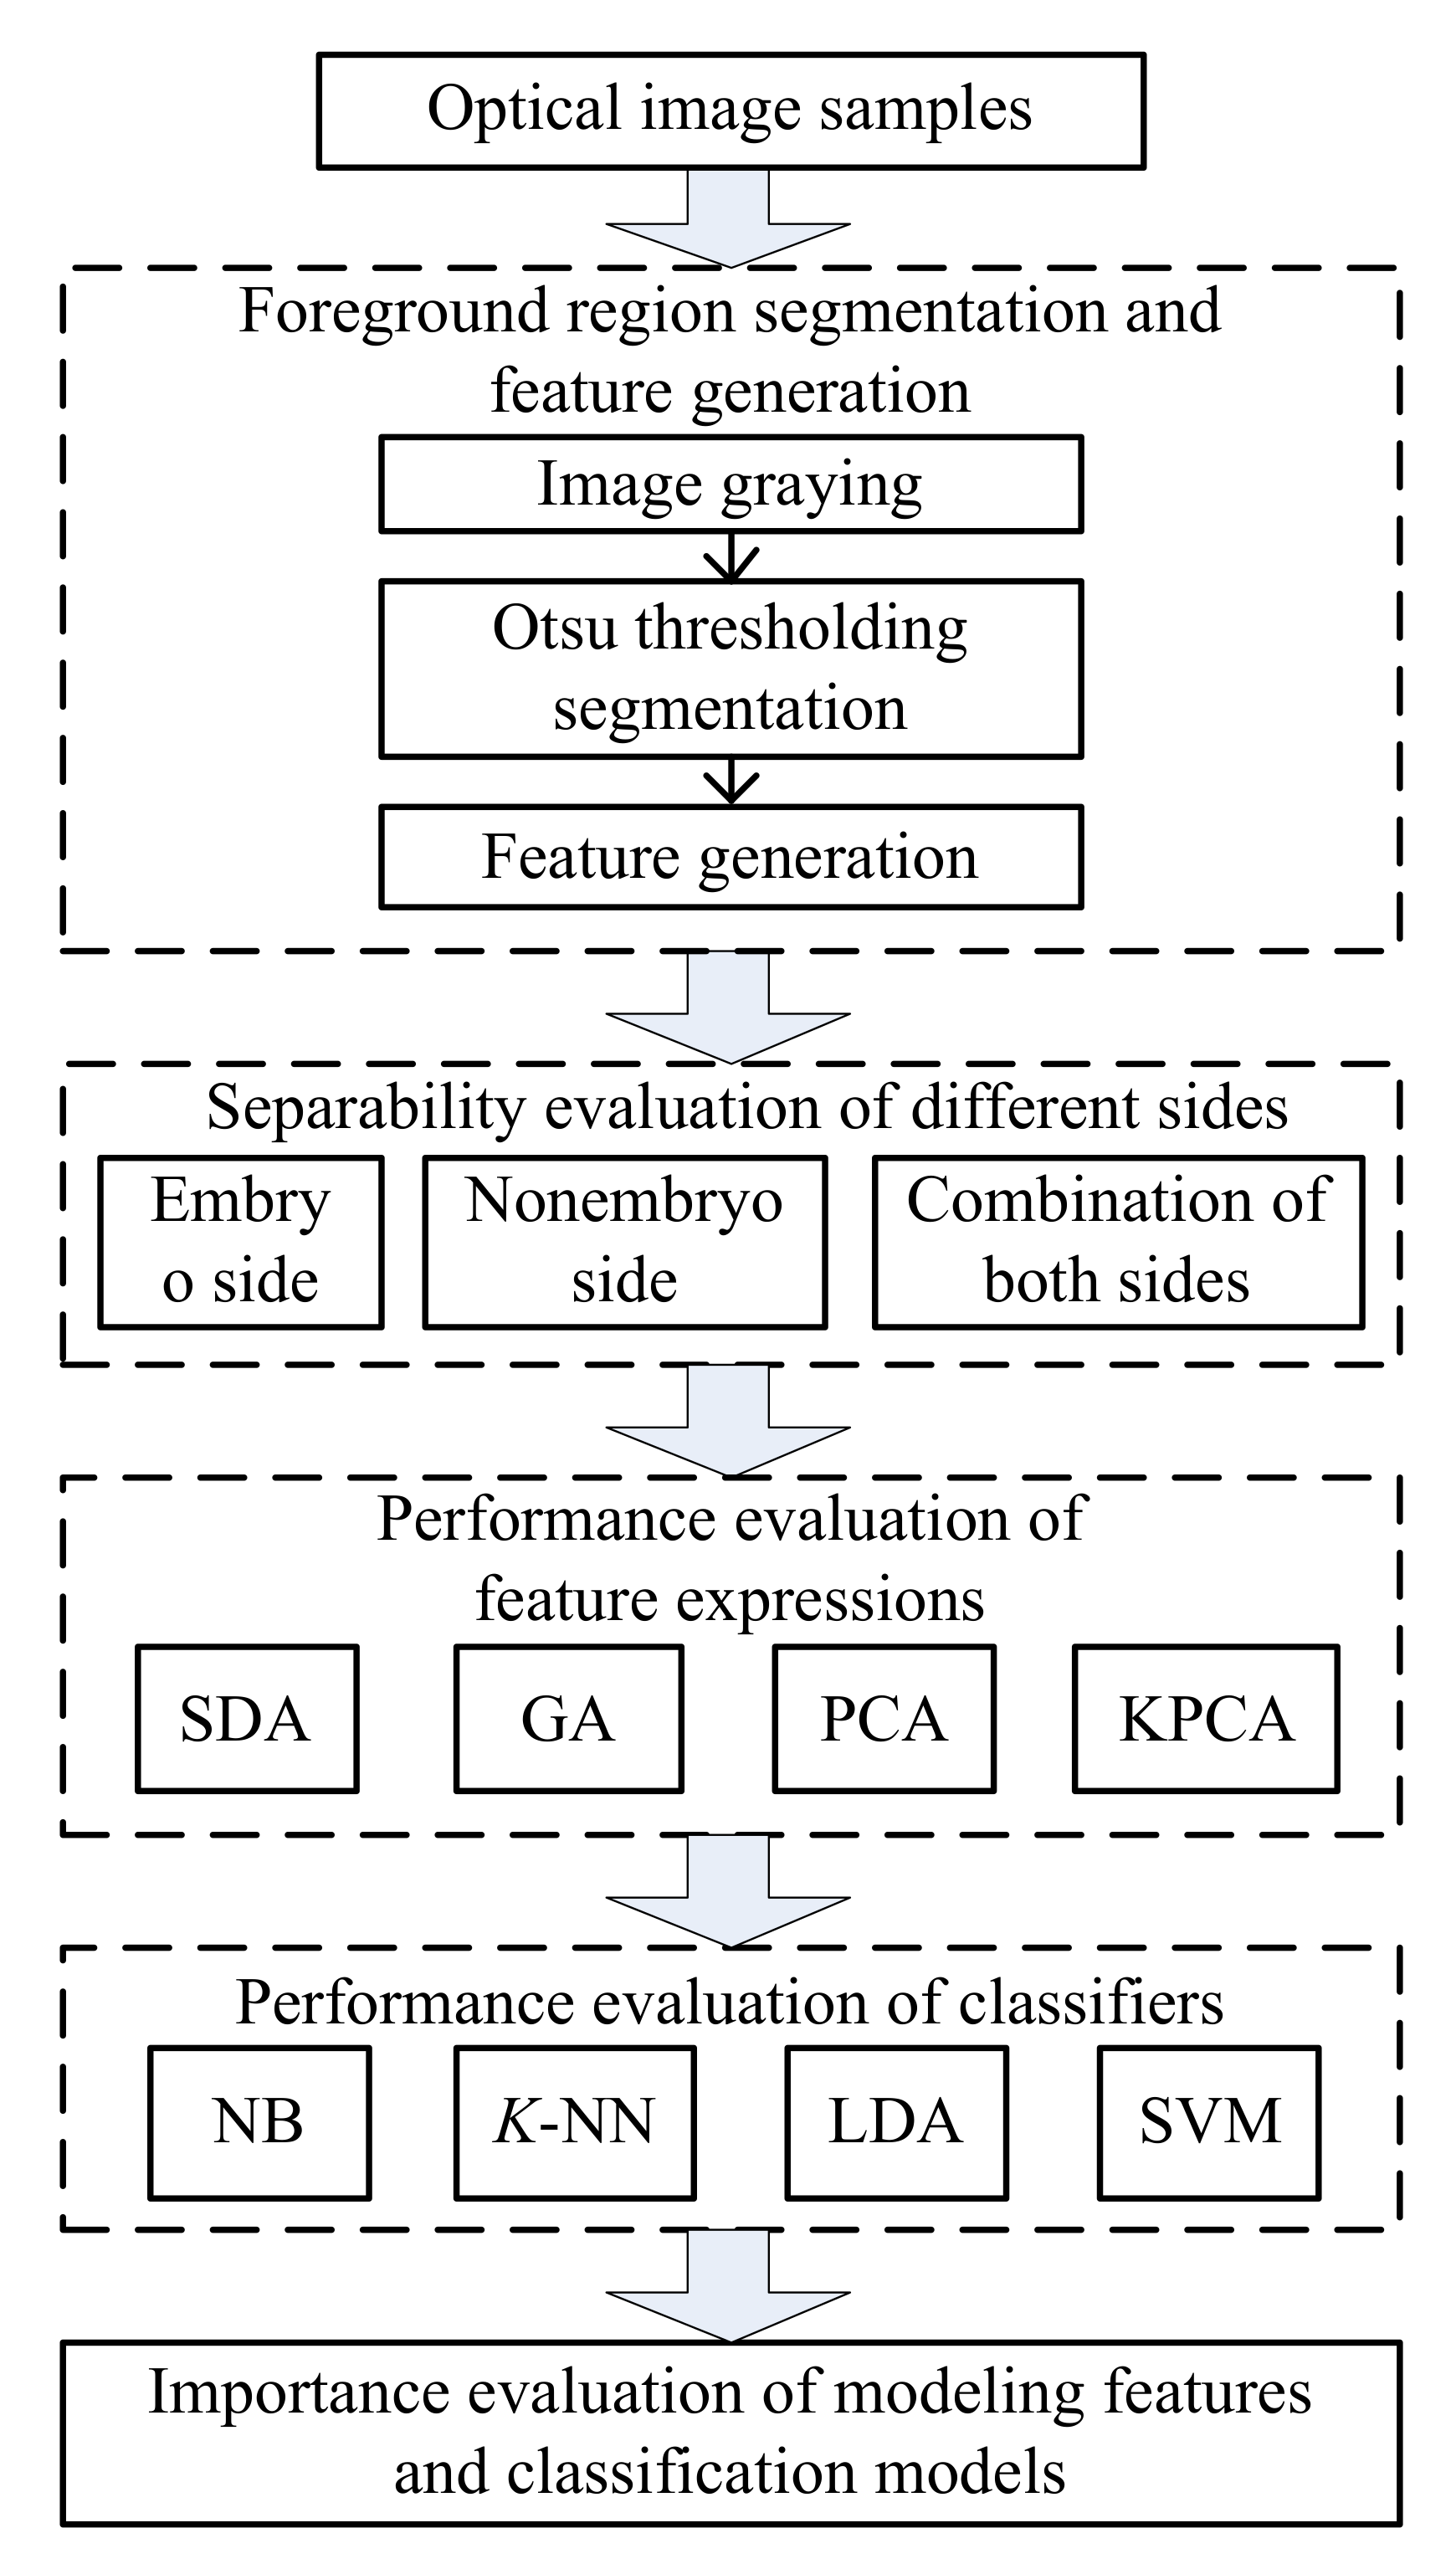
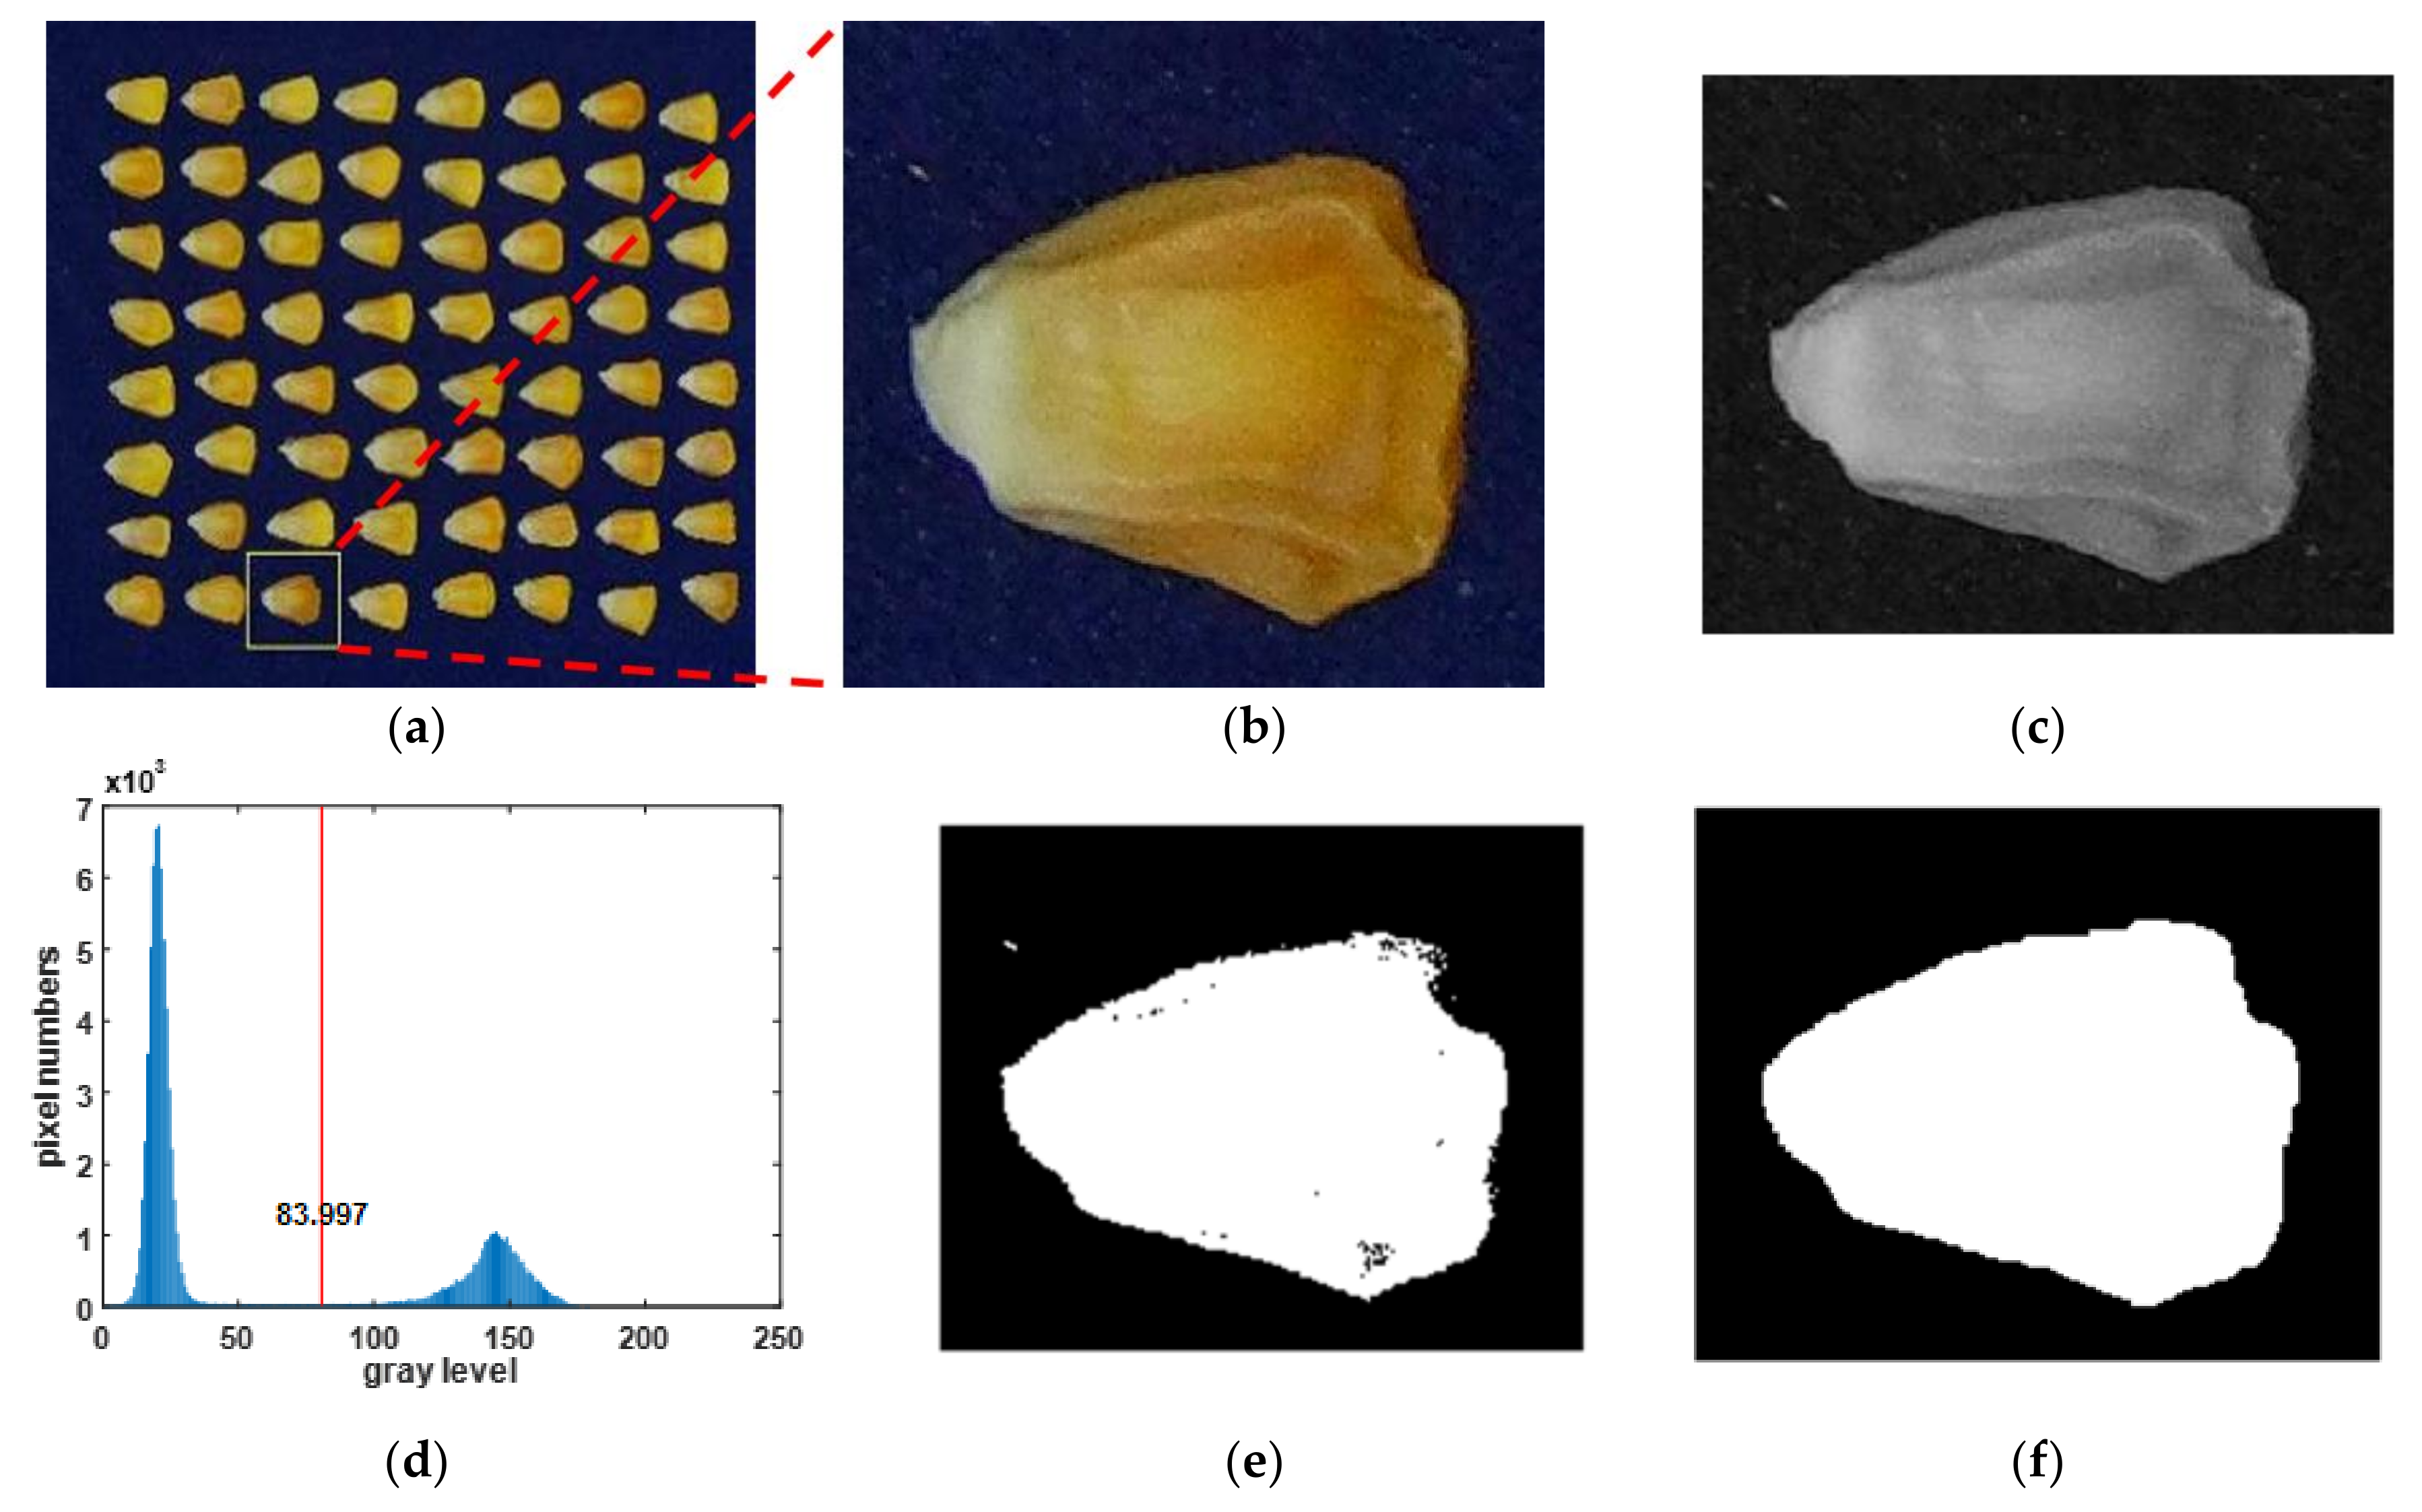
19] of maize seeds. Because of the presence of the germ, the characteristic information contained in the front (containing the embryo) and the back (not containing embryo) of corn seeds and its influence on the performance of cultivar classification differs. To improve the accuracy of cultivar classification and improve the stability of the model, the performance of feature information from the embryo side of seeds, the nonembryo side and both of them combined should be evaluated, with the optimal side subsequently used for feature analysis and classification modeling; however, this has not been investigated. To ensure the systematic nature and integrity of cultivar identification, it is especially important to establish a performance evaluation in feature analysis and processing methods for sweet corn seeds. Thus, in this paper, in view of the above problems, seed cultivar classification via image analysis was studied. Due to it being economical, convenient and easily adoptable, a charge-coupled device (CCD) camera (model H1600Cam) with 16 million pixel was used for image acquisition in this study. The optical image of seven cultivars of sweet corn seeds were collected and different optical features were generated to evaluate the performance of cultivar identification. Through optical property features, such as the color, shape and texture features of the embryo side and nonembryo side of seeds, cultivar separability of the different seed sides was achieved, and the optimal side was determined. The key features of seed images were obtained by different dimension reduction methods, and the performance of the different feature spaces was evaluated by four classification algorithms. The key optical feature expressions and classification methods that affect the identification model of sweet corn seed cultivars were ultimately determined.

2. Materials and Methods

2.1. Sample Preparation and Image Acquisition

Seven cultivars of sweet corn seeds (Orlando, Beiyasi, Jingketian 183, Jingtian 218, Suitian 1, CT76 and Lilixiangtian, which are recorded as V1, V2, V3, V4, V5, V6 and V7, respectively) were purchased from a seed company (FMYS Technology Ltd., Beijing, China). They were packaged in plastic bags and stored in a refrigerator at 4 °C with their moisture content was 7% to 8%. Figure 1 shows the true appearance of samples of seeds of the seven cultivars, where each column shows the samples belong to the same cultivar. For each column, the top two shows the embryo side and the bottom two shows the nonembryo side of the seeds. All of the samples’ mass-tone attune was yellow, the average length of the seeds was 1 cm, and the average width was 0.8 cm.
A schematic of the optical imaging system designed for this research is shown in Figure 2. The system was composed of a white cube (60 cm per side), a charge-coupled device (CCD) camera (model H1600Cam, Ruishi Instrument Equipment Co., Ltd., Shenzhen, China) and a ring-shaped light source. The CCD camera was fixed onto the top of the cube. The lens of the CCD camera around which the ring-shaped light source was mounted was situated 50 cm above the center of the bottom. The maximum brightness of the light source was 35,000 lux, and the brightness was adjusted to 80% during the imagery acquisition.
The embryo side and nonembryo side of the seeds of each cultivar were placed in 8 × 8 arrays, and all seeds were oriented uniformly. Firstly, the images of embryo side were collected, then the seeds were turned over and the seed images of nonembryo side were collected. Blue gauze was used as a background to provide good contrast between the background and the yellow color of the seed samples. For 64 samples of each cultivar, 54 seeds were randomly selected as the training samples, and the remaining 10 seeds were used as the testing samples. In the following procedure, the classification model construction and variety discrimination were implemented by the training data and testing data, respectively.

2.2. Methods

The flow diagram in Figure 3 shows the performance evaluation of feature expressions and classifications for optical image-based cultivar identification of sweet corn seeds. The figure illustrates the main procedures for all five steps, which are as follows: foreground region segmentation and feature generation, separability evaluation of the embryo side and nonembryo side, performance evaluation of feature expressions, performance evaluation of classifiers and importance evaluation of feature reduction algorithms and the classification model.

2.2.1. Foreground Region Segmentation

The segmentation of the foreground region of corn seed mainly includes the processes of grayscale image conversion, threshold segmentation and morphology reprocessing. First, the RGB color image was converted into a grayscale image, as shown in Figure 4c. The grayscale histogram was calculated in Figure 4d, from which we can see that there was a significant grayscale difference between the seed area and the background area. Otsu is an algorithm to determine the threshold of binary image segmentation based on the maximum variance between foreground and background images. The foreground region of the corn seed image is segmented by the Otsu threshold segmentation algorithm in MATLAB software [32], and the result is shown in Figure 4e. The epidermis has a small grayscale distribution feature in the local region, and there is no significant difference between the local region and the background region; thus, there is some noise and over segmentation in Figure 4e. Therefore, the hole-filling operation, morphology open and close operation were used to perform morphological postprocessing for the binary image of Figure 4e [33], and the results are shown in Figure 4f.

2.2.2. Feature Generation

It can be seen from Figure 1 that the apparent features of the sweet corn seeds, such as the color, shape and texture, are different between different cultivars. Hence, the color features of seeds were extracted through YCbCr, the hue-saturation-value (HSV) and the International Commission on Illumination (CIE) L*a*b* space transformation. The binary image after background segmentation was calculated to obtain the geometric shape features. To obtain complete descriptive features of the seed region, two methods, a gray level co-occurrence matrix (GLCM) and local binary patterns (LBP), were used.
To study the image features of sweet corn seeds in different color spaces, the sweet corn seed images were transformed from an RGB color space to YCbCr, HSV and CIE L*a*b* color spaces. The YCbCr space transformation was realized via Equation (1), and the transformation to HSV and CIE L*a*b* color space were achieved according to references [34,35]. Since the brightness component does not contain color information, the information of the Y, V and L* components were eliminated. Moreover, since not every pixel had the same color component in the seed region, this paper used the mean value and standard deviation (std) of the different color components (including R, G, B, Cb, Cr, H, S, a* and b*) to determine the color features of the seeds of the different cultivars. A total of 18 color features were generated.
Y C b C r = 16 128 128 + 65.481 128.553 24.966 37.797 74.203 112 112 93.786 18.214 R G B
To obtain the shape features of the sweet corn seeds, the regionprops function was used to analyze the binarization image after foreground segmentation to determine the perimeter, area, long axis and short axis of individual seeds. The degree of rectangularity was obtained by the ratio of seed area to the smallest circumscribed rectangle, and the degree of extension was obtained by the ratio of the long axis to short axis. The circularity of the seeds calculated via Equation (2) was used to describe the extent of the similarity of the seed shape to that of a circle. The shape complexity obtained by Equation (3) was then used to describe the relative perimeter per unit area [28].
C = 4 π A / P 2
S c = P 2 / A
where C is the circularity of the seeds, A is the area of an individual seed, P is the perimeter and Sc is the shape complexity.
In this paper, a total of 26 texture features, including the number of pixel pairs with specified positions and grayscale data, and the local spatial structure were extracted from the images of the seeds. Among these structures, the minimum bounding rectangle of each seed was calculated via a GLCM, with the step size set as 1; after the GLCM was obtained, four texture statistical parameters (contrast, correlation, energy and entropy) were calculated by a GLCM based on four different directional angles: 0°, 45°, 90° and 135° [36]. In addition, LBPs were used to encode the seed gray images [37], and the pixel distribution of 10 LBP feature values in the seed region was obtained. The distribution probability of each LBP feature value was ultimately calculated to characterize the local texture features.
Based on the above methods, a total of 52 optical features, including color, shape and texture features for sweet corn seeds, were extracted from the images. The variables are shown in Table 1.

2.2.3. Separability Criterion

To evaluate the class separability of the embryo-side and nonembryo-side features of sweet corn seeds, the class separability criterion of Equation (6) was used to measure the separability as follows:
S b = i = 1 c P i M i M 0 M i M 0 T
S w = i = 1 c P i 1 n i k = 1 n i X k i M i X k i M i T
J = T r S b T r S w
where c is the number of classes, Pi is the prior probability of class i, Mi is the mean vector of class i, M0 is the overall average of all the classes, ni is the number of samples in class i and X k i is the kth sample data of class i. In Equation (6), Tr[Sb] and Tr[Sw] are traces of Sb and Sw, respectively, while Sb and Sw represent the between-class scatter matrix and within-class scatter matrix and are obtained by Equations (4) and (5), respectively. J represents the feature distance between the different cultivars and the feature tightness within the same cultivar; the larger the J value is, the better the separability.

2.2.4. Feature Reduction Methods

Stepwise discriminant analysis (SDA), GA, PCA and kernel principal component analysis (KPCA) were applied to extract the key feature variables, and the classification performance for sweet corn seed cultivars based on these methods was evaluated.
Based on the Wilks criterion, the key features for seed cultivar classification are selected from the optical feature variables through an iterative process. To avoid selecting the variables that are linearly correlated with the early selected variables, the F criterion is used to statistically test for the selected variables, and these correlated features are eliminated until no variables can be selected or removed. For the GA algorithm, seeds’ optical features are used as genes to randomly generate an initial population, and cultivar classification accuracy is used as the fitness function. The maximum number of iterations is set to 100, and the feature variables corresponding to the highest fitness function are selected to achieve feature selection. With a cumulative contribution rate of 85% for the standard, the PCA algorithm was used to extract principal component features of the optical images of the corn seeds. The Gaussian radial basis function was selected as the kernel function for KPCA, namely, k x , y = exp ( x y 2 / σ ) and σ was set to 50 [38].

2.2.5. Classification Models

K-nearest neighbor (K-NN), naïve Bayes (NB), linear discriminant analysis (LDA) and SVM were applied for cultivar classification and model evaluation. Parameter optimization was carried out for the classification models by multiple cross-validation experiments [39].

3. Results and Discussion

3.1. Separability Evaluation of the Embryo Side and Nonembryo Side

To evaluate the class separability of the embryo side and nonembryo side of sweet corn seed, based on the color, shape and texture features, the classification performance of the embryo side, nonembryo side and both of them combined was evaluated by the classification separability criterion in Equation (6). The class separability values of the different feature combinations acquired from the embryo side, nonembryo side and both of them combined are shown in Table 2. In this table, C represents color features, S represents shape features and T represents texture features.
From Table 2, it can be seen that, regardless of the combination of color, shape and texture features, the value for embryo side of seeds was significantly higher than the nonembryo side and both of them combined. Based on the separability criterion, it can be concluded that the separability based on the embryo side of seeds showed the best than the other two situations. These results indicated that more identification features are associated with the embryo side than with the nonembryo side of the sweet corn seed. The result was consistent with the research in Yang et al. (2015), in which the classifiers based on near-infrared (VIS/NIR) hyperspectral feature of corn seed was developed to recognize different cultivars, and the classification results of embryo side also performed better than that of the nonembryo side for waxy corn seed [10]. According to Cheng et al. (2014), the seed features of the nonembryo side change greatly across a corncob, but the features of the embryo side tend to be identical for the same cultivar, as white embryos are less affected by the position on the corncob [40]. Thus, the features of seed embryos constitute the key factor in identifying seed cultivars. As a result, the optical features of the embryo side were selected in this paper for the classification of sweet corn seeds.
Table 2 shows that the class separability based on the combination of color and shape features gained the highest value, while the combinations that contain texture features gained the worst value. To further analyze the influence of the color, texture and shape features on cultivar classification, the data set of seed samples with 18 color features and 8 shape features was defined as dataset 1, and the data set of seed samples with 26 texture features was defined as dataset 2. The low-dimensional feature representations of the 7 cultivars from LDA based on these two datasets are given in Figure 5, in which the 7 cultivars are marked with different colors.
Based on the features in dataset 1 in Figure 5a, it can be seen that the data from the same cultivar are more concentrated and that the data from different cultivars are scattered across a large distance, which is beneficial for cultivar classification. In Figure 5b, it can be seen that there are many overlaps among the different cultivars based on texture features, and it is difficult to distinguish the seed cultivars. It can therefore be concluded that the color and shape features play a key role in the classification of sweet corn seed cultivars. Hence, as shown in Table 2, the class separability-based color and shape features was better than that based on texture features, the result was verified in Chaugule et al. (2014), as it was reported that texture feature of seed has less discriminating power than shape feature [27].

3.2. Feature Reductions and Cultivr Classifications

It can be seen from Table 2 that regardless of whether the embryo side, nonembryo side or both of them combined is used, the class separability based on all of the variables did not gain the best results, which indicated that there is noise or disturbance among the 52 optical feature variables. There are even variables that are not conducive to cultivar classification. To determine the key features that affect the classification performance of sweet corn seed cultivars, feature reduction based on two aspects, the feature selection method and feature extraction method, was implemented. The feature reduction performance for the embryo-side optical feature data of the sweet corn seeds by different classification methods was evaluated.

3.2.1. Results of Feature Reductions

In this paper, the key optical features of the embryo side were selected by SDA and GA algorithms. In each step of SDA, the entry and removal of variables in the model depend on the threshold of entry and the threshold of removal based on the F criteria, respectively. The variable outside the model can enter the model when its F value is larger than the threshold of entry, and the variable in the model will be removed when its F value is smaller than the threshold of removal. Referring to Muhameed et al. (2014), the threshold of entry and threshold of removal in the SDA model were set as the default parameter values 3.84 and 2.71, respectively [41]. A total of 24 feature variables were selected based on SDA. According to the classification accuracy of the K-NN benchmark classification algorithm, the model parameters of the GA algorithm were optimized 20 times by independent cross-validation. Figure 6 shows the change in the average K-NN classification accuracy rate as the number of features selected increased from 2 to 26. From Figure 6, it can be seen that classification accuracy improved with the number of selected variables, and the best performance was achieved when the number of features was 11. To achieve cultivar classification based on the optimal features, the number of GA algorithms for feature selection was set to 11 in this paper.
The key features selected by the SDA and GA algorithms are presented in Table 3. It can be seen from Table 3 that 12, 5, and 7 color, shape and texture features, respectively, were selected by SDA, while the numbers were 7, 3 and 1, respectively, by GA. A large number of color features that reflect the external color difference and range of depth of the different cultivars were selected both two algorithms, and some identical variables were selected, such as c1 (mean of the R component), c9 (mean of the b* component) and c16 (std of S). Three common shape features (s4, s5 and s8) were selected by both algorithms. Among them, s5 represents morphological characteristics; the larger s5 is, the narrower the seed shape. The s8 feature represents shape complexity; the larger s8 is, the more complex the shape. Because of the varied features of the color and shape of the different cultivars, as shown in Figure 1, color and shape were considered main features and constituted the key information for cultivar identification. These results concerning the selected features are consistent with those of the study on the importance of color and shape in Section 3.1, which verified the effectiveness of the two algorithms in terms of feature selection. It can be seen from Table 3 that only one texture feature was selected by the GA algorithm, which probably occurred because the irregular shrinkage of the corn seed epidermis made it difficult to obtain consistent texture information. Figure 1 shows that there are no obvious differences in the texture structure of the seeds of the different cultivars, which translates to a relatively small contribution of texture features to the classification of sweet corn seed cultivars.
To extract the key feature information, PCA was adopted for all 52 optical feature variables, and the scatter plot of the first three principal components (PC1, PC2, PC3) with the variance contribution rates 31.67%, 17.47% and 16.53%, respectively, for the embryo side were given in Figure 7. It can be noticed in Figure 7 that there are some overlaps among the samples from different cultivars as the data information of the first three principal components may not guarantee the significant data variance. Referring to Zhuang et al. (2019), the first six principal components which gain cumulative contribution rate of 86.76% were considered [39]. KPCA was also adopted for all 52 optical feature variables, and the first ten principal components with the cumulative contribution rate of 85.04% were extracted.

3.2.2. Performance Evaluation of Classifiers

Based on the 52 optical features and the reduced features obtained by the SDA, GA, PCA and KPCA, a classification model for sweet corn seed cultivars was constructed via K-NN, NB, LDA and SVM methodology. The classification accuracy of the seven varieties of sweet corn seeds based on optical images of the embryo side is shown in Table 4.
Table 4 shows that the accuracies of the classification models based on all the variables were lower than those based on feature selection methods (SDA and GA), which verifies the occurrence of certain correlations and redundant information among the feature data of all the variables. The classification models based on the features selected by the SDA and GA algorithms were excellent, and the average classification performance was higher than that of all the variables. Therefore, the SDA+LDA model reached the highest classification accuracy (90%), indicating that feature reduction could effectively improve the classification performance of sweet corn seed cultivars. In addition, the accuracy of the NB and LDA classification models based on SDA-selected features was higher than that of the GA classification model. The feature selection results in Table 3 show that SDA selected more features than did GA, and the shape feature combination selected by SDA includes s1 (perimeter) and s7 (circularity), each of which the GA did not select; circularity represents the extent of the similarity of the seed shape to that of a circle. Figure 1 shows that significant differences in perimeter and circularity exist among the different cultivars of corn seeds, but the GA algorithm did not select these features. This was probably because the GA algorithm is based on an optimization strategy that easily becomes associated with local optimization, while the SDA algorithm involves statistical tests on all the selected features at each iteration and selects the key feature according to the threshold value, which depends on the importance of the variables; thus, the acquired features are relatively consistent. Therefore, the features selected by SDA are more conducive to the cultivar classification of seven different varieties of the sweet corn seeds.
It can be seen from Table 4 that in the cultivar classification of sweet corn seeds, the accuracies based on feature selection algorithms (SDA and GA) are mostly greater than 80%, while those based on feature extraction algorithms (PCA and KPCA) are generally approximately 70%. This is because PCA and KPCA are unsupervised algorithms whose goal is to obtain variable information through the maximum population variance without considering the class difference of the data; however, the goals of SDA and GA are to construct a discriminant function based on the class difference and obtain the key discriminant variables of different cultivars through continuous iteration and optimization. To verify the features of the feature selection method in terms of preserving feature data containing classification information, the feature data after PCA projection of the embryo side of sweet corn seeds was used to design the experiment. The cumulative contribution of the first six principal components reached 86.76% (the contribution rates of PC1, PC2, PC3, PC4, PC5 and PC6 were 31.67%, 17.47%, 16.53%, 8.68%, 6.59% and 5.82%, respectively); the SDA algorithm was used to select principal component features, and the key features selected for use in the discriminant model were as follows (in order of importance): PC2, PC1, PC3, PC5, PC4, PC6, PC9, PC8, PC12 and PC7. These results show that the first six principal component variables with high degrees of contribution are preferentially selected for inclusion in the discriminant model by SDA, which indicates that the feature selection method based on SDA can obtain the key features from the data. However, the principal components with high contribution rates were not included in the model in advance, and PC2 was selected before PC1 and PC5 before PC4. Therefore, the later principal components (PC2, PC5) were more conducive to cultivar identification than the first ones (PC1, PC4) were, which demonstrates that SDA could obtain more key classification information than could PCA.
Table 4 shows that the accuracies of the four classification models established under the same feature data somewhat differ; for example, the accuracies of the four classification models based on the feature data selected by SDA vary slightly: from 81.43% to 90%. However, the accuracies of the same classification algorithm based on different feature data vary greatly; for example, the accuracy range of the LDA classification model based on different feature data ranges from 67.14% to 90%. These results indicate that the classification algorithm and feature reduction algorithms have different effects on classification accuracy. To compare the extent of influence of feature reduction algorithms and classification algorithms in terms of classification accuracy, analysis of variance (ANOVA) was performed. By decomposing the research objectives (classification rate) into different variable factors (feature reduction and classification algorithms) in ANOVA, the variation performance of different components (Adj SS) is measured after the data estimation to determine the contribution rate of different variable factors to the research objectives. Finally, the p-value of the mismatch test was compared with the significance level to evaluate the original hypothesis. The accuracies are shown in Table 4 as dependent variables, and the results are shown in Table 5. The feature reduction algorithms factor p-value of 0.001 is much lower than 0.05, and the classification algorithm factor p-value of 0.361 is much greater than 0.05 (a significance level of α = 0.05 determines the influence of the control factors; p < 0.05 is significant); hence, five kinds of feature reduction algorithms exhibit significant differences in classification accuracy, but four kinds of classification algorithms do not. The last column in Table 5 lists the percentage contribution of the different factors to classification accuracy. The influence of the feature reduction algorithms (contribution of 70.89%) on the classification accuracy of sweet corn seed cultivars was significantly higher than that of the classification algorithms (contribution of 6.59%).
To further analyze the influence of the classification algorithm on cultivar classification, different classification algorithms based on the features selected by SDA were compared by a discriminant confusion matrix. Table 6, Table 7, Table 8 and Table 9 present the discrimination confusion matrices of the sweet corn seed cultivars based on four classification models: SDA+K-NN, SDA+NB, SDA+LDA and SDA+SVM.
It can be seen from the confusion matrices of the different classification methods (Table 6 and Table 7) that the classification effect of K-NN and NB is relatively poor, with overall accuracies of 81.43% and 82.86%, respectively. This occurred mainly because V6 was misidentified as V1. In particular, the accuracy of the K-NN classification for V6 is only 30%, probably because K-NN is sensitive to noise disturbance and is better suited for pattern classification of large sample sizes. In addition, a relatively large sample size will better reflect the real distribution of different cultivars, but the sample size researched in this article was relatively small, which is conducive to misjudgment when using the K-NN algorithm. When the sample size was large, such as 380 samples per cultivar in Qiu et al. (2019), the high accuracy based on K-NN classifier may be obtained; however, the SVM model also performed better than K-NN model, which was similar to the results in this research [17]. With respect to the NB algorithm, the classification performance depends largely on whether the features used for modeling are independent; the stronger the data independence is, the greater the classification accuracy. However, the features extracted from the optical images of sweet corn seed are not completely independent; for example, the features of the different color components obtained by color space transformation could have a certain relevance. Therefore, the NB classification model established on the basis of these features gained poor discriminant results. The results shown in Table 8 and Table 9 indicate that the best performance occurred from the classification model based on LDA and SVM algorithms, with overall accuracies of 90% and 87.14%, respectively, which made accurate discrimination for each sweet corn seed class; this is because LDA was a linear algorithm and the SVM model uses a linear kernel, which demonstrates that the experimental data from the seven sweet corn seed cultivars in this paper are linearly separable. The variety classification for the maize seed and sweet clover seeds in Xia et al. (2019) and Hu et al. (2020) [19,23], respectively, also verified the efficiency of LDA in the linear case. However, the performance was not guaranteed when the rice cultivars contain nonlinear relationship [31]. In addition, LDA classification aims to determine the projection direction in which samples from different cultivars acquire the largest ratio of between-class scatter to within-class scatter, which is consistent with the separability criterion in Section 3.1, in which the feature data based on the seed embryo side with better class separability make it easy for LDA to determine the optimal projection direction. Therefore, among the four kinds of classification models, especially the SDA+LDA model, the LDA classification model achieved the best results, where each sweet corn seed cultivar had a classification accuracy greater than 80%.

4. Conclusions

In this paper, the performance of optical image feature expressions and cultivar classifications for seven sweet corn seed cultivars was evaluated. Thus, cultivar identification was performed by optical image feature generation, feature reduction and classification modeling. The main conclusions are as follows:
(1)
The separability of the optical features of the embryo side and nonembryo side of sweet corn seeds was evaluated by a class separability criterion, and the results indicated that the class separability of the embryo side was higher than that of the nonembryo side and both of them combined. Further, the class separability was compared among the color, shape and texture features of the embryo side, and the separability reached the highest (0.854) from the combination of color and shape features.
(2)
Dimensionality reduction was conducted by two feature selection methods (SDA and GA) and two feature extraction methods (PCA and KPCA), and their classification performance was evaluated by K-NN, NB, LDA and SVM classifiers. The results indicated that the key features obtained by the feature selection methods provided better classification accuracy than did those obtained by feature extraction methods. On the basis of the key features selected by SDA, the K-NN, NB, LDA and SVM classifiers obtained the best classification accuracies: 81.43%, 82.86%, 90% and 87.14%, respectively.
(3)
ANOVA was applied to characterize the impact of the feature reduction algorithms and classification algorithms on cultivar identification. The results showed that the factor of feature reduction algorithms achieved a maximum contribution of 70.89%, which had a more significant effect on the cultivar classification than the classification algorithm factor, whose contribution was 6.59%.

Author Contributions

Conceptualization, Y.T. and Z.C.; Data curation and formal analysis, C.H. and X.C.; Methodology, A.M., J.Z. and X.C.; Software, J.Z. and X.C.; Supervision, Y.H.; Writing—original draft, Z.C.; Writing—review & editing, Y.T., A.M., Y.H. and S.L. All authors have read and agreed to the published version of the manuscript.

Funding

This work was supported by the Key Project of Universities in Guangdong Province, China (No. 2017KZDXM047); the Rural Revitalization Strategy Project of Guangdong Province, China (No. 2019KJ138); the Planned Science and Technology Project of Guangdong Province, China (Nos. 2019A050510045 and 2019B020216001); the Planned Science and Technology Project of Guangzhou, China (Nos. 202002020063 and 202007040007); and the Key Laboratory of Spectroscopy Sensing, Ministry of Agriculture and Rural Affairs, China (No. 2018ZJUGP001).

Conflicts of Interest

The authors declare no conflict of interest.

References

  1. Aziz, M.S.; Nawaz, R.; Haider, N.; Rehman, Z.U.; Aamir, A.H.; Imran, M. Starch composition, antioxidant potential, and glycemic indices of various varieties of Triticum aesitivum L. and Zea mays L. available in Pakistan. J. Food Biochem. 2019, 43, e12943. [Google Scholar] [CrossRef]
  2. Singh, I.; Langyan, S.; Yadava, P. Sweet Corn and Corn-Based Sweeteners. Sugar Tech. 2014, 16, 144–149. [Google Scholar] [CrossRef]
  3. Yang, T.R.; Hu, J.G.; Yu, Y.T.; Li, G.K.; Guo, X.B.; Li, T.; Liu, R.H. Comparison of phenolics, flavonoids, and cellular antioxidant activities in ear sections of sweet corn (Zea mays L. saccharata Sturt). J. Food Process Preserv. 2019, 43, e13855. [Google Scholar] [CrossRef] [Green Version]
  4. Zhang, R.F.; Huang, L.; Deng, Y.Y.; Chi, J.W.; Zhang, Y.; Wei, Z.C.; Zhang, M.W. Phenolic content and antioxidant activity of eight representative sweet corn varieties grown in South China. Int. J. Food Prop. 2014, 20, 3043–3055. [Google Scholar] [CrossRef]
  5. Szymanek, M.; Tanaś, W.; Kassar, F.H. Kernel Carbohydrates Concentration in Sugary-1, Sugary Enhanced and Shrunken Sweet Corn Kernels. Agric. Agric. Sci. Procedia 2015, 7, 260–264. [Google Scholar] [CrossRef] [Green Version]
  6. Rivera, D.; Miralles, B.; Obon, C.; Carreno, E.; Palazon, J.A. Multivariate analysis of Vitis subgenus Vitis seed morphology. Vitis J. Grapevine Res. 2007, 46, 158–167. [Google Scholar] [CrossRef]
  7. Sundaram, R.M.; Naveenkumar, B.; Biradar, S.K.; Balachandran, S.M.; Mishra, B.; Ilyasahmed, M.; Viraktamath, B.C.; Ramesha, M.S.; Sarma, N.P. Identification of informative SSR markers capable of distinguishing hybrid rice parental lines and their utilization in seed purity assessment. Euphytica 2008, 163, 215–224. [Google Scholar] [CrossRef]
  8. Yang, H.; Tao, Y.; Zheng, Z.; Li, C.; Sweetingham, M.W.; Howieson, J.G. Application of next-generation sequencing for rapid marker development in molecular plant breeding: A case study on anthracnose disease resistance in Lupinus angustifolius L. BMC Genom. 2012, 13, 318. [Google Scholar] [CrossRef] [Green Version]
  9. Zhu, D.Z.; Wang, C.; Pang, B.S.; Shan, F.H.; Wu, Q.; Zhao, C.J. Identification of Wheat Cultivars Based on the Hyperspectral Image of Single Seed. J. Nanoelectron Optoe 2012, 7, 167–172. [Google Scholar] [CrossRef]
  10. Yang, X.L.; Hong, H.M.; You, Z.H.; Cheng, F. Spectral and Image Integrated Analysis of Hyperspectral Data for Waxy Corn Seed Variety Classification. Sensors 2015, 15, 15578–15594. [Google Scholar] [CrossRef] [Green Version]
  11. Wang, L.; Liu, D.; Pu, H.B.; Sun, D.W.; Gao, W.H.; Xiong, Z.J. Use of Hyperspectral Imaging to Discriminate the Variety and Quality of Rice. Food Anal Method. 2015, 8, 515–523. [Google Scholar] [CrossRef]
  12. He, C.J.; Zhu, Q.B.; Huang, M.; Fernando, M. Model Updating of Hyperspectral Imaging Data for Variety Discrimination of Maize Seeds Harvested in Different Years by Clustering Algorithm. Trans. ASABE 2016, 59, 1529–1537. [Google Scholar] [CrossRef]
  13. Anami, B.S.; Malvade, N.N.; Hanamaratti, N.G. An edge texture features based methodology for bulk paddy variety recognition. Agric. Eng. Int. CIGR J. 2016, 18, 399–410. Available online: https://cigrjournal.org/i-ndex.php/Ejounral/article/view/3490 (accessed on 25 August 2020).
  14. Huang, M.; He, C.J.; Zhu, Q.B.; Qin, J.W. Maize seed variety classification using the integration of spectral and image features combined with feature transformation based on hyperspectral imaging. Appl. Sci. 2016, 6, 183. [Google Scholar] [CrossRef] [Green Version]
  15. Wang, L.; Sun, D.; Pu, H.; Zhu, Z.W. Application of Hyperspectral Imaging to Discriminate the Variety of Maize Seeds. Food Anal. Methods 2016, 9, 225–234. [Google Scholar] [CrossRef]
  16. Yang, S.; Zhu, Q.B.; Huang, M. Application of Joint Skewness Algorithm to Select Optimal Wavelengths of Hyperspectral Image for Maize Seed Classification. Guang Pu Xue Yu Guang Pu Fen Xi Guang Pu 2017, 37, 990–996. Available online: http://europepmc.org/article/MED/30160845 (accessed on 25 August 2020).
  17. Qiu, G.J.; Lü, E.L.; Wang, N.; Lu, H.Z. Cultivar classification of single sweet corn seed using fourier transform near-infrared spectroscopy combined with discriminant analysis. Appl. Sci. 2019, 9, 1530. [Google Scholar] [CrossRef] [Green Version]
  18. Zhao, Y.Y.; Zhu, S.S.; Zhang, C.; Feng, X.P.; Feng, L.; He, Y. Application of hyperspectral imaging and chemometrics for variety classification of maize seeds. RSC Adv. 2018, 8, 1337–1345. [Google Scholar] [CrossRef] [Green Version]
  19. Xia, C.; Yang, S.; Huang, M.; Zhu, Q.B.; Guo, Y.; Qin, J.W. Maize seed classification using hyperspectral image coupled with multi-linear discriminant analysis. Infrared Phys. Technol. 2019, 103, 103077. [Google Scholar] [CrossRef]
  20. Miao, A.M.; Zhuang, J.J.; Tang, Y.; He, Y.; Chu, X.; Luo, S.M. Hyperspectral image-based variety classification of waxy maize seeds by the t-SNE model and procrustes analysis. Sensors 2018, 18, 4391. [Google Scholar] [CrossRef] [Green Version]
  21. Liu, C.H.; Liu, W.; Lu, X.Z.; Chen, W.; Yang, J.B.; Zheng, L. Nondestructive determination of transgenic Bacillus thuringiensis rice seeds (Oryza sativa L.) using multispectral imaging and chemometric methods. Food Chem. 2014, 153, 87–93. [Google Scholar] [CrossRef]
  22. Shrestha, S.; Deleuran, L.C.; Gislum, R. Classification of different tomato seed cultivars by multispectral visible-near infrared spectroscopy and chemometrics. J. Spectr. Imaging 2016, 5, a1. [Google Scholar] [CrossRef]
  23. Hu, X.W.; Yang, L.J.; Zhang, Z.X.; Wang, Y.R. Differentiation of alfalfa and sweet clover seeds via multispectral imaging. Seed Sci. Technol. 2020, 48, 83–99. [Google Scholar] [CrossRef]
  24. Huang, K.Y.; Chen, M.C. A Novel Method of Identi-fying Paddy Seed Varieties. Sensors 2017, 17, 809. [Google Scholar] [CrossRef]
  25. Nirmalan, V.E.; Nawarathna, R.D.; Manivannan, S. Comparative Analysis of Different Features and Encoding Methods for Rice Image Classification. In Proceedings of the International Conference on Information and Automation, Colombo, Sri Lanka, 21–22 December 2018; pp. 1–5. [Google Scholar] [CrossRef]
  26. Pourdarbani, R.; Sabzi, S.; Garciaamicis, V.M.; Garciamateos, G.; Molinamartinez, J.M.; Ruizcanales, A. Automatic classification of chickpea varieties using computer vision techniques. Agronomy 2019, 9, 672. [Google Scholar] [CrossRef] [Green Version]
  27. Chaugule, A.; Mali, S.N. Evaluation of texture and shape features for classification of four paddy varieties. J. Eng. 2014, 2014, 617263. [Google Scholar] [CrossRef] [Green Version]
  28. Wu, A.; Zhu, J.H.; Yang, Y.L.; Liu, X.P.; Wang, X.S.; Wang, L.; Zhang, H.; Chen, J. Classification of corn kernels grades using image analysis and support vector machine. Adv. Mech. Eng. 2018, 10. [Google Scholar] [CrossRef] [Green Version]
  29. Kiratiratanapruk, K.; Sinthupinyo, W. Color and texture for corn seed classification by machine vision. In Proceedings of the International Symposium on Intelligent Signal Processing and Communication Systems, Chiang Mai, Thailand, 7–9 December 2011; pp. 1–5. [Google Scholar] [CrossRef]
  30. Li, X.M.; Dai, B.S.; Sun, H.G.; Li, W.N. Corn classification system based on computer vision. Symmetry 2019, 11, 591. [Google Scholar] [CrossRef] [Green Version]
  31. Abbaspourgilandeh, Y.; Molaee, A.; Sabzi, S.; Nabipur, N.; Shamshirband, S.; Mosavi, A. A combined method of image processing and artificial neural network for the identification of 13 iranian rice cultivars. Agronomy 2020, 10, 117. [Google Scholar] [CrossRef] [Green Version]
  32. Otsu, N. A Threshold Selection Method from Gray-Level Histograms. In Proceedings of the IEEE Transactions on Systems, Man, Cybernetics, New York, NY, USA, 1 January 1979; pp. 62–66. [Google Scholar] [CrossRef] [Green Version]
  33. Zhuang, J.J.; Hou, C.J.; Tang, Y.; He, Y.; Guo, Q.W.; Zhong, Z.Y.; Luo, S.M. Computer vision-based localisation of picking points for automatic litchi harvesting applications towards natural scenarios. Biosyst. Eng. 2019, 187, 1–20. [Google Scholar] [CrossRef]
  34. Sith, A.R. Color gamut transform pairs. In Proceedings of the International Conference on Computer Graphics and Interactive Techniques, Bologna, Italy, 21–23 September 1978; Volume 12, pp. 12–19. [Google Scholar]
  35. Wang, F.; Liu, F.; Zhang, Y.Y.; Zhang, A.; Cao, Y.Z.; Li, J.Q.; Zhang, S.B. The study of applying CIE 1976 (L*a*b*) colour space in the measurement of colour of wine. Sino-Overseas Grapevine Wine 2015, 4, 6–11. [Google Scholar] [CrossRef]
  36. Chen, Y.Y.; Hou, C.J.; Tang, Y.; Zhuang, J.J.; Lin, J.T.; He, Y.; Guo, Q.W.; Zhong, Z.Y.; Lei, H.; Luo, S.M. Citrus tree segmentation from UAV images based on monocular machine vision in a natural orchard environment. Sensors 2019, 19, 5558. [Google Scholar] [CrossRef] [Green Version]
  37. Ojala, T.; Pietikainen, M.; Maenpaa, T. Multiresolution gray-scale and rotation invariant texture classification with local binary patterns. IEEE Trans. Pattern Anal. Mach. Intell. 2002, 24, 971–987. [Google Scholar] [CrossRef]
  38. Choi, S.W.; Lee, C.K.; Lee, J.M.; Park, J.H.; Lee, I.B. Fault detection and identification of nonlinear processes based on kernel PCA. Chemometr. Intell. Lab. 2005, 75, 55–67. [Google Scholar] [CrossRef]
  39. Zhuang, J.J.; Hou, C.J.; Tang, Y.; He, Y.; Guo, Q.W.; Miao, A.M.; Zhong, Z.Y.; Luo, S.M. Assessment of external properties for identifying banana fruit maturity stages using optical imaging techniques. Sensors 2019, 19, 2910. [Google Scholar] [CrossRef] [Green Version]
  40. Cheng, H.; Shi, Z.X.; Feng, J.; Li, Y.N.; Yin, H.J. Corn embryo parameters optimization and varieties identification research. J. Chin. Cereals Oils Assoc. 2014, 29, 22–26. [Google Scholar]
  41. Muhameed, A.S.; Saleh, A.M. Classification of some Iraqi soils using discriminant analysis. IOSR J. Agric. Vet. Sci. 2014, 7, 31–39. [Google Scholar] [CrossRef]
Figure 1. Images acquired from 7 cultivars of sweet corn seeds: (a) Orlando, (b) Beiyasi, (c) Jingketian 183, (d) Jingtian 218, (e) Suitian 1, (f) CT76, (g) Lilixiangtian.
Agronomy 10 01268 g001
Figure 2. Optical image acquisition system.
Agronomy 10 01268 g002
Figure 3. Flow diagram of the performance evaluation for cultivar classifications of sweet corn seeds based on optical images. SDA, KPCA, NB and K-NN represent stepwise discriminant analysis, kernel principal component analysis, naïve Bayes and K-nearest neighbor, respectively.
Agronomy 10 01268 g003
Figure 4. Foreground region segmentation of sweet corn seed: (a) image of sweet corn seeds, (b) magnification of a single seed, (c) the grayscale image of one seed, (d) the grayscale histogram, (e) binary image of one seed, (f) the image obtained after morphological postprocessing.
Agronomy 10 01268 g004
Figure 5. (a) Linear discriminant analysis (LDA) scatter plot of samples using color and shape features, (b) LDA scatter plot of samples using texture features.
Agronomy 10 01268 g005
Figure 6. Average accuracy of the k-nearest neighbor (K-NN) classifier based on features selected by genetic algorithm (GA) (std of 0.03–0.04).
Agronomy 10 01268 g006
Figure 7. Principal component analysis (PCA) scatter plot of samples using features from the embryo side.
Agronomy 10 01268 g007
Table 1. Optical feature variables of sweet corn seeds.
SymbolVariableSymbolVariableSymbolVariable
c1Mean of Rc12Std of Bs4Short axis
c2Mean of Gc13Std of Cbs5Aspect ratio
c3Mean of Bc14Std of Crs6Rectangularity
c4Mean of Cbc15Std of Hs7Circularity
c5Mean of Crc16Std of Ss8Shape complexity
c6Mean of Hc17Std of a*t1~t4Contrast 1
c7Mean of Sc18Std of b*t5~t8Correlation 2
c8Mean of a*s1Perimetert9~t12Energy 3
c9Mean of b*s2Areat13~t16Entropy 4
c10Std of Rs3Long axist17~t26LBP feature 5
c11Std of G
1: t1, t2, t3 and t4 respectively represent the contrast obtained by the GLCM at four different directional angles: 0°, 45°, 90° and 135°. 2: t5~t8 respectively represent the correlations obtained by the GLCM at four different directional angles: 0°, 45°, 90° and 135°. 3: t9~t12 respectively represent the energy obtained by the GLCM at four different directional angles: 0°, 45°, 90° and 135°. 4: t13~t16 respectively represent the entropy obtained by the GLCM at four different directional angles: 0°, 45°, 90° and 135°. 5: t17~t26 represent the distribution probability of the 10 LBP coded features.
Table 2. Comparison of class separability based on optical features of sweet corn seeds.
Side\FeatureC∪S∪T 1C∪S 2C∪T 3S∪T 4
embryo side0.6510.8540.6180.562
nonembryo side0.4760.7500.4210.381
combination0.5590.8000.5130.466
1. C∪S∪T represents the combination of all 52 optical feature variables. 2. C∪S represents a total of 26 features of color and shape combinations. 3. C∪T represents a total of 44 features of color and texture combinations. 4. S∪T represents a total of 34 features of shape and texture combinations.
Table 3. Selected features of sweet corn seeds based on stepwise discriminant analysis (SDA) and GA algorithms.
Property\AlgorithmsSDAGASDA∩GA 1
Colorc1, c3, c4, c7, c9, c10, c11, c13, c15, c16, c17, c18c1, c6, c9, c14, c16, c17, c18c1, c9, c16, c17, c18
Shapes1, s4, s5, s7, s8s4, s5, s8s4, s5, s8
Texturet1, t2, t7, t8, t14, t17, t21t5-
1 SDA∩GA represents common features selected by the SDA and GA algorithms.
Table 4. Cultivar classification performance based on embryo-side features of sweet corn seeds.
Total VariablesSDAGAPCAKernel KPCA (KPCA)
K-NN80.00%81.43%81.43%74.29%71.43%
Naïve Bayes (NB)74.29%82.86%77.14%67.14%78.75%
LDA88.57%90.00%88.57%67.14%71.43%
SVM85.71%87.14%87.14%68.57%70.00%
Table 5. ANOVA results for the classification accuracy of sweet corn seed cultivars.
SourceDOFAdj SSAdj MSFpContribution/%
Feature reduction algorithms4808.53202.139.440.00170.89
Classification algorithms375.2225.071.170.3616.59
Residual error12256.8621.40 22.52
Total191140.6 100
Table 6. Confusion matrix for sweet corn seed classification based on the SDA+K-NN model.
V1V2V3V4V5V6V7Accuracy
V1800002080%
V201000000100%
V300100000100%
V4001800180%
V5000081180%
V6700003030%
V700000010100%
Table 7. Confusion matrix for sweet corn seed classification based on the SDA+NB model.
V1V2V3V4V5V6V7Accuracy
V1800002080%
V201000000100%
V300100000100%
V4001810080%
V5001060360%
V6400006060%
V700000010100%
Table 8. Confusion matrix for sweet corn seed classification based on the SDA+LDA model.
V1V2V3V4V5V6V7Accuracy
V1800002080%
V201000000100%
V300100000100%
V4000801180%
V5001090090%
V6200008080%
V700000010100%
Table 9. Confusion matrix for sweet corn seed classification based on the SDA+SVM model.
V1V2V3V4V5V6V7Accuracy
V1700003070%
V201000000100%
V300100000100%
V4001900090%
V5001090090%
V6300007070%
V7010000990%

