Article

Growth, Nutritional Quality and Health-Promoting Compounds in Chinese Kale Grown under Different Ratios of Red:Blue LED Lights

College of Horticulture, South China Agricultural University, Guangzhou 510642, China
*
Author to whom correspondence should be addressed.
Agronomy 2020, 10(9), 1248; https://doi.org/10.3390/agronomy10091248
Submission received: 3 July 2020 / Revised: 14 August 2020 / Accepted: 14 August 2020 / Published: 25 August 2020
(This article belongs to the Special Issue Role of Vertical Farming in Modern Horticultural Crop Production)

Abstract

:
Chinese kale (Brassica alboglabra Bailey) is one of the healthiest vegetables which is rich in health-promoting phytochemicals, including carotenoids, vitamin C, amino acid, glucosinolates, anthocyanin, flavonoids and phenolic compounds. The effects of different LEDs (white LED, 8R1B (red:blue = 8:1), 6R3B (red:blue = 6:3)) on nutritional quality in flower stalks and leaves of Chinese kale were investigated in this study. 8R1B and 6R3B were more effective than white LED light for improvement of growth and quality of Chinese kale. Flower stalk contained a higher content of nutritional compounds than leaves in Chinese kale. 8R1B significantly promoted plant growth, accumulation of biomass and soluble sugar content in flower stalks. In contrast, 6R3B significantly reduced plant dry matter, but it promoted nutritional compounds accumulation in flower stalks, such as soluble proteins, total glucosinolate, total anthocyanin, flavonoid, antioxidant activity. In addition, 6R3B enable to increase the amount of sourness and umami tasty amino acids, as well as precursor amino acids of glucosinolate. Accumulation balance of biomass and nutritional compounds is related to the ratio of red to blue light. Generally, 6R3B was more conducive to the enrichment of health-promoting compounds, as well as umami in Chinese kale.

1. Introduction

Chinese kale (Brassica alboglabra Bailey) is an original Chinese leafy vegetable of the Brassicaceae family. It was widely natural distributed in South China and Southeast Asia, a small amount in Japan, Europe and America [1]. Flower stalks are the common edible organ of Chinese kale, which is crispy and contain a substantial amount of antioxidants and nutritional compounds, such as vitamin C, phenolic compounds, carotenoids, amino acid, and glucosinolates, etc. [2,3,4].
Since LED was introduced in plant cultivation, studies about the applicability of LED for indoor cultivation have grown dramatically [5,6,7]. At the same time, vertical farms are widely being used in Asia, North-America and Europe [8,9,10,11]. Quality characteristics were more possible regulated through regulating environmental conditions inside the vertical farming [7,8]. Red LED light was important for the development of the photo-morphogenesis, while blue could affect chlorophyll concentrations, photo-morphogenesis, stomatal opening, and antioxidant accumulation [12,13]. Supplemental red light increased phenolic content, and blue light enhanced accumulation of anthocyanins and carotenoids in baby leaf lettuce [14].
Blue LED light was more beneficial for the production of total phenolic compounds than white LED light [15,16]. The combination of red and blue LEDs exhibits a relatively high production efficiency compared to monochromatic LEDs of the same light intensity [17,18,19]. A red:blue ratio of 0.7 was necessary for proper plant development and improved nutraceutical properties in sweet basil [20]. A red:blue ratio of three improved growth performances, accumulation of leaf chlorophyll and flavonoids, uptake of nitrogen, phosphorus, potassium and magnesium, as well as both energy and land surface use efficiency in lettuce [21] and sweet basil [22].
The application of colorful LED light was good practice for the accumulation of nutritional phtyochemicals in Chinese kale sprouts, a combination of the most optimal light ratio could be strategically applied to improve the health-promoting compounds and antioxidant capacity of Chinese kale sprouts [23]. A pre-harvest red light could enhance the accumulation of total phenolics and maintained a higher level of antioxidant activity, also postponed the degradation of total glucosinolates during postharvest storage in Chinese kale sprout [4]. The effects of LEDs on the growth and nutritional value of Chinese kale sprout have been widely investigated. However, there is no report in adult plants of Chinese kale.
In this study, Chinese kale plants were cultured under different red:blue LED lights until marketable size (the inflorescence as tall as the apical leaves), to investigate the growth performance, nutritional quality and antioxidant activity in plants. This study will help to provide a complete understanding of Chinese kale and define the optimal LEDs for obtaining nutraceutical rich Chinese kale.

2. Materials and Methods

2.1. Culture Conditions and Light Treatments

This experiment was conducted in South China Agricultural University. Chinese kale (Brassica alboglabra Bailey. Cv. Lvbao) with 2–3 true leaves transplanted into a growth chamber (GXM-358-4, Ningbo Jiangnan Instrument Corp., China) under day/night temperature 28–35 °C/20–23 °C, the relative humidity of 60–70%, ambient CO2 concentration during the experimental period. Plants were cultivated in a container (61 cm × 42 cm × 8 cm) filled with nutrient solution: Ca(NO3)2 236.25 mg/L, KNO3 151.75 mg/L, NH4PO4 28.75 mg/L, MgSO4 123.25 mg/L, and pH ≈ 6.0, and renewed every 10 days. Aeration switched on for 15 min every hour.
After transplanting, plants were illuminated under different ratios of LED light quality, including 8R1B (red:blue = 8:1) and 6R3B (red:blue = 6:3), and white LEDs were used in the control, respectively (Figure 1). The percentage of blue, green and red photon flux of the white LED was 23%, 50% and 16%, respectively. LED lights were produced by Kedao Co. (Huizhou, China; white: 440–660 nm, red light: 630–660 nm, blue light: 450–460 nm). Plants were illuminated for 12 h per day (7:30–19:30). The light intensity of vertical from above artificial photosynthetic photon flux was maintained at 120 ± 10 μmol·m−2·s−1. The light spectrum of each light source was analyzed using a spectrometer (OceanOptics USB2000+, UK).
A total of four growth chambers were used in this experiment. Each chamber contained three layers correspondingly to three light treatments. Twenty-two plants were cultivated in two individual containers placed on each layer in chamber. Twenty-two plants were divided into two equal parts for freezing and drying samples, respectively. Eleven plants were used for dry weight analysis and drying samples. Each biological repeat of the freezing sample was taken three times (three repeats) from four growth chambers among eleven plants. Plants in all treatments were sampled after 34 days of transplanting, and 80% of plants were marketable size.

2.2. Growth Characteristics Measurement

Chinese kale plant height, leaf length and width were measured by a ruler, flower stalk diameter (middle of the stalk) was measured by Vernier immediately after harvesting. Samples were dried in an oven at 70 °C for 48 h to determine dry weights and for β-carotene measurement. Dry and fresh weight were measured by electronic balance.

2.3. Sample Extraction

Sub-samples of two edible parts of basal leaves and flower stalks of Chinese kale were separated, and separately frozen in liquid nitrogen and stored at −80 °C until for nutritional quality, health-promoting compounds, and antioxidant activity analysis. Chlorophyll and carotenoid content and amino acids content were measured for the average content of two parts.

2.4. Pigments Content

Chlorophyll and carotenoid content were measured according to Gratani et al. [24] 1.0 g frozen-dried samples were homogenized by 20 mL of 80% acetone. The absorbance at 663 nm and 645 nm and 440 were determined by a UV-spectrophotometer (Shimadzu UV-16A, Shimadzu, Corporation, Kyoto, Japan). The Chlorophyll and carotenoid content were calculated according to Song et al. [25]. β-carotene extraction was performed according to the procedures [26]. One gram of dried samples were dissolved in 5 mL acetone and 5 mL petroleum ether, and centrifuged at 5000 rpm for 5 min. The supernatant was dried, then the residue was dissolved with vigorous shaking in 10 mL hexane, and filtered through a 0.45 µm millipore filter then analyzed by using 2000 HPLC system (Hitachi, Japan). Chromatographic column: ODS2 C18 (4.6 mm × 150 mm, 5 μm). Detection of wavelength was at 450 nm and the column temperature was 35 °C. The mobile phase was methanol: tetrahydrofuran (THF, 75: 25, v: v) at a flow rate of 1 mL⋅min−1.

2.5. Nutritional Quality

Soluble sugar content was measured according to the procedures described by Song [27] and Wang [28] with some modifications. Two grams of frozen-dried samples were homogenized in 5 mL 90% ethanol, then centrifuged at 5000 rpm for 10 min. The residue was rewashed with 5 mL 90% ethanol and centrifuged at 5000 rpm for 10 min. The supernatant was then dried in a nitrogen stream in a 50 °C water bath and redissolved in double-distilled water. Sample of the resulting solution was filtered through millipore filter (0.45 μm) then analyzed by using Agilent 1200 HPLC system (Agilent Technologies, Waldbronn, Germany) with Refractive Index Detector (RID G1362A; Agilent Technologies). Chromatographic column: Coregel 87 Transgenomic (CHO-99-58600), the mobile phase was ultrapure water at a flow rate of 0.6 mL⋅min−1, and the column temperature was 80 °C.
Nitrate content was measured colorimetrically. One gram of frozen-dried samples were soaked in a tube with 10 mL distilled water. After 30 min water bath at 80 °C, the extract was centrifuged at 13,000 rpm for 10 min, then 0.2 mL of supernatant was mixed with 0.8 mL of 5% salicylic acid and 19 mL of 4 mol⋅L−1 NaOH. After cooling to ambient temperature, the nitrate content was measured at 410 nm by a UV-spectrophotometer.
Vitamin C content was determined, as described in our previous report [29]. One gram of frozen-dried samples were extracted with 5 mL of 5% trichloroacetic acid (TCA). The homogenate was centrifuged at 10,000 rpm for 10 min at 4 °C, and the supernatant was used for vitamin C analysis.
Soluble protein content was measured by Coomassie brilliant blue method [30]; 0.5 g frozen-dried samples were homogenized with liquid nitrogen; the 3 mL of a phosphate-buffered solution was added. The extract was centrifuged at 13,000 rpm for 15 min at 4 °C; 0.1 mL of the supernatant was added with 4.9 mL Coomassie brilliant blue G-250 solution. The absorbance at 595 nm was determined by a UV-spectrophotometer.

2.6. Amino Acids Composition and Content

Amino acid composition and content were analyzed by an L-8800 Amino acid Analyzer (Hitachi, Corp., Tokyo, Japan). Frozen-dried samples were hydrolyzed with 6 mL 6N HCl for 24 h at 110 °C. The hydrolysate was diluted to 50 mL, and then 1 mL of the diluted hydrolysate was transferred to a centrifuge tube and put into a rotary evaporator. The residue was completely dissolved with vigorous shaking in 1 mL of 0.02 mol⋅L−1 HCl, followed by centrifugation at 14,000 rpm for 15 min. The supernatant was put into an auto-sampler bottle and analyzed using the amino acid auto-analyzer. 855–350 chromatographic column (4.6 mm × 60 mm; Hitachi, Corp., Japan), and the column temperature was 134 °C, detection of wavelength was at 440 nm and 570 nm.

2.7. Health-Promoting Compounds Content

Total glucosinolates (TG) content was determined according to Heaney et al. [31]; 0.5 g frozen-dried samples were dissolved into 15 μL methanol, and then incubated at 80 °C for 5 min, then redissolved in 10 mL double-distilled water. One milliliter of supernatant was added to 2 mL of 4 mmol⋅L−1 Palladium chloride solution. Extract absorbance was recorded at 540 nm with a UV-spectrophotometer.
Total anthocyanin (TA) content was measured according to Rapisarda et al. [32]; 0.5 g frozen-dried samples were immersed in 10 mL 1% (v/v) HCl–methanol for 2 h. Anthocyanins in the extract were determined with a spectrophotometer and presented as the difference in absorbance at 530 nm and 600 nm. Total phenolic (TP) compounds were measured according to previous protocals with minor modification [33]. Twenty milligrams of frozen-dried samples were homogenized with 6 mL of 30% ethanol, then incubated at 80 °C for 1 h in the dark. After centrifugation at 1000 rpm for 10 min and the supernatant was collected. Phenolic compounds were determined using Folin–Ciocalteu reagent with a spectrophotometer at 760 nm.
Content of the Kaempferol (FK) and Quercetin (FQ) flavonoids were measured according to Jia et al. [34]. The mixed solution of 11.5 mL alcohol (30%) and 0.7 mL NaNO2 (5%) was added to 1 mL extract solution. After 5 min at 25 °C, 30 µL of 10% AlCl3 was added, solution allowed to stand for more 5 min. The reaction mixture was treated with 200 µL NaOH and made up to a volume of 1 mL with distilled water. The absorbance of the mixture was determined at 510 nm with a UV-spectrophotometer. The flavonoids content was calculated from a quercetin standard as described in our previous research [29].
Glutathione content (GSH) content was measured according to Ellman [35] with minor modification. One gram of frozen-dried samples were homogenized with EDTA-TCA. The residue was dissolved in a constant volume of 25 mL in a volumetric flask, with vigorously shake, and then filtered. The filtrate was used as extraction solution; 1.5 mL of 0.15 mol⋅L−1 NaOH solution was added into 0.5 mL extraction solution, shaken well, and then added 0.5 mL formaldehyde, shaken well and set aside for 2 min. Add 2.5 mL DTNB solution, then placed in a 25 °C water bath for 5 min, the absorbance was determined at 412 nm.

2.8. Antioxidant Activity

The 2,2-diphenyl-1-picrylhydrazyl (DPPH) radical scavenging rate assay was carried out as described by former research [29]; 0.5 g frozen-dried samples were added into 2.5 mL methanol solution of DPPH. The absorbance was recorded at 517 nm with a spectrophotometer after the mixture was vigorously shaken and in darkness for 30 min.
The Ferric reducing ability of plasma (FRAP) assay was carried out as described by former research [29]; 3.6 mL of the mixed solution containing acetate buffer (0.3 mol·L−1), TPTZ (10 mmol·L−1) and FeCl3 (20 mmol·L−1) = 10:1:1 was added into 0.4 mL sample solution. The mixture was left at 37 °C for 10 min. The absorbance was taken at 593 nm by a UV-spectrophotometer.

2.9. Statistical Analysis

Significant differences among the treatments were determined by analysis of variance (ANOVA) followed by Duncan’s multiple range tests of SPSS 17.0 at p ≤ 0.05. All the assay was carried out in triplicates.

3. Results

3.1. Plant Growth and Biomass Production as Affected by Light Treatment

The growth of Chinese kale plants was significantly affected by different light treatments (Figure 1, Table 1). Shoot elongation was highly promoted by 6R3B and 8R1B compared to white LED, the highest plant height was observed in 8R1B treatment, followed by 6R3B, then the white LED (Table 1). The number and length of leaves were significantly higher for plants grown in 8R1B treatment in comparison with plants grown in 6R3B and white. Furthermore, 8R1B light treatment produced significantly more biomass compared to the other two treatments, total plant fresh weight increased by 14.8% than the white LED and 21.4% than the 6R3B, respectively. Flower stalk diameter and leaf size significantly decreased under 6R3B as compared with white, and dry matter in 6R3B was significantly reduced (Table 1).

3.2. Effects of Light Treatments on Pigment Content in Chinese Kale

The content of Chlorophyll a, b and a + b of Chinese kale grown under 6R3B and 8R1B were significantly decreased, while the content of β-carotene and carotenoid increased (Table 2). The increased proportion of red light reduced chlorophyll content, but increased carotenoids content. In comparison with white LED treatment, carotenoid content and β-carotene content increased by 31.3%, 28.5% in 8R1B, respectively (Table 2).

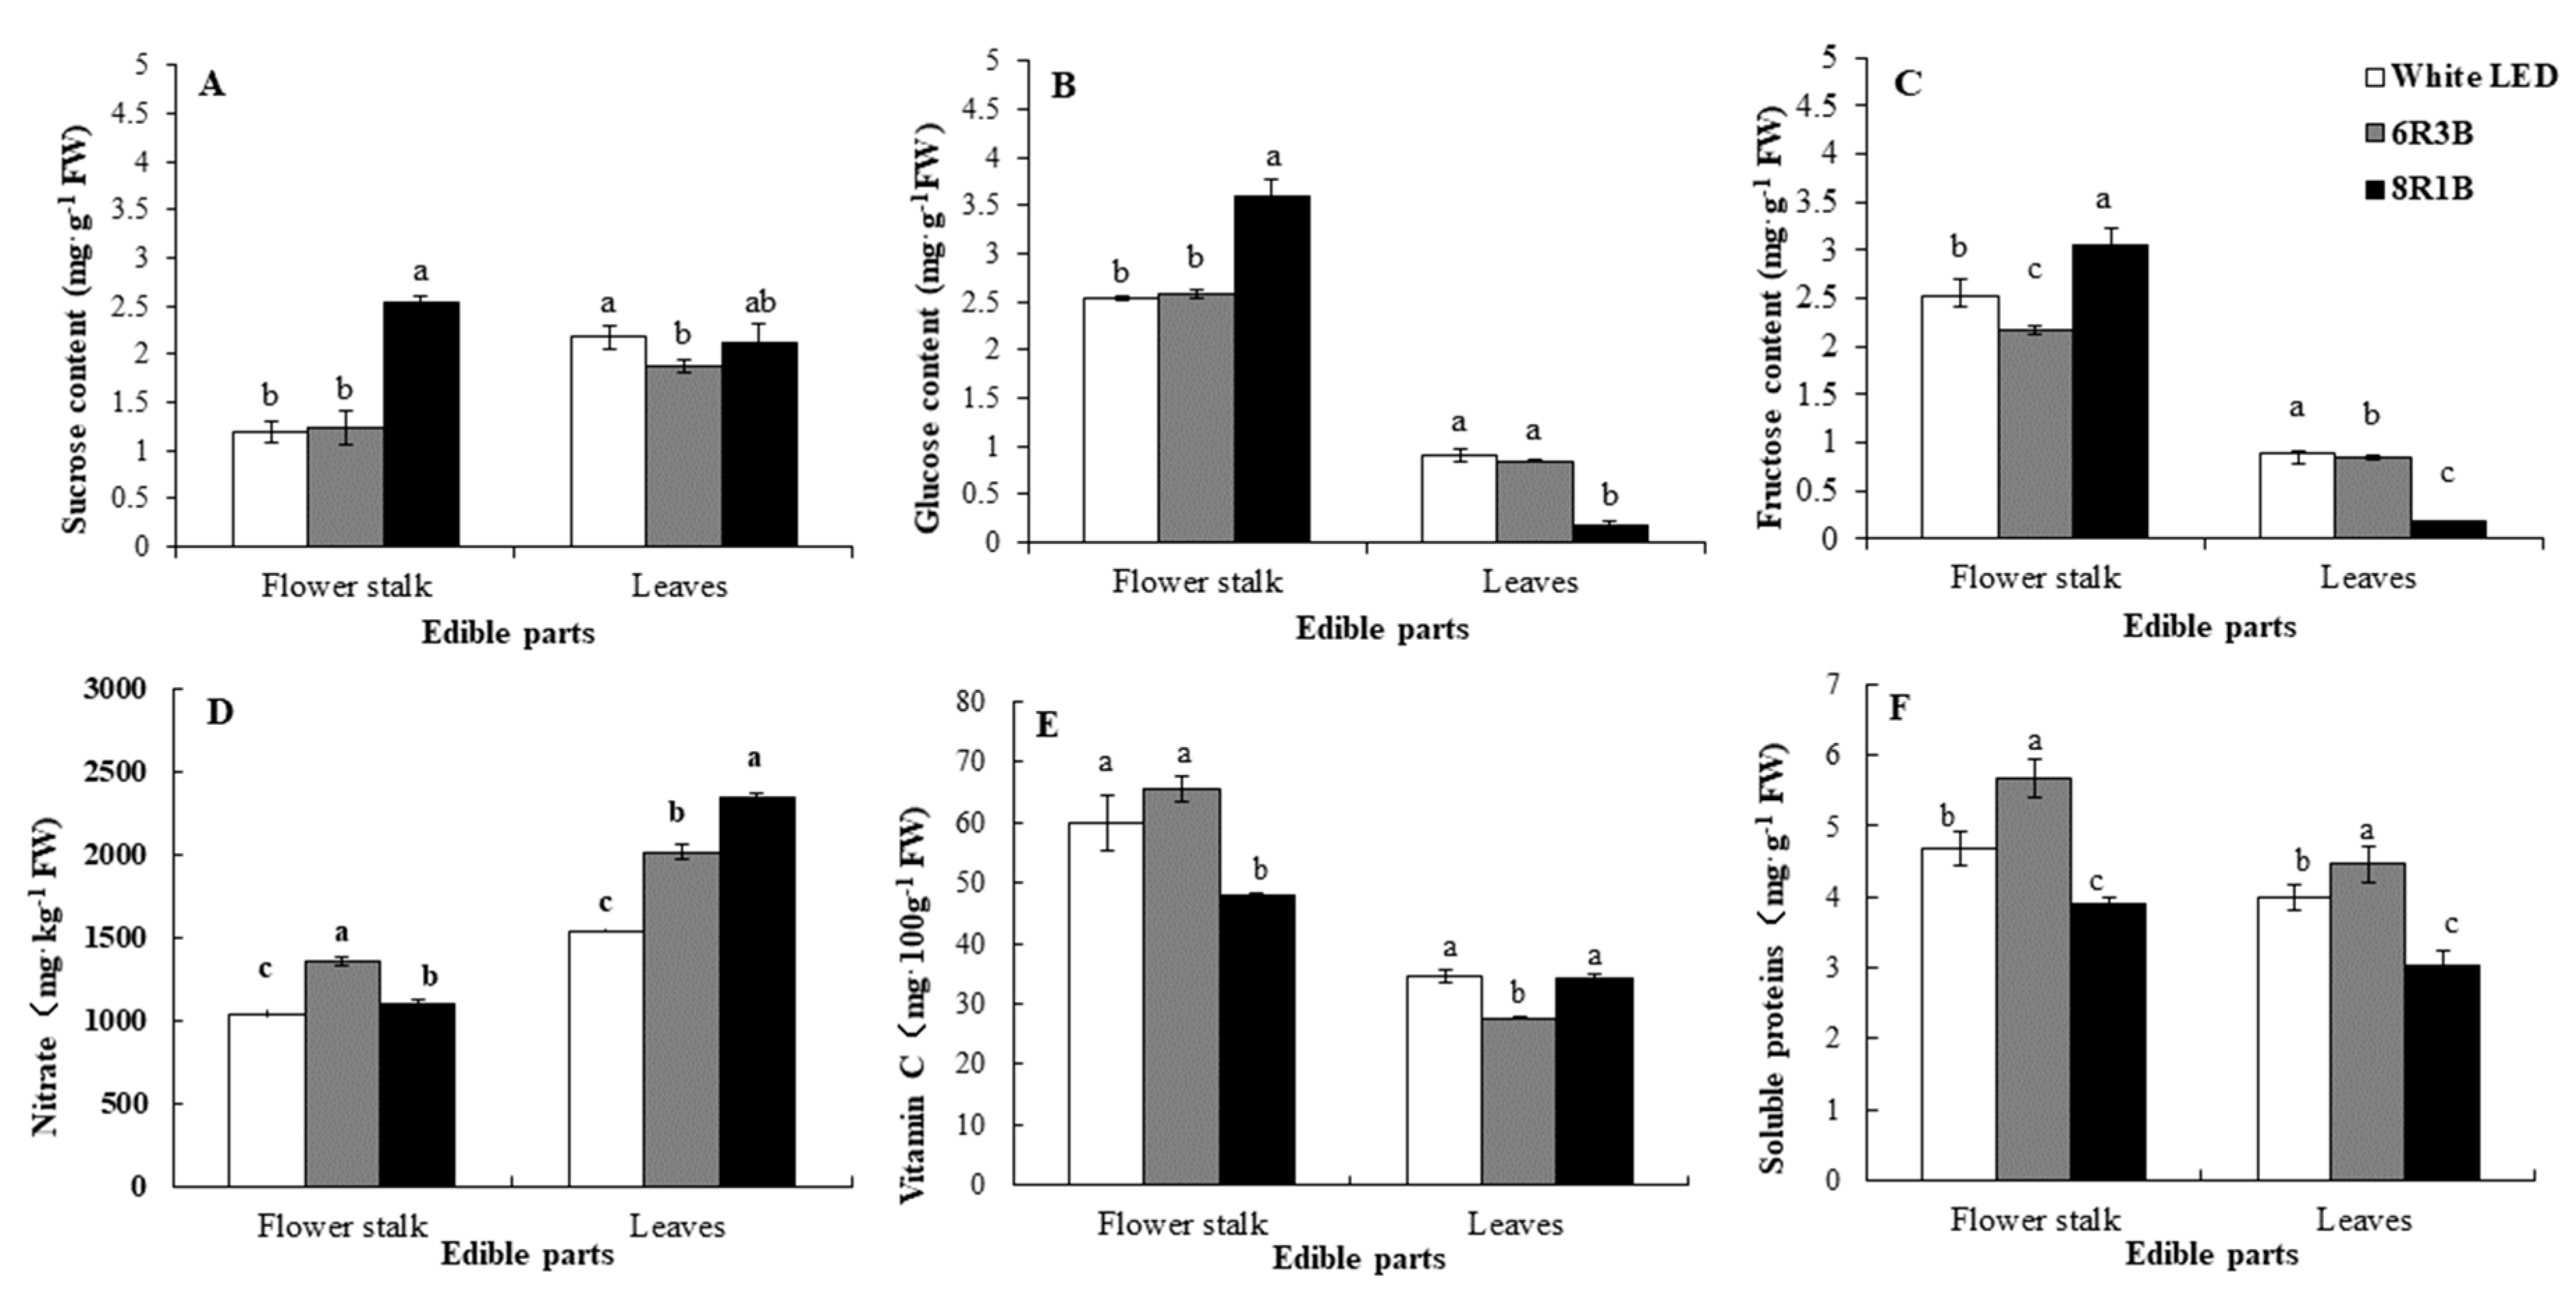
3.3. Effects of Light Treatments on Nutritional Quality in Chinese Kale

The contents of sucrose, glucose and fructose in both parts of Chinese kale varied under different light treatments (Figure 2A–C). Compare with white LED treatment, 8R1B significantly promoted sugar accumulation in flower stalks, while reduced glucose and fructose content in leaves. Increased proportion of red light increased sugar content in flower stalks, the content of sucrose, glucose and fructose under 8R1B significantly increased by 2-fold, 40% and 41%, respectively as compared with 6R3B.
In Chinese kale, flower stalks contained less nitrate than leaves (Figure 2D). The nitrate content of Chinese kale in 8R1B and 6R3B treatment were significantly higher than those under white LED both in flower stalks and leaves. Under a higher proportion of red light treatment, there were lower nitrate and vitamin C content in flower stalks, while higher contents in leaves. Vitamin C content in flower stalks under 6R3B showed the same level as white LED (Figure 2E), while vitamin C content in leaf under 6R3B was significantly lower than other treatments. Both in flower stalks and leaves, the highest soluble protein content was observed under 6R3B, followed by white LED treatment, then 8R1B treatment (Figure 2F).

3.4. Effects of Light Treatments on Amino Acid Content in Chinese Kale

Amino acids in plants are categorized as essential and non-essential types. The essential amino acids (EAAs) are those that cannot be synthesized by the human body, only by plants, while the non-essential amino acid (NEAAs) can be synthesized by both human body, as well as plants. In this study, a total of seven EAAs and eighteen NEAAs were identified and quantitatively determined in Chinese kale (Table 3). The content of total amino acids under 6R3B and 8R1B were significantly higher than those in white LED treatment. The highest total EAAs content was detected in 6R3B, followed by 8R1B, then white LED treatment. To compare with white LED, total EAAS increased by 51.6% in 6R3B and 34.6% in 8R1B, respectively. The most abundant three amino acids followed a trend as Arg > Glu > Asp (Table 3). Arg content increased significantly under 8R1B, whereas, the content of Glu and Asp was significantly enhanced under 6R3B. In total amino acids, sourness and umami acid (Arg + Glu) accounted for 31%, 34% and 31%, respectively in white LED, 6R3B and 8R1B. Total bitterness amino acids accounted for 27%, 33% and 31%, while total sweetness acids accounted for 25%, 20% and 25%, respectively in white LED, 6R3B and 8R1B. Thus, 6R3B enable to induce sourness and umami taste, but reduced sweetness. Both 6R3B and 8R1B enable to induce bitterness. The total amount of the precursor amino acids of glucosinolate (Cys, Val, Met, Ile, Leu, Phe) were significantly increased in 6R3B, followed by 8R1B, last was white LED.

3.5. Effects of Light Treatments on Health-Promoting Compounds in Chinese Kale

The content of health-promoting compounds in both flower stalks and leaves of Chinese kale was quantitatively determined (Figure 3), including total glucosinlate (TG), total anthocyanin (TA) and flavonoid of kaempferol (FK) and quercetin (FQ), total phenolic compounds (TP) and glutathione (GSH). There were higher contents of health-promoting compounds in flower stalks than in leaves. In comparison with white LED treatment, 8R1B and 6R3B treatments prominently induce the accumulation of TG and TA. In flower stalks, the highest content of TG and TA was observed under 6R3B, followed by 8R1B. In leaves under treatment of 8R1B and 6R3B exhibited higher FK and FQ content than the white LED. FK and FQ content in flower stalks increased under 6R3B, but reduced significantly under 8R1B. It suggested that a higher proportion of blue light could induce increasing content of TG and TA. The TP content in leaves was also enhanced by 6R3B and 8R1B, however, reduced in flower stalks. A higher proportion of red light promotes GSH accumulation in both flower stalks and leaves.

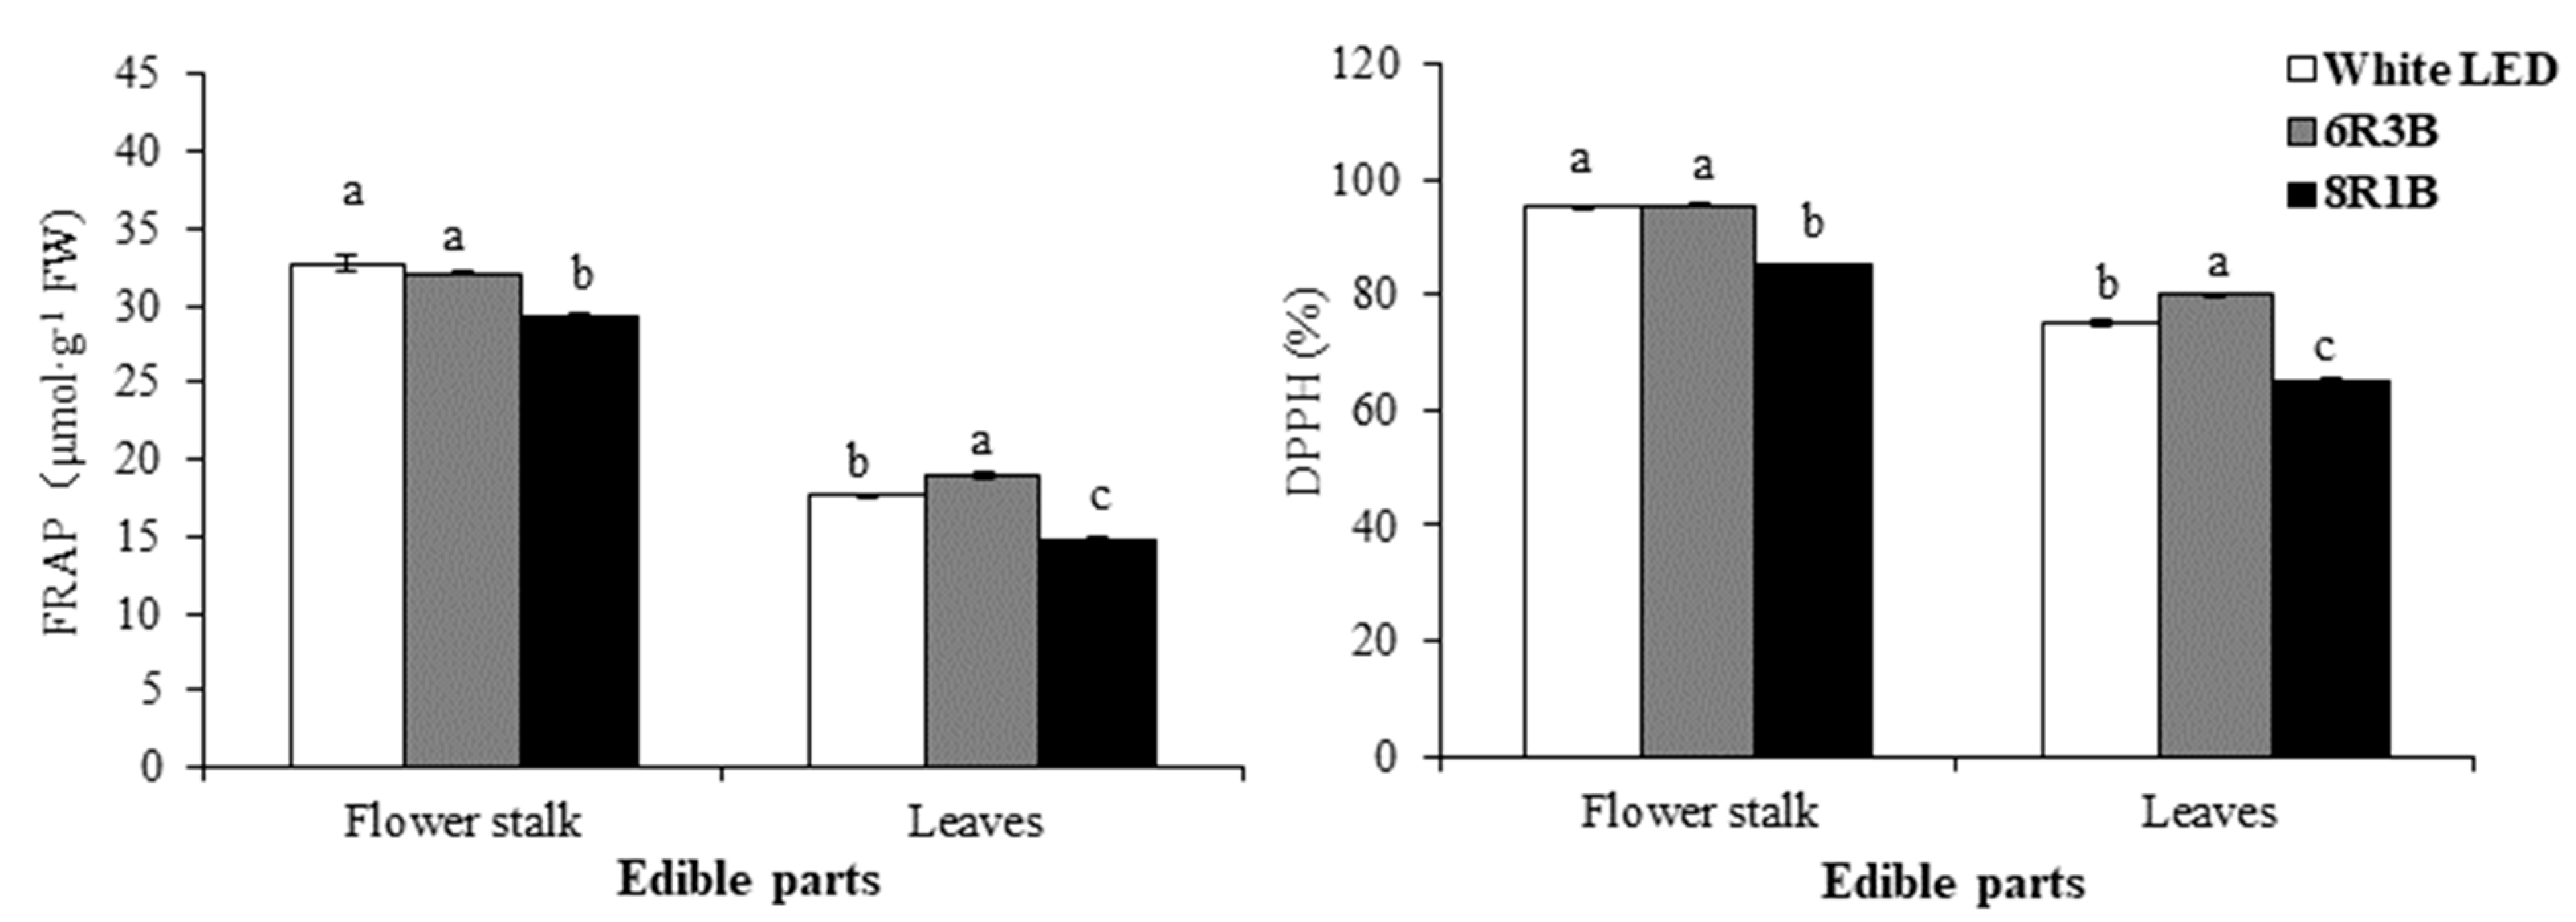
3.6. Effects of Light Treatments on Antioxidant Activity in Chinese Kale

The DPPH radical scavenging rate and FRAP assays were used to evaluate the antioxidant activity in Chinese kale. There was higher antioxidant activity in flower stalks than leaves (Figure 4). In the flower stalks of Chinese kale, DPPH and FRAP under 6R3B and white LEDs was significantly higher than 8R1B; and in leaves of Chinese kale, antioxidant activity under 6R3B was significantly higher than under white LEDs and 8R1B.
Referring to significant differences of all parameters in the above tables and figures, we summarize the differences between 6R3B and white LED, 8R1B and white LED, 6R3B and 8R1B, as shown in Table 4. To compare with white LED and 8R1B, plant growth and yield were mildly inhibited, but the nutritional quality of Chinese kale was improved under 6R3B. In contrast, plant growth and yield were enhanced, and nutritional quality was mildly improved under 8R1B.

4. Discussion

Combination of blue and red LEDs can enhance both crop quality and yield in the production system [16,19,36]. Increasing the proportion of blue light usually reduces plant height and was regarded as an alternative retardant of plant growth as compared with red light [37]. In this study, the total fresh weight of Chinese kale was significantly promoted under 8R1B. This promotion seems to be attributed to the significant elongation of flower stalks and leaf, as well as an increasing number of leaves (Table 1). The positive effect of red light on plant growth have been reported for various crops such as perilla, chrysanthemum, tomato, poinsettia, and herbs, as well as lettuce [17,38]. Total fresh and dry mass accumulation of lettuce [39] and pepper [40] under red LEDs was less than red combined with blue LEDs. Blue light photon flux between 15 and 30 μmol·m−2·s−1 was an acceptable level for lettuce growth [39]. Once the blue light fraction was satisfied, light quality has nearly no effect on single leaf net photosynthesis [5,41]. Furthermore, our previous research indicated that the fresh and dry weights of Chinese kale plants were significantly promoted by the lower intensity of supplemental blue light ranged from 50 to 100 μmol·m−2·s−1 as compared with a higher range from 100–150 μmol·m−2·s−1 [42]. In this study, blue light photon flux was about 13.3 μmol·m−2·s−1 in 8R1B, and 39.9 μmol·m−2·s−1 in 6R3B. Therefore, the growth and biomass accumulation in Chinese kale may be sensitive to a lower blue light fraction or higher red light fraction in 8R1B.
The chlorophyll content is highly correlated with plant growth. In this study, 8R1B reduced chlorophyll content, but increased carotenoid content (Table 2), indicating chlorophyll content is not the only indicator for plant growth. Under high PPFD (10–170 μmol·m−2·s−1), blue light could be more effective than red light in the induction of chlorophyll synthesis [43]. In this study, the highest total Chl in Chinese kale was observed under white LED, followed by 6R3B, and 8R1B the least (Table 2). Thus, white LED was more effective in the chlorophyll synthesis than 6R3B and 8R1B.
In this study, the primary metabolites identified, including soluble sugars (Figure 2A–C), nitrate, vitamin C and soluble protein (Figure 2D–F), and amino acids (Table 3), which are important parameters in evaluating the nutritional quality of vegetables. Significantly higher content of sucrose, glucose and fructose was found under 8R1B than 6R3B in flower stalks of Chinese kale (Table 2), and this was consistent with the enhanced plant growth and biomass changes. Thus, sugar accumulation under a higher proportion of red light might be due to photosynthetic carbon partitioning. It is worth noting that nitrate content in flower stalks and leaves was higher under 8R1B and 6R3B than white LED—thus, this ratio of combination LED light probably not be an ideal illumination source for Chinese kale to reduce nitrite content. Our previous research showed that, the content of nitrate significantly decreased when supplemental blue light intensity reached up to 150 μmol·m−2·s−1 in Chinese kale [42] or 50–100 μmol·m−2·s−1 in pak choi [29]. The PPFD was 120 ± 10 μmol·m−2·s−1 in different treatments in the present study. Therefore, the light intensity may be still not high enough to reduce nitrate. The role of vitamin C in photon protection could account for the higher vitamin C level under white LED [43]. Vitamin C content was higher in the presence of high light intensity during the production period [44]. In this study, white LED light was more effective for the accumulation of vitamin C than 6R3B and 8R1B, which is in agreement with the findings in Chinese kale sprouts [23]. In this study, 6R3B indicating a significant increase of soluble protein as compared with white LED, this might be attributed to nitrogen metabolism, such as nitrate assimilation (Figure 2D) in flower stalks, as well as amino acid accumulation (Table 3).
Combination light produced higher content of total amino acid than white LED in Chinese kale, 6R3B was more effective for EAA accumulation as compared with 8R1B, indicated that higher blue light proportion promoted EAA production. Amino acids are not only for protein synthesis, maintenance of nitrogen balance, physiological functions, but also closely related to the sense of taste [45]. Free amino acids play important roles eliciting characteristics tastes of vegetables, such as sweetness, bitterness, sourness and umami [46,47]. The sourness and umami amino acids are mainly Glu and Asp, but their neutral solution (pH = 7.0) has strong umami taste [47]. The sweetness amino acid includes Ser, GluNH2, Gly, Ala, Pro, Thr, and Lys. The bitterness taste mainly includes Val, Met, Ile, Leu, Phe, His, and Arg. In the present study, 6R3B induced sourness and umami, but decreased sweetness. Both 6R3B and 8R1B induced bitterness.
In this study, the total amount of the precursor amino acids of glucosinolate (Cys, Val, Met, Ile, Leu, Phe) were significantly increased in 6R3B, followed by 8R1B, last was white LED. Amino acids as the primary metabolites serve as precursors in many secondary metabolites [48]. Consequently, increased glucosinolate content under 8R1B and 6R3B may be the result of a higher content of amino acid.
Total glucosinolates (TG) are a group of secondary metabolites in Brassica vegetables, and their profiles were already investigated in various plants, as well as in Chinese kale sprouts [23,49,50]. In this study, more glucosinolates were accumulated either in flower stalks or leaves of Chinese kale grown under 8R1B and 6R3B than those under white (Figure 3). The glucosinolates are amino acid-derived metabolites in plant [51]. Extraneous amino acid changed the glucosinolates contents of Chinese kale [52], such as Met, Phe, Trp, Gly, and Glu increased the content of total indole glucosinolates, while Met, Phe, Trp, Gly, Glu, and Cys increased the glucoraphanin content [52]. In this study, the total yield of amino acids in Chinese kale grown under 6R3B and 8R1B were significantly higher than those under white LED (Table 3), which indicated a similar effect on glucosinolates content. Blue LED light significantly inhibited the accumulation of glucosinolates in shoots of Chinese kale sprout [23]. In this study, the accumulation of TG was enhanced in both flower stalks and leaves under 6R3B and 8R1B (Figure 3). The TG content in 6R3B was higher than 8R1B in flower stalks, but those in 8R1B was higher than 6R3B in leaves.
Previous studies showed that blue light was the most effective wavelengths to regulate anthocyanin biosynthesis in tomato [53,54]. Blue light promoted expression of a gene which regulates the anthocyanins pathway [55]. In this study, the increasing order of TA content of Chinese kale was white < 8R1B < 6R3B, it suggested that a higher blue proportion could enhance anthocyanin accumulation (Figure 3). Flavonoids are a group of phenolics which affect color, flavor, and fragrance of plants. In Chinese kale leaves, the content of FQ and FK was significantly enhanced under 8R1B and 6R3B, and those in flower stalks of 8R1B were less than 6R3B. Many studies have been conducted to evaluate the effect of LEDs on the accumulation of phenolics, and the results were conflicting. Blue LED light was more beneficial for the production of total phenolics than white LED light in Chinese kale and amaranth sprouts [15,23]. However, blue-LED-grown sweet basil exhibited a lower level of total phenolics than the white LED light condition [56]. In this study, a combination of red and blue light enhanced TP accumulation in leaves, while decreased in flower stalks 8R1B. Thus, flower stalks from Chinese kale contained a higher content of health-promoting compounds than leaves, whereas leaves were more sensitive to red and blue combination LED light than white LED light. Regarding the flower stalks, the higher red light proportion could be effective in improving the nutritional quality of Chinese kale.
In this study, the highest antioxidant activity of Chinese kale leaves was observed under 6R3B, followed by white, and the 8R1B least (Figure 4), indicating a higher blue ratio increased antioxidant activity. This is consistent with previous research [17,57]. Son and Oh [18] reported that higher antioxidant activity was observed in lettuce cultured under 53% red + 47% blue LED compared to the 100% red LEDs. Therefore, the effect of higher blue light ratio on the antioxidant activity should be investigated in future.
Several studies demonstrated that the combination of red and blue LED light was an effective light source for producing spinach, pepper, and lettuce biomass [58,59,60]. A green light was not only absorbed, but also drive and regulate physiological responses, and anatomical traits in plants [61]. The addition of green light to red and blue LEDs enhanced lettuce plant growth, since green light can penetrate into the plant canopy better than red or blue light [41]. In the present study, the green light adopted nearly 50% of the white LED, and also white LED treatment showed a higher number of leaf, leaf length and width, and DW compared to 6R3B (Table 1), and higher chlorophyll contents compared to both 6R3B and 8R1B (Table 2). This suggested that 50% of the green light in white LED played a vital role in leaf expansion and chlorophyll accumulation.
To summarize plant growth and biomass parameters, Chinese kale grown under 8R1B showed the highest level, followed by white LED, and the least was 6R3B, whereas the nutritional quality of Chinese kale was enhanced under 6R3B, followed by 8R1B, and the least was white LED (Table 4). Generally, 6R3B taking a small yield reduction would more favorably provide enhanced nutritional and health benefits.

5. Conclusions

In Chinese kale, flower stalks contained a higher content of antioxidants and nutritional compounds than leaves. 8R1B significantly promoted plant growth and accumulation of biomass, carotenoid, β-carotene and soluble sugar (sucrose, glucose and fructose). 6R3B was more conducive to the enrichment of nutritional compounds, such as essential amino acid, soluble protein, total anthocyanin, antioxidant activity (DPPH and FRAP), etc. In addition, 6R3B enable to increase the amount of sourness and umami tasty amino acids, as well as precursor amino acids of glucosinolate. The balance between the accumulation of biomass and nutritional compounds is related to the ratio of red and blue light. Generally, 6R3B was more conducive to the enrichment of health-promoting compounds, as well as umami in Chinese kale.

Author Contributions

Y.Z. and J.J. performed the experiment and participated in the data analysis. S.S. and W.S. drafted the manuscript. H.L. conceived of the study, and participated in its design. H.L. acquired of funding and helped to draft the manuscript. All authors have read and agreed to the published version of the manuscript.

Funding

This work was supported by the Key Research and Development Program of Guangdong (2019B020214005, 2019B020222003) and the Guangzhou Science & Technology Project (201704020058).

Conflicts of Interest

The authors declare no conflict of interest.

References

  1. Sun, B.; Liu, N.; Zhao, Y.T.; Yan, H.Z.; Wang, Q.M. Variation of glucosinolates in three edible parts of Chinese kale (Brassica alboglabra Bailey) varieties. Food Chem. 2011, 124, 941–947. [Google Scholar] [CrossRef]
  2. He, H.J.; Chen, H.; Schnitzler, W.H. Glucosinolate composition and contents in Brassica vegetables. Sci. Agric. Sin. 2002, 35, 192–197. (In Chinese) [Google Scholar]
  3. Sun, B.; Yan, H.Z.; Liu, N.; Wei, J.; Wang, Q.M. Effect of 1-MCP treatment on postharvest quality characters, antioxidants and glucosinolates of Chinese kale. Food Chem. 2012, 131, 519–526. [Google Scholar] [CrossRef]
  4. Deng, M.D.; Qian, H.M.; Chen, L.L.; Sun, B.; Chang, J.Q.; Miao, H.Y.; Cai, C.X.; Wang, Q.M. Influence of pre-harvest red light irradiation on main phytochemicals and antioxidant activity of Chinese kale sprouts. Food Chem. 2017, 222, 1–5. [Google Scholar] [CrossRef] [PubMed]
  5. Yoon, H.I.; Kim, J.S.; Kim, D.; Kim, C.Y.; Son, J.E. Harvest strategies to maximize the annual production of bioactive compounds, glucosinolates, and total antioxidant activities of kale in plant factories. Hortic. Environ. Biotechnol. 2019, 60, 883–894. [Google Scholar] [CrossRef]
  6. Kopsell, D.A.; Kopsell, D.E. Genetic and environmental factors affecting plant lutein/zeaxanthin. Agro Food Ind. Hi-Tech 2008, 19, 44–46. [Google Scholar]
  7. Kopsell, D.A.; Pantaniaopoulos, N.I.; Sams, C.E.; Kopsell, D.E. Shoot tissue pigment levels increase in ‘Florida Broadleaf’ mustard (Brassica juncea L.) microgreens following high light treatment. Sci. Hortic. 2012, 140, 96–99. [Google Scholar] [CrossRef]
  8. Goto, E. Plant production in a closed plant factory with artificial lighting. Acta Hortic. 2012, 956, 37–49. [Google Scholar] [CrossRef]
  9. Kozai, T. Resource use efficiency of closed plant production system with artificial light: Concept, estimation and application to plant factory. Proc. Jpn. Acad. Ser. B 2013, 89, 447–461. [Google Scholar] [CrossRef] [Green Version]
  10. Kozai, T. Sustainable plant factory: Closed plant production systems with artificial light for high resource use efficiencies and quality produce. Acta Hortic. 2013, 1004, 27–40. [Google Scholar] [CrossRef]
  11. Kozai, T. PFAL business and R&D in the world: Current status and perspectives. In Plant Factory: An Indoor Vertical Farming System for Efficient Quality Food Production; Academic Press: Cambridge, UK, 2015; pp. 35–68. [Google Scholar]
  12. Senger, H. The effect of blue light on plants and microorganisms. Photochem. Photobiol. 1982, 35, 911–920. [Google Scholar] [CrossRef]
  13. Saebo, A.; Krekling, T.; Appelgren, M. Light quality affects photosynthesis and leaf anatomy of birch plantlets in vitro. Plant Cell Tissue Organ Cult. 1995, 41, 177–185. [Google Scholar] [CrossRef]
  14. Li, Q.; Kubota, C. Effects of supplemental light quality on growth and phytochemicals of baby leaf lettuce. Environ. Exp. Bot. 2009, 67, 59–64. [Google Scholar] [CrossRef]
  15. Cho, J.Y.; Son, D.M.; Kim, J.M.; Seo, B.S.; Yang, S.Y.; Kim, B.W.; Heo, B.G. Effects of LEDs on the germination, growth and physiological activities of amaranth sprouts. Korean J. Hortic. Sci. Technol. 2008, 26, 106–112. [Google Scholar]
  16. Thwe, A.A.; Kim, Y.B.; Li, X.H.; Seo, J.M.; Kim, S.J.; Suzuki, T.; Chung, S.O.; Park, S.U. Effects of light-emitting diodes on expression of phenylpropanoid biosynthetic genes and accumulation of phenylpropanoids in Fagopyrum tataricum sprouts. J. Agric. Food Chem. 2014, 62, 4839–4845. [Google Scholar] [CrossRef] [PubMed]
  17. Johkan, M.; Shoji, K.; Goto, F.; Hashida, S.; Yoshihara, T. Blue light-emitting diode light irradiation of seedlings improves seedling quality and growth after transplanting in red leaf lettuce. HortScience 2010, 45, 1809–1814. [Google Scholar] [CrossRef] [Green Version]
  18. Son, K.H.; Oh, M.M. Leaf shape, growth, and antioxidant phenolic compounds of two lettuce cultivars grown under various combinations of blue and red light-emitting diodes. HortScience 2013, 48, 988–995. [Google Scholar] [CrossRef]
  19. Lee, M.J.; Son, K.H.; Oh, M.M. Increase in biomass and bioactive compounds in Lettuce under various ratios of red to far-red LED light supplemented with blue LED Light. Hortic. Environ. Biotechnol. 2016, 57, 139–147. [Google Scholar] [CrossRef]
  20. Piovene, C.; Orsini, F.; Bosi, S.; Sanoubar, R.; Bregola, V.; Dinelli, G.; Gianquinto, G. Optimal red:blue ratio in led lighting for nutraceutical indoor horticulture. Sci. Hortic. 2015, 193, 202–208. [Google Scholar] [CrossRef]
  21. Pennisi, G.; Orsini, F.; Blasioli, S.; Cellini, A.; Crepaldi, A.; Braschi, I.; Spinelli, F.; Nicola, S.; Fernandez, J.A.; Stanghellini, C.; et al. Resource use efficiency of indoor lettuce (Lactuca sativa L.) cultivation as affected by red:blue ratio provided by LED lighting. Sci. Rep. 2019, 9, 1–11. [Google Scholar] [CrossRef]
  22. Pennisi, G.; Blasioli, S.; Cellini, A.; Maia, L.; Crepaldi, A.; Braschi, I.; Spinelli, F.; Nicola, S.; Fernandez, J.A.; Stanghellini, C.; et al. Unraveling the role of red:blue LED lights on resource use efficiency and nutritional properties of indoor grown sweet basil. Front. Plant Sci. 2019, 10, 305. [Google Scholar] [CrossRef] [PubMed] [Green Version]
  23. Qian, H.; Liu, T.; Deng, M.; Miao, H.; Cai, C.; Shen, W.; Wang, Q. Effects of light quality on main health-promoting compounds and antioxidant capacity of Chinese kale sprouts. Food Chem. 2016, 196, 1232–1238. [Google Scholar] [CrossRef] [PubMed]
  24. Gratani, L. A non-destructive method to determine chlorophyll content of leaves. Photosynthetica 1992, 26, 469–473. [Google Scholar]
  25. Song, J.; Huang, H.; Hao, Y.; Song, S.; Zhang, Y.; Su, W.; Liu, H. Nutritional quality, mineral and antioxidant content in lettuce affected by interaction of light intensity and nutrient solution concentration. Sci. Rep. 2020, 10, 1–9. [Google Scholar] [CrossRef] [PubMed] [Green Version]
  26. Brazaitytė, A.; Sakalauskienė, S.; Samuolienė, G.; Jankauskienė, J.; Viršilė, A.; Novičkovas, A.; Sirtautas, R.; Miliauskienė, J.; Vaštakaitė, V.; Dabašinskas, L.; et al. The effects of LED illumination spectra and intensity on carotenoid content in Brassicaceae microgreens. Food Chem. 2015, 173, 600–606. [Google Scholar] [CrossRef]
  27. Song, S.W.; Li, L.Y.; Liu, H.C.; Sun, G.W.; Chen, R.Y. Effect of ammonium and nitrate ratio on nutritional quality of flowering Chinese Cabbage. Appl. Mech. Mater. 2011, 142, 188–192. [Google Scholar] [CrossRef]
  28. Wang, Y.Q.; Hu, L.P.; Liu, G.M.; Zhang, D.S.; He, H.J. Evaluation of the nutritional quality of Chinese Kale (Brassica alboglabra Bailey) Using UHPLC-Quadrupole-Orbitrap MS/MS-Based Metabolomics. Molecules 2017, 22, 1262. [Google Scholar] [CrossRef] [Green Version]
  29. Zheng, Y.; Zhang, Y.; Liu, H.; Li, Y.; Song, S.; Chen, R.Y.; Liu, Y.; Sun, G.W.; Hao, Y.W.; Su, W.; et al. Supplemental blue light increases growth and quality of greenhouse Pak-choi depending on cultivar and supplemental light intensity. J. Integr. Agric. 2018, 17, 2245–2256. [Google Scholar] [CrossRef] [Green Version]
  30. Bradford, M. A rapid and sensitive method for the quantitation of microgram quantities of protein utilizing the principle of protein-dye binding. Anal. Biochem. 1976, 72, 248–254. [Google Scholar] [CrossRef]
  31. Heaney, R.K.; Spinks, E.A.; Fenwick, G.R. Improved method for the determination of the total glucosinolate content of rapeseed by determination of enzymically released glucose. Analyst 1988, 113, 1515–1518. [Google Scholar] [CrossRef]
  32. Rapisarda, P.; Fanella, F.; Maccarone, E. Reliability of analytical methods for determining anthocyanins in blood orange juices. J. Agric. Food Chem. 2000, 48, 2249–2252. [Google Scholar] [CrossRef] [PubMed]
  33. Javanmardi, J.; Stushnoff, C.; Locke, E.; Vivanco, J. Antioxidant activity and total phenolic content of Iranian Ocimum accessions. Food Chem. 2003, 83, 547–550. [Google Scholar] [CrossRef]
  34. Jia, Z.S.; Tang, M.C.; Wu, J.M. The determination of flavonoid contents in mulberry and their scavenging effects on superoxide radicals. Food Chem. 1999, 64, 555–559. [Google Scholar]
  35. Ellman, G.L. Tissue sulfhydryl groups. Arch. Biochem. Biophys. 1959, 82, 70–77. [Google Scholar] [CrossRef]
  36. Naznin, M.T.; Lefsrud, M.; Gravel, V.; Hao, X. Different ratios of red and blue LED light effects on coriander productivity and antioxidant properties. Acta Hortic. 2016, 1134, 223–229. [Google Scholar] [CrossRef]
  37. Huché-Thélier, L.; Crespel, L.; Gourrierec, J.L.; Morel, P.; Sakr, S.; Leduc, N. Light signaling and plant responses to blue and UV radiations—Perspectives for applications in horticulture. Environ. Exp. Bot. 2016, 121, 22–38. [Google Scholar] [CrossRef]
  38. Heo, J.; Lee, C.; Chakrabarty, D.; Paek, K. Growth responses of marigold and salvia bedding plants as affected by monochromic or mixture radiation provided by a light-emitting diode (LED). Plant Growth Regul. 2002, 38, 225–230. [Google Scholar] [CrossRef]
  39. Hoenecke, M.E.; Bula, R.J.; Tibbitts, T.W. Importance of “blue” photon levels for lettuce seedlings grown under red light-emitting diodes. HortScience 1992, 27, 427–430. [Google Scholar] [CrossRef] [Green Version]
  40. Brown, C.S.; Schuerger, A.C.; Sager, J.C. Growth and photomorphogenesis of pepper plants under red light-emitting diodes with supplemental blue or far-red lighting. J. Am. Soc. Hort. Sci. 1995, 120, 808–813. [Google Scholar] [CrossRef] [Green Version]
  41. Kim, H.H.; Goins, G.; Wheeler, R.M.; Sager, J.C. Green-light supplementation for enhanced lettuce growth under red- and blue-light-emitting diodes. HortScience 2004, 39, 1617–1622. [Google Scholar] [CrossRef] [Green Version]
  42. Li, Y.M.; Zheng, Y.J.; Liu, H.C.; Zhang, Y.T.; Hao, Y.W.; Song, S.W.; Lei, B.F. Effect of supplemental blue light intensity on the growth and quality of Chinese kale. Hortic. Environ. Biotechnol. 2019, 60, 49–57. [Google Scholar] [CrossRef]
  43. Smirnoff, N. Ascorbate biosynthesis and function in photo protection. Philos. Trans. R. Soc. B Biol. Sci. 2000, 355, 1455–1464. [Google Scholar] [CrossRef] [PubMed]
  44. Lee, S.K.; Kader, A.A. Preharvest and postharvest factors influencing vitamin C content of horticultural crops. Postharvest Biol. Technol. 2000, 20, 207–220. [Google Scholar] [CrossRef] [Green Version]
  45. Kato, H.; Rhue, M.R.; Nishimura, T. Role of free amino acids and peptides in food taste. Flavor Chem. 1989, 13, 158–174. [Google Scholar]
  46. Nishimura, T.; Kato, H. Taste of free amino acids and peptides. Food Rev. Int. 1988, 4, 175–194. [Google Scholar] [CrossRef]
  47. Xiao, H.; He, D.; Xu, Y.J. Analysis and comparison of the amino acids in six varieties of purple—Caitai. Amino Acids Biot. Resour. 2008, 30, 59–62. (In Chinese) [Google Scholar]
  48. Kumar, V.; Sharma, A.; Kaur, R.; Thukral, A.K.; Bhardwaj, R.; Ahmad, P. Differential distribution of amino acids in plants. Amino Acid. 2017, 49, 821–869. [Google Scholar] [CrossRef]
  49. Brown, P.D.; Tokuhisa, J.G.; Reichelt, M.; Gershenzon, J. Variation of glucosinolate accumulation among different organs and developmental stages of Arabidopsis thaliana. Phytochemistry 2003, 62, 471–481. [Google Scholar] [CrossRef]
  50. Bellostas, N.; Sorensen, J.C.; Sorensen, H. Profiling glucosinolates in vegetative and reproductive tissues of four Brassica species of the U-triangle for their biofumigation potential. J. Sci. Food Agric. 2007, 87, 1586–1594. [Google Scholar] [CrossRef]
  51. Yan, X.F.; Chen, S.X. Regulation of plant glucosinolate metabolism. Planta 2007, 226, 1343–1352. [Google Scholar] [CrossRef]
  52. Liu, W.; He, H.J.; Song, M. Influence of amino acids on bioactive compounds of Chinese kale. Acta Hortic. 2012, 944, 153–158. [Google Scholar] [CrossRef]
  53. Ninu, L.; Ahmad, M.; Miarelli, C.; Cashmore, A.R.; Giuliano, G. Cryptovhrome 1 controls tomato development in response to blue light. Plant J. 2002, 18, 551–556. [Google Scholar] [CrossRef] [PubMed]
  54. Giliberto, L.; Perrotta, G.; Pallara, P.; Weller, J.L.; Fraser, P.D.; Bramley, P.M.; Giuliano, G. Manipulation of the blue light photoreceptor cryptochrome 2 in tomato affects vegetative development, flowering time, and fruit antioxidant content. Plant Physiol. 2005, 137, 199–208. [Google Scholar] [CrossRef] [PubMed] [Green Version]
  55. Meng, X.; Xing, T.; Wang, X.J. The role of light in the regulation of anthocyanin accumulation in Gerbera hybrid. Plant Growth Regul. 2004, 44, 243–250. [Google Scholar] [CrossRef]
  56. Shoji, K.; Goto, E.; Hashida, S.; Goto, F.; Yoshihara, T. Effect of light quality on the polyphenol content and antioxidant activity of sweet basil (Ocimum basilicum L.). Acta Hortic. 2011, 907, 95–99. [Google Scholar] [CrossRef]
  57. Stutte, G.; Edney, S.; Skerritt, T. Photoregulation of bioprotectant content of red leaf lettuce with light-emitting diodes. HortScience 2009, 44, 79–82. [Google Scholar] [CrossRef] [Green Version]
  58. Yorio, N.C.; Goins, G.; Kagie, H.R.; Wheeler, R.M.; Sager, J.C. Improving spinach, radish, and lettuce growth under red light-emitting diodes (LEDs) with blue light supplementation. Hortscience 2001, 36, 380–383. [Google Scholar] [CrossRef] [Green Version]
  59. Goins, G.; Ruffe, L.M.; Cranston, N.A.; Yorio, N.C.; Wheeler, R.; Sager, J.C. Salad Crop Production under Different Wavelengths of Red Light-Emitting Diodes (LED); SAE Technical Papers; SAE International: Warrendale, PA, USA, 2001. [Google Scholar]
  60. Goins, G.; Yorio, N.C.; Vivenzio, H. Performance of salad-type plants using lighting and nutrient delivery concepts intended for spaceflight. J. Aerosp. 1998, 107, 284–289. [Google Scholar]
  61. Smith, H.L.; McAusland, L.; Murchie, E.H. Don’t ignore the green light: Exploring diverse roles in plant processes. J. Exp. Bot. 2017, 68, 2099–2110. [Google Scholar] [CrossRef]
Figure 1. Spectral profiles of the LED lights ((A) 8R1B, red:blue = 8: 1, (B) 6R3B, red:blue = 6:3), and (C) white LED light (control) used in this study. Photosynthetic photon flux integration for each light treatment were equal to 120 ± 10 μmol·m−2·s−1.
Agronomy 10 01248 g001
Figure 2. Nutritional quality in Chinese kale grown under different ratios of red:blue LED lights. Different letters indicate significant differences between treatments by Duncan’s multiple range test (p ≤ 0.05). (A) Sucrose, (B) glucose, (C) fructose, (D) nitrate contents, (E) vitamin C, (F) soluble protein.
Agronomy 10 01248 g002
Figure 3. Health-promoting compounds in flower stalks and leaves of Chinese kale grown under different ratios of red:blue LED lights. TG, total glucosinolate; TA, total anthocyanin; TP, total phenolic; FK, flavonoid kaempferol; FQ, flavonoid quercetin; GSH, Glutathione. Different letters indicate significant differences between treatments by Duncan’s multiple range test (p ≤ 0.05).
Agronomy 10 01248 g003
Figure 4. Antioxidant activity in flower stalks and leaves of Chinese kale grown under different ratios of red:blue LED lights. Different letters indicate significant differences between treatments by Duncan’s multiple range test (p ≤ 0.05).
Agronomy 10 01248 g004
Table 1. Growth characteristics in Chinese kale plants grown under different ratios of red:blue LED lights.
TreatmentFlower Stalk Height (cm)Flower Stalk Diameter (mm)Leaf TraitsWeight (g per Plant)
NumberLength (cm)Width (cm)Shoot FWPlant FWShoot DWPlant DW
White LED22.8 ± 0.5 c10.3 ± 0.2 a13.2 ± 0.8 b10.3 ± 0.4 b9.5 ± 0.4 a36.1 ± 3.5 b39.1 ± 3.2 b3.1 ± 0.2 b3.4 ± 0.3 a
6R3B23.8 ± 0.6 b9.8 ± 0.4 b12.8 ± 0.5 b9.7 ± 0.2 c8.9 ± 0.3 b33.6 ± 2.3 b37.0 ± 2.1 b2.3 ± 0.2 c2.6 ± 0.2 b
8R1B25.5 ± 0.8 a10.6 ± 0.3 a15.0 ± 1.0 a11.3 ± 0.2 a9.8 ± 0.3 a41.8 ± 2.3 a44.9 ± 3.3 a3.4 ± 0.3 a3.6 ± 0.2 a
Data were mean ± standard error (n = 3). Different letters within a column indicate significant differences by ANOVA followed by Duncan’s test (p ≤ 0.05). FW = fresh weight, DW = dry weight.
Table 2. Pigments content in Chinese kale grown under different ratios of red:blue LED lights.
LightPhotosynthetic Pigment Content (mg/g FW)
Chl aChl bTotal ChlCarotenoidsβ-carotene (μg/g DW)Chl a/chl b
White LED1.46 ± 0.04 a0.57 ± 0.04 a2.06 ± 0.07 a0.16 ± 0.01 b28.63 ± 0.08b2.56 ± 0.04 c
6R3B1.41 ± 0.01 a0.50 ± 0.03 b1.93 ± 0.02 b0.17 ± 0.01 b36.20 ± 0.71a2.82 ± 0.03 b
8R1B1.32 ± 0.01 b0.42 ± 0.02 c1.76 ± 0.02 c0.21 ± 0.01 a36.78 ± 0.47a3.14 ± 0.03 a
Data were mean ± standard error (n = 3). Different letters within a column indicate significant differences by ANOVA followed by Duncan’s test (p ≤ 0.05).
Table 3. Amino acids composition and concentration in Chinese kale grown under different ratios of red:blue LED lights.
Amino Acids Composition and Content
(mg/100 g FW)
AbbreviationsLight Combination
White LED6R3B8R1B
Essential amino acids (EAAs)
Threonine AThr5.01 ± 0.41 b6.30 ± 0.08 a6.57 ± 0.13 a
Valine BDVal2.32 ± 0.03 b3.10 ± 0.05 a3.01 ± 0.16 a
Mmethionine BDMet0.28 ± 0.02 b0.82 ± 0.08 a0.21 ± 0.01 a
Isoleucine BDIle1.85 ± 0.04 c2.91 ± 0.06 a2.67 ± 0.03 b
Leucine BDLeu1.25 ± 0.01 c2.86 ± 0.08 a2.20 ± 0.01 b
Phenylalanine BDPhe2.22 ± 0.17 c3.47 ± 0.29 a2.73 ± 0.08 b
Lysine ALys2.63 ± 0.13 c4.35 ± 0.07 a3.57 ± 0.08 b
Non-essential amino acids (NEAAs)
Histidine BHis4.07 ± 0.05 c5.62 ± 0.07 a5.29 ± 0.18 b
Arginine BArg30.37 ± 0.44 c43.38 ± 0.50 b45.37 ± 0.70 a
PhosphatidylserineP-Ser6.00 ± 0.22 a3.81 ± 0.05 b3.93 ± 0.12 b
Aspartic acid CAsp20.75 ± 0.97 c28.78 ± 0.58 a26.65 ± 0.70 b
Serine ASer9.56 ± 0.25 b8.08 ± 0.25 c10.89 ± 0.14 a
L-AsparagineASPNH28.23 ± 0.40 c9.22 ± 0.50 b10.40 ± 0.56 a
Glutamic acid CGlu27.36 ± 1.50 c36.50 ± 1.31 a33.13 ± 0.34 b
Glutamine AGluNH211.45 ± 0.49 b9.98 ± 0.55 c15.51 ± 0.22 a
Glycine AGly1.10 ± 0.07 a0.83 ± 0.04 b1.12 ± 0.03 a
Alanine AAla8.87 ± 0.37 b8.93 ± 0.30 b11.04 ± 0.19 a
Cysteine DCys0.94 ± 0.09 b1.16 ± 0.05 a1.00 ± 0.04 b
TyrosineTyr0.87 ± 0.01 c1.02 ± 0.10 b1.15 ± 0.02 a
β-Alanineβ-Ala0.39 ± 0.01 c1.09 ± 0.01 a0.58 ± 0.04 b
γ-Aminobutyric acidGABA2.05 ± 0.02 a0.78 ± 0.05 c1.55 ± 0.01 b
EthanolamineEOHNH21.34 ± 0.03b1.47 ± 0.01 ab1.54 ± 0.10a
OrnithineOrn0.94 ± 0.03 a0.94 ± 0.05 a0.80 ± 0.07 b
Methylhistidine1-Mehis2.27 ± 0.08 b1.90 ± 0.04 c3.18 ± 0.09 a
HydroxylysineHylys0.16 ± 0.01 b0.33 ± 0.02 a0.18 ± 0.01 b
Total EAA 15.56 ± 0.75 c23.59 ± 0.92 a20.95 ± 0.20 b
Total EAA+NEAA 152.36 ± 4.68 b188.93 ± 2.56 a194.36 ± 2.21 a
Total A 38.62 ± 0.94 b38.47 ± 0.13 b48.70 ± 0.38 a
Total B 42.36 ± 0.34 b62.16 ± 0.60 a61.48 ± 0.38 a
Total C 48.11 ± 1.42 c65.28 ± 1.08 a59.78 ± 0.56 b
Total D8.86 ± 0.16 c14.32 ± 0.33 a11.81 ± 0.10 b
Data were mean ± standard error (n = 3). Different letters within a column indicate significant differences by ANOVA followed by Duncan’s test (p ≤ 0.05). A: Sweet amino acid; B: Bitterness amino acid; C: Sourness and umami amino acid; D: Precursor amino acids of glucosinolate.
Table 4. The summarization of all parameter changes between treatments.
Parameters6R3B vs. White LED8R1B vs. White LED6R3B vs. 8R1B
Growth
Flower stalk height+++
Flower stalk diametern
Leaf numbern+
Leaf length+−−
Leaf widthn
Shoot FWn+
Plant FWn+
Shoot DW+−−
Plant DWn
Count−5+7−11
Quality
Total Chl−−+
β-carotene++n
Chl a/Chl b+++
Sucrosen+
Glucosen+
Fructose+−−
Nitrate−−+
Vitamin Cn+
Soluble protein+++
Total EAA++++
Total EAA+NEAA++n
Total An+
Total B++n
Total C++++
Total D++++
TG++++
TA++++
TPnn
FKn+
FQ+++
GSH+++
FRAPn+
DPPHn+
Count+13+6+15
++, increased and significant difference letter was between a and c; +, increased significant difference letter was between a and b or b and c; −−, decreased and significant difference letter was between a and c; −, decreased and significant difference letter was between a and b or b and c; n, no significant difference. Count of the enhanced parameter.

