Article

Pollination Is Sufficient, Even with Low Bee Diversity, in Pumpkin and Winter Squash Fields

by
Kimberly A. Stoner
Entomology Department, the Connecticut Agricultural Experiment Station, New Haven, CT 06511, USA
Agronomy 2020, 10(8), 1141; https://doi.org/10.3390/agronomy10081141
Submission received: 22 June 2020 / Revised: 21 July 2020 / Accepted: 2 August 2020 / Published: 5 August 2020
(This article belongs to the Special Issue Pollinator Diversity and Pollination in Agricultural Systems)

Abstract

:
Pumpkins and winter squash require insect pollination to set fruit, but only three bee species are important pollinators of these crops in the Northeastern US. To determine if natural levels of pollen deposition are sufficient for full fruit production, open pollination was measured by counting pollen grains on stigmas, and open pollination was compared to supplemental hand pollination for fruit set, fruit size, and seed number. A threshold of 2300 pollen grains per stigma was sufficient for full pollination and fruit production. This threshold was met in 79 out of 80 combinations of site and sample date over four years on farms across Connecticut with a wide range of field sizes and pest management practices. Along with stigma collection, bees per flower were counted hourly on 100 flowers along a transect. Counts of bumble bees on female flowers were more closely related to the amount of pollen deposited than counts of bees on all flowers or counts of honey bees or squash bees on female flowers. There was tremendous variation in abundance of the three bee species on female flowers across farms within a year and even among years on a single farm.

Graphical Abstract

1. Introduction

Pumpkins (Cucurbita spp. cultivars grown as ornaments or for pie) and winter squash (Cucurbita spp. grown as fall vegetables) are important US crops, with 37,863 and 13,249 ha respectively harvested annually, according to the 2017 US Agricultural Census [1]. Both pumpkins and winter squash have separate male and female flowers, and pollination is required for fruit set [2,3]. Each flower, whether male or female, is open for a single morning, so pollen deposited on a female flower in that morning will determine whether that flower will be adequately fertilized to set fruit, and whether that fruit will grow to its full physiological potential as a result of all the seeds being fully fertilized [3].
In the northeastern U.S., three species of bees are the primary visitors to flowers of pumpkin and squash: the common eastern bumble bee, Bombus impatiens (Cresson); the western honey bee, Apis mellifera L.; and the squash bee, Eucera (Peponapis) pruinosa (Say), with other pollinators, such as halictid bees, very low in abundance—often less than 2% of the bees observed [4,5,6,7,8,9,10]. This is in contrast to many other crops requiring or benefiting from insect pollination, including other cucurbits, such as watermelon (Citrullus lanatus), which had 55 species of bee pollinators in New Jersey and Pennsylvania [11]. The reason for this very limited pollinator fauna visiting Cucurbita flowers is not clear, given that Cucurbita produces more pollen and nectar per flower than any other bee-dependent crop [12]. Generalist bees may be limited by the chemical and physical defenses in Cucurbita pollen found by Brochu et al. [13], resulting in high larval mortality and complete failure to reproduce in microcolonies of B. impatiens, although the specialist squash bee E. pruinosa is able to raise its larvae entirely on a diet of Cucurbita pollen [14].
Because insect pollination is required for pumpkin and squash production, there have been many studies seeking to determine whether growers need to take action to supplement pollination by renting honey bees, buying bumble bee colonies, or improving pollinator habitat [15]. Experiments to determine whether supplemental pollination increases yield of pumpkin over naturally occurring open pollination have had mixed results. Walters and Taylor [16] found that while addition of honey bee colonies did not increase fruit numbers per hectare for jack-o-lantern pumpkins (Cucurbita pepo), the plots with added honey bee colonies had higher average fruit weight, total fruit weight per hectare, seeds per fruit, and seed weight per fruit. The same authors found that for winter squash species (Cucurbita moschata Duchesne and Cucurbita maxima Duchesne), all parameters measured (fruit per hectare, total weight per hectare, average fruit weight, seeds per fruit, and seed weight) increased with addition of honey bee colonies [16]. Artz and Nault [7] found that adding bumble bee colonies increased the number of pumpkin fruit per plant, although the increase in total yield with the addition of bumble bee colonies was not statistically significant. However, Petersen et al. [8] found that supplementation with colonies of bumble bees or honey bees did not significantly increase yield or bee visitation in pumpkin fields.
One difficulty with these studies has been that neither the naturally occurring open pollination nor the supplemental levels of pollen deposition on stigmata of the pumpkins were measured. Thus, the different results could be due to differences in the open pollen deposition in different years and locations, to differences in the effectiveness of the additional colonies of honey bees or bumble bees in pollen deposition, or to the many physiological and other factors that influence flowering, fruit set and fruit size [3,15,17].
Several previous studies have also evaluated the levels of pollen deposition required for fruit set in pumpkins. A series of trials by Cady [18], working with the C. pepo pumpkin cultivar ”Wizard” found that the percentage of fruit set did not increase with additional pollen beyond 2000 pollen grains per stigma. Vidal et al. [19], studying the C. pepo pumpkin cultivar “Howden” found that fruit set reached 100% with 12 honey bee visits per stigma, and in a separate set of experiments quantified the pollen deposition from 12 honey bee visits at 1253 ± 484 pollen grains. Pfister et al. [20] found through hand pollination that approximately 2500 pollen grains were needed to maximize fruit set in the C. maxima pumpkin “Hokkaido”. Pfister et al. [20] also measured pollen deposited in a single visit by honey bees, bumble bees (mainly Bombus terrestris), and several species of halictid bees. They found that bumble bees deposited a mean of 3369 pollen grains per visit (sd 2473), while honey bees deposited 582 grains per visit (sd 752), and halictids deposited much less. Artz and Nault [7], found much lower overall pollen deposition per single visit on stigmas of the C. pepo pumpkin “Mystic Plus”—approximately 180 pollen grains per visit for the bumble bee B. impatiens, and 60 grains per visit by honey bees and for the squash bee E. pruinosa.
McGrady et al. [10] used the pollination thresholds and estimates of pollination deposition per visit from Pfister et al. [20] with their own observations of bee visitation per minute to estimate that each of the three major pollinator species (A. mellifera, B. impatiens, and E. pruinosa) exceeded the pollination threshold independently at their study sites in Pennsylvania, and confirmed through measurements of yield, seed number and pumpkin size that pollination was not limiting yield (as was also found by Pfister et al. [20] in Germany).
The objectives of this study were (1) determine whether supplemental pollination of pumpkin increases fruit set, fruit survival to harvest, fruit size and weight and other parameters potentially affecting yield as compared to natural pollination; (2) based on measurements of pollen deposition and harvest parameters, establish a threshold of sufficient pollen deposition for full fertilization; (3) evaluate the adequacy of open pollen deposition on the stigmas at multiple pumpkin and winter squash fields across the state, including on farms using organic practices, those using neonicotinoid insecticides, and those using other conventional pesticides; and (4) relate pollen deposition to observations of bee activity in the field on a diversity of farms of different sizes, and with different pest management practices across Connecticut.

2. Materials and Methods

2.1. Natural Open Pollination vs. Supplemental Pollination

This experiment was conducted on three experimental farms belonging to the Connecticut Agricultural Experiment Station in three different regions of the state: Lockwood Farm in Hamden, Griswold Research Farm in Griswold, and the Valley Laboratory in Windsor. In 2012, 3 trials were carried out in the same plot on different dates on one site, Lockwood Farm in Hamden. In 2013, pollination trials were carried out on 3 dates at each of the farms, and in 2014, one pollination trial was carried out at each farm. Pumpkins (C. pepo cv. Gladiator) were planted with black plastic mulch and drip irrigation. Soil treatments with imidacloprid (Admire Pro® Systemic Protectant, Bayer Crop Science, Research Triangle Park, NC, USA) were applied at Lockwood Farm in 2012, at all three farms in 2013, and to Griswold and Windsor in 2014. All imidacloprid treatments were applied at or shortly after planting at a labeled rate of 8 oz. per acre (0.585 L/ha or 322 g imidacloprid per ha).
In the afternoon before each supplemental pollination trial, all female pumpkin flowers expected to open the following morning were flagged and marked on a map of the field. Female flowers were randomly designated for two treatments in 2012: (1) Undisturbed and marked for measurement of fruit set the following week and fruit characteristics at maturity, and (2) supplemental pollination and marked for measurement of fruit set and fruit characteristics. Starting in 2013, flowers were randomly designated for three treatments, the two treatments above and, also, (3) undisturbed and collected at the end of the morning for measurement of open pollen deposition on the stigma (except for Windsor 14 August 2013, when insufficient female flowers were available). In addition, in 2013, at Lockwood and Windsor, samples of stigmas with supplemental pollination were collected at the end of the morning to compare the amount of pollen on the stigma with open and supplemental pollination.
Flower visitation occurs from dawn until the flowers close in late morning [9,21], but pollen viability decreases through the morning [22], so supplemental pollination was carried out before 8 a.m. Pollen was collected from at least 10 male flowers into a Petri dish and then was applied to designated female flowers using either a Q-tip or a small paint brush, depending on the humidity and dampness of the pollen.
After pollination, flowers with supplemental and open pollination from each trial date were monitored weekly to evaluate fruit set (in 2013 and 2014) and survival to harvest. During this time, the fields were maintained by the farm managers, including spraying with fungicides as needed to control powdery and downy mildew, and irrigated as needed. At maturity, the fruit was weighed and measured, and seeds were extracted. Seeds with diameter >1.5 cm were counted, dried in an oven at 60 C, and weighed.

2.2. Pumpkin and Winter Squash Sites in Farmers’ Fields

Farmers were recruited to participate in pollination research through contacts with the Connecticut chapter of the Northeast Organic Farming Association and the Cooperative Extension Service of the University of Connecticut. In addition to the three farm managers at the above experimental farms, 14 farmers participated in 2012, reduced to 12 in the following years. Several of the farmers had multiple fields of pumpkins or winter squash each year, so that 19 fields were sampled in 2012, 15 fields in 2013, 13 fields in 2014, and 15 fields in 2015, in addition to samples taken at the three experimental farms. Fields ranged in area from 163 m2 to 10.9 ha, and included fields exclusively in pumpkins, exclusively in winter squash, and fields with a mixture of both. Pest management was also diverse. Participating farms included organic farms (generally without pesticide applications to pumpkins or squash, although two farms made a single application of pyrethrin one year), farms using neonicotinoid insecticides applied to seed or in furrows, farms not using neonicotinoids but using other insecticides (including phosmet, bifenthrin, and carbaryl), and farms not using insecticides but using fungicides and herbicides. Only one farm (Dzen) rented honey bee hives for pollination, but all the organic farms, many of the non-organic farms, and Lockwood and Griswold had from 1 to 10 honey bee hives on the farm. Information about each of the farms is included in Supplementary File Table S1. Farms were scouted regularly during the season, and studies were carried out as soon as possible after both male and female flowers were present.

2.3. Measurement of Pollen Deposition on Stigmas

Because of the great variation in size and shape of the fields on private farms, patterns of sampling varied. In the smallest fields, every available female flower was flagged and collected at the end of the morning. In larger fields, due to the difficulty of travel and locating female flowers (which are low to the ground) in pumpkin fields in full flower, a straight line transect through the center of the field was selected, generally along an aisle used for tractor access in the interior of the field. After flowers had closed for the day (around 11 a.m.), the stigma and style column (base of the stigma) for each marked flower was collected into a 50 mL centrifuge tube with 5 mL of 70% ethanol, brought back to the laboratory and stored at 0 °C for later analysis. Whenever possible, 20 stigmas per site were collected in 2012–2014. In 2015, the number was reduced to 5 per site, except in Windsor and Griswold where the field was divided into plots with and without imidacloprid treatment (applied as described for previous years above) and 5 stigmas were collected from each plot.
Pollen deposition on the stigma was measured using methods adapted from Willis [23]. Stigmas were thawed and ethanol removed. Preliminary studies showed that consistently less than 1% of total pollen in the sample was found in the ethanol used for storage, so the ethanol was discarded. In order to release pollen attached to the stigma, the stigma was digested overnight in 2 mL of 45% potassium hydroxide solution (w/w Fisher Chemical, Fair Lawn, NJ, USA). The released pollen was resuspended in the KOH solution by vortexing for 20 s at 3500 rpm and then 10 aliquots of 10 uLwere removed with an Eppendorf pipette, vortexing the sample for 5 s between each aliquot. Each 10 uL aliquot was deposited into a square of a gridded Petri dish and pollen grains were counted under a stereomicroscope. The mean was calculated for the 10 aliquots, and from that mean we estimated the pollen in 2 mL of solution. A mean and standard deviation was calculated for each site and sample date.

2.4. Hourly Bee Counts on 100 Flowers

On the same morning that stigmas were collected, we counted bees once each hour on the first 100 flowers encountered along a transect in the field, recording the bee species and sex of the flower. This sampling method was adopted from Riggs et al. [17] and was used in a previous study by Shuler et al. [4]. The proportion of female flowers included in the sample of 100 flowers was highly variable, depending on such factors as temperature, mutual shading of plants, and levels of nitrogen fertilization [17]. The transects began at least 3 m from the edge of the field, with the observer traveling toward the center of the field. As above, in large fields with tractor lanes, the transect would follow a tractor lane, to facilitate travel. In 2012 and 2013, bee counts started at 8 a.m., changing to 6 a.m. in 2014 and 2015, in order to include early morning bee activity, and in these later years, we also recorded the sex of the bees observed, wherever possible.

2.5. Statistical Methods

The amount of pollen added with supplementation was estimated using the estimate function in a mixed model ANOVA, with the amount of pollen per stigma as the response variable, with each of the 6 pollination dates in 2013 as random effects, and with treatment (open or supplemental) as a fixed effect.
The association of pollination treatment with fruit set after 7 days was tested with chi-square analysis of multiway tables (SYSTAT 13.1) using treatment and fruit set as the rows and columns and pollination dates as strata, and the association of pollination treatment with survival to harvest was analyzed the same way. In addition, in a post hoc test, the data for the single trial with the lowest natural pollen deposition was analyzed alone, using Fisher’s Exact Test (Microsoft Research, MSR-TR-2009-53, Redmond, WA, USA) for the 2 × 2 contingency tables pollination treatment × fruit set and pollination treatment × survival to harvest.
The effect of pollination treatment on fruit weight, fruit diameter, and number and total dry weight of seeds greater than 1.5 cm in diameter (considered the minimum size for fertilized seeds) were analyzed using a mixed model ANOVA with location and pollination date as random effects and pollination treated as a fixed effect. A post hoc test on the results from the site with the lowest natural pollen deposition were analyzed separately, using two sample t-tests to test for any effect of pollination treatment on fruit weight, fruit diameter, seed number, and seed weight.
Because so many variables changed even within farms over the course of the study, including number of fields, location of the fields, crop mix, and, for a few farms, pest management practices, the pollen deposition data are presented graphically by pest management practice, crop mix, and years, and similarly, the data for hourly bee counts on 100 flowers are summarized for female and male flowers over years in a table, and data for bee visitation to female flowers for each farm and year are presented graphically.
The hypothesis of equal distribution of visits by bees of different species to male and female flowers in the total hourly 100 flower bee counts over all four years was tested by X2, using the website Social Science Statistics (socscistatistics.com). The bee observations from 100 flower counts were initially tested using a 2 × 5 contingency table with male and female flowers as the rows, and the number of flowers of each sex, bumble bees, honey bees, squash bees, and other bees as the columns. Once the hypothesis of equal distribution was rejected for each data set, each bee species was analyzed separately in a 2 × 2 table with flower numbers and bee observations.
The relationship between pollen deposition on the stigmas and hourly 100 flower bee counts was initially evaluated using linear regression with pollen per stigma as the dependent variable and total bee counts (on male as well as female flowers) as the independent variable, and then again using pollen per stigma as the dependent variable, but using bee counts on the female flowers only as the independent variable (eliminating any cases where female flowers were less than 1% of the flowers counted, on the assumption that such a small number of female flowers would not give an accurate estimate of bee visitation). With a stronger result for bee counts for only the female flowers, the role of the three major bee species was tested using a multiple regression, with pollen per stigma as the dependent variable, and counts of bumble bees, honey bees, and squash bees on the female flowers as independent variables. This analysis indicated that bumble bees per female flower alone could predict the pollen per stigma, so a simple linear regression was carried out for this independent variable alone. All these analyses were carried out in Sigma Stat, with the final plot created in Sigma Plot.

3. Results

3.1. Natural Open vs. Supplemental Pollination

Effects of open vs. supplemental pollination on fruit set and survival to harvest. Although there was considerable variability in fruit set and fruit survival to harvest across sites, years, and dates, there was no evidence that supplementary pollination increased fruit production at the levels of natural pollination found at our experimental farms. Estimates of open pollen deposition on stigmas, and fruit set and survival to harvest for open and supplemental pollination are presented in Table 1. Supplemental pollination added an estimated mean of 2831 pollen grains per stigma (standard error 1477) to pollen deposition from naturally occurring open pollination, based on an ANOVA least squares estimate, testing a fixed effect of open vs. supplemental pollination (df =1.61; F = 3.673; p = 0.060). Supplemental pollination did not significantly increase fruit set (Pearson chi-square value = 0.878, df = 1, p = 0.349), or survival to harvest (Pearson chi-square value = 0.400, df = 1, p = 0.527). To further verify that there were no significant differences in the trial with the lowest level of open pollination observed (Griswold 2014, with mean 2326, sd 1152 pollen grains per stigma), I did a post-hoc analysis, and found no significant difference between open and supplemental pollination in fruit set (two-sided test, p = 0.34), or survival to harvest (two-sided test, p = 0.49.)
Effects of open vs. supplemental pollination on fruit weight and diameter and on number of seeds and seed weight. There was considerable variation across locations and years in fruit size (weight and diameter), but no significant effect of open vs. supplemental pollination (Table 2). In an ANOVA with Location and Date as random effects, the Type III test for fixed effect of pollination treatment (open or supplemental) on fruit weight was not significant (df = 1.146, F = 0.008, p = 0.929), and the same test for fruit diameter was also not significant (df = 1.146, F= 0.003, p = 0.954). Similarly, there was also no significant effect of open vs. supplemental pollination on seed weight (df = 1.145, F = 3.480, p = 0.064), but open pollinated fruit did have significantly more seeds per fruit than fruit with supplemental pollination (df = 1.145, F = 4.468, p = 0.036; Table 2), the reverse of what would be expected if there were a pollination deficit.
As above, to verify that supplemental pollination had no significant effect on fruit size and seed variables in the trial with the lowest level of naturally occurring open pollination, I did a post-hoc analysis using two sample t-tests of all four variables for Griswold 2014, and none of the variables had a significant difference (fruit weight: t = −0.630, df =33, p = 0.267; fruit diameter: t = −0.507, df = 33, p = 0.308; seed weight: t = 0.177, df = 33, p = 0.430; and seed number: t = −0.334, df = 33, p = 0.370).
Based on these analyses, 2300 pollen grains per stigma was set as our threshold for adequate pollination in evaluating pollen deposition in further studies. This was not necessarily the minimum required for full pollination, which could be well below this level. This experiment could not establish a minimum requirement for full pollination, but did establish a threshold that is sufficient.

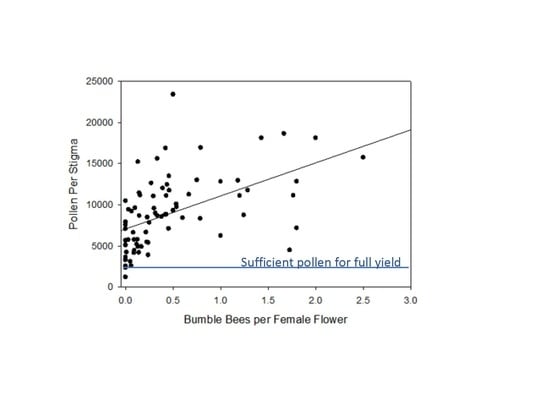
3.2. Measurement of Pollen Deposition on Stigmas of Pumpkin and Winter Squash Flowers on Fields across Connecticut and Relationship to the Hourly Counts of Bees on 100 Flowers

For the 80 sets of samples (combinations of location and sample date) comprising 1069 stigmas for which pollen deposition was measured, taken on farms across the state, pollen deposition per stigma generally met, and usually far exceeded, the threshold of 2300 pollen grains sufficient for full pollination, regardless of the pest management practices used and across all four years. While there was considerable variation within each category, pollination was adequate across the range of farm types and pest management practices (Figure 1A), and across all four years (Figure 1B).The mean pollen deposition for all combinations of site and date was 9059 grains per stigma (sd 4453). Only one set had mean pollen deposition less than 2300 pollen grains per stigma (1205 grains per stigma, at the same site as the lowest pollen deposition in the supplemental pollination trials, our experimental farm at Griswold, on a different date, 24 July 2012). Pollen deposition and bee counts for each farm and sample date are included in Supplementary File Table S2.
There was a weak but significant relationship between the total number of bees counted on all flowers, including both male and female flowers, and the number of pollen grains deposited on the stigmas (df = 1.79; F = 4.326; p = 0.04; r = 0.229; adjusted r2 = 0.04). There was a stronger significant relationship between bees counted on only the female flowers and pollen deposition on the stigmas (df = 1.76; F = 12.977; p < 0.001; r = 0.384, adjusted r2 = 0.14). This relationship was analyzed further with multiple regression of pollen deposition on the counts of each of the three major bee species (bumble bees, honey bees, and squash bees) on only the female flowers. While this multiple regression was statistically significant, the results indicated that the count of bumble bees on the female flowers was the only independent variable necessary in the model (df = 3.73; F = 10.193; p < 0.001; Table 3) The relationship of counts of bumble bees per female flower to pollen deposition per stigma is shown in Figure 2.

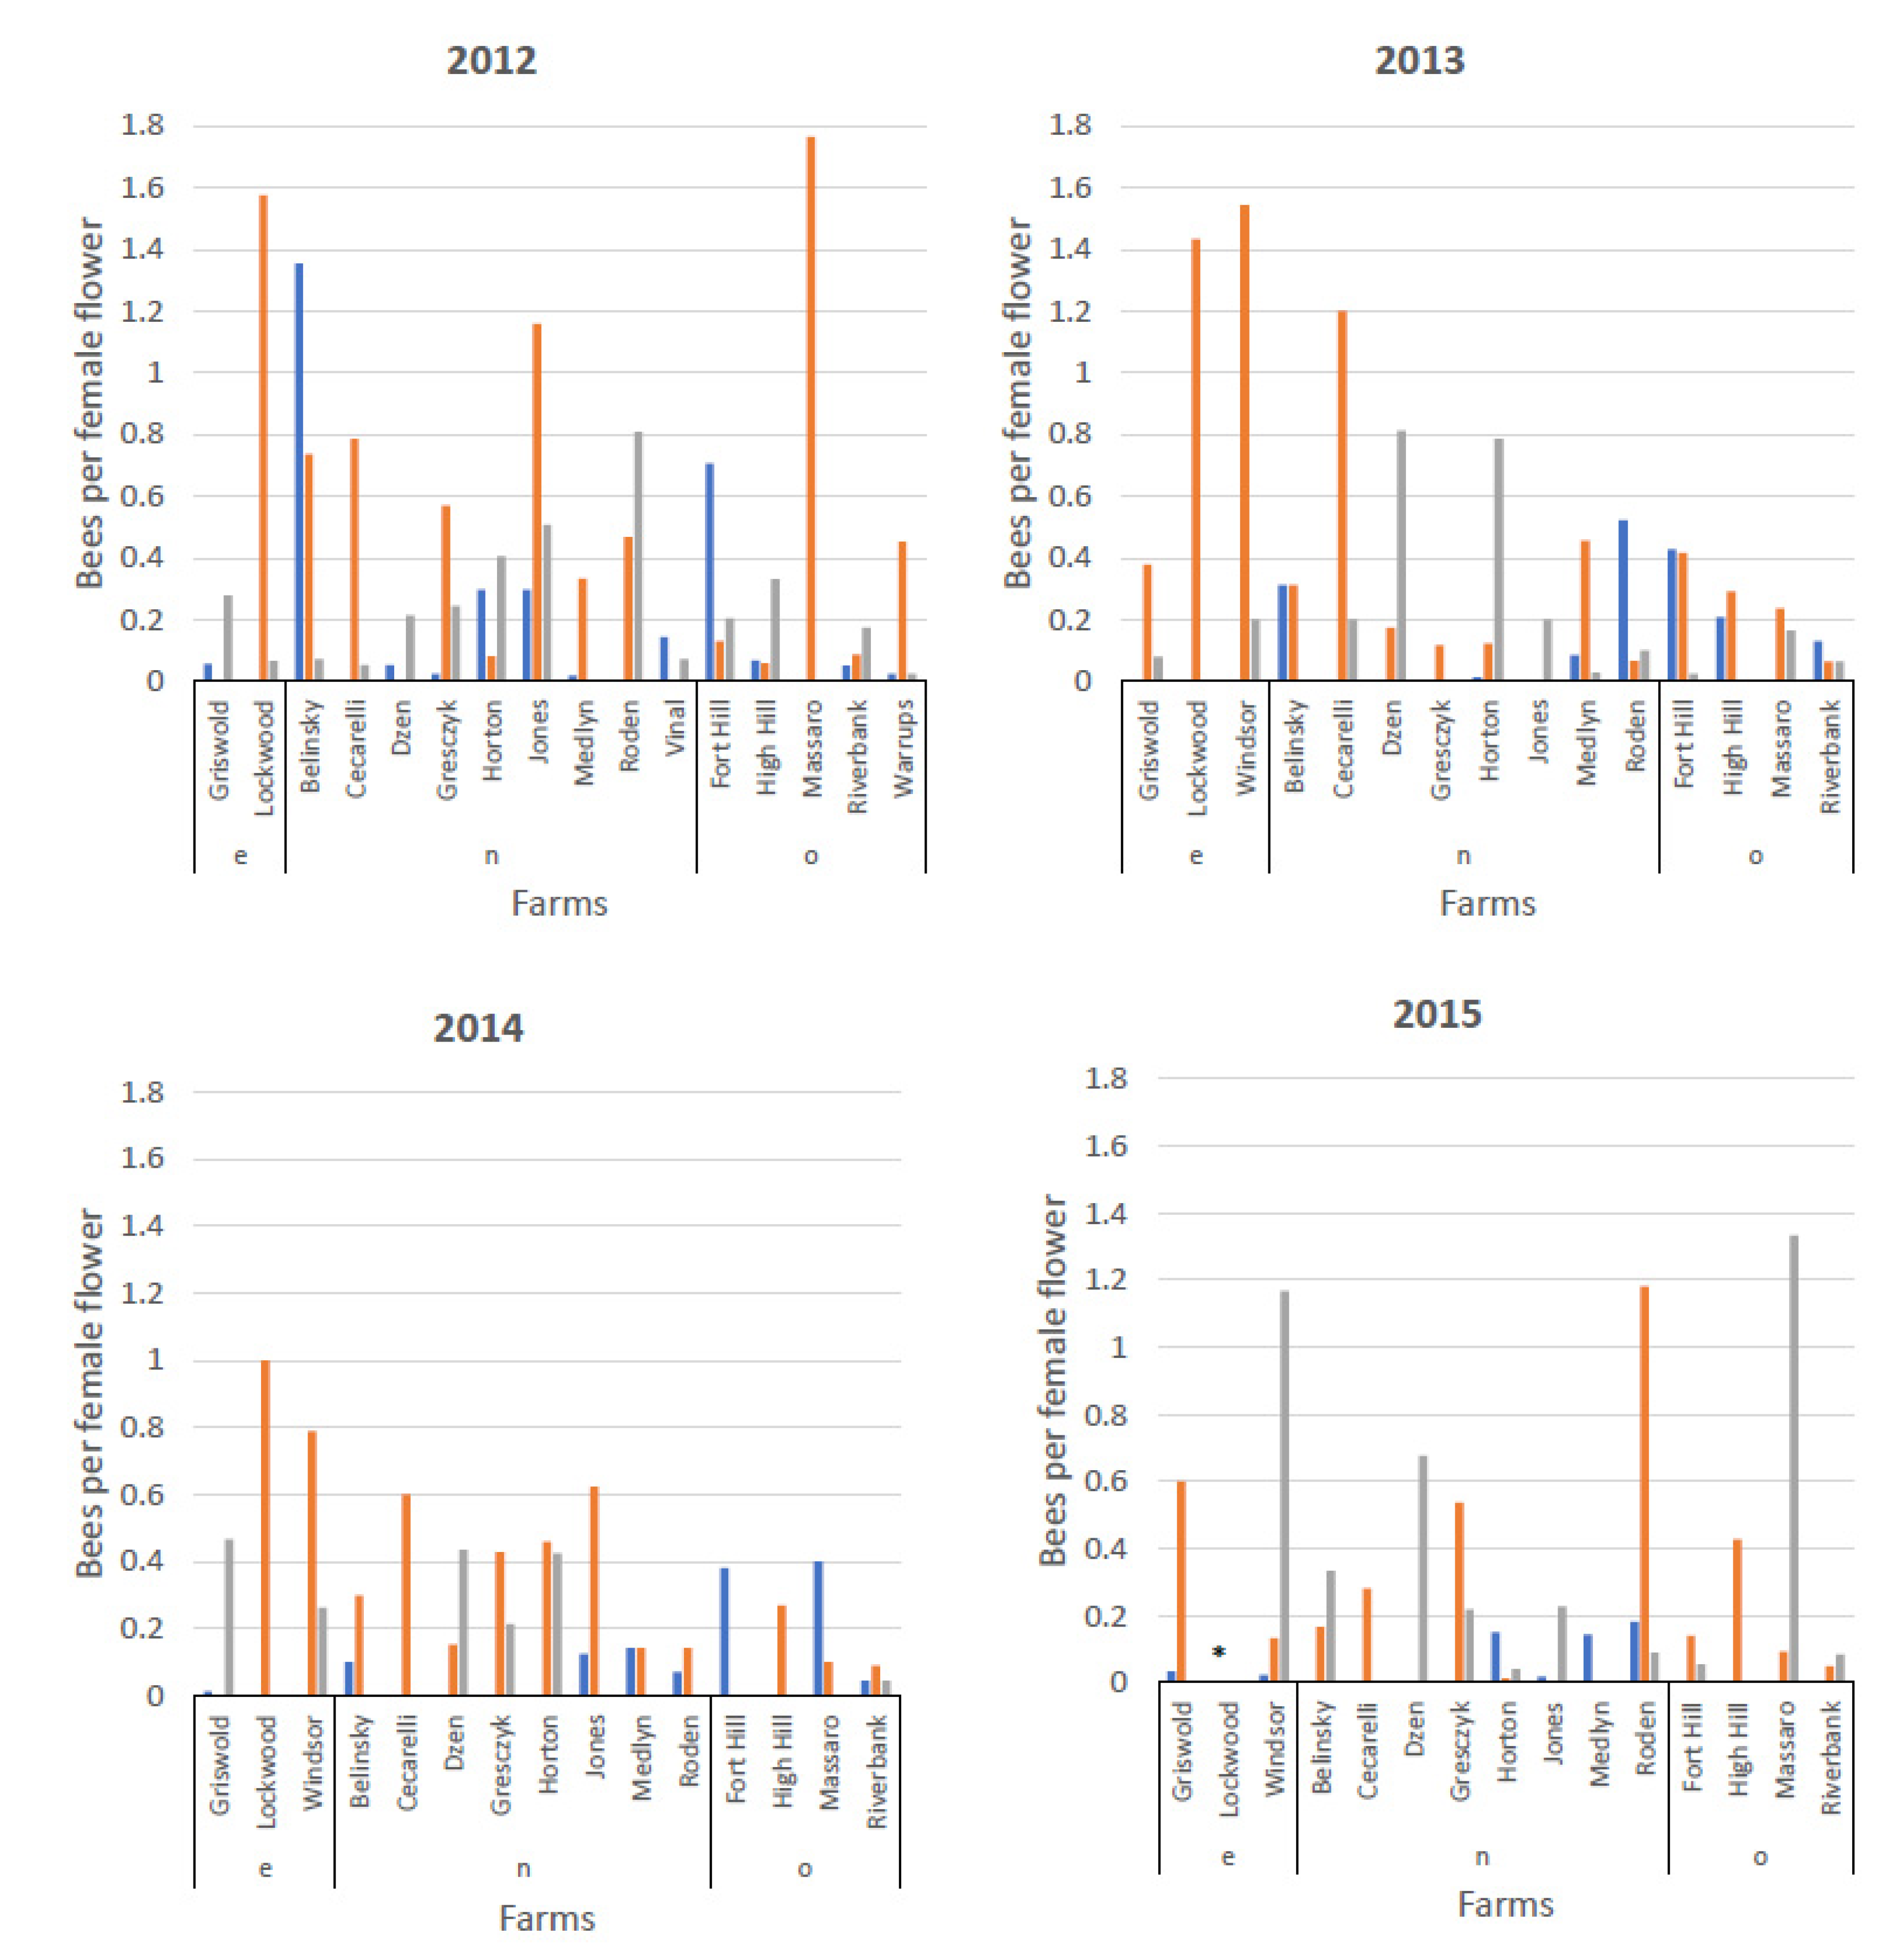
3.3. Visitation by Bee Species to Male and Female Flowers and Distribution of Bee Species on Female Flowers by Farm

The overall trend over the four years of the study was a decline in the numbers of bumble bees and squash bees visiting both male and female flowers from 2012 to 2015, while honey bee visitation dipped in 2014, but otherwise held steady (Table 4). Honey bees provided an increasing proportion of all visits to female flowers as numbers of bumble bees and squash bees declined in 2015. Bumble bees accounted for 44% to 64% of the total visits to female flowers over the four years, with the lowest percentage in 2015, while honey bees accounted for 21% to 46% with the highest percentage in 2015, and squash bees accounted for 7% to 19% with the lowest percentage in 2015.
All three bee species, taken together and as individual species, disproportionately visited female flowers in relation to the number of female flowers in the field (Table 4). The hypothesis that bees visited male and female flowers equally was rejected for all species together (χ2 = 2108.7, df = 1, 4, p < 0.00001), and also for each of the three main species individually and for other bees (for bumble bees: χ2 = 26.34, df = 1, p < 0.00001; for honey bees: χ2 = 2099.44, df = 1, p < 0.00001; for squash bees: χ2 = 105.48, df = 1, p < 0.00001; other bees: χ2 = 7.36, df = 1, p = 0.0067). Honey bees showed a particularly strong preference for female flowers, so that the number of honey bees observed per female flower varied from 2.8 X the number per male flower (in 2012) to 7.7 X in (2013). For bumble bees, this preference was not as strong, but there were consistently 1.6 to 2.2 X the number of bumble bee visits in female flowers compared to male flowers. Squash bees and other bees had the same trend, but the year-to-year results were more variable, likely because of the smaller numbers of these bees, particularly in 2014 and 2015.
The overall trends shown in Table 4 were superimposed on tremendous variation in species composition and overall numbers of bee visitation to female flowers among farms each year and among years on many of the farms, as shown in Figure 3. For example, at Massaro Farm, bumble bee visitation dominated in 2012, followed by a year with approximately equal and much lower visitation by both bumble bees and honey bees in 2013, then primarily squash bees in 2014, and finally primarily honey bees in 2015.

4. Discussion

In our experimental trials comparing natural open pollination to supplemental hand pollination, naturally occurring levels of open pollination were not limiting to fruit set, survival of fruit to harvest, or fruit size or weight, which are components of yield, nor was natural open pollination limiting to the number and weight of fully expanded seeds, which are direct measurements of full pollination [15]. Because there was no significant difference in these parameters with supplemental pollination in a trial with the mean level of natural open pollen deposition of 2326 pollen grains per stigma (sd 1152), I used 2300 pollen grains as a threshold sufficient for full pollination. This is somewhat higher and thus conservative in relation to thresholds found in previous studies with C. pepo cultivars of pumpkin [18,19], and slightly lower than the threshold found for C. maxima Hokkaido [20]. This threshold for pollen deposition was met in all but one of 80 combinations of date and location, across a wide range of farm sizes and pest management practices, and over four years.
Of the measurements of bee activity taken in our hourly counts of bees in 100 flowers, the number of bumble bees observed in female flowers was most closely related to the amount of pollen deposited on the stigmas. Previous studies have shown that bumble bees deposit more pollen per visit to female flowers than honey bees [7,20] or squash bees [7]. Artz et al. [7], identified several aspects of bee behavior that could explain the greater effectiveness of bumble bees as pollinators of Cucurbita. Bumble bees were more likely to contact the stigma during a visit to a female flower, frequently landing directly on the stigma, while honey bees often landed on the flower petals and proceeded directly to the nectary, and did not necessarily make contact with the stigma [7].
While the bumble bees are the most effective pollinators, pollen deposition was still above the threshold in seven cases in which no bumble bees were counted on the female flowers, as can be seen in Figure 3. Because the hourly 100 flower bee counts were a series of snapshots, and only a small percentage of the flowers counted were female (mean 8%), the absence of bumble bees counted in female flowers does not mean they were absent from the field. (The only case in which no bumble bees were found in counts on the male or female flowers was at Griswold in 2012, which was the only case where pollen deposition fell below the threshold.) Nevertheless, the consistently sufficient level of pollen deposition over farms and years with highly variable numbers of bees of each species visiting female flowers indicates that all three species contribute to maintaining the level of pollination well above a threshold sufficient for pumpkin and winter squash production. Additional studies are in progress focusing specifically on timed observations and video recordings of bee activity on female pumpkin and squash flowers in order to better understand the role of each species in pollination.
The trends toward declining counts of bumble bees and squash bees over the four years of the study, and toward reduced pollen deposition in 2015, raise concerns about the long-term sustainability of pumpkin and squash pollination. The decline in numbers of squash bees is alarming because in 2014 and 2015 we began the hourly bee counts two hours earlier in order to better capture squash bee activity, based on reports in the literature that squash bees started visiting flowers at dawn [12,21], but the numbers of squash bees observed continued to decline. Chan et al. [24] found that levels of neonicotinoids found in field soil from seed treatments and soil applications posed a significant hazard through soil contact to squash bees, which nest in the ground, preferring to nest in disturbed soil in cultivated fields [25].
Unlike squash bees, which are Cucurbita specialists and solitary bees active during only a few weeks of the year [14], the abundance and foraging habits of the generalist species B. impatiens with its complex annual life cycle could be affected by many different factors across the landscape and throughout the year [26]. Bumble bees in different stages of their life cycle have multiple potential routes of pesticide exposure, many of which have not been well studied, particularly for queen bumble bees [27,28]. The quality and diversity of floral resources throughout both spring and summer seasons within 1 km have a strong effect on the survival of bumble bee colonies from one year to the next, and thus the availability of wild colonies for crop pollination [29]. Pumpkin and winter squash are only two of the many crops that rely on bumble bees, and in eastern North America, B. impatiens in particular, for pollination. When Kleijn et al. [30] identified the small number of pollinator species that dominate the economic contribution of wild bees to crop production, B. impatiens ranked number one in the world, based on 23 studies of its importance in seven crops, including apple, cranberry, blueberry, tomato, muskmelon, and watermelon, as well as squash. This result is probably biased by the number of studies of the economic value of crop pollination that have been conducted in eastern North America, but still, this species is undeniably critical to the pollination of fruits and fruiting vegetables in this region. Some of the dominance of this species may be a result of the decline of other bumble bee species in this region [31,32,33]. All indications are that B. impatiens remains abundant and expanding in geographical range [31,32,33], but the importance of this species in crop production, as well as its role as an important generalist pollinator in natural systems [33], warrant close attention to the population, foraging needs, and health of this critical species.

Supplementary Materials

The following are available online at https://www.mdpi.com/2073-4395/10/8/1141/s1. Supplementary File Table S1—farm area, crop, honey bees, pest management; Supplementary File Table S2—pollen, bee counts.

Funding

This research was funded by National Institute of Food and Agriculture, U.S. Department of Agriculture, grant number #2011-51181-30673 as the Specialty Crops Research Initiative project, “Pollination Security for the Northeast.”

Acknowledgments

Great thanks to the farm managers at the CAES farms: Rich Cecarelli at Lockwood Farm, Rob Durgy at Griswold, and Jim Preste at Windsor, and to the other farmers across the state who cooperated with this project. Thanks to Roberta Glatz for guiding me to the horticultural literature about pumpkin pollination, to Susan Willis Chan for explaining her methods of measuring pollen deposition on pumpkin stigmas, and Frank Ferrandino for assistance with statistical methods. Morgan Lowry, Krystian Madrid, Ellen Bulger, Christine Bell, Meghan Stucke, Ben Gluck, Amelia Tatarian, Jess Gambel, and Erica Carbone did the sampling in the field and the laboratory measurements. Thanks to Jude Boucher of University of Connecticut Cooperative Extension for helping to identify participating farmers. Thanks to Anne Averill of the University of Massachusetts for heading the project “Pollination Security for the Northeast”, and to Frank Drummond of University of Maine, Bryan Danforth of Cornell University, and their students and colleagues for valuable input during the course of the project.

Conflicts of Interest

The authors declare no conflict of interest. The funders had no role in the design of the study; in the collection, analyses, or interpretation of data; in the writing of the manuscript, or in the decision to publish the results.

References

  1. Quick Stats, National Agricultural Statistics Service. Available online: https://quickstats.nass.usda.gov/ (accessed on 11 May 2020).
  2. Stapleton, S.C.; Wien, H.C.; Morse, R.A. Flowering and fruit set of pumpkin cultivars under field conditions. HortScience 2000, 35, 1074–1077. [Google Scholar] [CrossRef]
  3. Loy, J.B. Morpho-physiological aspects of productivity and quality in squash and pumpkins (Cucurbita spp.). Crit. Rev. Plant. Sci. 2004, 23, 337–363. [Google Scholar] [CrossRef]
  4. Shuler, R.E.; Roulston, T.H.; Farris, G.E. Farming practices influence wild pollinator populations on squash and pumpkin. J. Econ. Entomol. 2005, 98, 790–795. [Google Scholar] [CrossRef] [PubMed]
  5. Julier, H.E.; Roulston, T.H. Wild bee abundance and pollination service in cultivated pumpkins: Farm management, nesting behavior and landscape effects. J. Econ. Entomol. 2009, 102, 563–573. [Google Scholar] [CrossRef] [PubMed]
  6. Artz, D.R.; Hsu, C.L.; Nault, B.A. Influence of honey bee, Apis mellifera, hives and field size on foraging activity of native bee species in pumpkin fields. Environ. Entomol. 2011, 40, 1144–1158. [Google Scholar] [CrossRef] [PubMed] [Green Version]
  7. Artz, D.R.; Nault, B.A. Performance of Apis mellifera, Bombus impatiens, and Peponapis pruinosa (Hymenoptera: Apidae) as pollinators of pumpkin. J. Econ. Entomol. 2011, 104, 1153–1161. [Google Scholar] [CrossRef] [PubMed]
  8. Petersen, J.D.; Reiners, S.; Nault, B.A. Pollination services provided by bees in pumpkin fields supplemented with either Apis mellifera or Bombus impatiens or not supplemented. PLoS ONE 2013, 8, e69819. [Google Scholar] [CrossRef] [Green Version]
  9. Phillips, B.W.; Gardiner, M.M. Use of video surveillance to measure the influences of habitat management and landscape composition on pollinator visitation and pollen deposition in pumpkin (Cucurbita pepo) agroecosystems. PeerJ 2015, 3, e1342. [Google Scholar] [CrossRef] [Green Version]
  10. McGrady, C.M.; Troyer, R.; Fleischer, S.J. Wild bee visitation rates exceed pollination thresholds in commercial Cucurbita agroecosystems. J. Econ. Entomol. 2019, 113, 562–574. [Google Scholar] [CrossRef]
  11. Winfree, R.; Reilly, J.R.; Bartomeus, I.; Cariveau, D.P.; Williams, N.M.; Gibbs, J. Species turnover promotes the importance of bee diversity for crop pollination at regional scales. Science 2018, 359, 791–793. [Google Scholar] [CrossRef] [Green Version]
  12. Cane, J.H.; Sampson, B.J.; Miller, S.A. Pollination value of male bees: The specialist bee Peponapis pruinosa (Apidae) at summer squash (Cucurbita pepo). Environ. Entomol. 2011, 40, 614–620. [Google Scholar] [CrossRef] [PubMed]
  13. Brochu, K.K.; van Dyke, M.T.; Milano, N.J.; Petersen, J.D.; McArt, S.H.; Nault, B.A.; Kessler, A.; Danforth, B.N. Pollen defenses negatively impact foraging and fitness in a generalist bee (Bombus impatiens: Apidae). Sci. Rep. 2020, 10, 3112. [Google Scholar] [CrossRef] [PubMed] [Green Version]
  14. Hurd, P.; Linsley, E. The squash and gourd bees—Genera Peponapis Robertson and Xenoglossa Smith—Inhabiting America north of Mexico (Hymenoptera: Apoidea). Hilgardia 1964, 35, 375–477. [Google Scholar] [CrossRef] [Green Version]
  15. Knapp, J.L.; Osborne, J.L. Cucurbits as a model system for crop pollination management. J. Pollinat. Ecol. 2019, 25, 89–102. [Google Scholar]
  16. Walters, S.A.; Taylor, B.H. Effects of honey bee pollination on pumpkin fruit and seed yield. HortScience 2006, 41, 370–373. [Google Scholar] [CrossRef] [Green Version]
  17. Riggs, D.I.M.; Robinson, R.W.; Howell, J.C.; Reiners, S.; McClurg, C.A.; Rouse, R.; Wien, H.C.; Glatz, R.J.; Morse, R.A.; Zitter, T.A.; et al. Pumpkin Production Guide; Riggs, D.I.M., Ed.; Plant and Life Sciences Publishing: Ithaca, NY, USA, 2003; p. 150. [Google Scholar]
  18. Cady, S.W. Pollination and Flowering Patterns of Field-Grown Pumpkin (Cucurbita pepo). Master’s Thesis, Cornell University, Ithaca, NY, USA, 1995. [Google Scholar]
  19. Vidal, M.G.; Jong, D.; Wien, H.C.; Morse, R.A. Pollination and fruit set in pumpkin (Cucurbita pepo) by honey bees. Braz. J. Bot. 2010, 33, 106–113. [Google Scholar] [CrossRef] [Green Version]
  20. Pfister, S.C.; Eckerter, P.W.; Schirmel, J.; Cresswell, J.E.; Entling, M.H. Sensitivity of commercial pumpkin yield to potential decline among different groups of pollinating bees. R. Soc. Open Sci. 2017, 4. [Google Scholar] [CrossRef] [Green Version]
  21. Tepedino, V.J. The pollination efficiency of the squash bee (Peponapis pruinosa) and the honey bee (Apis mellifera) on summer squash (Cucurbita pepo). J. Kans. Entomol. Soc. 1981, 54, 359–377. [Google Scholar]
  22. Nepi, M.; Pacini, E. Pollination, pollen viability and pistil receptivity in Cucurbita pepo. Ann. Bot. 1993, 72, 527–536. [Google Scholar] [CrossRef]
  23. Willis, D.S. The Pollination System of Cucurbita pepo and Peponapis pruinosa in Southern Ontario. Master’s Thesis, University of Guelph, Guelph, ON, Canada, 1993. [Google Scholar]
  24. Chan, D.S.W.; Prosser, R.S.; Rodríguez-Gil, J.L.; Raine, N.E. Assessment of risk to hoary squash bees (Peponapis pruinosa) and other ground-nesting bees from systemic insecticides in agricultural soil. Sci. Rep. 2019, 9, 1–13. [Google Scholar] [CrossRef] [Green Version]
  25. Skidmore, A.R.; Short, C.A.; Dills, C.; Goodell, K.; Bessin, R.T. Preference of Peponapis pruinosa (Hymenoptera: Apoidea) for tilled soils regardless of soil management system. Environ. Entomol. 2019, 48, 961–967. [Google Scholar] [CrossRef] [PubMed]
  26. Goulson, D.; Lye, G.C.; Darvill, B. Decline and conservation of bumble bees. Annu. Rev. Entomol. 2008, 53, 191–208. [Google Scholar] [CrossRef]
  27. Stoner, K.A. Current pesticide risk assessment protocols do not adequately address differences between honey bees (Apis mellifera) and bumble bees (Bombus spp.). Front. Environ. Sci. 2016, 4, 79. [Google Scholar] [CrossRef] [Green Version]
  28. Gradish, A.E.; van der Steen, J.; Scott-Dupree, C.D.; Cabrera, A.R.; Cutler, G.C.; Goulson, D.; Klein, O.; Lehmann, D.M.; Luckmann, J.; O’Neill, B.; et al. Comparison of pesticide exposure in honey bees (Hymenoptera: Apidae) and bumble bees (Hymenoptera: Apidae): Implications for risk assessments. Environ. Entomol. 2019, 48, 12–21. [Google Scholar] [CrossRef] [PubMed]
  29. Carvell, C.; Bourke, A.F.G.; Dreier, S.; Freeman, S.N.; Hulmes, S.; Jordan, W.C.; Redhead, J.W.; Sumner, S.; Wang, J.; Heard, M.S. Bumblebee family lineage survival is enhanced in high-quality landscapes. Nature 2017, 543, 547–549. [Google Scholar] [CrossRef] [Green Version]
  30. Kleijn, D.; Winfree, R.; Bartomeus, I.; Carvalheiro, L.G.; Henry, M.; Isaacs, R.; Klein, A.-M.; Kremen, C.; M’gonigle, L.K.; Rader, R. Delivery of crop pollination services is an insufficient argument for wild pollinator conservation. Nat. Commun. 2015, 6, 1–9. [Google Scholar] [CrossRef] [Green Version]
  31. Bartomeus, I.; Ascher, J.S.; Gibbs, J.; Danforth, B.N.; Wagner, D.L.; Hedtke, S.M.; Winfree, R. Historical changes in northeastern US bee pollinators related to shared ecological traits. Proc. Natl. Acad. Sci. USA 2013, 110, 4656–4660. [Google Scholar] [CrossRef] [Green Version]
  32. Cameron, S.A.; Lozier, J.D.; Strange, J.P.; Koch, J.B.; Cordes, N.; Solter, L.F.; Griswold, T.L. Patterns of widespread decline in North American bumble bees. Proc. Natl. Acad. Sci. USA 2011, 108, 662–667. [Google Scholar] [CrossRef] [Green Version]
  33. Jacobson, M.M.; Tucker, E.M.; Mathiasson, M.E.; Rehan, S.M. Decline of bumble bees in northeastern North America, with special focus on Bombus terricola. Biol. Conserv. 2018, 217, 437–445. [Google Scholar] [CrossRef]
Figure 1. Mean pollen grains deposited per stigma on female flowers of pumpkin and winter squash. (A) By pest management practice and crop mix; (B) By year. Blue line at 2300 grains indicates the number of grains sufficient for full pollination of pumpkins based on the current study. Neonic seed = seed treatment with Farmore®, a proprietary combination of thiamethoxam and fungicides (Syngenta Crop Protection Greensboro, NC, USA); neonic furrow = application of imidacloprid (Admire® Bayer Crop Protection, Research Triangle Park, NC, USA) or thiamethoxam (Platinum® Syngenta Crop Protection Greensboro, NC, USA) in the seed furrow at planting; neonic soil = soil application of imidacloprid (Admire®) by irrigation or spraying into seed holes; organic = minimal pesticide use (may include a single pyrethrin application; other = use of other insecticides such as bifenthrin, phosmet or carbaryl; and no insecticide = not using insecticides on cucurbits, but using fungicides.
Agronomy 10 01141 g001
Figure 2. Regression of mean pollen grains per stigma against the number of bumble bees per female flower in hourly 100 flower bee counts 2012–2015 (df = 1, 75; F = 27.123; p < 0.001; adjusted r2 = 0.26). Equation for line is y = 7059 + 4015x.
Agronomy 10 01141 g002
Figure 3. Bees by species per female flower in hourly 100 flower bee counts by farm and by year. Blue = squash bees, orange = bumble bees, and gray = honey bees; e = experimental farms, n = non-organic farms, and o = organic farms. * Lockwood in 2015 did not have any female flowers among the samples counted.
Agronomy 10 01141 g003
Table 1. Open pollen deposition on pumpkin stigmas and comparison of fruit set and survival to harvest from female pumpkin flowers pollinated naturally and with supplemental hand-pollination on three experimental farms.
YearFarmDateOpen Pollen Deposition on Stigma (Mean ± sd)No. Stigmas Open/Supplemental Pollination% Fruit Set Open Pollination% Fruit Set Supplemental% Harvested Open Pollination% Harvested Supplemental
2012Lockwood7 August 11/11 279
2012Lockwood14 August 5/6 6033
2012Lockwood21 August 7/6 7167
2013Griswold24 July15,604 ± 492419/1942474237
2013Griswold1 August16,856 ± 425826/2735413537
2013Lockwood6 August7175 ± 208014/14717100
2013Lockwood19 August15,728 ± 641330/3050601033
2013Lockwood27 August6770 ± 344413/1381708
2013Windsor5 August12,814 ± 415520/207555155
2013Windsor14 AugustNot available7/3711004367
2013Windsor22 August11,750 ± 375510/102020010
2014Griswold23 July2326 ± 115219/20951008495
2014Lockwood15 August12,795 ± 434221/20100959075
2014Windsor25 July16,919 ± 278020/2050655055
Mean ± sd over trials 11,874 ± 4945 56 ± 2961 ± 2938 ± 3138 ± 30
Table 2. Comparison of effects (mean ± standard deviation) of open (O) or supplemental (S) pollination of pumpkin on fruit weight and diameter, seed weight, and number of seeds > 1.5 cm in diameter.
SiteYearPollinationNo. FruitMean Fruit wt. (kg)Mean Fruit Diameter (cm)Mean Weight of Seeds (>1.5 cm)Mean No. Seeds (>1.5 cm)
Lockwood2012O116.20 ± 1.7526.49 ± 3.2372.94 ± 22.07599 ± 73
S86.20 ± 2.1926.41 ± 4.6661.42 ± 25.75561 ± 114
Griswold2013O168.74 ± 2.2730.55 ± 2.9380.98 ± 9.57488 ± 74
S199.03 ± 2.1231.30 ± 3.1178.78 ± 18.78445 ± 104
Lockwood2013O38.95 ± 0.9731.59 ± 2.1697.37 ± 13.87570 ± 2
S66.68 ± 0.7328.49 ± 1.2284.97 ± 8.35553 ± 30
Windsor2013O67.12 ± 1.6428.40 ± 2.5479.64 ± 17.51580 ± 36
S45.68 ± 2.2125.23 ± 3.7354.11 ± 9.51543 ± 91
Griswold2014O167.09 ± 1.4728.84 ± 2.3997.06 ± 21.32555 ± 101
S197.42 ± 1.6229.27 ± 2.6298.11 ± 13.56564 ± 52
Lockwood2014O184.41 ± 1.1924.09 ± 2.6976.88 ± 18.11543 ± 79
S154.62 ± 1.9224.18 ± 3.6870.93 ± 24.77506 ± 90
Windsor2014O105.12 ± 1.1724.71 ± 2.6986.96 ± 24.28528 ± 100
S114.60 ± 1.6323.92 ± 3.5572.78 ± 28.67482 ± 141
Mean over trials O 6.8 ± 1.727.81 ± 2.8484.55 ± 9.64552 ± 37
S 6.3 ± 1.626.98 ± 2.7974.44 ± 14.65522 ± 46
Table 3. Model parameters from multiple regression of the relationship of pollen deposition on the stigma to counts of bees on female flowers.
Terms in the ModelCoefficientStd. Errortp
Constant7149.935737.709.692<0.001
Bumble bees per female flower3937.689798.434.932<0.001
Honey bees per female flower−1161.0831277.63−0.9090.366
Squash bees per female flower1763.5931323.031.3330.187
Table 4. Number of flowers of each sex observed in hourly 100 flower bee counts, and the mean bees per flower visiting each flower by species. BB = bumble bee, HB = honey bee, SB = squash bee, Other = other bee species. Mean bees per flower by sex calculated for each site and date and then averaged by year.
2012
Sex of FlowerFlowers ObservedBB per FlowerHB per FlowerSB per FlowerOther per FlowerTotal
F11330.640.250.210.0131.12
M84660.380.090.130.0080.60
Total96040.400.110.140.0080.65
2013
Sex of FlowerFlowers ObservedBB per FlowerHB per FlowerSB per FlowerOther per FlowerTotal
F7040.500.260.090.0080.86
M10,2960.230.030.060.0030.322
Total10,2000.260.040.070.0030.37
2014
Sex of FlowerFlowers ObservedBB per FlowerHB per FlowerSB per FlowerOther per FlowerTotal
F3750.360.120.090.0000.56
M73250.220.030.070.0010.32
Total77000.220.040.070.0010.34
2015
Sex of FlowerFlowers ObservedBB per FlowerHB per FlowerSB per FlowerOther per FlowerTotal
F8930.250.250.040.0100.55
M88590.150.050.050.0080.26
Total97520.170.090.050.0090.31

