Article

Influence of Rice Husk Biochar and Compost Amendments on Salt Contents and Hydraulic Properties of Soil and Rice Yield in Salt-Affected Fields

1
Graduate School of Bio-Applications and Systems Engineering, Tokyo University of Agriculture and Technology, Tokyo 184-8588, Japan
2
Department of Soil Science, Can Tho University, Campus II, Can Tho 900100, Vietnam
3
School of Biosciences, University of Nottingham, Sutton Bonington Campus, Leicestershire LE12 5RD, UK
4
Agricultural Extension Center of Kien Giang Province, Rach Gia 9200000, Vietnam
*
Authors to whom correspondence should be addressed.
Agronomy 2020, 10(8), 1101; https://doi.org/10.3390/agronomy10081101
Submission received: 17 June 2020 / Revised: 28 July 2020 / Accepted: 28 July 2020 / Published: 30 July 2020

Abstract

:
Soil salinity may damage crop production. Besides proper management of irrigation water, salinity reduction can be achieved through soil amendment. The objectives of this study were to evaluate the effects of rice husk biochar and compost amendments on alleviation of salinity and rice growth. Field experiments were conducted at two salt-affected paddy rice fields located in distinct sites for five continuous crops. Treatments, with four replicates, consisted of continuous three rice crops per year (RRR), two rice crops rotated with fallow in spring–summer crop (FRR), FRR plus compost at 3 Mg ha−1 crop−1 (FRR + Comp), and biochar at 10 Mg ha−1 crop−1 (FRR + BC). Salt contents and hydraulic properties of soils, plant biomass, and plant uptake of cations were investigated. Soil bulk density (BD), exchangeable sodium (Na+), and exchangeable sodium percentage (ESP) were reduced remarkably by biochar application. Biochar application significantly increased other soil properties including total porosity, saturated hydraulic conductivity (Ksat), soluble and exchangeable potassium (K+), K+/Na+ ratio, available P, and total C. Compost application also improved BD, total porosity, and available P, but not exchangeable Na+ and ESP. Total aboveground biomass of rice showed a trend of FRR + BC > FRR + Comp > FRR > RRR. Relatively higher K+ uptake and lower Na+ uptake in rice straw in FRR + BC resulted in a significant two times higher K+/Na+ ratio over other treatments. Our results highlight that biochar amendment is a beneficial option for reducing ESP and providing available K+ and P under salinity-affected P-deficient conditions, hence improving straw biomass.

1. Introduction

Soil salinity is a major global issue threating agricultural productivity and sustainability. Salt-affected soil is a general term used for soils containing either high exchangeable sodium percentage (ESP) or soluble salts [1]. Most salt-affected soils occur in semi-arid and arid regions of Asia, Australia, and South America [2], but are also found in some sub-humid to humid climate areas and along coastal areas [3]. Salt-affected soils are spreading globally in at least 75 countries [4], and occupy 20–30% of global irrigated areas and 10% of total arable land [5]. Salt-affected soils are projected to increase in coastal areas due to a rise in sea level caused by future climate changes [6]. The electrical conductivity of saturated soil paste extract (ECe) of salt-affected soils is < 4 mS cm−1 [1]. ESP is an important indicator for salt-affected soils. According to Raine and Loch [7], ESP < 6 is defined for “non-sodic” soil, ESP from 6 to < 15 for “considered-sodic” soil, and ESP ≥ 15 for sodic soil. The maximum yield of rice is < 90% when the ESP value is 10 in paddy soil [8]. Reports show that the reduction in yield due to salinization is variable—circa 10–90% for wheat, 20–50% for rice, and 30–90% for sugarcane [9,10]. For rice, a loss of up to 1 Mg ha−1 per unit of electrical conductivity (EC; mS cm−1) has been reported [11], although different crops have different salt tolerances. Soil degradation due to salinity is thus a major environmental barrier for agricultural production. These challenges in salt-affected soils include poor chemical and physical properties that affect crops. The inhibitory effects of salinity on plants are mainly caused by ion toxicity and osmotic effects [12]. These constraints in salt-affected soils cause nutritional disorders and limit the uptake of essential nutrients (K, Ca, P, etc.) and hinder root respiration [13]. With the need to supply more food to an expanding global population, there is a critical need to enhance the efficiency of production on all agricultural lands, including salt-affected areas [14].
The most effective method to remove soluble salts from soil is via leaching. It has been demonstrated that when organic matter such as animal manure, farm yard manure, or municipal wastes was applied to saline soils, sodium (Na+) leaching can be accelerated through increasing soil porosity, hydraulic conductivity, and biopore networks, and reducing bulk density [15,16,17,18]. Furthermore, compost application can also decrease exchangeable sodium percentage (ESP) and increase water-holding capacity and aggregate stability [19,20]. In addition, organic matter application to saline soils may have positive effects on microbial biomass and enzymatic activities [21,22,23].
Biochar is a residue from biomass pyrolyzed under low/no oxygen environments [24]. The effects of biochar on remediating salt-affected soils were variable and emphasize that it is important to accumulate more data to generalize the effects of biochar. The improvement of salt-affected soils by applying biochar is considered to be via supplying nutrients such as calcium (Ca2+) and magnesium (Mg2+) [13,25,26], which aid in Na+ exchange. In addition, biochar application can make soil structure more conducive to Na+ leaching [27,28,29]. In a previous study, we demonstrated in column experiments that rice husk biochar stimulated the removal of Na+ and reduced ESP significantly in saline soil. However, the results of biochar application on removing Na+ are variable. While some studies showed the decrease in Na+ concentration in soil [27,30], the increase of Na+ concentration in soil was also reported in other studies [31,32] or Na+ concentration was not changed significantly [32,33].
Most biochar-related studies to date have evaluated the benefits of biochar incorporation in non-saline soils. In addition, most biochar-related studies on salt-affected soils have been undertaken using laboratory-based incubation experiments, or small-plot experiments under greenhouse conditions, without leaching [32,34,35,36]. Laboratory-based experiments revealed the effects of biochar on the removal of Na+ from the soil column under conditions of continuous water supply [27,29]. By contrast, another incubation experiment without leaching observed an increase in exchangeable Na+ in soil arising from biochar application [32]. Several plot experiments conducted in glasshouses reported an increase in the height or dry weight of maize by applying biochar, but the yield was not reported, and without leaching provision to remove Na+ [34,35]. Thus, the effectiveness of biochar application is considered to relate to how much Na+ is leached out from salt-affected soils by increasing soil hydraulic conductivity and porosity, but this remains unclear. Studies addressing the effects of biochar on rice cropping patterns in salt-affected soils are insufficient [33]. The objectives of this study were therefore to evaluate the effects of biochar and compost amendments on alleviation of the constraints in salt-affected soils and on rice growth in fields, and to determine which characteristics of amendments influence the effects. The hypothesis was that improvement of physical structure combined with providing essential elements from organic amendments can dilute and remove Na+ from soil, and hence reduce soil ESP, resulting in an increase in rice yield.

2. Materials and Methods

2.1. Compost and Biochar

The compost used in the experiment was a commercial product made from sugarcane filter cake (Phan Huu Co Sinh Hoc Nha Nong PPE, PPE Co., Ltd., Can Tho, Vietnam). Biochar was also a commercial product made from rice husk (Mai Anh Co., Dong Thap, Vietnam) by slow pyrolysis at a maximum pyrolysis temperature of 700 °C with particle sizes of < 0.1 mm (20%), 0.1–2 mm (78.7%), and > 2 mm (1.3%), and iodine number measured as described below was 152 mg g−1. Some chemical properties of compost and biochar are shown in Table 1.

2.2. Experimental Design

The experiment was conducted in two sites in the Vietnamese Mekong Delta—Thanh Phu district, Ben Tre province (BT) (9°58′22.51″ N, 106°28′51.22″ E) and U Minh Thuong district, Kien Giang province (KG) (9°43′34.43″ N, 105°10′55.06″ E) (Figure 1). The research areas were in a typical tropical moist climate with an average annual temperature of 27 °C. There are two seasons, including dry season from December to April and wet season from May to November. The annual rainfall in BT is 1400 mm [37], while in KG it is circa 2000 mm [38]. The average rainfall for each crop is variable, around 15%, 60%, and 25% of the total annual rainfall for spring–summer (February–May), summer–autumn (June–September), and winter–spring (October–January) crops, respectively (Figure 2). The fields have a long history of use for paddy rice cultivation (more than ten years). The soils are classified as Sali-Thionic Fluvisols at BT and Sali-Gleyic Fluvisols at KG according to the International Union of Soil Sciences (IUSS) Working Group World Reference Base for Soil Resources (WRB) (2015). Both experiment sites have been affected by salinity due to saline water intrusion in recent years and are classified as salt-affected soils. The main physicochemical properties of the initial soils (0–20 cm) before setting up the experiment are shown in Table 1.
The crop system was started from early 2018 following the cropping pattern: spring–summer (SS) from February to May 2018, summer–autumn (SA) from June to September 2018, winter–spring (WS) from October 2018 to January 2019, SS from February to May 2019, and SA from June to September 2019. Five continuous crops were conducted as follows: SS18, SA18, WS18–19, SS19, and SA19. The SS crop was chosen to rotate with fallow, since water availability is most limited in the dry season. Integrated on-farm trials were designed according to a completely random block with four replications (8 m × 5 m for each plot) in each treatment, including: RRR, Rice–Rice–Rice; FRR, Fallow–Rice–Rice; FRR + Comp, Fallow–Rice–Rice + compost; and FRR + BC, Fallow–Rice–Rice + biochar. All treatments received the same amount of NPK (inorganic) fertilizers, viz. urea, superphosphate, and potassium chloride at rates of 100 kg N, 60 kg P2O5, and 30 kg K2O ha−1 for the winter–spring crop (WS18–19) and 80 kg N, 60 kg P2O5, and 30 kg K2O ha−1 for SS18, SA18, SS19, and SA19. The total dose of P was applied as basal in each crop. For urea, 20% of total N was applied at 7 days after sowing or transplanting (depending on season); 40% of total N and 50% of total K were applied at 20 days after sowing or transplanting; and the remaining N and K were applied at 40 days after sowing or transplanting. Biochar was applied at the beginning of every crop combining with plowing (15 cm in depth) by a portable hand soil-ploughing machine at the rate of 10 Mg ha−1. Compost was applied as basal in each crop at a rate of 3 Mg ha−1 (moisture at 30%). The SA18 crop was started 1.5 months after sowing of SS18 because rice in the SS18 crop did not grow well due to severe water shortage, and biochar and compost were not applied for the SA18 crop. Therefore, the total amount of biochar applied through the five crops was 40 Mg ha−1, equivalent to 2.4% (w/w, assumed that the application was for 15 cm depth and the bulk density of soil was 1.1 g cm−3). The application rate of biochar was chosen based on the recommendation from International Biochar Initiative (from 5 to 50 Mg ha−1). In addition, our previous studies [27,39] suggested that a rate of 20 Mg ha−1 biochar was not enough for improvement of chemical properties in salt-affected soils and 50 Mg ha−1 was desirable. In this study, since a total of five crops were cultivated, we decided to apply 10 Mg ha−1 crop−1. The application rate of compost was based on the consideration of recommendation from the producer (0.5–1 Mg ha−1 for rice) and an equal input of extractable K+ and Ca2+, which are important parameters for leaching of Na+, to that of biochar. Rice varieties used were the same as that used by local famers at experimental sites, which included OM6162 for SA18 at BT, Tep Hanh (local variety) for WS18–19 at BT, and OM5451 for the rest of the crops. Transplanting was done in the WS18–19 crop at BT and direct sowing was used in the other crops at a rate of 150 kg seed ha−1. During the rice cropping season, the soil was continuously under water. Irrigation was stopped 15 days prior to harvest.
Disturbed soil samples were collected from 0 to 20 cm from the surface (five different points for each plot) by a soil core sampler for chemical and physical analysis as described below. Soil samples were collected at the end of each crop, mixed well, air dried, and sieved though a 2 mm screen. In addition, undisturbed soil samples were taken with 100 cm3 cores at two depths (0–15 and 15–30 cm) following the procedure of Dirksen [40] to measure bulk density and saturated hydraulic conductivity (Ksat).
To evaluate properties of plant growth, total plant biomass, excluding the root part, was collected at the harvesting stage from 2 × 0.25 m2 quadrats for each plot at the BT site, in which the soil was acid sulfate salt-affected soil and was more affected by salinity. All plants within the 2 × 0.25 m2 quadrats were cut at the soil surface. The aboveground parts were separated into straw and grain.

2.3. Sample Analysis

Soil pHw (H2O) and EC were determined by extracting soil with deionized water at a ratio of 1:2.5 (soil:water, w:v) and shaking for 1 h at 120 rpm. The extracts were measured using a pH meter (Metrohm 744) and an EC meter (Horiba B-173). Soluble Na, K, and Ca were determined by extracting soil with deionized water at a ratio of 1:10 (soil:water) and shaking for 1 h at 120 rpm. The mixture was centrifuged at 8000× g and passed through a filter paper (Advantec No. 5C) and ions in the filtrate were determined with flame photometry (Flame Photometers, BWB, Newbury, UK). Exchangeable Na, K, and Ca were obtained by subtracting soluble cations from extractable cations. Extractable cations were analyzed by extracting soil sample (2.5 g) three times with 0.1 M BaCl2 solution (each time with 30 mL, and shaking for 1 h at 120 rpm) and determined with flame photometry [41,42]. Cation-exchange capacity (CEC) was measured using the unbuffered BaCl2 extraction method [41,42]. Total N and C were determined using a CN Corder apparatus (MT-700, Yanaco Co., Tokyo, Japan). Available P was determined by the Bray II method [43].
Soil texture was classified using the United States Department of Agriculture (USDA)/Soil Taxonomy texture triangle after fractioning soil by the Robinson pipette method [44]. Bulk density was calculated as oven dry soil weight (105 °C) of undisturbed soil sample per bulk volume unit using the core method [45]. Total porosity was calculated from bulk density and particle density, which were determined using the pycnometer method [46]. Saturated hydraulic conductivity (Ksat) was measured by the amount of water infiltrating in an area-unit of soil in a unit of time. Ksat was determined using undisturbed soil cores, which were saturated prior to determination.
For biochar, iodine number was determined by extracting 0.5 g sample (90% passed through a 149 µm screen) with an iodine solution following the method described by the American Society for Testing and Materials (ASTM) International [47], since surface area is an important property of biochar [26,27].
The aboveground parts of rice plants were separated into straw and grain, oven-dried at 105 °C, and weighted for biomass. For the chemical analysis, all plant samples from quadrats were oven-dried at 65 °C and cut into small size (<2 mm) with scissors, mixed well, and homogenized for further analysis. Homogenous samples (0.5 g) were wet-digested using 5 mL H2SO4:HClO4 (9:1) and measured for total Na and total K using flame photometers, and for P by the ascorbic acid method.

2.4. Data Analysis

Significant differences (p < 0.05) between treatments were identified by one-way ANOVA followed by Fisher’s test. A normality test was conducted for residuals of data for every parameter. Since the normality of available P was not met as asessed by Kolmogorov-Smirnov’s test, the data were log-transformed prior to ANOVA. The average of replicates (n = 4) is presented with standard deviation in all tables and figures. Analysis of variance (ANOVA) with general linear model was performed to test the overall influence of treatment, season, and the interaction of the two factors on soil chemical properties. Then, Fisher’s test was performed for analysing significant differences for soil pH and EC. All these statistical tests were conducted with the Minitab (Version 19) software.
In addition, to analyse the overall effect of the main corresponding variables of soil physicochemical properties or plant biomass and nutrient concentrations among treatments, the principal component analysis (PCA) was used. PCA was run on a on a full set (normalized data) of soil physical-chemical properties or plant biomass and nutrient concentrations to get the same metric for all variables. PCA analysis was conducted by using PRIMER (Version 6).

3. Results

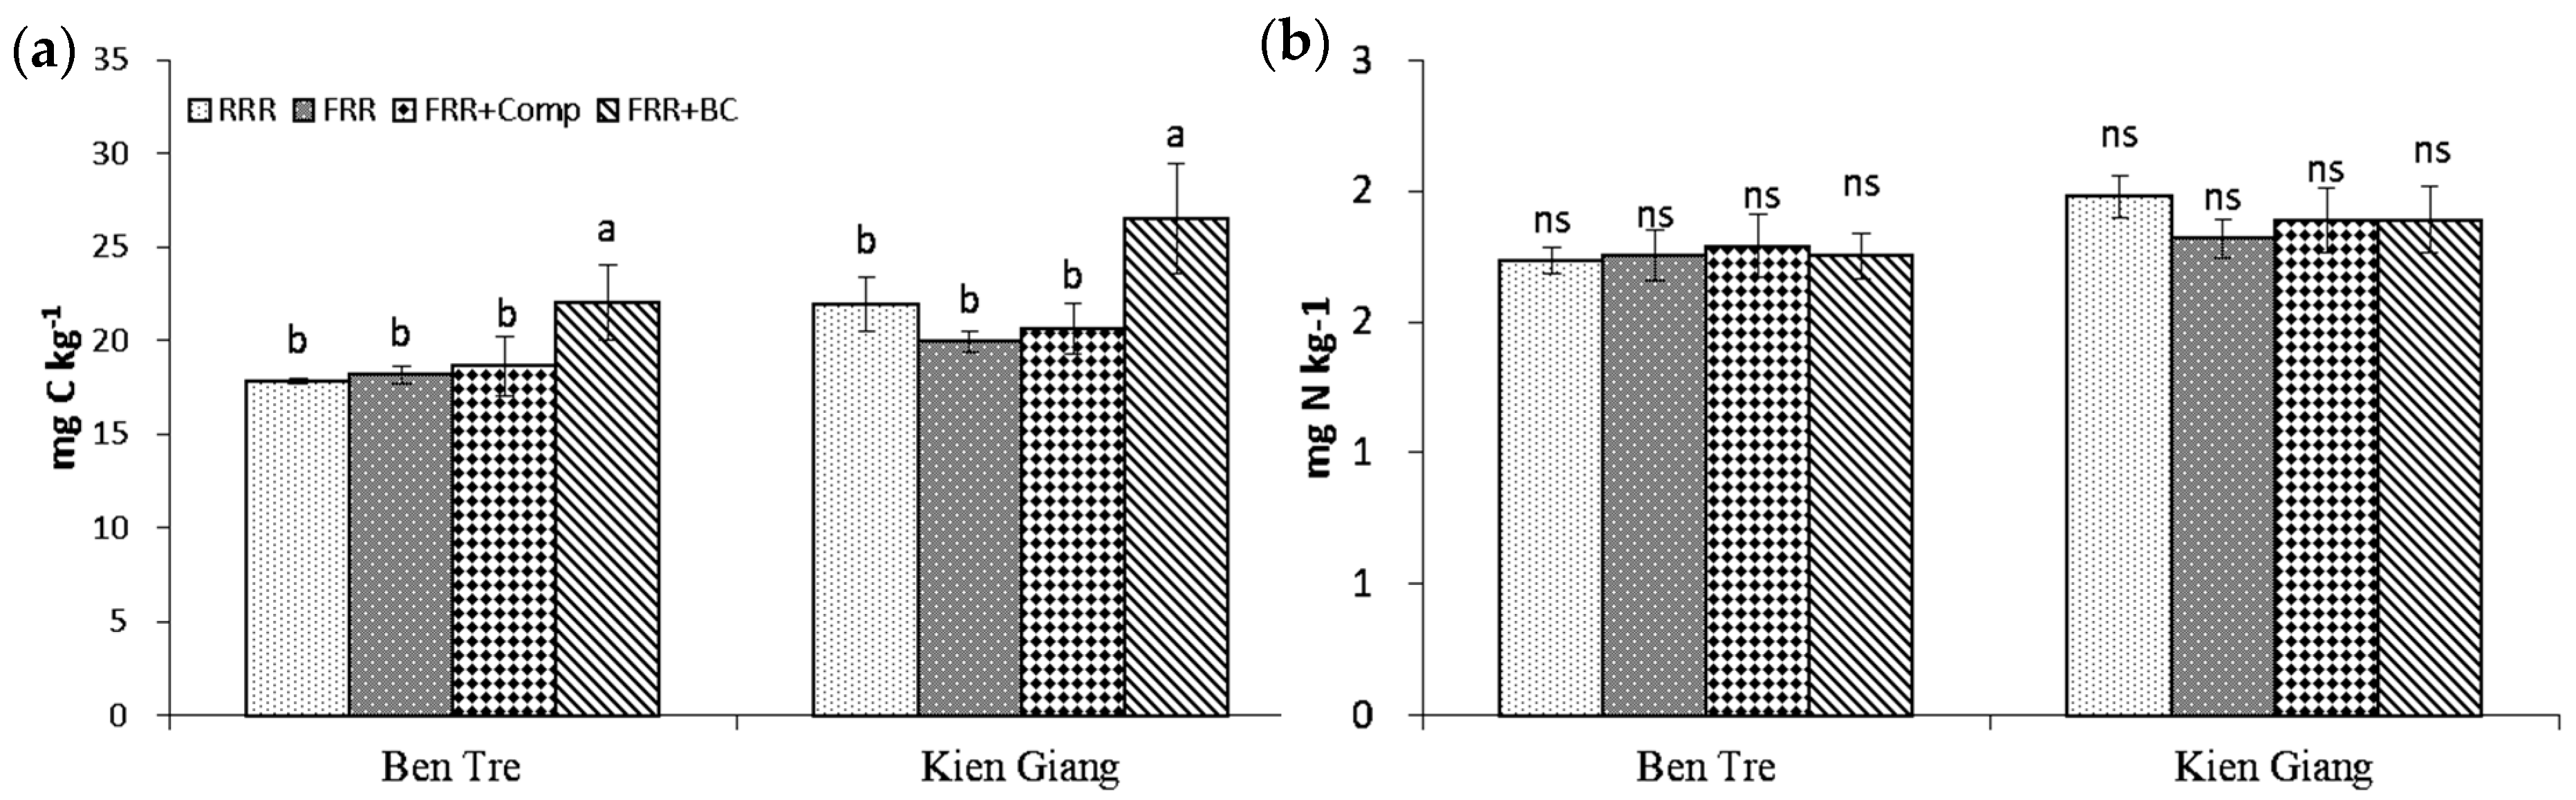
3.1. Nutritional and Chemical Properties of Experimental Soil

Soil pH (1:2.5) was affected by treatment and season (Figure 3a,b). At BT, biochar treatment (FRR + BC) decreased the average pH values in 5 sampling times by 0.15 units compared with those in FRR. For all treatments at BT, soil pH values were the lowest after spring–summer crops (SS18 and SS19). At KG, the soil pH was not affected by biochar, but was significantly affected by compost, with an increase of average 0.2 units. Soil pH was also variable depending on season. In both experimental sites, soil EC was significantly increased by compost application (Figure 3c,d). At BT, averaged across the 5 sampling times, the EC values were greater in FRR + Comp than in RRR and FRR, with an increase of 18% (p < 0.05). At KG, both compost and biochar treatments showed a significant increase in the average EC value compared with RRR, but not when compared to FRR. In all treatments, soil EC showed the highest values after SS crops and the lowest values after SA crops in both BT and KG sites.
Soluble Na+ was only affected by treatment in some seasons with FRR + Comp (Figure 4a,d). At BT, the highest soluble Na+ was observed in FRR + Comp (5.14 cmolc kg−1) in SS19. Soluble K+ was significantly greater by 2–3 fold in FRR + BC at both experimental sites. Soluble Ca2+ was not affected by treatment, except that it was lower in FRR in SS18 at BT and in SA18 at KG.
The exchangeable Na+ was significantly lower by an average of 16.5–27.5% in FRR + BC than in FRR in both experimental sites (Figure 4a,d). At BT, except for the SS18 crop, the lowest exchangeable Na+ concentration was in FRR + BC. There was no difference among the three other treatments. The lowest value of exchangeable Na+ was seen in FRR + BC after five crops (1.1 cmolc kg−1). At KG, similar results were observed and the lowest exchangeable Na+ was primarily in FRR + BC.
Exchangeable K+ concentrations were 2-fold greater in FRR + BC than in other treatments (Figure 4b,e), ranging from 1.15 cmolc kg−1 to 1.53 cmolc kg−1 at BT and from 1.08 cmolc kg−1 to 1.48 cmolc kg−1 at KG. Similarly, K+/Na+ ratio was significantly higher in FRR + BC by 100–200% (Figure 5a,d). The application of compost did not affect the K+/Na+ ratio.
The ESP value was significantly lower in FRR + BC (Figure 5b,e). The ESP value decreased to the lowest value after five crops in FRR + BC (7.9 cmolc kg−1 and 6.4 cmolc kg−1 in BT and KG, respectively).
Available P was significantly higher in FRR + BC and FRR + Comp than in FRR in most seasons (Figure 5c,f). In particular, available P was 5 times and 1.4 times greater in FRR + BC after five crops, at BT and KG, respectively. Compost also increased available P, but the effect was lower than that of biochar. After five continuous crop cultivation, total C increased significantly in FRR + BC by 4 mg kg−1 and 6.5 mg kg−1 compared with that in FRR at BT and KG, respectively, while total N was not different among treatments (Figure 6a,b).
The general linear model analysis showed that at BT, all soil chemical properties were influenced by both treatment and season, except exchangeable Ca2+ was not influenced by treatment and K+/Na+ ratio was not influenced by season. At KG, exchangeable Ca2+ and CEC were not influenced by either treatment, CEC and soluble Ca2+ were not influenced by treatment, and other soil chemical properties were influenced by both treatment and season (Table 2).

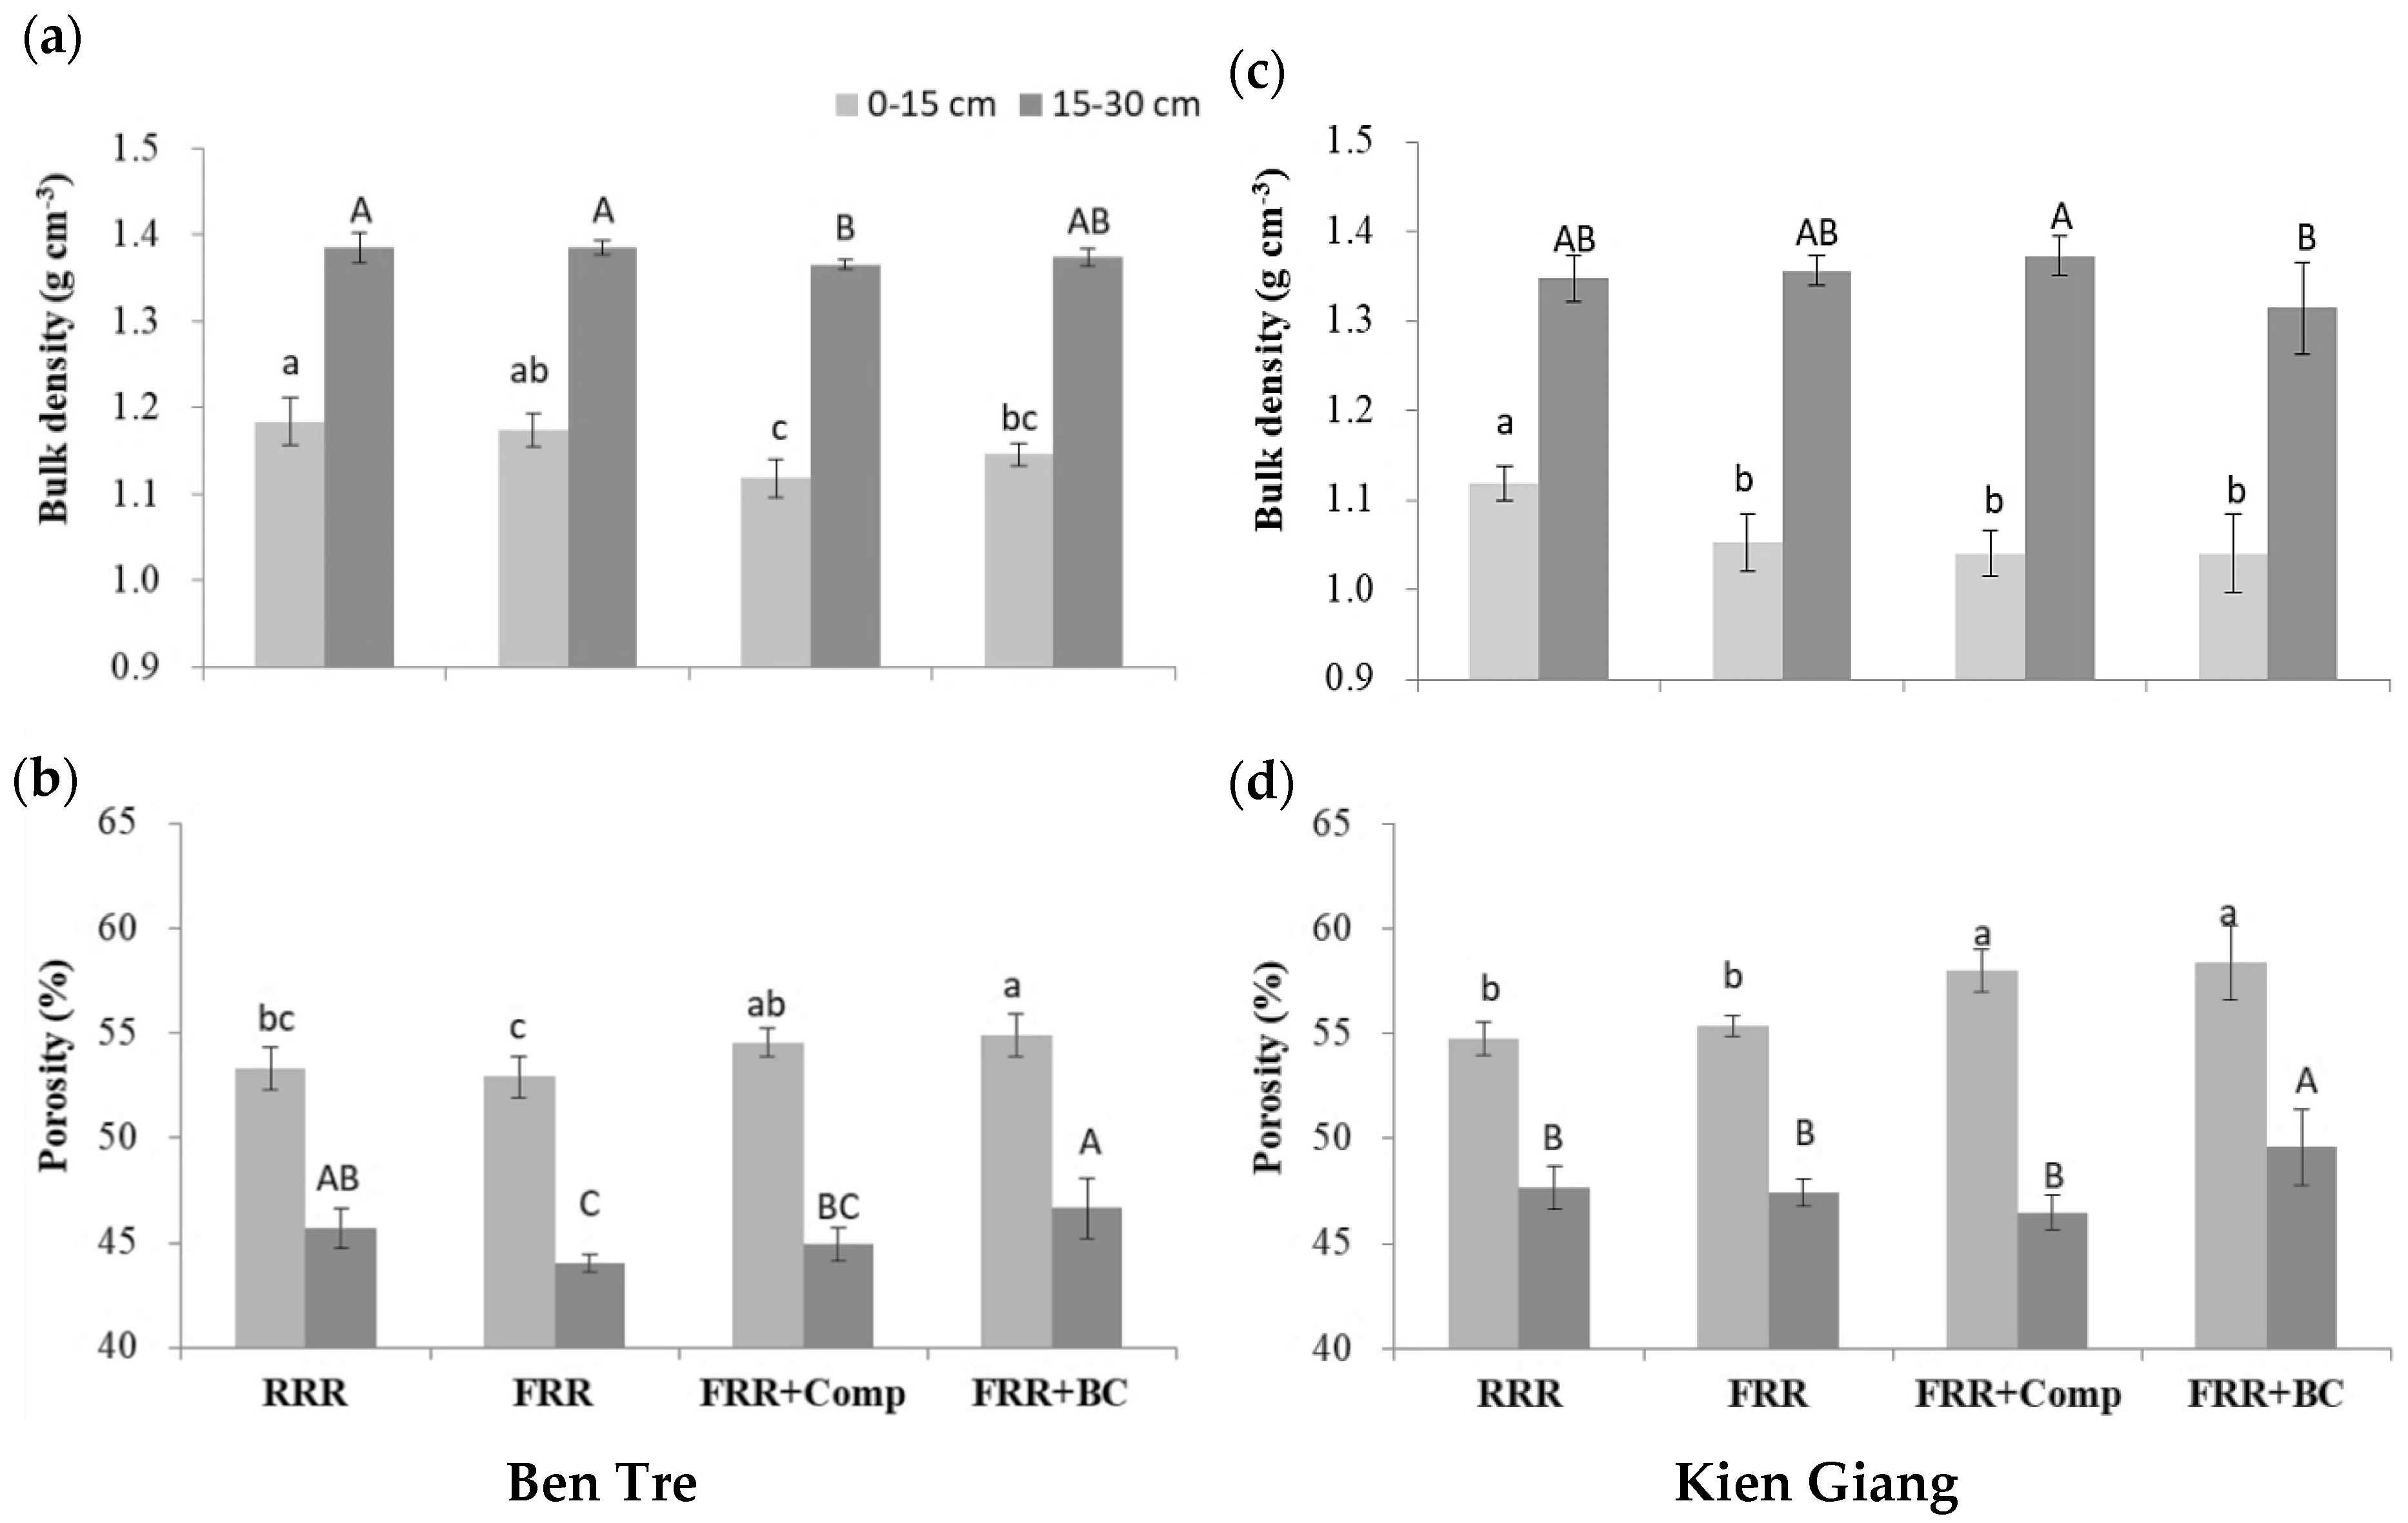
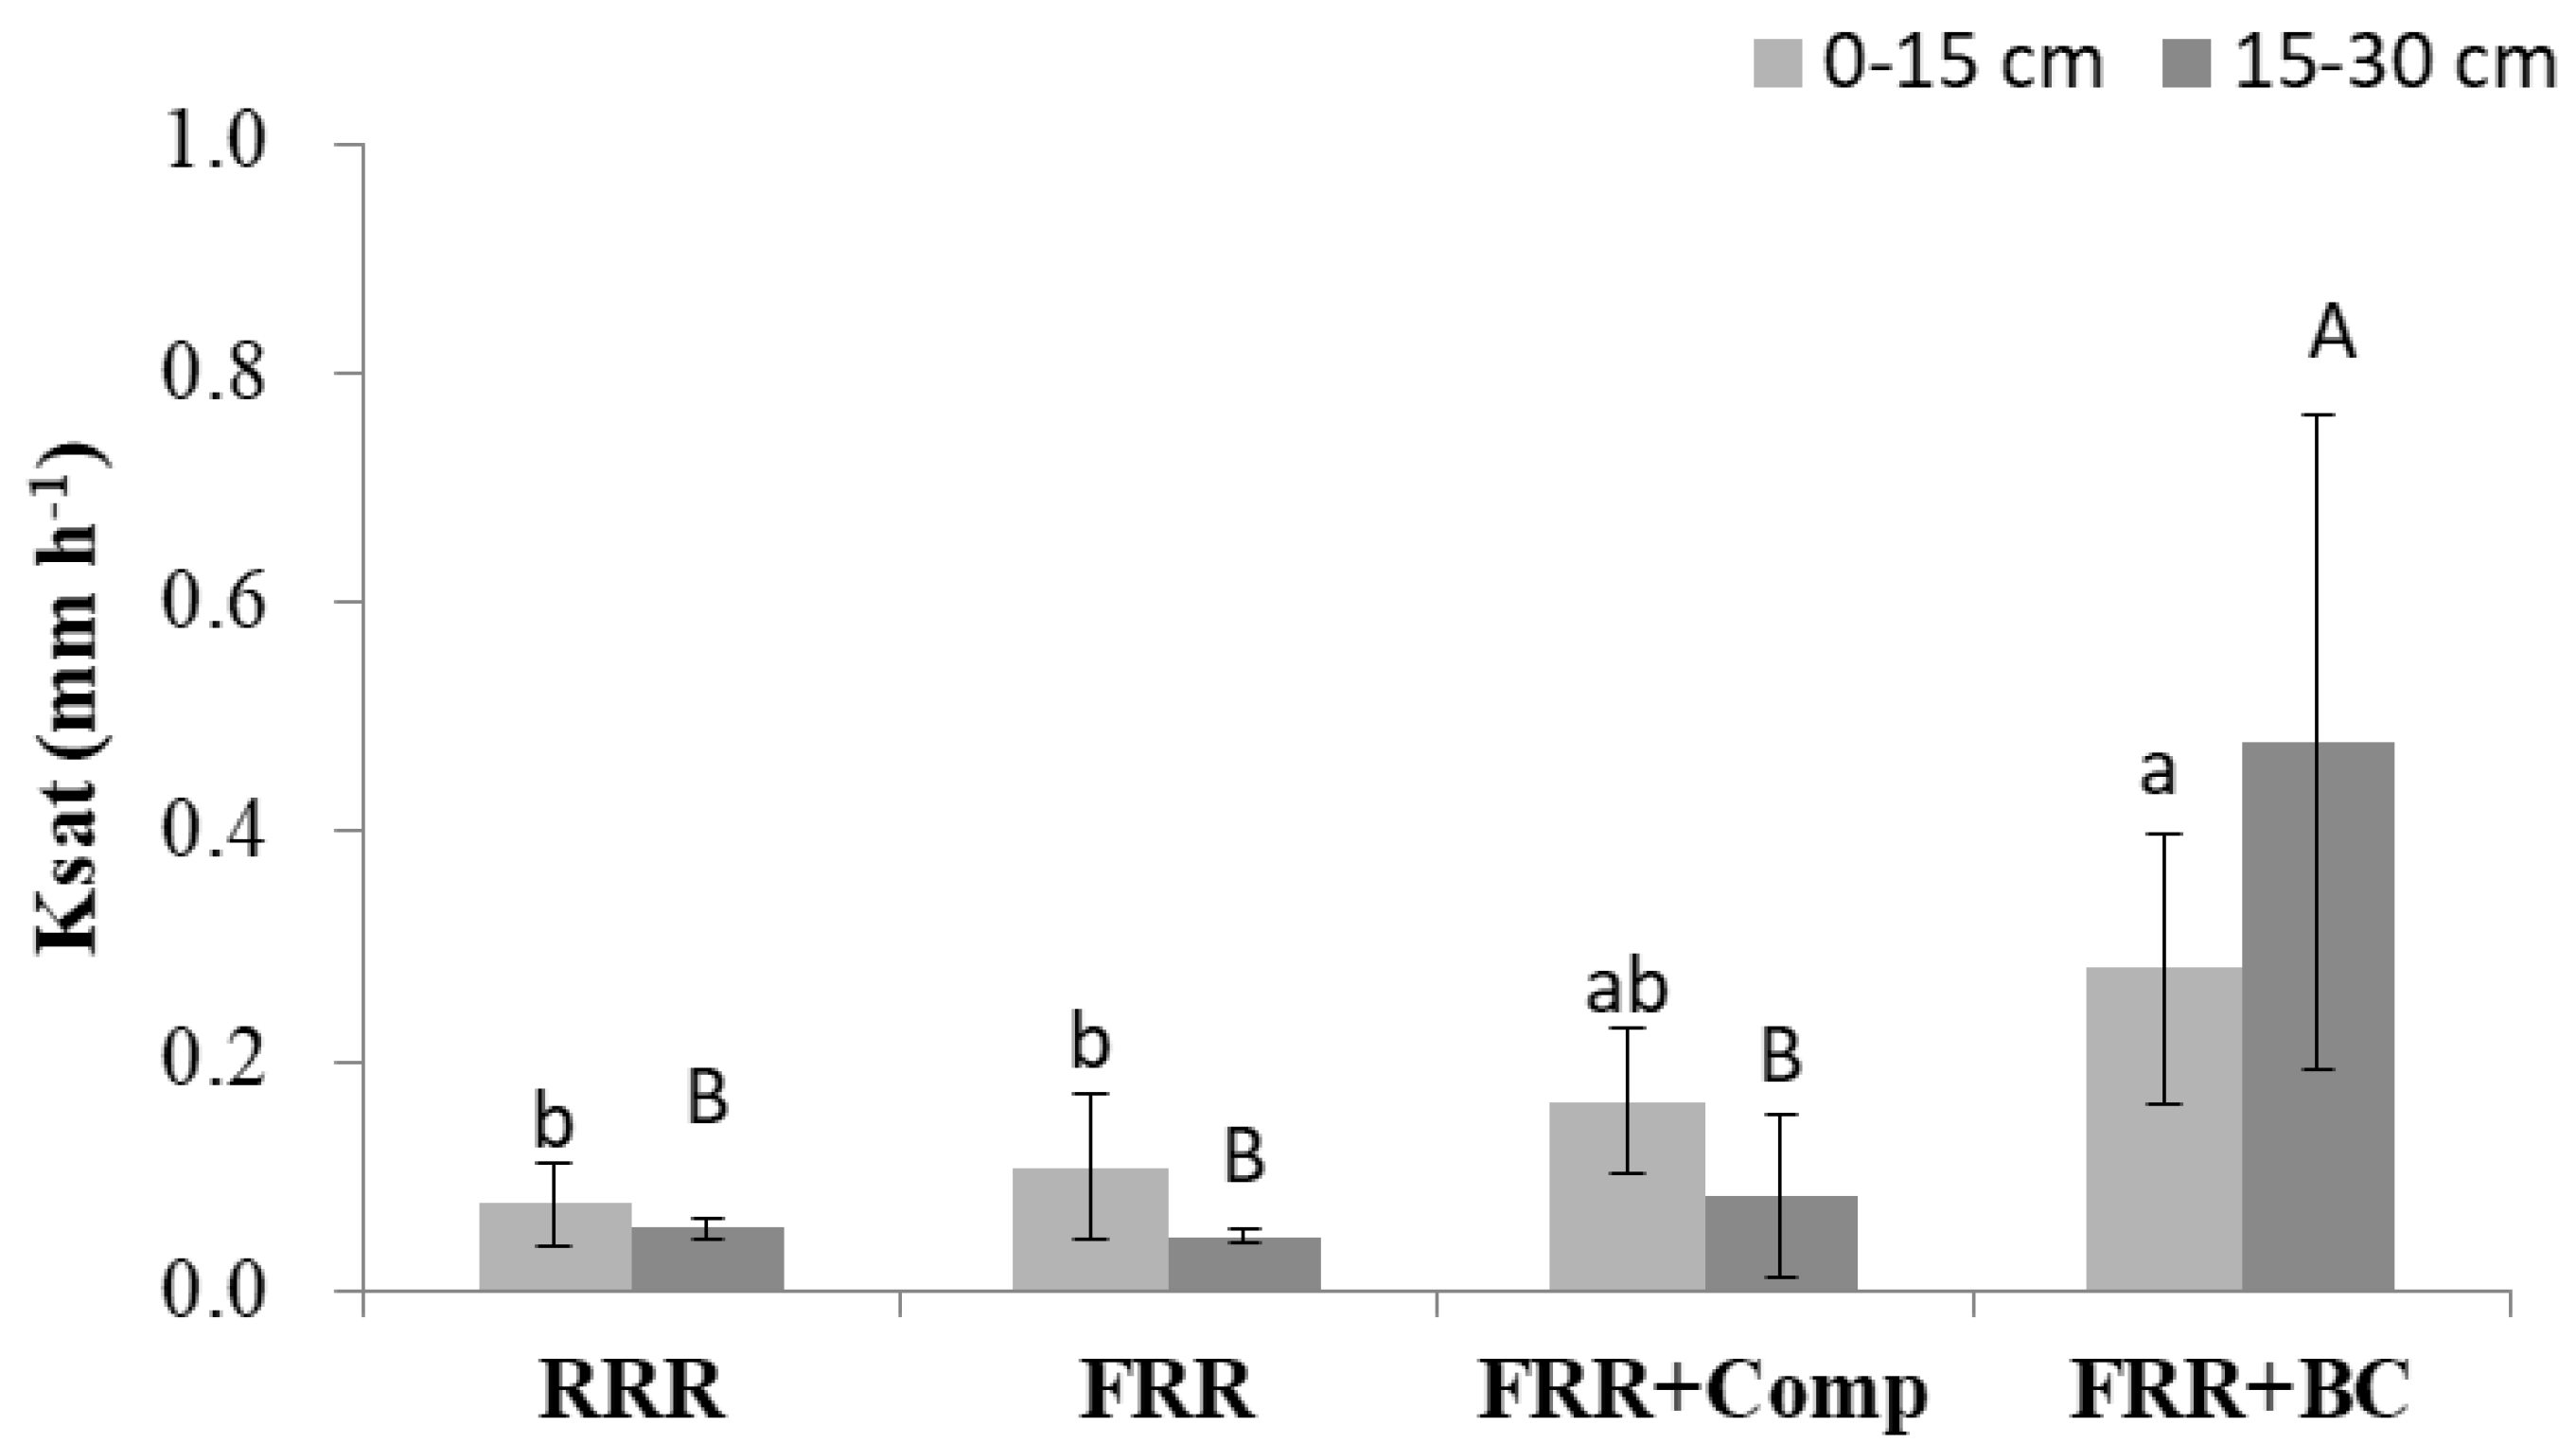
3.2. Physical Properties of Experimental Soil

At the BT experimental site, bulk density (BD) in the top soil layer (0–15 cm) was the lowest in FRR + Comp, followed by FRR + BC, and the highest in RRR (Figure 7a). BD was also the lowest in FRR + Comp in the sub-soil layer (15–30 cm), and was significantly different from RRR and FRR, but not from FRR + BC. At KG, the top soil layer presented the highest value of BD in RRR and there was no difference between other treatments. The sub-soil layer showed the lowest value of BD in FRR + BC.
At the top soil layer, total porosity was higher in FRR + Comp and FRR + BC, with the highest values of 54.9% and 58.4% in FRR + BC for BT and KG, respectively (Figure 7b,d). At the sub-soil layer, total porosity was also the highest in FRR + BC (46.6% and 49.6% for BT and KG, respectively). There was no difference in total porosity in both top soil and sub-soil between RRR and FRR.
Saturated hydraulic conductivity (Ksat) was significantly higher in FRR + BC, both in top soil and sub-soil layers, and there was no difference in Ksat among other treatments (Figure 8).

3.3. Rice Growth and Plant Uptake

The application of biochar and compost significantly increased aboveground biomass, but not grain yield of the rice crop (Table 3). FRR + BC significantly increased straw biomass by 1.35 and 0.82 Mg ha−1 compared with RRR at WS18–19 and SA19 crops, respectively. FRR + BC increased total aboveground biomass significantly compared with RRR at the SA19 crop. FRR + Comp increased total aboveground biomass by 1.5 Mg ha−1 compared with RRR (WS18–19), but there was no difference between FRR + Comp and FRR. For both WS18–19 and SA19 crops, total aboveground biomass was significantly the lowest in RRR (9.47 Mg and 8.57 Mg dry matter per ha, respectively), followed by FRR. In RRR treatment at SS18 and SS19 crops, there was no yield, due to severe salinity stress and drought.
Sodium content was significantly lower in straw of FRR + BC than in other treatments in both WS18–19 and SA19 crops (reductions of 111 mmol kg−1 and 136 mmol kg−1 compared with FRR, respectively) (Table 4). There was no significant difference in Na+ content in straw between RRR, FRR, and FRR + Comp. There was no significant difference in Na+ content in grain among treatments.
In the WS18–19 crop, K+ content in straw was the highest in FRR + BC (618 mmol kg−1 dry weight), while the lowest in FRR + Comp (381 mmol kg−1 dry weight) (Table 4). In the SA19 crop, K+ content in straw was also the highest in FRR + BC, while there no difference among other treatments. The K+ content in grain was not different among treatments.
Calcium content in straw and grain was not affected by treatment in both WS18–19 and SA19 crops.
In both WS18–19 and SA19 crops, K+/Na+ ratio was significantly the highest in FRR + BC, with an increase of 145% and 110% compared with FRR (WS18–19 and SA19, respectively). Other treatments showed no difference.
There was no significant difference in phosphorus content in straw and grain between treatments in both two crops, except for the lower value in FRR in rice straw in WS18–19.

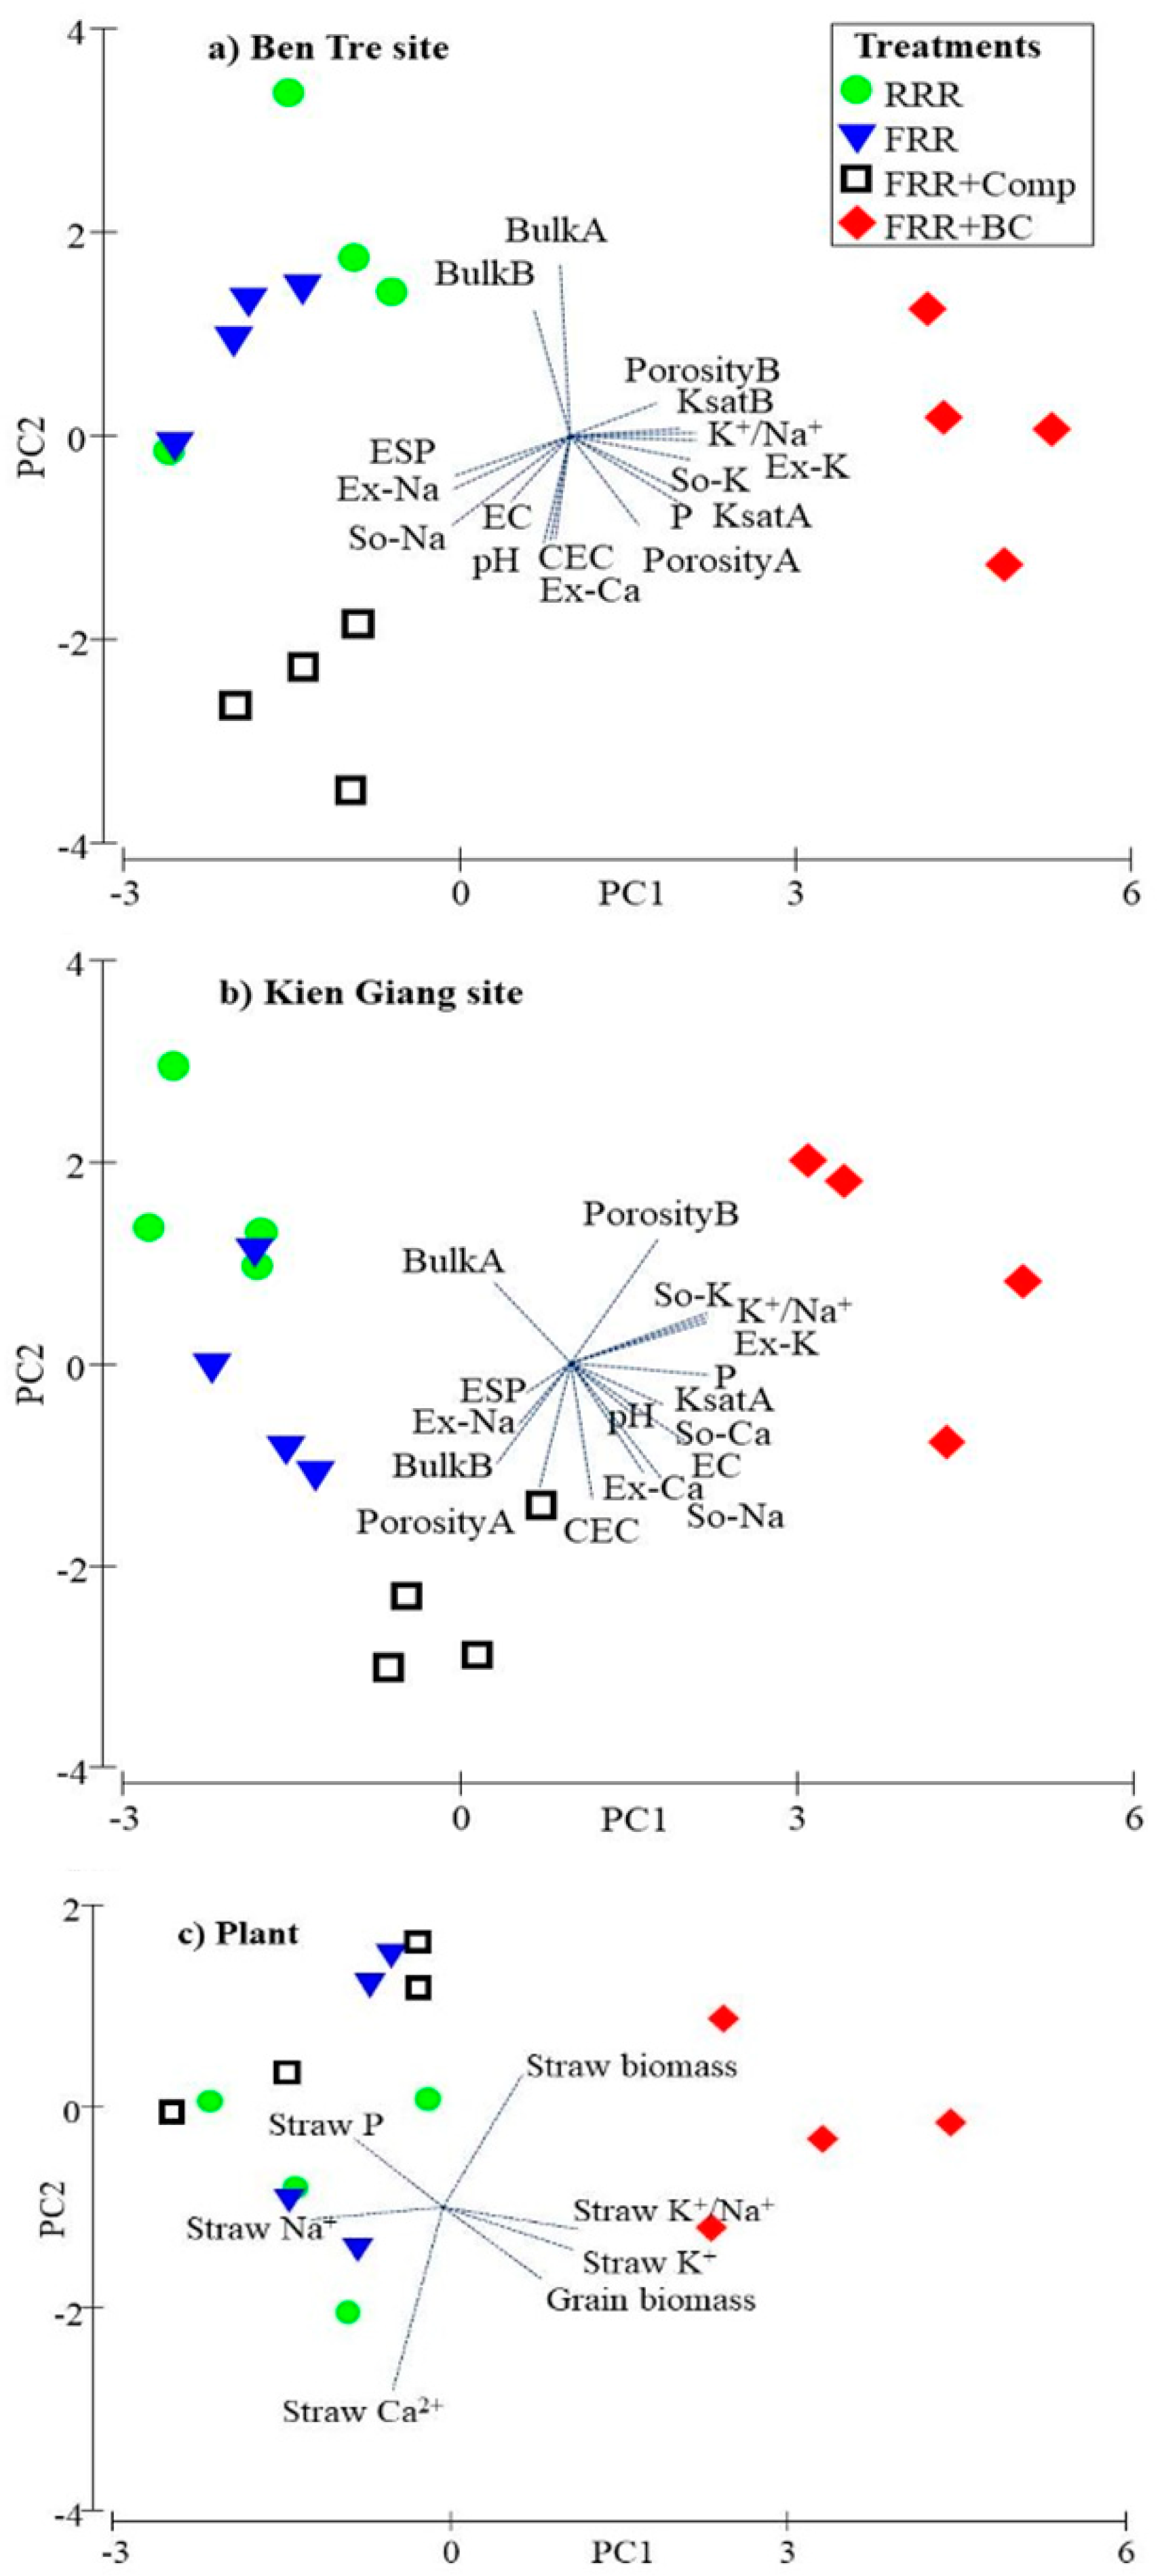
3.4. Relationship Between Plant Uptake and Examined Properties of the Soil

FRR + BC was associated with exchangeable K+, soluble K+, K+/Na+ ratio, available P, and Ksat in both experiment sites (Figure 9a,b). FRR + Comp was associated with exchangeable Ca2+ and CEC, while RRR and FRR were associated with high bulk density and ESP. In terms of plant nutrient contents at BT, K+ concentration and K+/Na+ ratio in straw were clearly influenced by FRR + BC (Figure 9c).

4. Discussion

4.1. Effects of Compost and Biochar on Soil Physicochemical Properties

Biochar had significant impacts on the reduction of exchangeable Na+. This reduction may be associated with the enhancement in total soil porosity and infiltration potential (Ksat) after biochar amendment (Figure 4, Figure 7 and Figure 8), resulting an improvement in salt leaching. This finding is consistent with previous studies, which illustrated that rice husk biochar [27] and maize-cob-derived biochar [48] increased hydraulic conductivity and then accelerated leaching of Na+ from soil. In addition, biochar had higher K+ concentration than the original soil (Table 1). Consequently, the addition of biochar mechanically added K+, resulting in higher soluble and exchangeable K+ (2–3 times) than those in other unamended soils (Figure 4). High concentrations of K+ from biochar could interact with and remove Na+ from salt-affected soils, as application of potassium fertilisers has been recommended to reduce Na+ stress in plants under sodic and saline conditions [49,50]. High amounts of K+ and high K+/Na+ ratio apparently improved conditions for plant growth in salt-affected soils. Although compost had high concentrations of K+ and Ca2+ which could be exchanged with Na+ and remove Na+ from soil, the application of compost did not decrease Na+ or improve the K+/Na+ ratio. This might be due to the low application rate of compost. Biochar provided 73 kg compared with 35 kg of available K2O from compost for each crop at the rate of 10 Mg ha−1 and 3 Mg ha−1, respectively. In addition, the compost had a high CEC value (66 cmolc kg−1), indicating a high retention rate of Na+, which likely resulted in less effect on the removal of Na+. Our previous study also found that biochar with a higher amount of K+ and lower Na+ absorption capacity performed better in removing Na+ from saline soil [27].
ESP is one of the most important indicators for salt-affected soils and needs to be reduced for plant growth. The optimal ESP value is variable depending on the type of soils and crops [8]. The initial ESP values of soil in both experimental sites were around 10%, which are considered to inhibit rice growth. This study showed that biochar amendment significantly decreased ESP in the soils by 1.3–2.6%. The acceleration of Na+ leaching from soil by applying biochar as discussed above may explain the reduction of ESP. On the other hand, the application of compost was expected to improve the K+/Na+ ratio and CEC and then to reduce the ESP. At BT (where the initial CEC of soil was low), the CEC was significantly increased by applying compost, but the increase in level was small (<0.5 cmolc kg−1), and at KG, the CEC did not increase. Na+ was also not reduced by compost application. Therefore, compost did not affect ESP and K+/Na+ ratio in the rice fields.
In this study, the application rate of biochar was three times higher than that of compost. While 10 Mg of biochar provided 73 kg K2O, 0.8 kg CaO, and 17 kg P2O5, 3 Mg of compost (moisture at 30%) provided 35 kg K2O, 40 kg CaO, and 17 kg P2O5. The better effects of biochar on removing Na+ could be explained by several reasons. First, as discussed above, biochar added two times higher K+ compared with compost, which facilitated an effective exchange of Na+ into the soil solution, and then dissolved into surrounding water. Second, compost had a higher CEC value, which is involved in Na+ retention/adsorption. The improvement in porosity and Ksat due to the coarse texture of biochar in comparison with compost could be another reason. Higher Ksat values in biochar treatment than in compost treatment support this hypothesis. The hydraulic conductivity is an important parameter that directly affects the reclamation process of salt-affected soils by drainage process [51]. In addition, compost will be more readily decomposed than biochar, and biochar will be stored in soil for a long time. After one crop (three months), most of the compost visually disappeared, while most of the biochar was still present in soil. The results of significant increase of total C in biochar treatment support this. By plowing, biochar could be incorporated into deeper layers in soil and promote more Na+ leaching processes. This was proved by higher porosity values even in the sub-soil layer (15–30 cm) of biochar application compared with those of compost application.
The impacts of biochar on the removal of Na+ in salt-affected soils could be governed by two mechanisms: leaching of Na+ into a deeper layer [25,27,29] and absorption of Na+, resulted in the prevention of uptake by plant [52,53]. Soluble Na+ in soils in this study ranged from 2 cmolc kg−1 to 4 cmolc kg−1. Assuming that the affected zone of biochar is 15 cm in depth, soil BD is 1.1 g cm−3, porosity is 55%, and soluble Na+ in soil is equally dissolved into soil solution and surface water (remained 10 cm above the soil surface) without extra addition of Na+ from irrigation water and precipitation: soluble Na+ of 2–4 cmolc kg−1 in soil in this study is equivalent to 450–900 mg Na+ L−1 in the soil solution. Our previous study [27] demonstrated that at this equilibrium concentration, the Na+ sorption capacity of rice husk biochar was from 3 mg Na+ g−1 to 4 mg Na+ g−1, which is equal to 13–17 cmolc kg−1 of biochar. Since the total application of biochar was estimated to be 2.4%, it causes the increase by 0.31–0.41 cmolc exchangeable Na+ kg−1 of soil applied with biochar. However, the results showed that exchangeable Na+ was lower in biochar treatment than that in unamended treatments. These results suggest that leaching of Na+ was more important than absorption of Na+ as a mechanism for removing Na+ by rice husk biochar.
The effectiveness of rice husk biochar on Na+ leaching was mainly from increasing porosity and Ksat of soil, high K+ content, and low CEC value (Na+ absorption capacity) of biochar. In a previous study, the authors showed that CEC and Na+ absorption capacity of rice husk biochar correlated with total surface area and total pore volume [54]. The K+ content, total surface, and pore volume of biochar likely depend on pyrolysis temperature and pyrolysis process, because a higher pyrolysis temperature produced biochar with higher K+ content, surface area, and pore volume [54,55,56,57]. Claoston, et al. [58] also observed that CEC of rice husk biochar decreased with decreasing pyrolysis temperature. Our previous study observed the difference in the surface area of two rice husk biochars produced at the same pyrolysis temperature (600 °C), but by different methods [27]. Therefore, to create a biochar suitable for salt removal, several parameters such as pyrolysis temperatures, pyrolysis length, and pyrolysis instruments should be considered.
The results of salt leaching were also affected by season, in particular, rainfall patterns. The EC values at both experimental sites were the highest at SS, which received the lowest rainfall (15% of total annual rainfall) and were the lowest at SA, which received 60% of total annual rainfall. Similarly, the higher soluble Na+ was observed in SS19 with the highest EC values. These results demonstrate that for salt leaching, water input is crucial and contributes greatly to the effectiveness.

4.2. Effects of Compost and Biochar Amendments on Plant Dry Biomass and Nutrient Concentrations

Biochar modifies soil physical and chemical properties [24,59]. As discussed above, the highlight effects of biochar were enhancing K+, available P, and K+/Na+ ratio and reducing ESP as well as decreasing exchangeable Na+ in soil. Various studies have illustrated that under salt stress conditions, plants increase Na+ uptake and reduce K+ uptake [60,61]. K+ and Na+ have close chemical and physical properties, indicating that Na+ competes with K+ at transport sites and at intracellular binding sites, resulting in K+ deficiency [62]. Therefore, under salinity stress conditions, the imbalance of ions, mainly Na+ accumulation and K+ deficiency, is an important toxicity factor [63,64,65]. Sharma [66] demonstrated that there was a linear decrease in plant K+ concentrations with increasing soil Na+ concentrations. Hence, by increasing K+ content in soil, plants can increase the uptake of K+, thus increasing their K+/Na+ ratio. The application of biochar can stimulate the displacement of Na+ from soil and then its discharge, resulting in lower concentration of Na+ in straw and reduced Na+ ion toxicity for better rice growth (Table 4). In addition, biochar also supplied mineral nutrients, such as a significant high level of soluble and exchangeable K+ in soil, which led to a high concentration of K+ and improved the K+/Na+ ratio in straw.
There was a positive effect of biochar application on dry straw biomass in salt-affected soils. Total aboveground biomass showed a trend of FRR + BC > FRR + Comp > FRR > RRR. After cultivation of five crops, the application of biochar increased straw biomass by 14.7% and total aboveground biomass by 12.5% compared with RRR. The role of biochar in improving soil quality and increasing crop yield were previously reported [67,68,69]. Prendergast-Miller et al. [70] and Ventura et al. [71] illustrated that wood chip biochar improved root biomass and root length intensity, and consequently enhanced plant biomass of spring barley crop in a sandy loam soil [70] and of an apple orchard in a silty clay loam soil [71]. Besides the changes in soil parameters related to cations, biochar also increased available P and soil porosity, which are important parameters to support plant growth. The available P inputs were equal to 17 kg P2O5 from 10 Mg biochar and 3 Mg compost. However, the available P was higher in biochar treatments compared with compost treatments. Our previous study showed that biochar increased soil available P by breaking down the complexion of Fe-P and Al-P or preventing the formation of Fe-P and Al-P compounds [39].
As discussed above, less beneficial impacts of compost were observed in comparison with biochar in terms of improving rice biomass and this could be caused by lower dosage and fine texture of compost, resulting in lower removing Na+ ability. Soils in this study contained high percentages of clay particles (42% and 57% at BT and KG, respectively). Therefore, the application of compost was expected to increase biopore spaces [15,16], reduce bulk density [17], and enhance soil porosity [18]. As a consequence, leaching of salts was expected to be improved. However, except for increasing pH, available P, CEC, and porosity, other parameters were not improved in compost treatment. A higher dosage of compost could be necessary to improve the salinity level used in this study.

5. Conclusions

Our findings demonstrate that biochar amendment provided K+ and improved physical status, which resulted in reducing Na+ in salt-affected soils and maintaining a lower ESP level and higher K+/Na+ ratio throughout the experiment. As a consequence, total aboveground biomass was significantly improved by biochar amendment. Compost had less beneficial impacts than biochar in removing Na+ and improving rice biomass. Further studies are now continued to monitor the residue effects of biochar on the removal of Na+ and on other parameters after stopping application of biochar.

Author Contributions

N.T.K.P. conceptualized the study; T.B.L., D.D.M., T.A.D., and T.T.L. conducted the experiments and collected samples; N.T.K.P. and N.V.S. performed sample analysis and data analysis; N.T.K.P. and K.T. validated data; N.T.K.P. wrote the paper—original draft; N.T.K.P., K.R., C.M.K., T.B.L., and K.T. reviewed, edited, and finalized the paper. All authors have read and agreed to the published version of the manuscript.

Funding

This study was funded in part by the Can Tho University Improvement Project VN14-P6, supported by a Japanese ODA loan.

Acknowledgments

We thank the A8 project team members at the Department of Soil Science, Can Tho University, for support during the field experiment.

Conflicts of Interest

The authors declare no conflict of interest.

References

  1. Gupta, S.K.; Goyal, M.R.; Singh, A. Engineering Practices for Management of Soil Salinity: Agricultural, Physiological, and Adaptive Approaches; CRC Press: Boca Raton, FL, USA, 2018. [Google Scholar]
  2. Doula, M.K.; Sarris, A. Chapter 4-Soil environment. In Environment and Development; Poulopoulos, S.G., Inglezakis, V.J., Eds.; Elsevier: Amsterdam, The Netherland, 2016; pp. 213–286. [Google Scholar]
  3. Abrol, I.; Yadav, J.S.P.; Massoud, F. Salt-Affected Soils and Their Management; Food & Agriculture Org.: Rome, Italy, 1988. [Google Scholar]
  4. Qadir, M.; Quillérou, E.; Nangia, V.; Murtaza, G.; Singh, M.; Thomas, R.J.; Drechsel, P.; Noble, A.D. Economics of salt-induced land degradation and restoration. Nat. Resour. Forum. 2014, 38, 282–295. [Google Scholar] [CrossRef]
  5. Shahid, S.A.; Zaman, M.; Heng, L. Soil salinity: Historical perspectives and a world overview of the problem. In Guideline for Salinity Assessment, Mitigation and Adaptation Using Nuclear and Related Techniques; Springer International Publishing: Cham, Switzerland, 2018; pp. 43–53. [Google Scholar]
  6. IPCC. Mitigation of Climate Change; IPCC: Geneva, Switzerland, 2014; p. 151. [Google Scholar]
  7. Raine, S.R.; Loch, R.J. What Is a Sodic Soil? Identification and Management Options for Construction Sites and Disturbed Lands; Workshop on soils in rural Queensland: Queensland, Australia, 2003. [Google Scholar]
  8. Sys, C.; Van Ranst, E.; Debaveye, J.; Beernaert, F. Land Evaluation Part III, Crop Requirements; G.A.D.C: Brussels, Belgium, 1993; p. 191. [Google Scholar]
  9. Khai, H.V.; Dang, N.H.; Yabe, M. Impact of salinity intrusion on rice productivity in the Vietnamese Mekong Delta. J. Fac. Agric. Kyushu Univ. 2018, 63, 143–148. [Google Scholar]
  10. Eynard, A.; Lal, R.; Wiebe, K. Crop response in salt-affected soils. J. Sustain. Agric. 2005, 27, 5–50. [Google Scholar] [CrossRef]
  11. Asch, F.; Wopereis, M.C.S. Responses of field-grown irrigated rice cultivars to varying levels of floodwater salinity in a semi-arid environment. Field Crops Res. 2001, 70, 127–137. [Google Scholar] [CrossRef]
  12. Chi, C.; Zhao, C.; Sun, X.; Wang, Z. Reclamation of saline-sodic soil properties and improvement of rice (Oriza sativa L.) growth and yield using desulfurized gypsum in the west of Songnen Plain, northeast China. Geoderma 2012, 187, 24–30. [Google Scholar] [CrossRef]
  13. Chaganti, V.N.; Crohn, D.M. Evaluating the relative contribution of physiochemical and biological factors in ameliorating a saline–sodic soil amended with composts and biochar and leached with reclaimed water. Geoderma 2015, 259, 45–55. [Google Scholar] [CrossRef]
  14. Qadir, M.; Oster, J.D. Crop and irrigation management strategies for saline-sodic soils and waters aimed at environmentally sustainable agriculture. Sci. Total Environ. 2004, 323, 1–19. [Google Scholar] [CrossRef]
  15. McConnell, D.B.; Shiralipour, A.; Smith, W.H. Compost application improves soil properties. Biocycle 1993, 34, 61–63. [Google Scholar]
  16. Rasool, R.; Kukal, S.S.; Hira, G.S. Soil physical fertility and crop performance as affected by long term application of FYM and inorganic fertilizers in rice–wheat system. Soil Till. Res. 2007, 96, 64–72. [Google Scholar] [CrossRef]
  17. Khaleel, R.; Reddy, K.R.; Overcash, M.R. Changes in soil physical properties due to organic waste applications: A review. J. Environ. Qual. 1981, 10, 133–141. [Google Scholar] [CrossRef]
  18. Tejada, M.; Gonzalez, J.L.; García-Martínez, A.M.; Parrado, J. Effects of different green manures on soil biological properties and maize yield. Bioresour. Technol. 2008, 99, 1758–1767. [Google Scholar] [CrossRef] [PubMed]
  19. Bui, E.; Krogh, L.; Lavado, R.; Nachtergaele, F.; Toth, P.; Fitzpatrick, R. Sodic soils. Distribution, properties, management and environmental consequences. In Sodic Soils, The World Scene; Oxford University Press: New York, NY, USA, 1998; pp. 19–34. [Google Scholar]
  20. Dabin, Z.; Zhiyuan, Y.; Jiao, C.; Pengwei, Y.; Na, Z.; Wenxiang, H.; Yangyang, L.; Suiqi, Z.; Bingnian, Z.; Zhaohui, W.; et al. Improving soil aggregation, aggregate-associated C and N, and enzyme activities by green manure crops in the Loess Plateau of China. Eur. J. Soil Sci. 2019, 70, 1267–1279. [Google Scholar] [CrossRef]
  21. Liang, Y.; Si, J.; Nikolic, M.; Peng, Y.; Chen, W.; Jiang, Y. Organic manure stimulates biological activity and barley growth in soil subject to secondary salinization. Soil Biol. Biochem. 2005, 37, 1185–1195. [Google Scholar] [CrossRef]
  22. Tejada, M.; Garcia, C.; Gonzalez, J.L.; Hernandez, M.T. Use of organic amendment as a strategy for saline soil remediation: Influence on the physical, chemical and biological properties of soil. Soil Biol. Biochem. 2006, 38, 1413–1421. [Google Scholar] [CrossRef]
  23. Tripathi, S.; Kumari, S.; Chakraborty, A.; Gupta, A.; Chakrabarti, K.; Bandyapadhyay, B.K. Microbial biomass and its activities in salt-affected coastal soils. Biol. Fertility Soils 2006, 42, 273–277. [Google Scholar] [CrossRef]
  24. Lehmann, J.; Joseph, S. Biochar for Environmental Management: Science and Technology; Earthscan Ltd: London, UK, 2009; p. 404. [Google Scholar]
  25. Chaganti, V.N.; Crohn, D.M.; Šimůnek, J. Leaching and reclamation of a biochar and compost amended saline–sodic soil with moderate SAR reclaimed water. Agric. Water Manag. 2015, 158, 255–265. [Google Scholar] [CrossRef] [Green Version]
  26. Laird, D.A.; Fleming, P.; Davis, D.D.; Horton, R.; Wang, B.; Karlen, D.L. Impact of biochar amendments on the quality of a typical midwestern agricultural soil. Geoderma 2010, 158, 443–449. [Google Scholar] [CrossRef] [Green Version]
  27. Phuong, N.T.K.; Khoi, C.M.; Van Sinh, N.; Chiem, N.H.; Toyota, K. Effects of rice husk biochar and calcium amendment on remediation of saline soil from rice-shrimp cropping system in vietnamese mekong delta. JEAI 2019, 39, 1–12. [Google Scholar] [CrossRef]
  28. Barnes, R.T.; Gallagher, M.E.; Masiello, C.A.; Liu, Z.; Dugan, B. Biochar-induced changes in soil hydraulic conductivity and dissolved nutrient fluxes constrained by laboratory experiments. PLoS ONE 2014, 9, e108340. [Google Scholar] [CrossRef] [Green Version]
  29. Yue, Y.; Guo, W.N.; Lin, Q.M.; Li, G.T.; Zhao, X.R. Improving salt leaching in a simulated saline soil column by three biochars derived from rice straw (Oryza sativa L.), sunflower straw (Helianthus annuus), and cow manure. J. Soil Water Conserv. 2016, 71, 467–475. [Google Scholar] [CrossRef]
  30. Wu, Y.; Xu, G.; Shao, H.B. Furfural and its biochar improve the general properties of a saline soil. Solid Earth 2014, 5, 665–671. [Google Scholar] [CrossRef] [Green Version]
  31. Chan, K.Y.; Van Zwieten, L.; Meszaros, I.; Downie, A.; Joseph, S. Agronomic values of greenwaste biochar as a soil amendment. Soil Res. 2007, 45, 629–634. [Google Scholar] [CrossRef]
  32. Sappor, D.; Osei, B.; Ahmed, M. Reclaiming sodium affected soil: The potential of organic amendments. Inter. J. Plant Soil Sci. 2017, 16, 1–11. [Google Scholar] [CrossRef] [Green Version]
  33. Nguyen, B.T.; Trinh, N.N.; Le, C.M.T.; Nguyen, T.T.; Tran, T.V.; Thai, B.V.; Le, T.V. The interactive effects of biochar and cow manure on rice growth and selected properties of salt-affected soil. Arch. Agron. Soil Sci. 2018, 64, 1744–1758. [Google Scholar] [CrossRef]
  34. Drake, J.A.; Cavagnaro, T.R.; Cunningham, S.C.; Jackson, W.R.; Patti, A.F. Does biochar improve establishment of tree seedlings in saline sodic soils? Land Degrad. Dev. 2016, 27, 52–59. [Google Scholar] [CrossRef]
  35. Kim, H.-S.; Kim, K.-R.; Yang, J.E.; Ok, Y.S.; Owens, G.; Nehls, T.; Wessolek, G.; Kim, K.-H. Effect of biochar on reclaimed tidal land soil properties and maize (Zea mays L.) response. Chemosphere 2016, 142, 153–159. [Google Scholar] [CrossRef]
  36. Dahlawi, S.; Naeem, A.; Rengel, Z.; Naidu, R. Biochar application for the remediation of salt-affected soils: Challenges and opportunities. Sci. Total Environ. 2018, 625, 320–335. [Google Scholar] [CrossRef]
  37. Thanh, N.K.; Tripathi, N.K.; Duan, H.D.; Gallardo, W.G. GIS–Based Planning for Sustainable Shrimp Farming in Thanh Phu, Ben Tre Province, Viet Nam; International Symposium on Geoinformatics for Spatial Infrastructure Development in Earth and Allied Sciences: Hanoi, Vietnam, 2008. [Google Scholar]
  38. Van Cuong, C.; Russell, M.; Brown, S.; Dart, P. Using shoreline video assessment for coastal planning and restoration in the context of climate change in Kien Giang, Vietnam. Ocean Sci. J 2015, 50, 413–432. [Google Scholar] [CrossRef]
  39. Phuong, N.T.K.; Khoi, C.M.; Ritz, K.; Sinh, N.V.; Tarao, M.; Toyota, K. Potential use of rice husk biochar and compost to improve P availability and reduce GHG emissions in acid sulfate soil. Agronomy 2020, 10, 685. [Google Scholar] [CrossRef]
  40. Dirksen, C. Soil Physics Measurements; Catena Verlag: Reiskirchen, Germany, 1999. [Google Scholar]
  41. Houba, V.J.G.; Vanderlee, J.J.; Novozamsky, I. Soil and plant analysis: A series of syllabi. In Part 5B Soil Analysis Procedures Other Procedures, 6th ed.; Department of Soil Science and Plant Nutrition, Wageningen Agricultural University: Wageningen, The Netherlands, 1995. [Google Scholar]
  42. Schaffers, A.P.; Sýkora, K.V. Reliability of ellenberg indicator values for moisture, nitrogen and soil reaction: A comparison with field measurements. J. Veg. Sci. 2000, 11, 225–244. [Google Scholar] [CrossRef]
  43. Bray, R.H.; Kurtz, L.T. Determination of total, organic, and available forms of phosphorus in soils. Soil Sci. 1945, 59, 39–46. [Google Scholar] [CrossRef]
  44. Gee, G.W.; Bauder, J.W. Particle-size analysis. In Methods of Soil Analysis: Part 1 Physical and Mineralogical Methods; American Society of Agronomy, Agronomy Monographs: Madison, WI, USA, 1986; Volume 5, pp. 383–411. [Google Scholar]
  45. Grossman, R.; Reinsch, T. Bulk density and linear extensibility. In Methods of Soil Analysis. Part 4; Dane, J.H., Topp, G.C., Eds.; SSSA Book Series No. 5; Soil Science Society of America: Madison, WI, USA, 2002. [Google Scholar]
  46. Blake, G.; Hartge, K. Particle density. In Methods of Soil Analysis: Part 1—Physical and Mineralogical Methods; American Society of Agronomy-Soil Science Society of America: Madison, WI, USA, 1986. [Google Scholar]
  47. ASTM. Standard test method for determination of iodine number of activated carbon. In ASTM Annual Book; ASTM International: West Conshohocken, PA, USA, 1999; Volume 4. [Google Scholar]
  48. Zhou, H.; Fang, H.; Zhang, Q.; Wang, Q.; Chen, C.; Mooney, S.J.; Peng, X.; Du, Z. Biochar enhances soil hydraulic function but not soil aggregation in a sandy loam. Eur. J. Soil Sci. 2019, 70, 291–300. [Google Scholar] [CrossRef]
  49. Hossain, M.; Rabbi, S.; Khanom, S.; Amin, M.; Islam, M.; Rahman, A. Effect of salinity and potassium fertilizer application on yield contributing characteristics of rice. Khulna Univ. Stud. 2010, 10, 145–152. [Google Scholar]
  50. Wakeel, A. Potassium–sodium interactions in soil and plant under saline-sodic conditions. J. Plant Nutr. Soil Sci. 2013, 176, 344–354. [Google Scholar] [CrossRef]
  51. Hanay, A.; Büyüksönmez, F.; Kiziloglu, F.M.; Canbolat, M.Y. Reclamation of saline-sodic soils with gypsum and msw compost. Compost Sci. Util. 2004, 12, 175–179. [Google Scholar] [CrossRef]
  52. Akhtar, S.S.; Andersen, M.N.; Liu, F. Biochar mitigates salinity stress in potato. J Agron. Crop Sci. 2015, 201, 368–378. [Google Scholar] [CrossRef]
  53. Thomas, S.C.; Frye, S.; Gale, N.; Garmon, M.; Launchbury, R.; Machado, N.; Melamed, S.; Murray, J.; Petroff, A.; Winsborough, C. Biochar mitigates negative effects of salt additions on two herbaceous plant species. J. Environ. Manag. 2013, 129, 62–68. [Google Scholar] [CrossRef]
  54. Rostamian, R.; Heidarpour, M.; Mousavi, S.; Afyuni, M. Characterization and sodium sorption capacity of biochar and activated carbon prepared from rice husk. J. Agric. Sci. Tech. 2015, 17, 1057–1069. [Google Scholar]
  55. Angın, D.; Şensöz, S. Effect of pyrolysis temperature on chemical and surface properties of biochar of rapeseed (Brassica napus L.). Int. J. Phytorem. 2014, 16, 684–693. [Google Scholar] [CrossRef]
  56. Zheng, H.; Wang, Z.; Deng, X.; Zhao, J.; Luo, Y.; Novak, J.; Herbert, S.; Xing, B. Characteristics and nutrient values of biochars produced from giant reed at different temperatures. Bioresour. Technol. 2013, 130, 463–471. [Google Scholar] [CrossRef]
  57. Phuong, D.T.M.; Miyanishi, T.; Okayama, T.; Kose, R. Pore characteristics & adsorption capacities of biochars derived from rice residues as affected by variety and pyrolysis temperature. Am. J. Innov. Res. Appl. Sci. 2016, 2, 336–346. [Google Scholar]
  58. Claoston, N.; Samsuri, A.; Ahmad Husni, M.; Mohd Amran, M. Effects of pyrolysis temperature on the physicochemical properties of empty fruit bunch and rice husk biochars. Waste Manag. Res. 2014, 32, 331–339. [Google Scholar] [CrossRef]
  59. Oladele, S.O. Changes in physicochemical properties and quality index of an alfisol after three years of rice husk biochar amendment in rainfed rice–maize cropping sequence. Geoderma 2019, 353, 359–371. [Google Scholar] [CrossRef]
  60. Zhu, J.-K. Regulation of ion homeostasis under salt stress. Curr. Opin. Plant Biol. 2003, 6, 441–445. [Google Scholar] [CrossRef]
  61. Horie, T.; Yoshida, K.; Nakayama, H.; Yamada, K.; Oiki, S.; Shinmyo, A. Two types of hkt transporters with different properties of Na+ and K+ transport in Oryza sativa. Plant J. 2001, 27, 129–138. [Google Scholar] [CrossRef]
  62. Maathuis, F.J.; Amtmann, A. K+ nutrition and Na+ toxicity: The basis of cellular K+/Na+ ratios. Ann. Bot. 1999, 84, 123–133. [Google Scholar] [CrossRef] [Green Version]
  63. Deinlein, U.; Stephan, A.B.; Horie, T.; Luo, W.; Xu, G.; Schroeder, J.I. Plant salt-tolerance mechanisms. Trends Plant Sci. 2014, 19, 371–379. [Google Scholar] [CrossRef] [Green Version]
  64. Tanaka, H.; Yamada, S.; Masunaga, T.; Yamamoto, S.; Tsuji, W.; Murillo-Amador, B. Comparison of nutrient uptake and antioxidative response among four labiatae herb species under salt stress condition. Soil Sci. Plant Nutr. 2018, 64, 589–597. [Google Scholar] [CrossRef]
  65. Igartua, E.; Gracia, M.P.; Lasa, J.M. Field responses of grain sorghum to a salinity gradient. Field Crops Res. 1995, 42, 15–25. [Google Scholar] [CrossRef] [Green Version]
  66. Sharma, S.K. Effects of salinity on uptake and distribution of Na+, Cl- and K+ in two wheat cultivars. Biol. Plant. 1996, 38, 261. [Google Scholar] [CrossRef]
  67. Lehmann, J.; Rillig, M.C.; Thies, J.; Masiello, C.A.; Hockaday, W.C.; Crowley, D. Biochar effects on soil biota–a review. Soil Biol. Biochem. 2011, 43, 1812–1836. [Google Scholar] [CrossRef]
  68. Chen, J.; Liu, X.; Li, L.; Zheng, J.; Qu, J.; Zheng, J.; Zhang, X.; Pan, G. Consistent increase in abundance and diversity but variable change in community composition of bacteria in topsoil of rice paddy under short term biochar treatment across three sites from South China. Appl. Soil Ecol. 2015, 91, 68–79. [Google Scholar] [CrossRef]
  69. Yan, Q.; Dong, F.; Li, J.; Duan, Z.; Yang, F.; Li, X.; Lu, J.; Li, F. Effects of maize straw-derived biochar application on soil temperature, water conditions and growth of winter wheat. Eur. J. Soil Sci. 2019, 70, 1280–1289. [Google Scholar] [CrossRef]
  70. Prendergast-Miller, M.T.; Duvall, M.; Sohi, S.P. Biochar–root interactions are mediated by biochar nutrient content and impacts on soil nutrient availability. Eur. J. Soil Sci. 2014, 65, 173–185. [Google Scholar] [CrossRef]
  71. Ventura, M.; Zhang, C.; Baldi, E.; Fornasier, F.; Sorrenti, G.; Panzacchi, P.; Tonon, G. Effect of biochar addition on soil respiration partitioning and root dynamics in an apple orchard. Eur. J. Soil Sci. 2014, 65, 186–195. [Google Scholar] [CrossRef]
Figure 1. Map of study areas, adapted from Google Earth.
Agronomy 10 01101 g001
Figure 2. Cropping pattern and seasonal variations of temperature (line) and precipitation (bar) in the Ben Tre province (a) and Kien Giang province (b). SS, spring–summer; SA, summer–autumn; WS, winter–spring.
Agronomy 10 01101 g002
Figure 3. Mean soil pH and EC at Ben Tre (a,c) and Kien Giang (b,d) sites as influenced by treatment and season with data pooled over five crops. Columns with different letters indicate a significant difference (p < 0.05) among treatments (lowercase letters) and seasons (uppercase letters). * p < 0.05; ** p < 0.01; *** p < 0.001; ns, not significant. SS, spring–summer; SA, summer–autumn; WS, winter–spring; RRR, Rice–Rice–Rice; FRR, Fallow–Rice–Rice; FRR + Comp, Fallow–Rice–Rice + 3 Mg ha−1 of compost; FRR + BC, Fallow–Rice–Rice + 10 Mg ha−1 of biochar.
Agronomy 10 01101 g003
Figure 4. Changes in soluble and exchangeable cations in soil as affected by treatment and season at Ben Tre (a,b,c) and Kien Giang (d,e,f). Different letters indicate a significant difference (p < 0.05) among treatments; ns, not significant. Error bars indicate the standard deviation of four replicates (n = 4) for each treatment. SS, spring–summer; SA, summer–autumn; WS, winter–spring; RRR, Rice–Rice–Rice; FRR, Fallow–Rice–Rice; FRR + Comp, Fallow–Rice–Rice + 3 Mg ha−1 of compost; FRR + BC, Fallow–Rice–Rice + 10 Mg ha−1 of biochar.
Agronomy 10 01101 g004
Figure 5. Changes in K+/Na+ ratio, exchangeable sodium percentage (ESP), and available P in soil as affected by treatment at Ben Tre (a,b,c) and Kien Giang (d,e,f). Statistical tests were done using log transformed data for available P. Different letters indicate a significant difference (p < 0.05) among treatments; ns, not significant. Error bars indicate the standard deviation of four replicates (n = 4) for each treatment. SS, spring–summer; SA, summer–autumn; WS, winter–spring; RRR, Rice–Rice–Rice; FRR, Fallow–Rice–Rice; FRR + Comp, Fallow–Rice–Rice + 3 Mg ha−1 of compost; FRR + BC, Fallow–Rice–Rice + 10 Mg ha−1 of biochar.
Agronomy 10 01101 g005
Figure 6. Total C (a) and N (b) in soil as affected by treatment, with data from the summer–autumn (SA19) crop. Different letters indicate a significant difference (p < 0.05) among treatments; ns, not significant. Error bars indicate the standard deviation of four replicates (n = 4) for each treatment. RRR, Rice–Rice–Rice; FRR, Fallow–Rice–Rice; FRR + Comp, Fallow–Rice–Rice + 3 Mg ha−1 of compost; FRR + BC, Fallow–Rice–Rice + 10 Mg ha−1 of biochar.
Agronomy 10 01101 g006
Figure 7. Change in soil bulk density and porosity in 0–15 cm and 15–30 cm depths as affected by treatment at Ben Tre (a,b) and Kien Giang (c,d), with data for the summer–autumn (SA19) crop. Different letters indicate a significant difference (p < 0.05) among treatments (lowercase letters for 0–15 cm; uppercase letters for 15–30 cm). Error bars indicate the standard deviation of four replicates (n = 4) for each treatment. RRR, Rice–Rice–Rice; FRR, Fallow–Rice–Rice; FRR + Comp, Fallow–Rice–Rice + 3 Mg ha−1 of compost; FRR + BC, Fallow–Rice–Rice + 10 Mg ha−1 of biochar.
Agronomy 10 01101 g007
Figure 8. Change in soil saturated hydraulic conductivity (Ksat) in 0–15 cm and 15–30 cm depths as affected by treatment, with data for the summer–autumn (SA19) crop at the Ben Tre site. Different letters indicate a significant difference (p < 0.05) among treatments (lowercase letters for 0–15 cm; uppercase letters for 15–30 cm). Error bars indicate the standard deviation of four replicates (n = 4) for each treatment. RRR, Rice–Rice–Rice; FRR, Fallow–Rice–Rice; FRR + Comp, Fallow–Rice–Rice + 3 Mg ha−1 of compost; FRR + BC, Fallow–Rice–Rice + 10 Mg ha−1 of biochar.
Agronomy 10 01101 g008
Figure 9. Ordinations of first (PC1) and second (PC2) principal components depicting the relationships among soil physicochemical characteristics at Ben Tre (a), Kien Giang (b), and between plant biomass and cation contents at Ben Tre (c). Data for the summer–autumn crop in 2019 (SA19). FRR, Fallow–Rice–Rice; FRR + Comp, Fallow–Rice–Rice + 3 Mg ha−1 of compost; FRR + BC, Fallow–Rice–Rice + 10 Mg ha−1 of biochar.
Agronomy 10 01101 g009
Table 1. The main physicochemical properties of compost, biochar, and initial soil (0–20 cm).
Compost *Biochar *Ben TreKien Giang
Sand (%) 1.930.78
Silt (%) 56.242.0
Clay (%) 41.857.2
Soil texture Silty claySilty clay
pHw 8.7 a7.7 a4.64 b4.65 b
EC (mS cm−1)17.1 c4.1 c1.24 d1.16 d
ECe (mS cm−1) 4.504.10
Total C (g kg−1)15447115.715.0
Total N (g kg−1)264.721.551.32
CEC (cmolc kg−1)666.514.615.4
Soluble Na (cmolc kg−1)1.590.243.672.62
Soluble K (cmolc kg−1)203.350.150.07
Soluble Ca (cmolc kg−1)7.290.151.700.96
Exchangeable Na (cmolc kg−1)0.60.241.381.21
Exchangeable K (cmolc kg−1)1512.90.630.52
Exchangeable Ca (cmolc kg−1)61.60.166.013.44
ESP (%) 9.648.00
Available P (mg kg−1)36008006.9120.9
Total porosity (%)76.292.353.456.4
* Values are based on oven-dried weight; pHw, pH (H2O); a pH (H2O) 1:5; b pH (H2O) 1:2.5; c EC 1:5; d EC 1:2.5; EC, electrical conductivity; ECe, saturated paste extract EC; CEC, cation-exchange capacity; ESP, exchangeable sodium percentage; exchangeable cations were determined by subtracting soluble cations from total extractable cations.
Table 2. General linear model analysis of soil characteristics.
DfpHECAvail-PSo-NaSo-KSo-CaEx-NaEx-KEx-CaCECESPK+/Na+
Ben Tre
T3*********************ns*********
S4******************************ns
T x S12ns**********nsnsnsnsnsnsns
Kien Giang
T3*************ns******nsns******
S4************************nsns******
T x S12**********ns***nsns*ns
Df, degrees of freedom; T, treatment; S, season; Avail-P, available P; So-Na, soluble Na; So-K, soluble K; So-Ca, soluble Ca; Ex-Na, exchangeable Na; Ex-K, exchangeable K; Ex-Ca, exchangeable Ca; CEC, cation-exchange capacity; ESP, exchangeable sodium percentage; exchangeable cations were determined by subtracting soluble cations from total extractable cations; * p < 0.05; ** p < 0.01; *** p < 0.001; ns, not significant.
Table 3. Aboveground biomass (Mg ha−1) of rice at the Ben Tre experimental site.
TreatmentStraw (Oven Dry)Grain (Oven Dry)Total Aboveground Biomass
SS18
RRRNA0NA
FRR---
FRR + Comp---
FRR + BC---
SA18
RRRNA2.76 nsNA
FRRNA2.44 nsNA
FRR + CompNA3.06 nsNA
FRR + BCNA2.40 nsNA
WS18–19
RRR6.32 b3.15 ns9.47 b
FRR7.10 ab3.16 ns10.3 ab
FRR + Comp7.71 a3.21 ns11.0 a
FRR + BC7.67 a2.92 ns10.5 ab
SS19
RRRNA0NA
FRR---
FRR + Comp---
FRR + BC---
SA19
RRR5.59 b2.79 ns 8.57 b
FRR5.80 b2.40 ns 8.76 ab
FRR + Comp6.16 ab2.48 ns 8.64 ab
FRR + BC6.41 a3.23 ns 9.64 a
Column with different letters indicate a significant difference (p < 0.05) among treatments; ns, not significant; NA, not applicable with respect to the objectives of this study; -, rice was not cultivated. SS, spring–summer; SA, summer–autumn; WS, winter–spring; RRR, Rice–Rice–Rice; FRR, Fallow–Rice–Rice; FRR + Comp, Fallow–Rice–Rice + 3 Mg ha−1 of compost; FRR + BC, Fallow–Rice–Rice + 10 Mg ha−1 of biochar.
Table 4. Total P, Na, K, Ca, and K+/Na+ ratio in rice plant samples at the Ben Tre experimental site.
TreatmentWS18–19SA19
StrawGrain StrawGrain
Total Na (mmol kg−1)
RRR232 a4.86 ns448 aNA
FRR257 a4.84 ns404 aNA
FRR + Comp262 a4.72 ns409 aNA
FRR + BC146 b5.77 ns268 bNA
Total K (mmol kg−1)
RRR436 b87.8 ns392 bNA
FRR433 b88.3 ns394 bNA
FRR + Comp381 c83.5 ns383 bNA
FRR + BC618 a75.0 ns540 aNA
Total Ca (mmol kg−1)
RRR61.3 ns6.50 ns87.5 nsNA
FRR63.9 ns6.46 ns84.3 nsNA
FRR + Comp69.3 ns6.05 ns82.3 nsNA
FRR + BC66.3 ns7.39 ns80.7 nsNA
K+/Na+
RRR1.92 b 16.6 ns0.91 bNA
FRR1.79 b 18.3 ns0.95 bNA
FRR + Comp1.54 b 15.5 ns0.94 bNA
FRR + BC4.40 a 16.0 ns1.99 aNA
Total P (g P2O5 kg−1)
RRR3.28 ab10.7 ns4.64 nsNA
FRR2.78 b10.6 ns4.54 nsNA
FRR + Comp3.39 a10.5 ns5.18 nsNA
FRR + BC3.43 a10.6 ns4.94 nsNA
Column with different letters indicate a significant difference (p < 0.05) among treatments; ns, not significant; NA, not applicable with respect to the objectives of this study. SA, summer–autumn; WS, winter–spring; RRR, Rice–Rice–Rice; FRR, Fallow–Rice–Rice; FRR + Comp, Fallow–Rice–Rice + 3 Mg ha−1 of compost; FRR + BC, Fallow–Rice–Rice + 10 Mg ha−1 of biochar.

