Article

Effect of N Supply Level and N Source Ratio on Cichorium spinosum L. Metabolism

by
Martina Chatzigianni
1,2,†,
Konstantinos A. Aliferis
3,4,†,
Georgia Ntatsi
1,* and
Dimitrios Savvas
1,*
1
Laboratory of Vegetable Crops, Department of Crop Science, Agricultural University of Athens, 75 Iera Odos, 11855 Athens, Greece
2
Laboratory of Soil Science and Plant Diagnostics, Department of Sustainable Agriculture, Mediterranean Agronomic Institute of Chania, Alsyllion Agrokepiou, 73100 Chania, Greece
3
Laboratory of Pesticide Science, Department of Crop Science, Agricultural University of Athens, 75 Iera Odos, 11855 Athens, Greece
4
Department of Plant Science, Macdonald Campus, 21111 Lakeshore Road, Ste-Anne-de-Bellevue, QC H9X 3V9, Canada
*
Authors to whom correspondence should be addressed.
These authors contributed equally to this work.
Agronomy 2020, 10(7), 952; https://doi.org/10.3390/agronomy10070952
Submission received: 30 May 2020 / Revised: 25 June 2020 / Accepted: 26 June 2020 / Published: 2 July 2020
(This article belongs to the Collection Nutrition Management of Hydroponic Vegetable Crops)

Abstract

:
Cichorium spinosum L. is considered a health-promoting vegetable that has been recently introduced in cultivation, and thus information on the responses of its different ecotypes to N supply level and source is largely fragmented. To cover this gap of knowledge, seeds of two different local ecotypes of C. spinosum L. originating from a coastal and a montane habitat of the island of Crete were propagated, and the obtained seedlings were grown hydroponically. The supplied nutrient solution differed in the total-N level (4 or 16 mmol L−1) and N source (NH4-N/-N/total-N: 0.05, 0.25, or 0.50). The impact of N supply level and N source ratio on the metabolism of the two ecotypes was assessed by gas chromatography–electron impact–mass spectrometry (GC/EI/MS) metabolomics combined with bioinformatics analyses. A general disturbance of the plants’ metabolism was recorded, with results revealing that the genotypic composition was the predominant factor for the observed discriminations. The montane ecotype exhibited substantially lower levels of metabolites such as fructose and α-α-trehalose, and higher levels of glucose, myo-inositol, and fatty acids compared to the coastal ecotype when both were treated with low N. Carboxylic acids and metabolites of the tricarboxylic acid cycle (TCA) were also substantially affected by the N supply level and the NH4-N/total-N ratio. The obtained information could be further exploited in the breeding of cultivars with improved nutritional value and resilience to variations in N supply levels and sources.

1. Introduction

Nitrogen (N) availability in natural and agricultural ecosystems can be a limiting factor for plant growth. N is an essential element for the synthesis of chlorophyll, amino acids (AA), proteins, nucleic acids, lipids, and a variety of primary and secondary metabolites containing N in their structure. Nitrate (NO3) and ammonium (NH4+) are the two major forms of N absorbed by plants [1] Moreover, the most abundant form of available plant N in natural and agricultural ecosystems is NO3 [2]. Many researchers have investigated the NO3 uptake and impact on plant development, while various recent studies have additionally focused on obtaining an overview of the links between N nutrition and plant metabolism. A concern associated with N nutrition in plants is that high amounts of NO3 in human food might result in life-threatening diseases, such as methaemoglobinemia and gastric cancer [3,4]. Nevertheless, as a plant nutrient, NO3 can act also as a signaling molecule, modulating a wide range of processes including, among others, plant growth, root system architecture (RSA) [5,6,7], leaf development [8], flowering time [9], and seed dormancy [10]. In addition, plants have developed complex mechanisms to detect the presence of NO3 and regulate their assimilation into AA, proteins, and other N-containing metabolites by coupling with carbon (C) assimilation through photosynthesis [11,12]. The first step of NO3 assimilation is its reduction to nitrite (NO2) by nitrate reductase (NR [13]), and then to NH4+ by the concerted action of nitrite reductase (NiR [14,15]). Finally, NH4+ is mainly incorporated into AA through reactions catalyzed by glutamine synthetase (GS) and glutamate synthase (GOGAT [16,17]). The synthesis of organic acids, especially 2-oxoglutarate, which acts as the acceptor for NH4+ in the GOGAT pathway, and malate, which acts as a counter-anion substituting for NO3 to prevent alkalization, is essential for NO3 assimilation [18].
Metabolite profiling is widely used for diagnostics, and the physiological mechanisms deployed by plants to adapt to a wide range of stresses have been dissected, including nutrient deficiency, mineral toxicity, temperature, and oxidative and osmotic stresses [19]. Nutrient shortages dramatically affect plant growth and plant metabolism. Because of their various roles as structural elements, or their biochemical roles, N, P, or K deficiencies can directly or indirectly affect the plant metabolic pathways, thereby directly influencing the quantities of metabolites. Urbanczyk-Wochniak and Fernie [20] already investigated the effect of N starvation on the metabolite levels in tomato leaves, and found that amino acid levels decreased under N deficiency. In addition, the level of 2-oxoglutarate, which is a key regulator of C and N interactions [21], decreased under N deficiency, as well as citrate, isocitrate, succinate, fumarate, and malate, which act as intermediates in the tricarboxylic acid cycle (TCA). Tschoep et al. [22] and Urbanczyk-Wochniak and Fernie [20] who have analyzed the effect of mild but sustained N limitation in Arabidopsis and tomato, respectively, found that malate and fumarate levels significantly decreased under low N conditions. The study of the impact of N on metabolism of tomato plants (leaves and roots) revealed that N limitation imposed a remarkable change in abundance of primary metabolites in leaves and roots during N deficiency [23]. Amino and organic acids of the TCA cycle declined substantially in both tissues on day 5 and 15 of N limitation. In particular, the levels of organic acids such as citrate, fumarate, malate, and succinate (TCA cycle) decreased on day 5, and exhibited a recovery on day 15. On the other hand, the fluctuations in the levels of carbohydrates were tissue-specific, as it showed a decrease in leaves of approximately 25–50%, but increased several-fold in the roots. Moreover, in the case of maize, researchers found a significant reduction in AA, organic acids, as well as fatty acids under low-N treatments [24]. In addition, long-term N starvation significantly reduced the concentrations of most of the AA as well as the levels of compounds containing N in their structure, such as γ-aminobutyric acid (GABA) in maize [25]. Organic acids involved in the TCA cycle and carbohydrates such as glucose and fructose also showed a decrease under N-stress conditions.
Cichorium spinosum L., commonly known as stamnagathi in the Greek language, is a widespread and well-known wild chicory species of the island of Crete. It is a dwarf perennial species that can easily grow in coastal areas as it exhibits considerable tolerance to salt stress [26]. Due to its high content in vitamins E (α- and γ-tocopherols) and K1, other antioxidants [27], ω-3 fatty acids, and several mineral elements [28], stamnagathi is considered a functional food. In a previous metabolomics study, the metabolite composition of stamnagathi and especially major primary metabolites such as GABA, carbohydrates, and predominantly fructose and glucose, as well as AA (L-leucine, L-isoleucine, L-valine), were strongly influenced by salinity stress [29]. Within this context, the current study focuses on the discovery of the differences between the metabolite profiles of two contrasting ecotypes of stamnagathi caused by the reduction of N supply by 25% compared to the standard level and variations in the N source ratio (NH4-N/total-N) from 0.05 to 0.50.

2. Materials and Methods

2.1. Plant Material

Seeds of C. spinosum L. originating from plants grown spontaneously either in a mountainous or in a coastal area of the island of Crete were collected. The collection of seeds from the coastal ecotype took place in Stavros, a site located in Akrotiri at northeastern Crete on 27 September. The collection of seeds from the montane ecotype took place in Tavri plateau (1200 m altitude) on the mountain of Lefka Ori on 9 October. The seeds were transferred to the seed bank of the Mediterranean Agronomic Institute of Chania (MAICh). Before sowing, a germination test took place in Petri dishes using agar as substrate. By the middle of October, about 2000 seeds from each ecotype were placed in Petri dishes and stored in a chamber at 20 °C and 12/12 h light/dark conditions. The germinated seeds were transferred on 29 October 2014 to trays filled with peat and perlite (2:1) and incubated in an unheated glasshouse until transplanting. The stamnagathi seedlings were transplanted onto perlite bags (Perloflor Hydro) and grown hydroponically in a north–south oriented glasshouse of MAICh located at a 35°29′40.32″ N latitude and 24°02′57.51″ E longitude. Each treatment consisted of four replications, and each replication consisted of five perlite bags. Therefore, 20 perlite bags per treatment were used in this experiment. Four plants were transplanted on each bag and the nutrient solution effluents that drained out of the bags were discharged.

2.2. Experimental Design

Six different nutrient solution treatments obtained by combining two levels of total-N supply (4 mM N or 16 mM N) with three levels of NH4-N/total-N (0.05, 0.25, and 0.50, respectively) were applied to stamnagathi. To attain identical electrical conductivity (EC) levels in all treatments, we balanced the changes in the NH4+-N/total-N concentrations by varying the K+, Ca2+, and Mg2+ concentrations while maintaining the same K+/Ca2+/Mg2+ ratio (8:5.25:1.5 on a molar basis). Similarly, the changes of the NO3 concentrations in the different treatments were electrochemically balanced by varying accordingly the SO42− and Cl concentrations at a 1:1 ratio. The phosphorus and the micronutrient concentrations were identical in all treatments as follows: 1.2 mM P, 15 µM Fe, 8 µM Mn, 6 µM Zn, 0.7 µM Cu, 30 µM B, 0.5 µM Mo (Table S1). The pH was set at 5.6 and the electrical conductivity (EC) value at 2.3 dS m−1 in the supplied nutrient solution until the end of the experiment. The calculation of the nutrient formulae and the preparation of the nutrient solution were performed as previously described [30]. Pumps were connected with an electronic timer and the nutrient solution was delivered daily to the plants through a drip irrigation system. The flow rate of the drippers was 35 mL min−1. Two days before transplanting, perlite bags were irrigated with the nutrient solution until saturation and after 24 h two slits were created at the bottom of the bags. On 30 January 2015, the plants were transplanted to the bags. The irrigation frequency was adjusted according to the integral of solar radiation intensity aiming to obtain a drainage fraction of 30%. This resulted in two to four irrigation applications per day (140–280 mL per plant) to each experimental unit. When the plants reached the stage of commercial maturity, two harvests took place, the first one on 13th of March and the second one on 13th of May, i.e., 42 and 103 days after transplanting, respectively. During the experiment, no spraying for disease or insect control and no heating were applied.

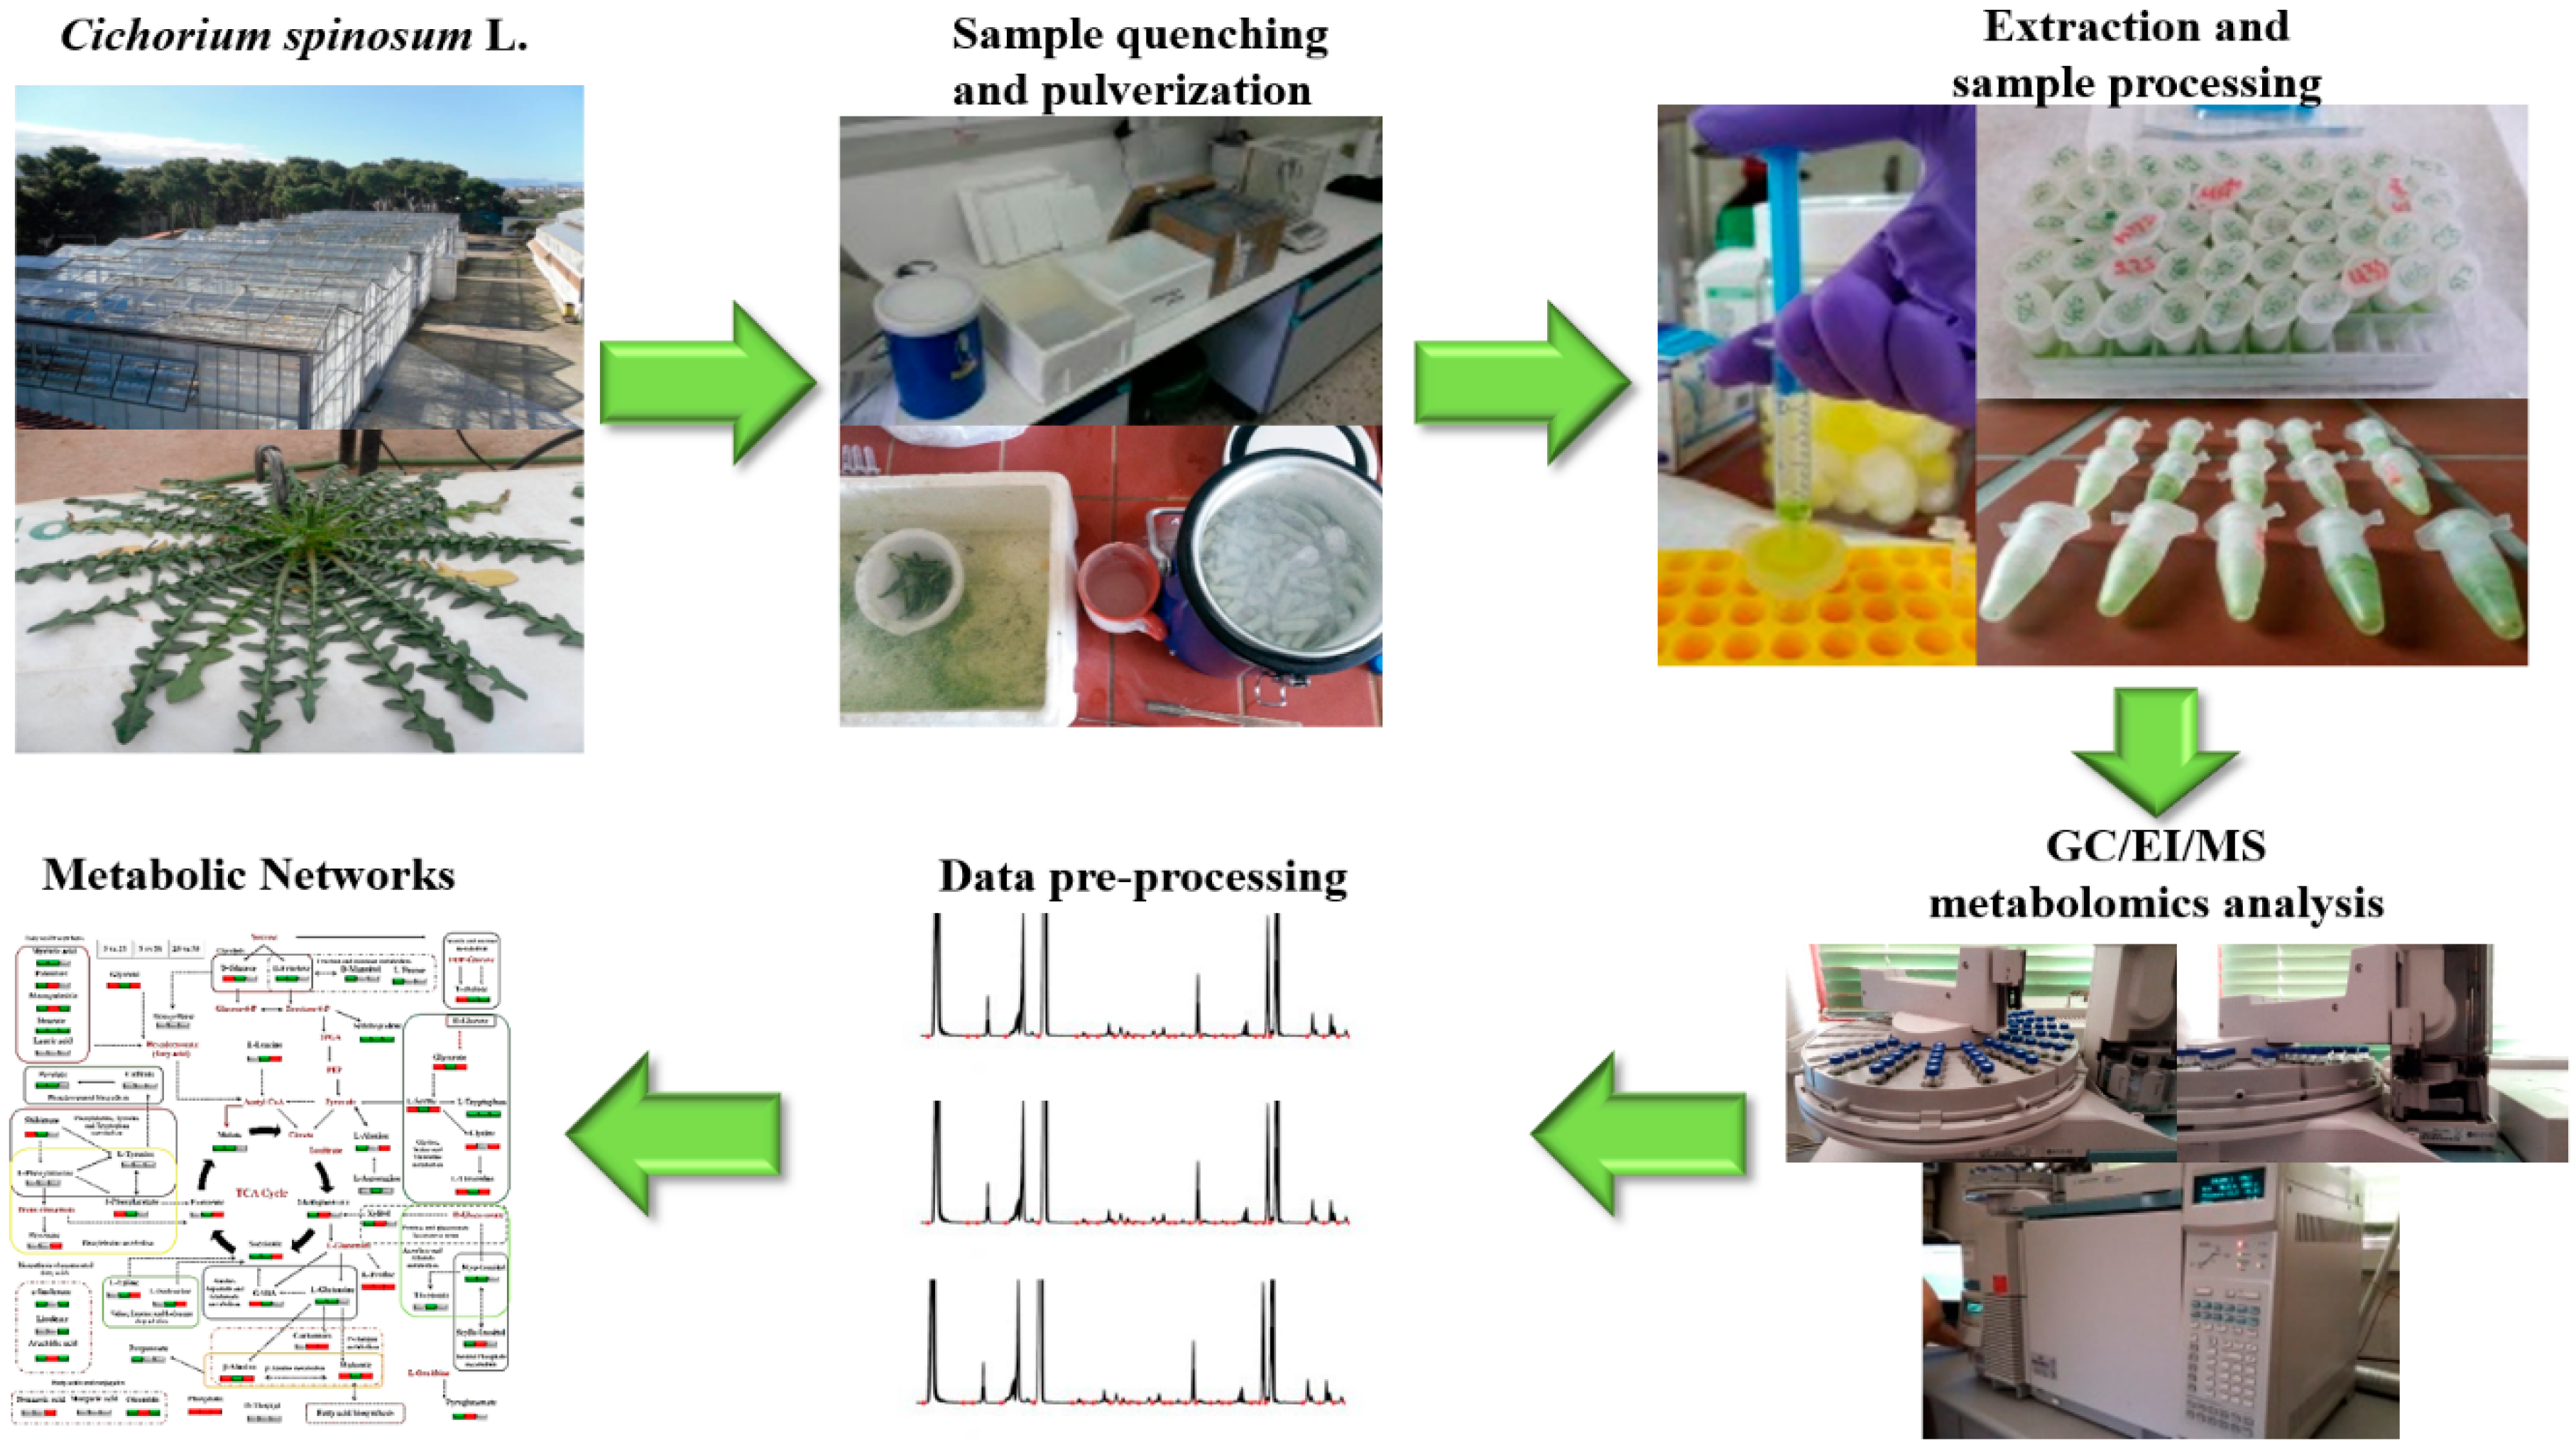
2.3. Gas Chromatography–Electron Impact–Mass Spectrometry (GC/EI/MS) Metabolomics Analysis of Cichorium spinosum L.

2.3.1. Chemicals and Reagents

For the extraction of the plant metabolites, we used the organic solvents ethyl acetate (EtAc) and methanol (MeOH) (GC/MS grade, 99.9% purity, Carlo Erba Reagents, val de Reuil, France). In the preparation of extracts for GC/EI/MS analyses, we used the reagents methoxylamine hydrochloride (98%, w/w) and pyridine (99.8%, v/v, Sigma-Aldrich Ltd., Steinheim, Germany), and N-trimethylsilyl-N-methyl trifluoroacetamide (MSTFA, Macherey and Nagel, Düren, Germany) for methoxymation and silylation, respectively. Ribitol was used as an internal standard, and selected analytical standards of plants’ primary metabolites were purchased from Sigma-Aldrich Ltd.

2.3.2. Sampling and Extraction of Cichorium spinosum L. Leaves and Preparation for Metabolomics Analyses

Fresh leaves of stamnagathi were collected from all experimental units on the date of the second harvest and used in the metabolomics analysis. Ten healthy, fully expanded leaves from three plants were collected and pooled in order to provide a pooled sample. In total, four pooled samples were analyzed per treatment. The excised leaves were collected and placed in plastic falcon tubes (50 mL), which were immediately immersed in liquid N2 for metabolism quenching. Samples were pulverized to a fine powder in a mortar, using a pestle under liquid N2, and then stored at −80 °C. A portion of the pulverized leaf tissues (25 mg) were placed in Eppendorf tubes (2 mL) and 1 mL of methanol/ethyl acetate (50:50, v/v) was added for extraction. The resulting extract was spiked with ribitol (20 μL, 0.2 mg per mL of methanol), which was used as the internal standard. The resulting suspensions were sonicated for 20 min in an ultrasonic bath (Branson 1210 Ultrasonic Cleaner, Marshall Scientific, Hampton, NH, USA), followed by agitation in an orbital shaker at 200 rpm for 2 h (Daihan Labtech Co., Ltd., Namyangju-si, Korea) at 24 °C. For the removal of debris, we filtered samples using PTFE (Polytetrafluoroethylene) filters (25 mm⍉ 0.2 μm pores; Macherey-Nagel GmbH and Co.KG, Düren, Germany). The resulting extracts were evaporated to dryness, which was performed using a vacuum concentrator (Labconco, Kansas City, MO, USA). The derivatization was performed in a two-step process using a methoxylamine hydrochloride solution in pyridine (20 mg mL−1) and MSTFA, following a previously developed protocol [31,32]. The derivatized extracts were finally transferred into glass microinserters (180 μL) in glass autosampler vials (2 mL; Macherey-Nagel).

2.3.3. Gas Chromatography–Electron Impact–Mass Spectrometry (GC/EI/MS) Analyses and Bioinformatics Analysis

In the analyses, an Agilent GC/EI/MS platform was employed (Agilent 6890N, Agilent Technologies Inc., Santa Clara, CA, USA), which was equipped with an inert mass selective detector 5973 (MSD) and a 7683 autosampler. Previously described settings [31,32] were used with minor modifications; the electron ionization was positive (70 eV) and mass spectra were acquired at the mass range of 50–800 Da with a 4 scans s−1 rate and an initial 10 min solvent delay. The derivatized samples (1 μL) were injected on a HP-5MS capillary column (30 m, i.d. 0.25 mm, and film thickness 0.25 μm—Agilent Technologies Inc.) using a 5:1 split ratio. The injector temperature was set at 230 °C and helium was the carrier gas (1 mL min−1). The temperature of the oven was 70 °C, stable for 5 min, followed by an increase of 5 °C min−1 until 295 °C. The temperature for the MS source and quadrupole was set to 230 °C and 150 °C, respectively. All experimental events were controlled using the software MSD Chemstation (Agilent). For the deconvolution of the acquired total ion chromatograms, we used the software AMDIS v.2.66 (NIST-National Institute of Standards and Technology; Gaithersburg, MD, USA) and the MS database of the National Institute of Standards and Technology, NIST ‘08 (NIST; Gaithersburg, MD, USA). The data pre-processing was performed using the software MS-Dial v.3.70 [33], and the discovery of trends and biomarkers performing multivariate analyses were attained using the software SIMCA-P v.13.0.3 (Umetrics, Sartorius Stedim Data Analytics AB, Umeå, Sweden) as previously reported [31,32].

3. Results

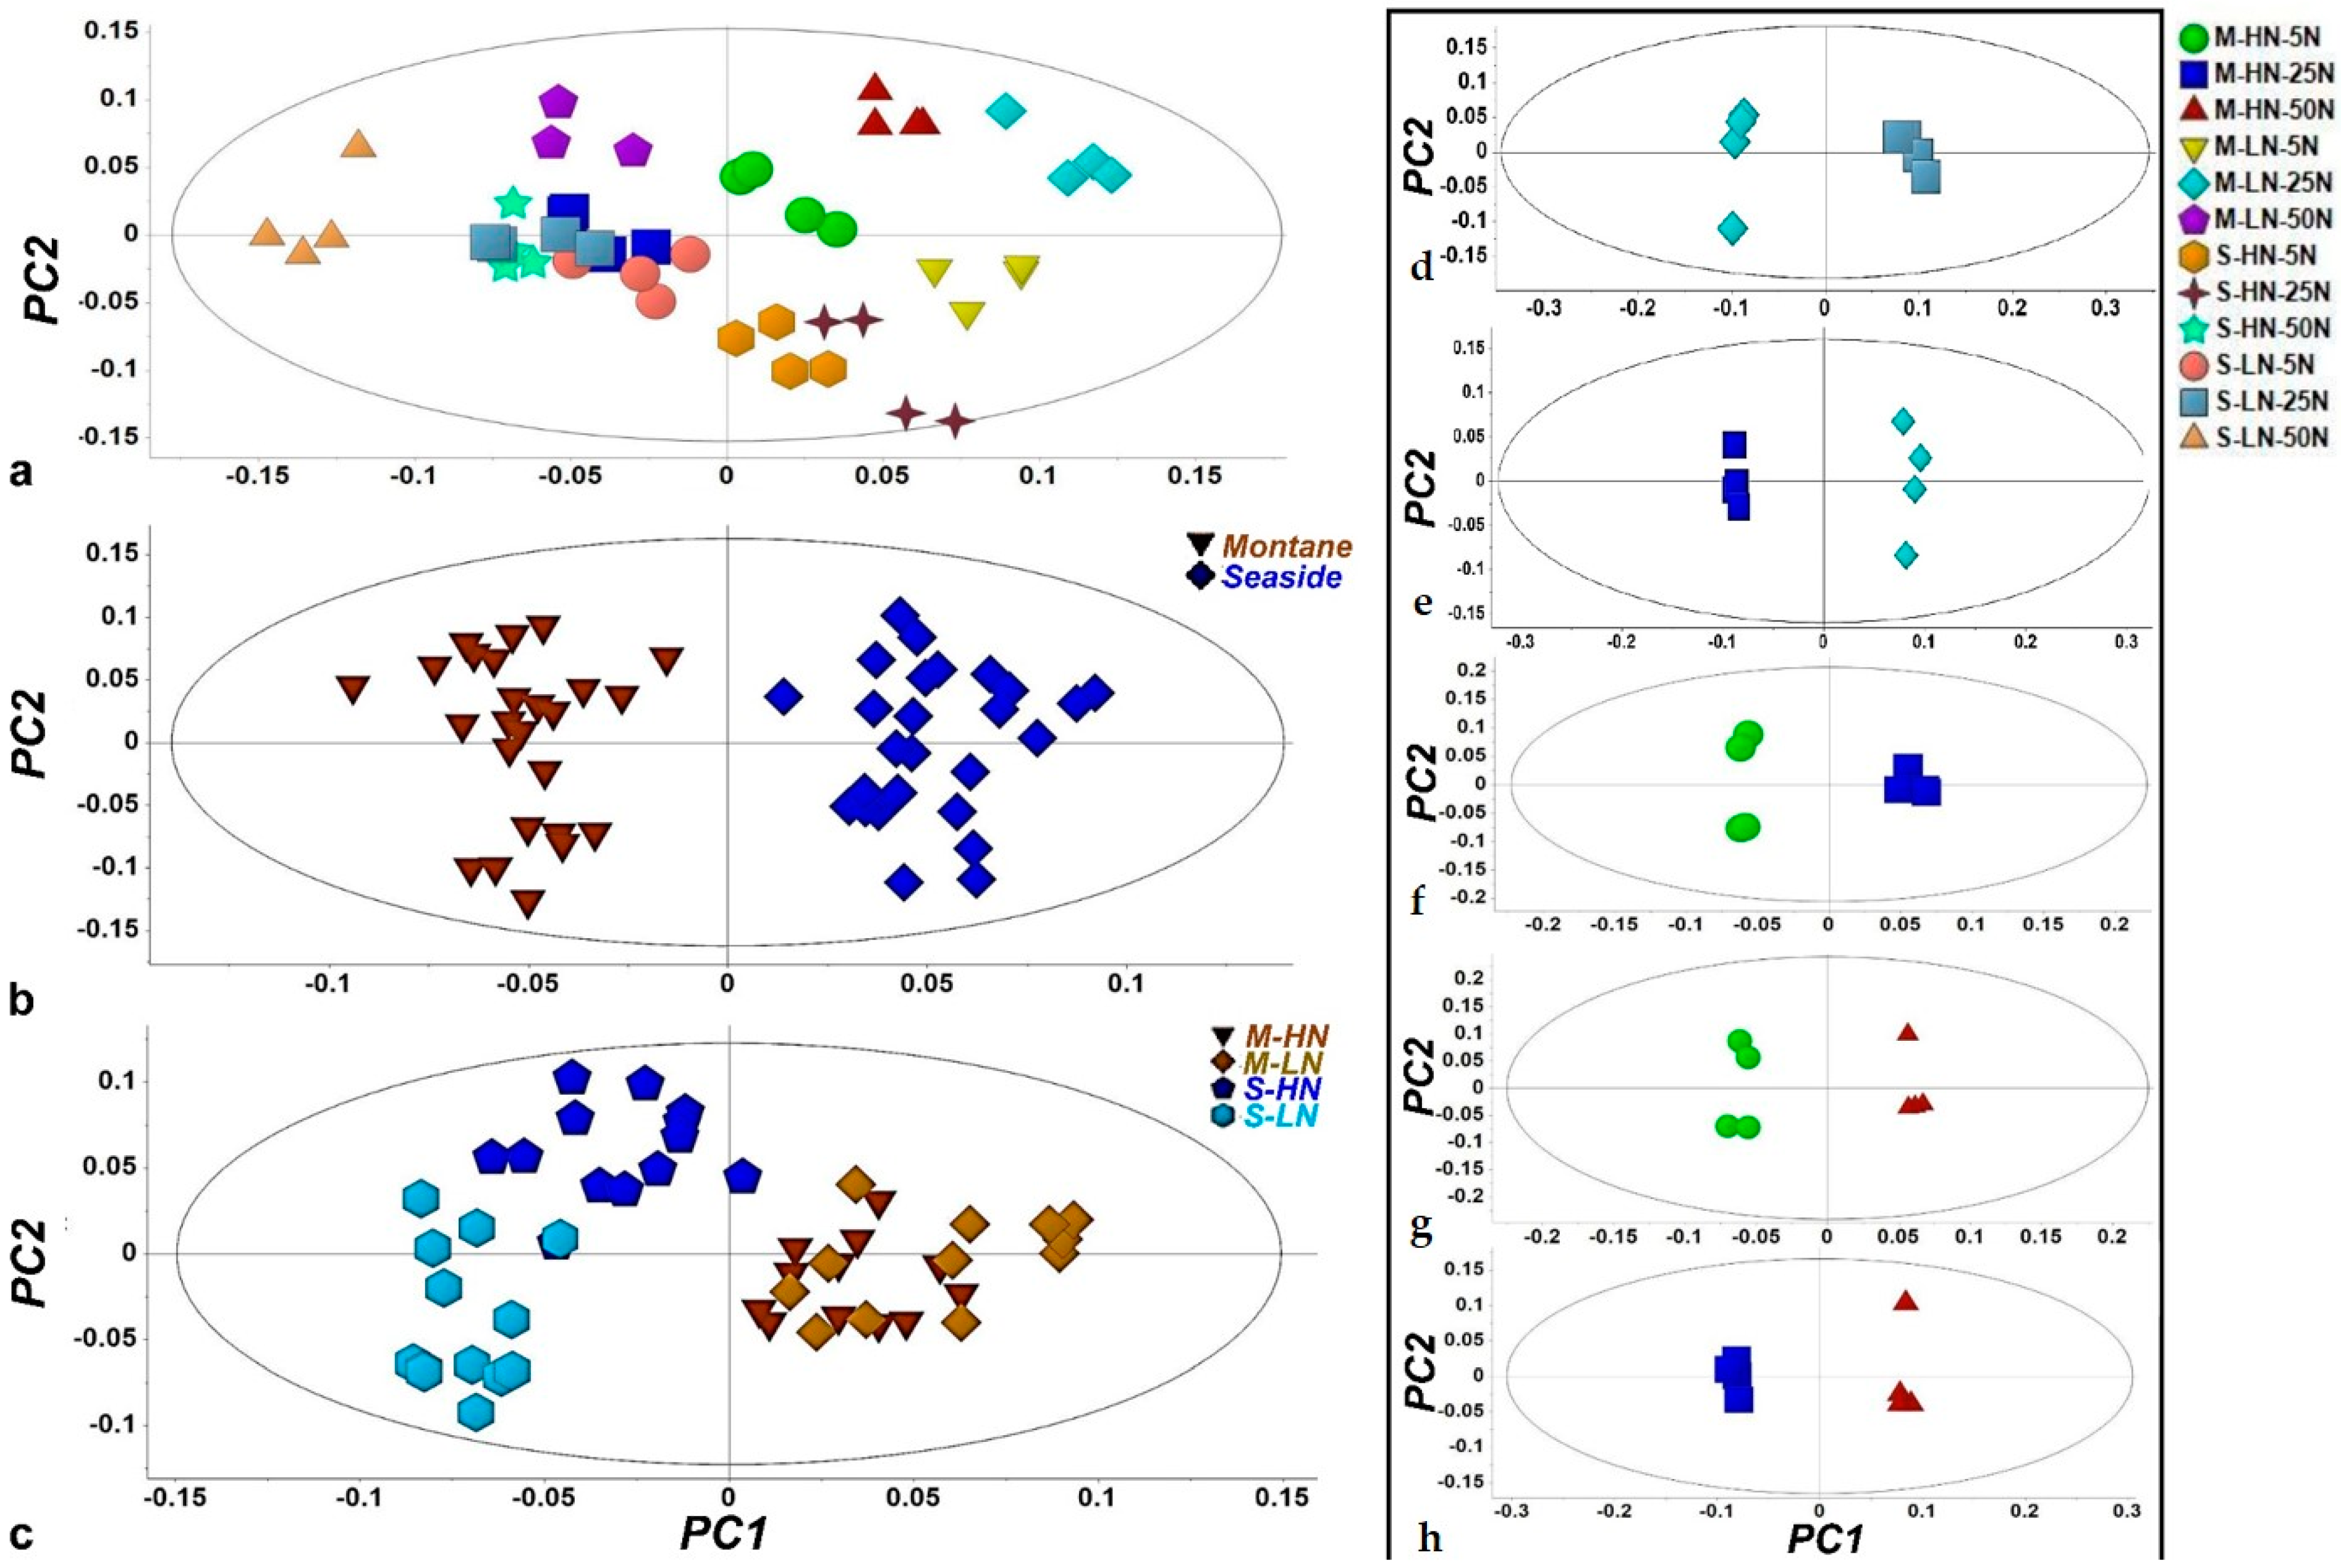
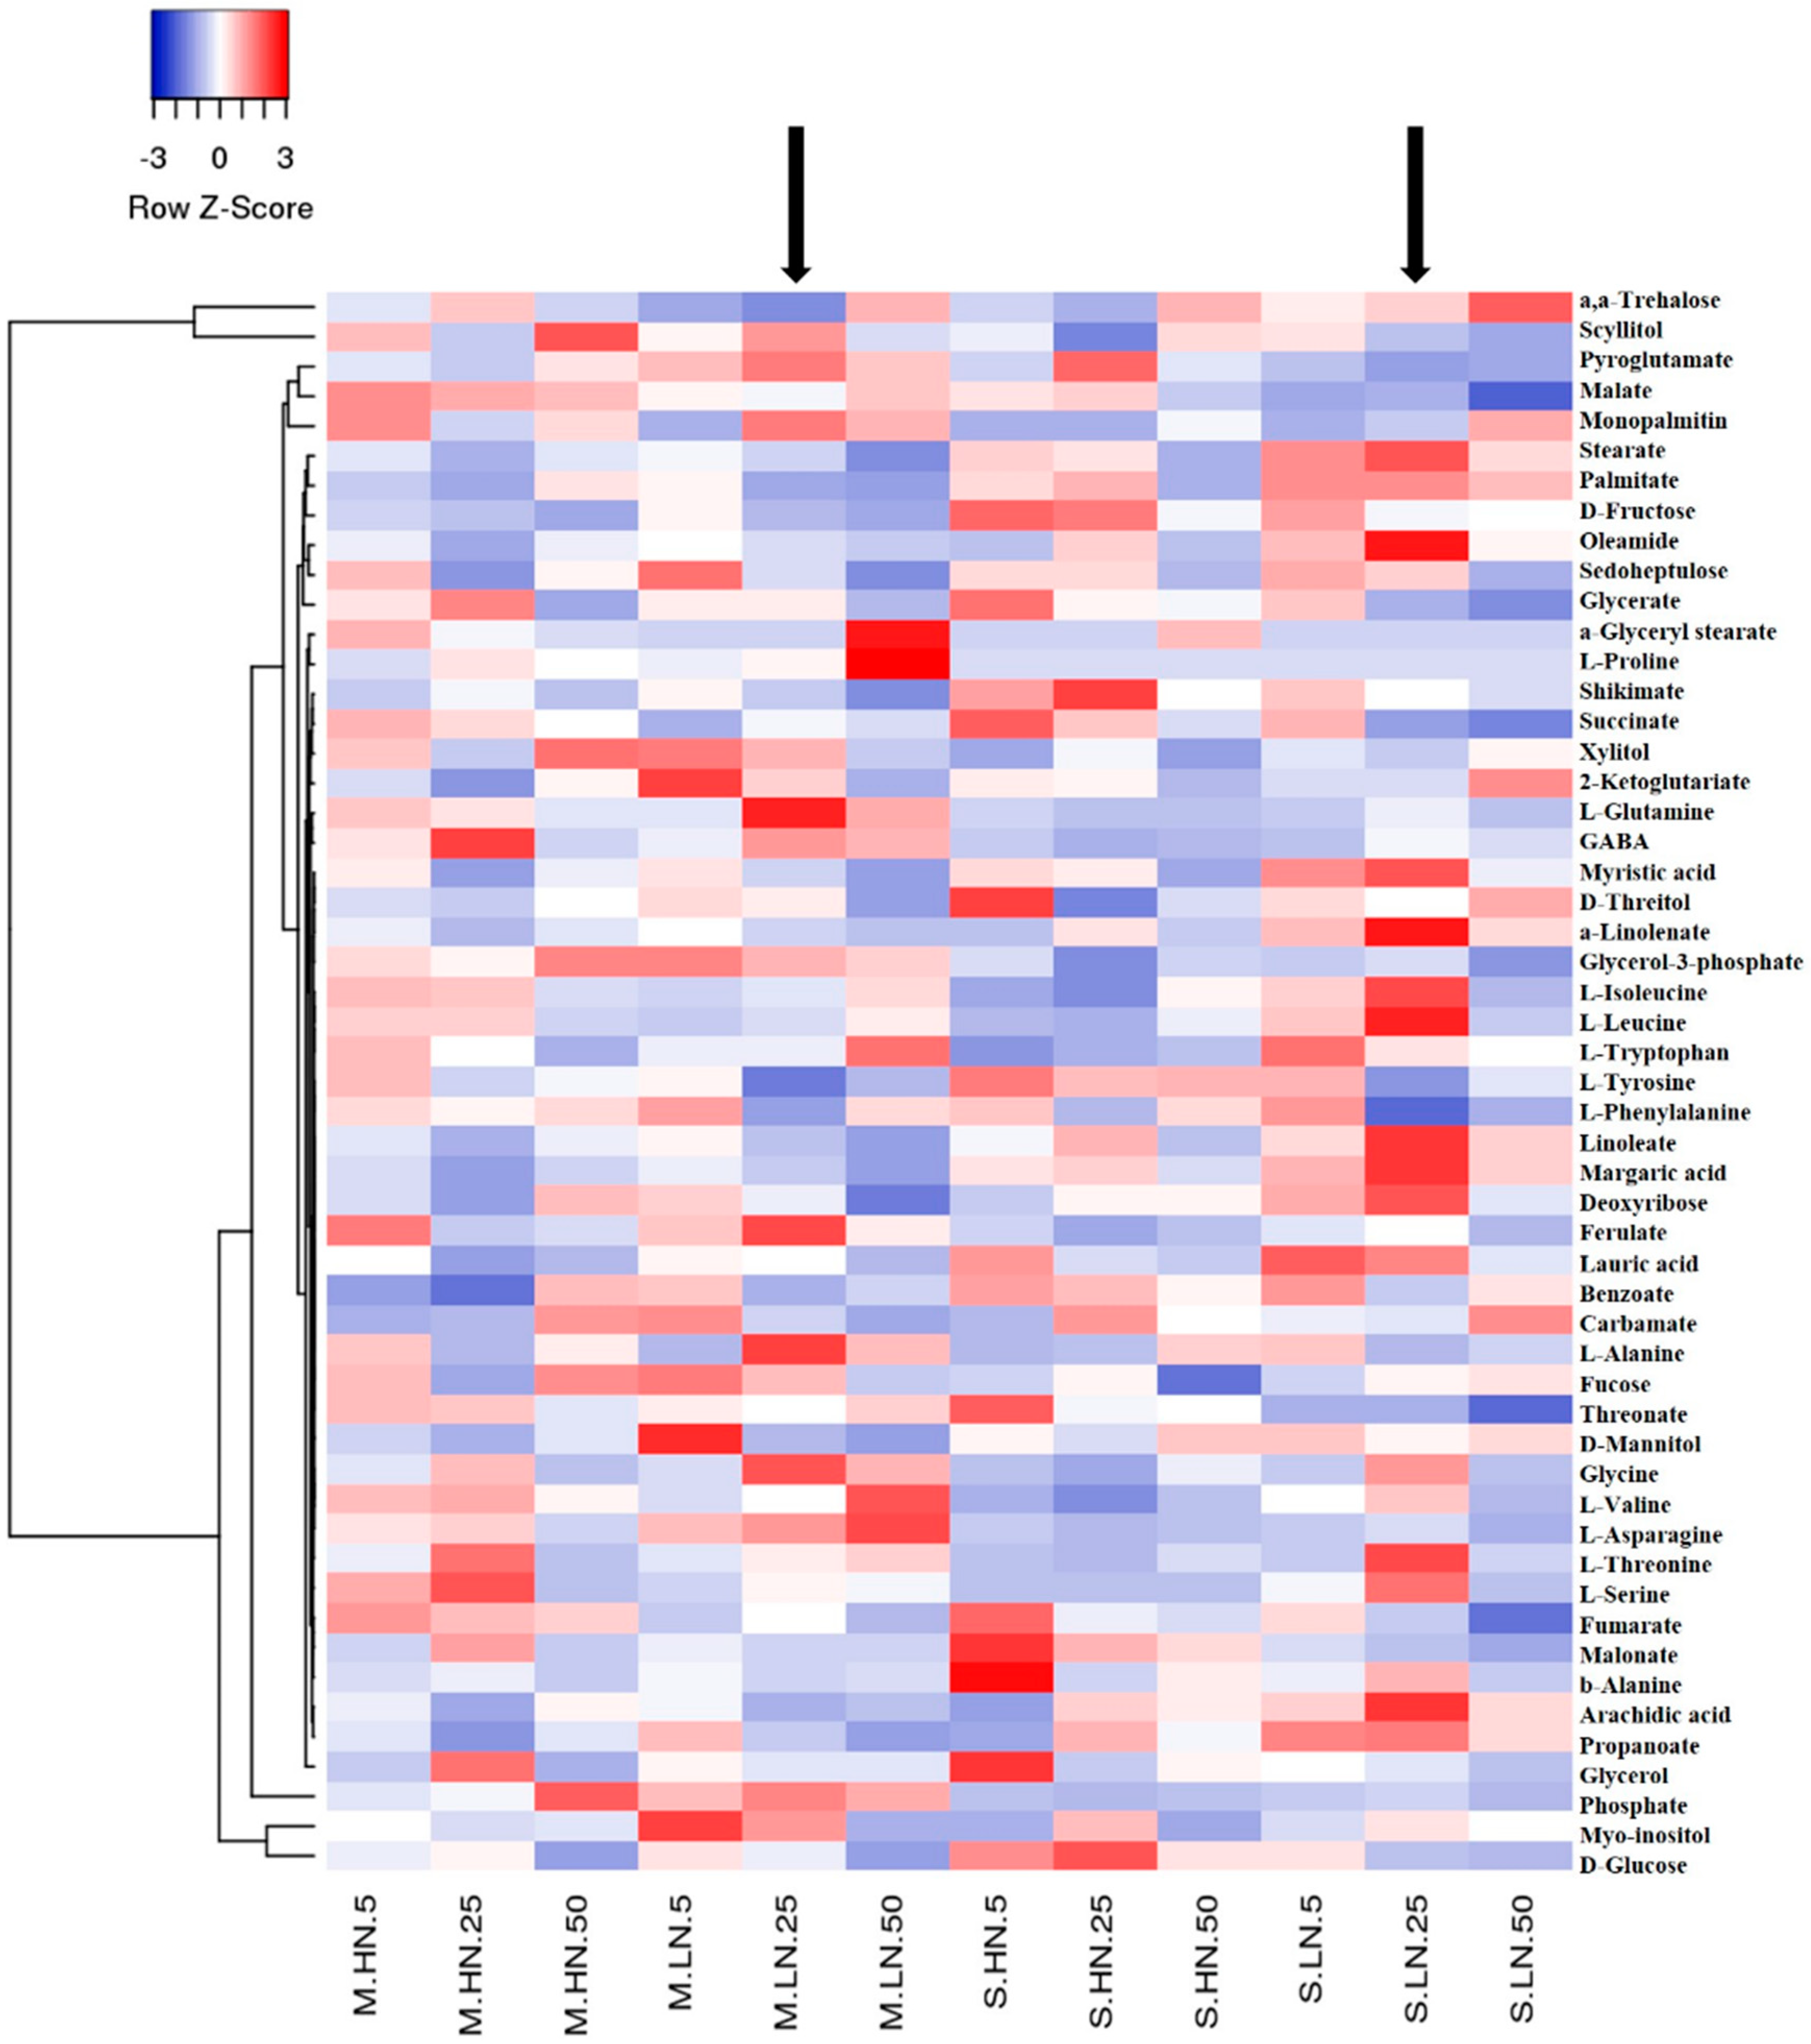
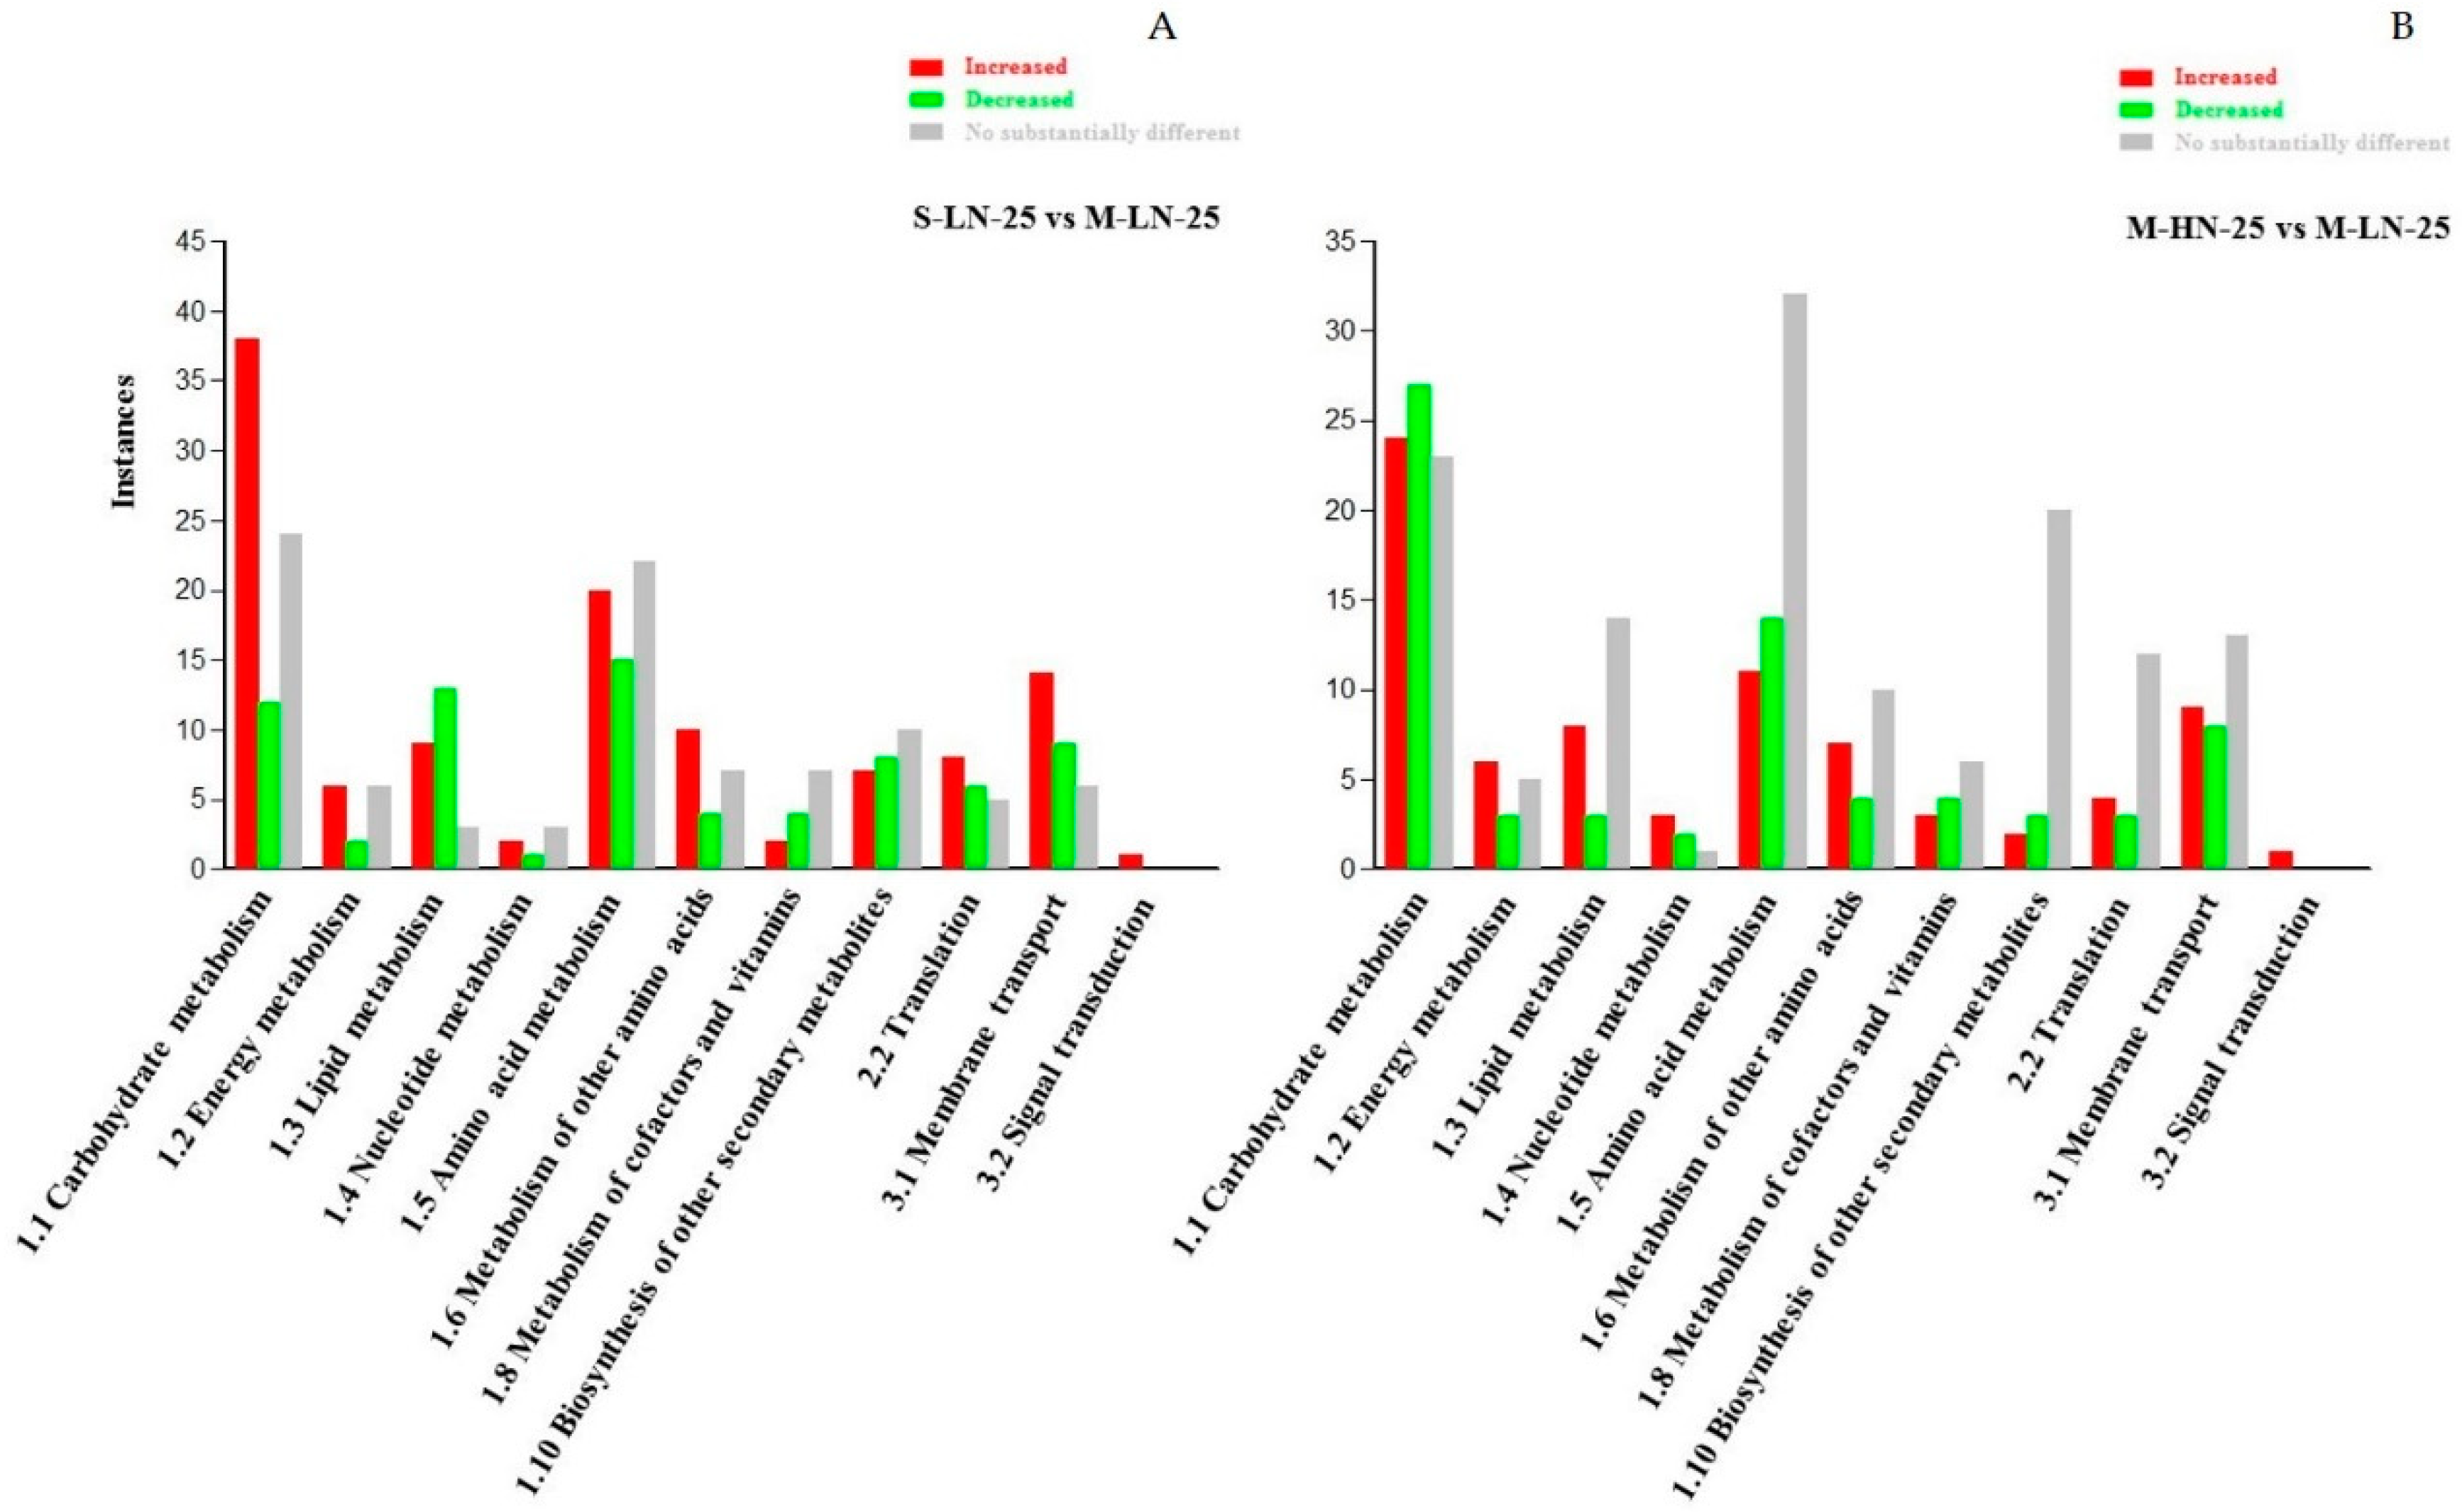
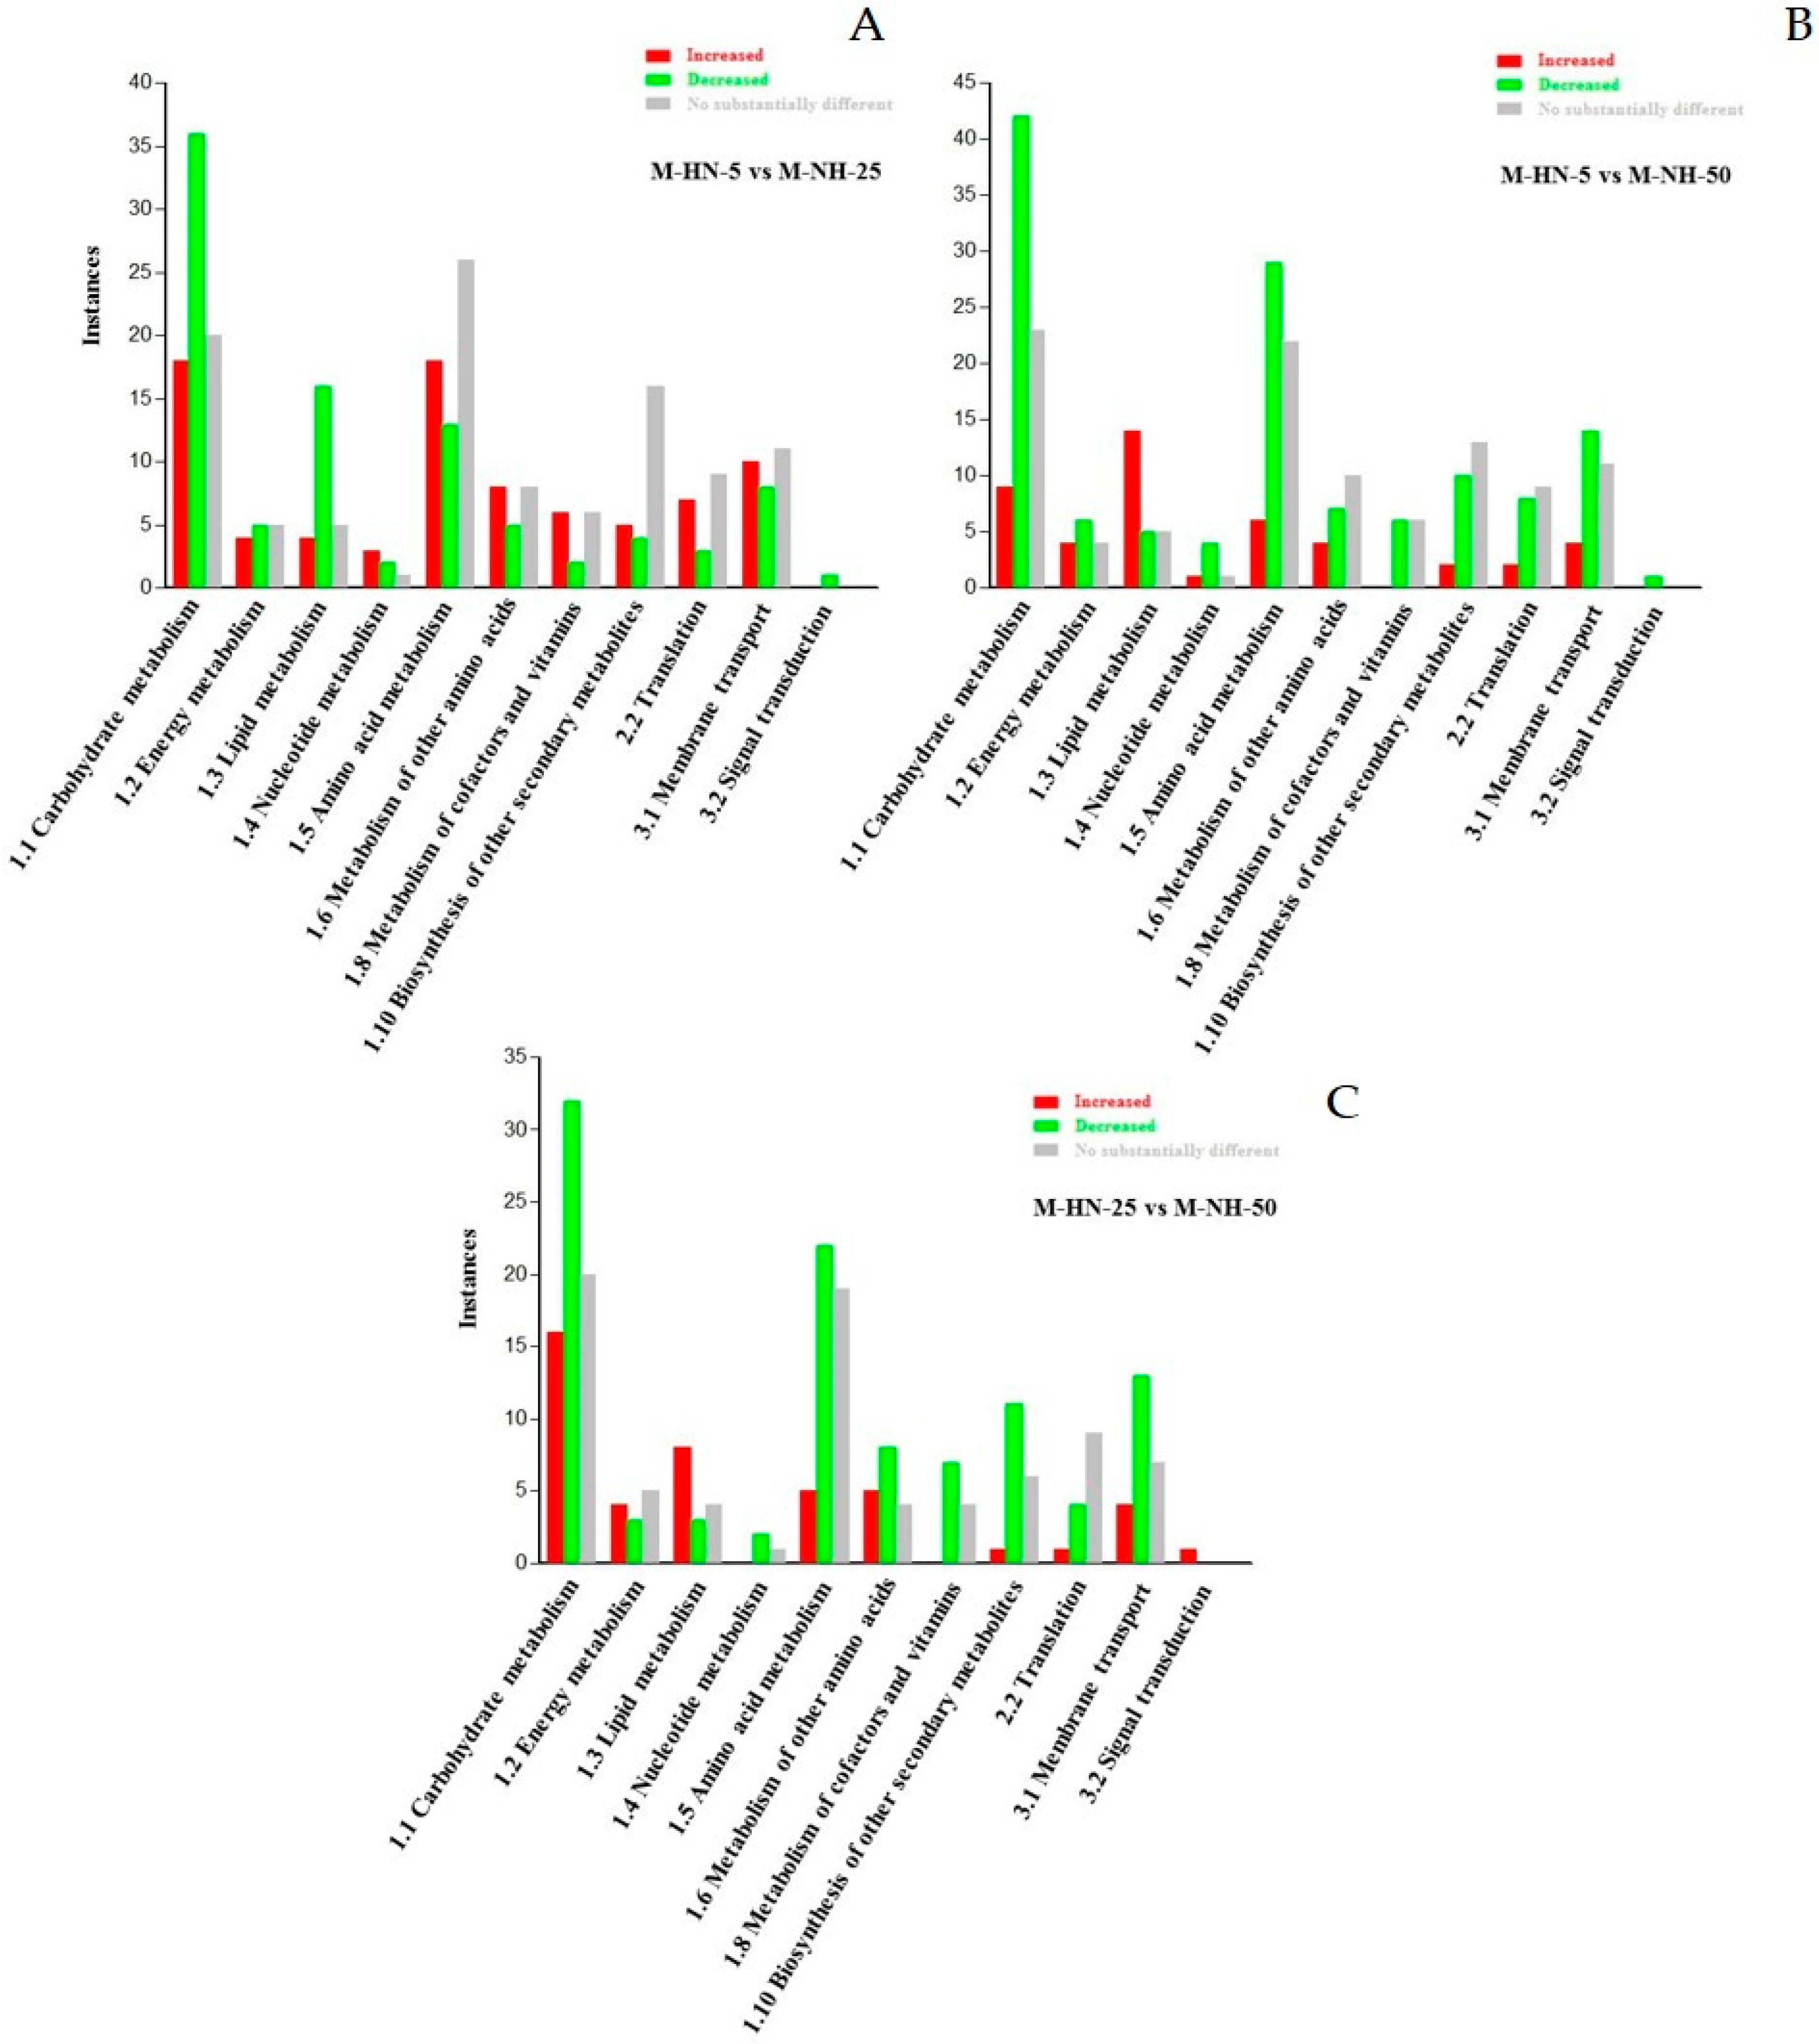
3.1. Overview of the GC/EI/MS Metabolomics Analysis

Data pre-processing and deconvolution resulted in the discovery of 156 metabolite features that were reproducibly detected and analyzed, with corresponding identifications at different levels as displayed in the Supplementary Dataset S1. Several AA, organic acids, carboxylic acids, and fatty acids were annotated. Additionally, information on the identified metabolites, such as identifiers based on the KEGG (Kyoto Encyclopedia of Genes and Genomes), Golm Metabolome Database, and PubChem coding systems; the biosynthetic pathways in which metabolites are involved; as well as their chemical groups is provided in this dataset. Another portion of the recorded metabolite profiles was not identified.
The robustness and the high quality of the experimental and bioanalytical protocols (Figure 1) was confirmed by the quality of the obtained chromatograms (Figure S1) and the observed grouping patterns in the obtained PLS-DA score plots (Partial Least Squares-Discriminant Analysis) (Figure 2). Moreover, PLS-DA score plots were created for five pairwise comparisons between treatments (Figure 2).
Orthogonal partial least squares-discriminant analysis (OPLS-DA) results (Figure 2a–h) demonstrate an obvious distinction between the different treatments of the two stamnagathi ecotypes that were grown in an open soilless culture under two different N supply levels, a low one at 4 mmol L−1 and a higher at 16 mmol L−1, combined with three different NH4/total-N fractions (5%, 25%, and 50%, respectively) (Figure 2a). Moreover, pairwise comparative OPLS-DA was carried out with one orthogonal and one predictive component calculated for five of the models derived from the two classes of samples to obtain detailed information on the metabolic alterations of the two different ecotypes of stamnagathi, the montane (M) and seaside (S), grown under low-N supply level (Figure 2b), and the stamnagathi plants of the montane and seaside ecotype treated with either 4 or 16 mmol L−1, denoted as Low-N and High-N, respectively (Figure 2c). The following pairwise comparisons were performed: S vs. M under low-N supply and medium NH4/total-N fraction (25%) (Figure 2d), High-N vs. Low-N in the montane ecotype grown under medium NH4/total-N fraction (25%) (Figure 2e), 5% vs. 25% NH4/total-N fraction under high-N conditions for the montane ecotype (Figure 2f), 5% vs. 50% NH4/total-N fraction under high-N conditions for the montane ecotype (Figure 2g), and 25% vs. 50% NH4/total-N fraction under high-N conditions for the montane ecotype (Figure 2h). The score plots of OPLS-DA results demonstrated evident variation between the two ecotypes, the two N-levels, and the three different NH4/total-N fractions (5%, 25%, and 50%, respectively) with good model quality (Figure 2b–h). As shown in the figures below, there was a strong discrimination between the two examined ecotypes (Figure 2b). However, in each ecotype separately and especially in the case of the coastal-marine ecotype, we observed a separation between the low and high total N, revealing a different response under different N supply in the nutrient solution (NS) compared to the montane ecotype (Figure 2c).
Additionally, for the robust overview of fluctuations caused by the treatments in the leaf metabolome of stamnagathi, we constructed a cluster heat map on the basis of the annotated metabolite features (Figure 3). In total, 53 metabolites (AA, carbohydrates, carboxylic acids, and fatty acids), which were differentially affected by the total-N and NH4-N/total-N supply levels, were included.
Complementary to multivariate analysis, the constructed heatmap revealed the patterns of fluctuation of the metabolite levels among treatments. As shown in the heatmap, low N supply levels resulted in a strong differentiation between the various metabolites of both ecotypes. In terms of the N source, it is evident that higher NH4+/total-N supply ratios (25% and 50%, respectively) resulted in stronger differentiation of most of the identified metabolites compared to the lower NH4+/total-N supply ratios (5%). Furthermore, a previously described approach based on the fluctuations in the number of metabolites that participate in major metabolic functions (instances) was applied [31,35] (Figure 4 and Figure 5). This approach aimed to provide a robust biological interpretation of the plants’ responses to the treatments and a global overview of the effect of treatments on the plant functions. Similarly, the effect of treatments on stamnagathi’s metabolism was evaluated on the basis of the fluctuations of its metabolites categorized in chemical groups (Figures S2 and S3). A set of the original data “Cichorium spinosum L. (PMG-03-20)” in “*.cdf” format can be accessed from the repository of the Pesticide Metabolomics Group of the Agricultural University of Athens (https://www.aua.gr/pesticide-metabolomicsgroup/Resources/default.html). The results revealed that the metabolism of stamnagathi plants of the montane ecotype under low N supply and 25% NH4/total-N ratio exhibited a general disturbance. A large number of metabolites involved in various metabolic functions were detected in increased levels compared to those of plants that originated from the coastal-marine area. On the other hand, for plants of the montane ecotype that received low N supply compared to those that received high N supply, we did not find any substantial changes in the levels of metabolites participating in functions such as amino acid metabolism, and different responses were not recorded for low N conditions (Figure 4). Moreover, in plants that were treated with the highest NH4/total-N ratio (50%), we detected metabolites that participate in functions such as carbohydrate metabolism and amino acid metabolism in lower levels compared to the lowest NH4/total-N ratio (5%) (Figure 5).
The levels of most metabolites that belong to fatty acids were detected in higher levels in the montane ecotype compared to that of the coastal area (Figure S2A). On the other hand, the level of N supply did not substantially alter the biosynthesis of carbohydrates, carboxylic acids, and fatty acids, since the majority of the metabolites of these chemical groups were not affected (Figure S2A). An interesting finding was that no fatty acids were decreased in the montane ecotype when the plants were subjected to high compared to low N supply (Figure S2B). Furthermore, the comparison between the metabolite profiles of plants following treatments with the three NH4+-N/total-N ratios revealed distinct differences in their AA, carbohydrates, carboxylic acid, and fatty acid levels (Figure S3A–C).
A large number of stamnagathi metabolites were detected by GC/EI/MS analysis, with these being involved in various biosynthetic pathways. The vast majority of the identified metabolites belonged to AA, carbohydrates, carboxylic and fatty acids (Figure 5, Figure 6, Figures S2 and S3). For the biological interpretation of the results, and in order to gain an overview of the plants’ metabolism regulation in response to the various treatments, we constructed a de novo metabolite network for the annotated metabolites, acquiring information from the KEGG database (https://www.kegg.jp/). Treatments of the plants caused a general disturbance of their metabolisms; various metabolites that belong to AA and carbohydrates were detected in higher or lower levels in the plants that originated from the coastal area compared with those of the montane ecotype.

3.2. Impact of N Supply Level and N Source Ratio on the Amino Acid (AA) Pool of Stamnagathi

Both the total N level and the N source ratios being tested significantly disturbed the biosynthesis of AA. More specifically, L-proline (Pro) was discovered in increased levels in the montane ecotype compared to the costal ecotype (Figure 6) and in the higher NH4+/total-N ratios (25% and 50%, respectively) compared to the lowest ratio (0.05) (Figure 7). On the other hand, the increase of the total-N supply resulted in increased level of Pro (Figure 6). In contrast to Pro, the levels of phenylalanine (Phe) and tyrosine (Tyr) exhibited variable response to differences in the N supply level and source. Moreover, the AA asparagine (Asn), leucine (Leu), tryptophan (Trp), valine (Val), and isoleucine (Ile) were not substantially affected by the N supply level (Figure 6). Moreover, the AA alanine (Ala), Asn, and glutamine (Gln) were detected in higher levels in the montane compared to the coastal ecotype. The N source ratio treatment also increased the AA of the pyruvate family when the 0.50 NH4+/total-N the ratio was compared with 0.25, while the reverse was observed when it was compared to 0.05. However, the N source ratio had no impact on the levels of the metabolites L-phenylalanine and L-tyrosine of the aromatic AA family. The non-protein amino acid γ-aminobutyric acid (GABA) increased in plants originating from a montane habitat in comparison to those originating from the coastal area when the N supply was low. However, at the low total-N supply level, the levels of GABA were reduced compared to the high total-N level (Figure 6). The increase of the NH4-N/total-N in the supplied NS from 0.05 to 0.25 upregulated the biosynthesis of GABA, whereas a further increase to 0.50 had no additional impact on GABA levels (Figure 7).

3.3. Impact of N Supply Level and N Source Ratio on Carbohydrate Content

The levels of carbohydrates such as glucose (Glu) and fructose (Fru), which play key roles in plant energy supply, were recorded in low levels when the N-supply in the NS decreased from 16 mM to 4 mM (Figure 6). Fru levels in the leaves of stamnagathi were lower in the montane ecotype compared to the seaside, while the reverse was observed for the Glu levels. The decrease of NH4-N/total-N from 0.50 ratio to 0.05 resulted in decreased levels of both Glu and Fru (Figure 7). The levels of the sugar alcohols D-threitol and D-mannitol were not substantially affected by the different total-N treatments, while that of sedoheptulose increased by low N supply and that of glycerol decreased. Additionally, α-α-trehalose, an important disaccharide that is involved in plant development and responses to stresses, was significantly lower in plants receiving low-N supply levels when compared with those receiving high N. Similar was the trend for the comparison between the montane ecotype and that originating from the seaside habitat (Figure 6). With respect to NH4-N/total-N ratio, its increase from 0.05 to 0.25 also significantly increased the levels of α-α-trehalose. On the other hand, an increase from 0.05 or 0.25 to 0.50 resulted in significantly decreased levels of the disaccharide (Figure 7).

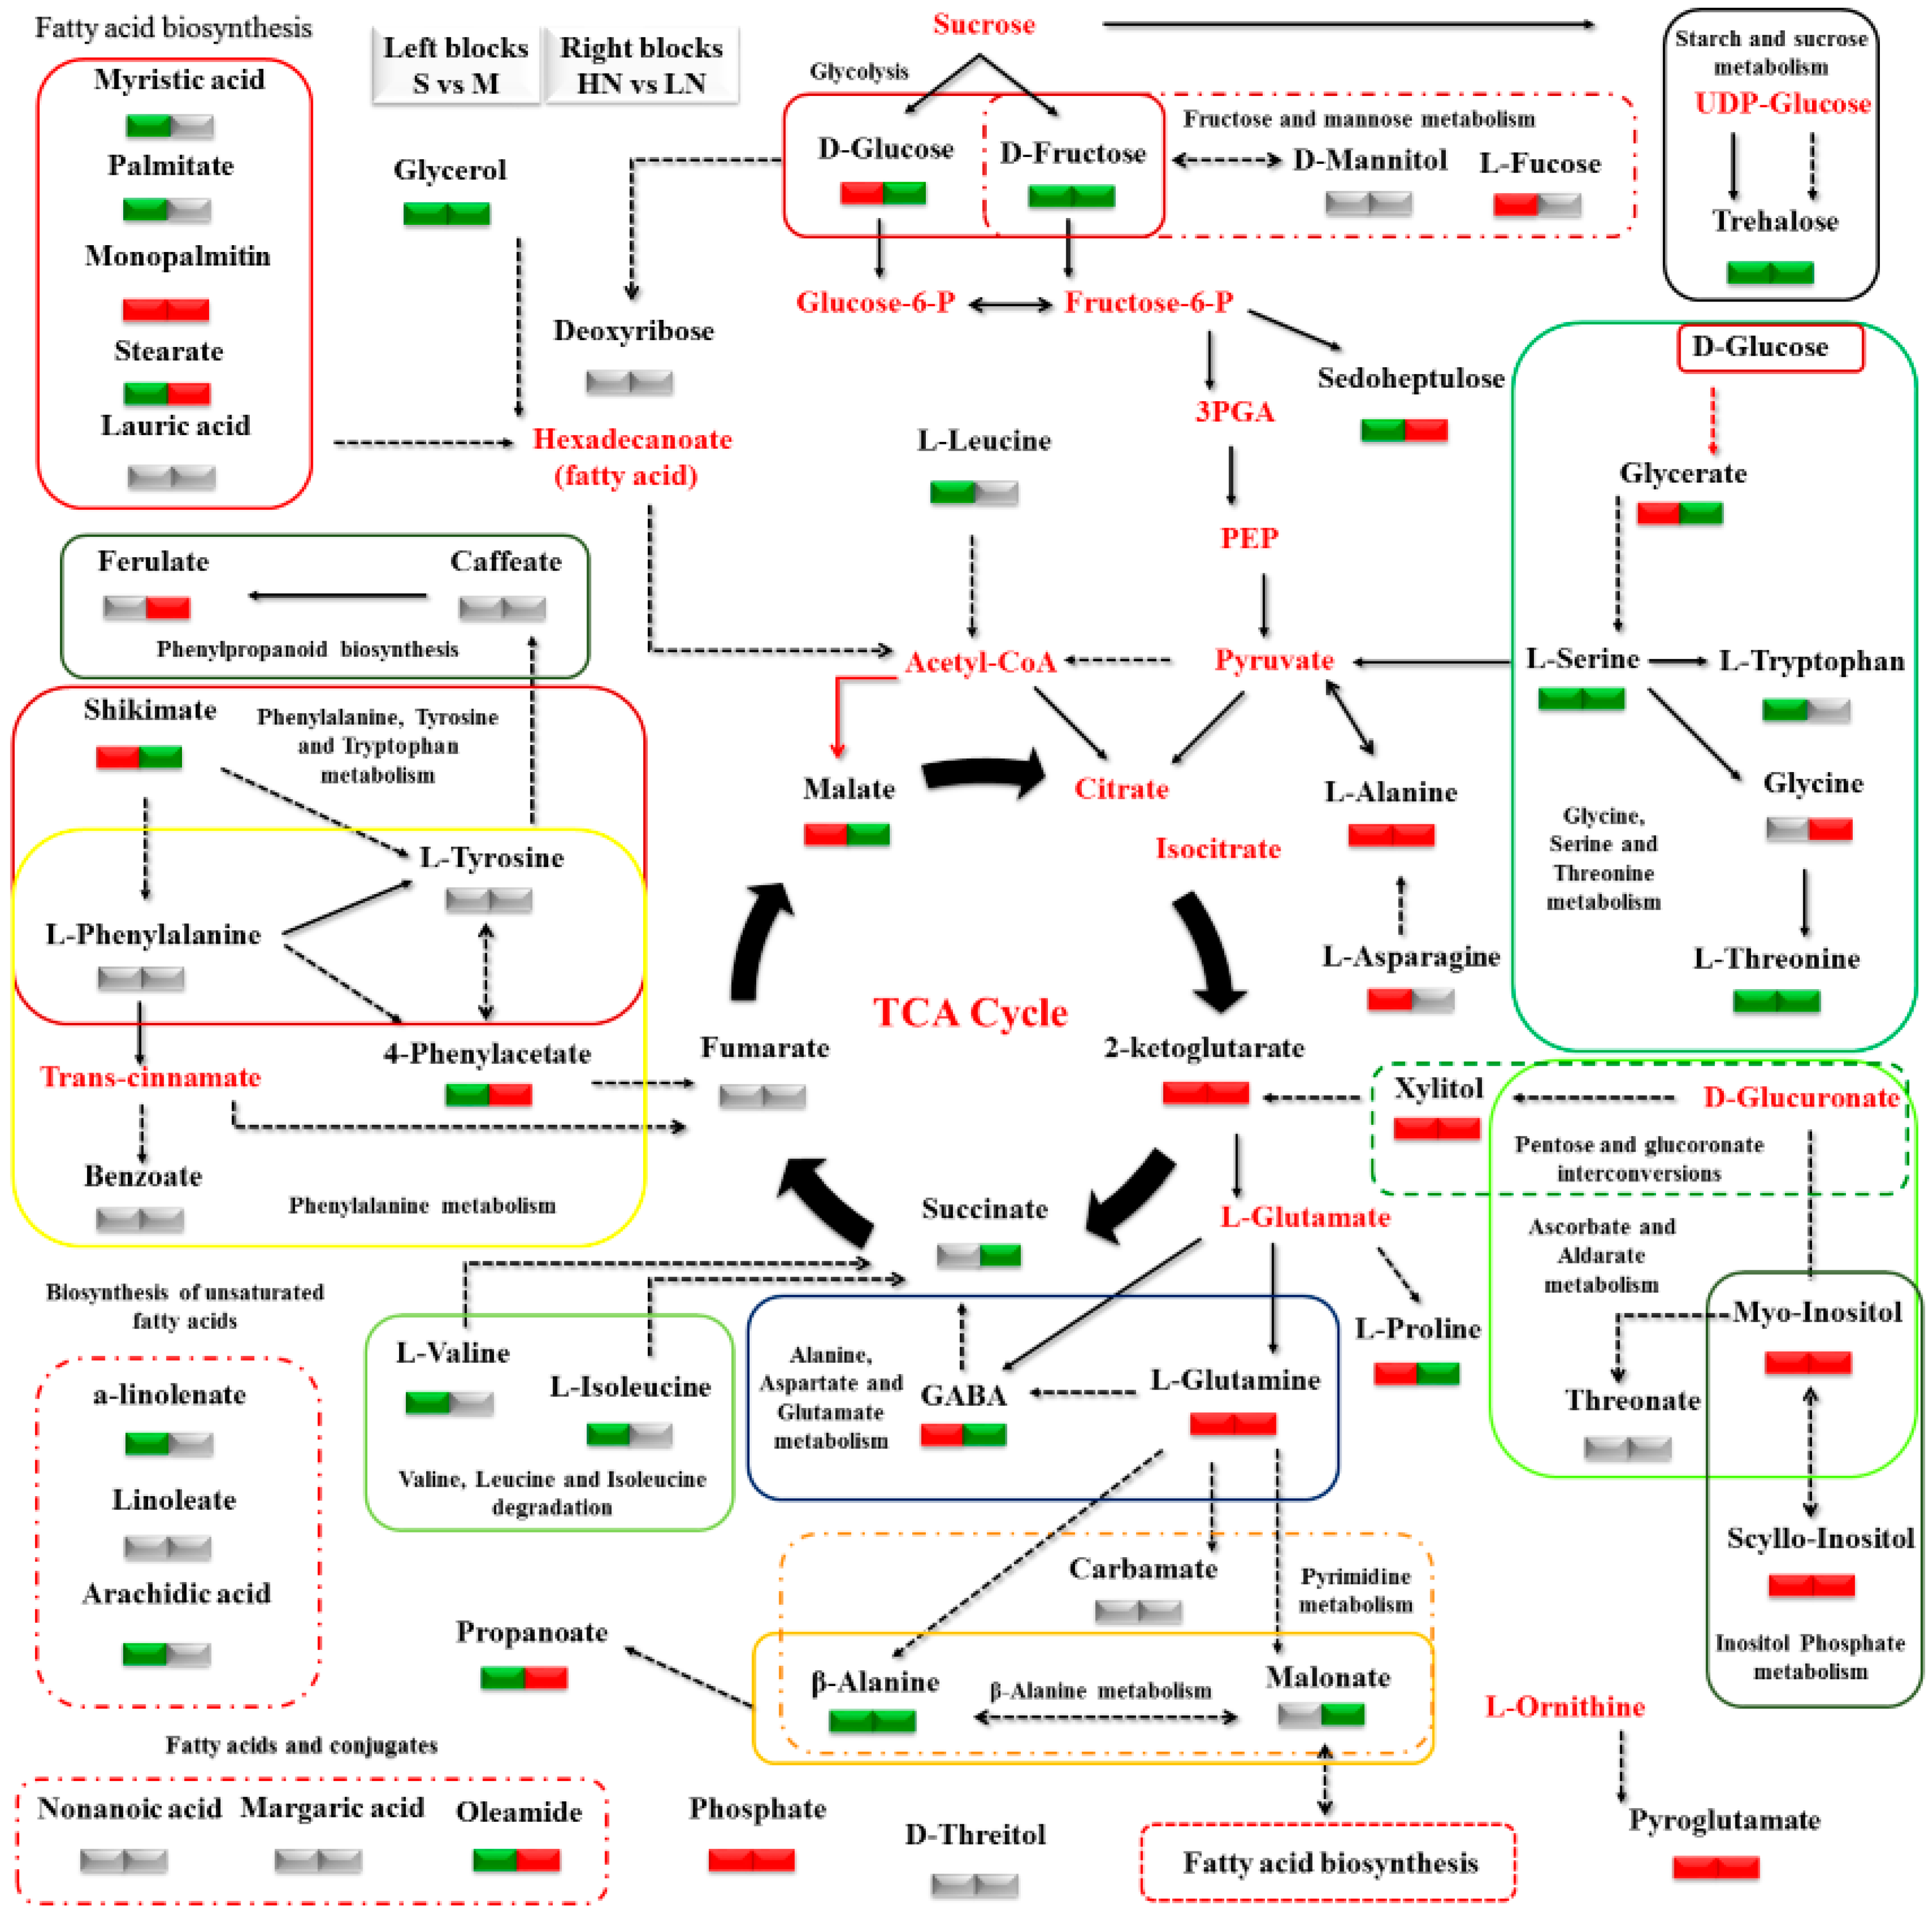
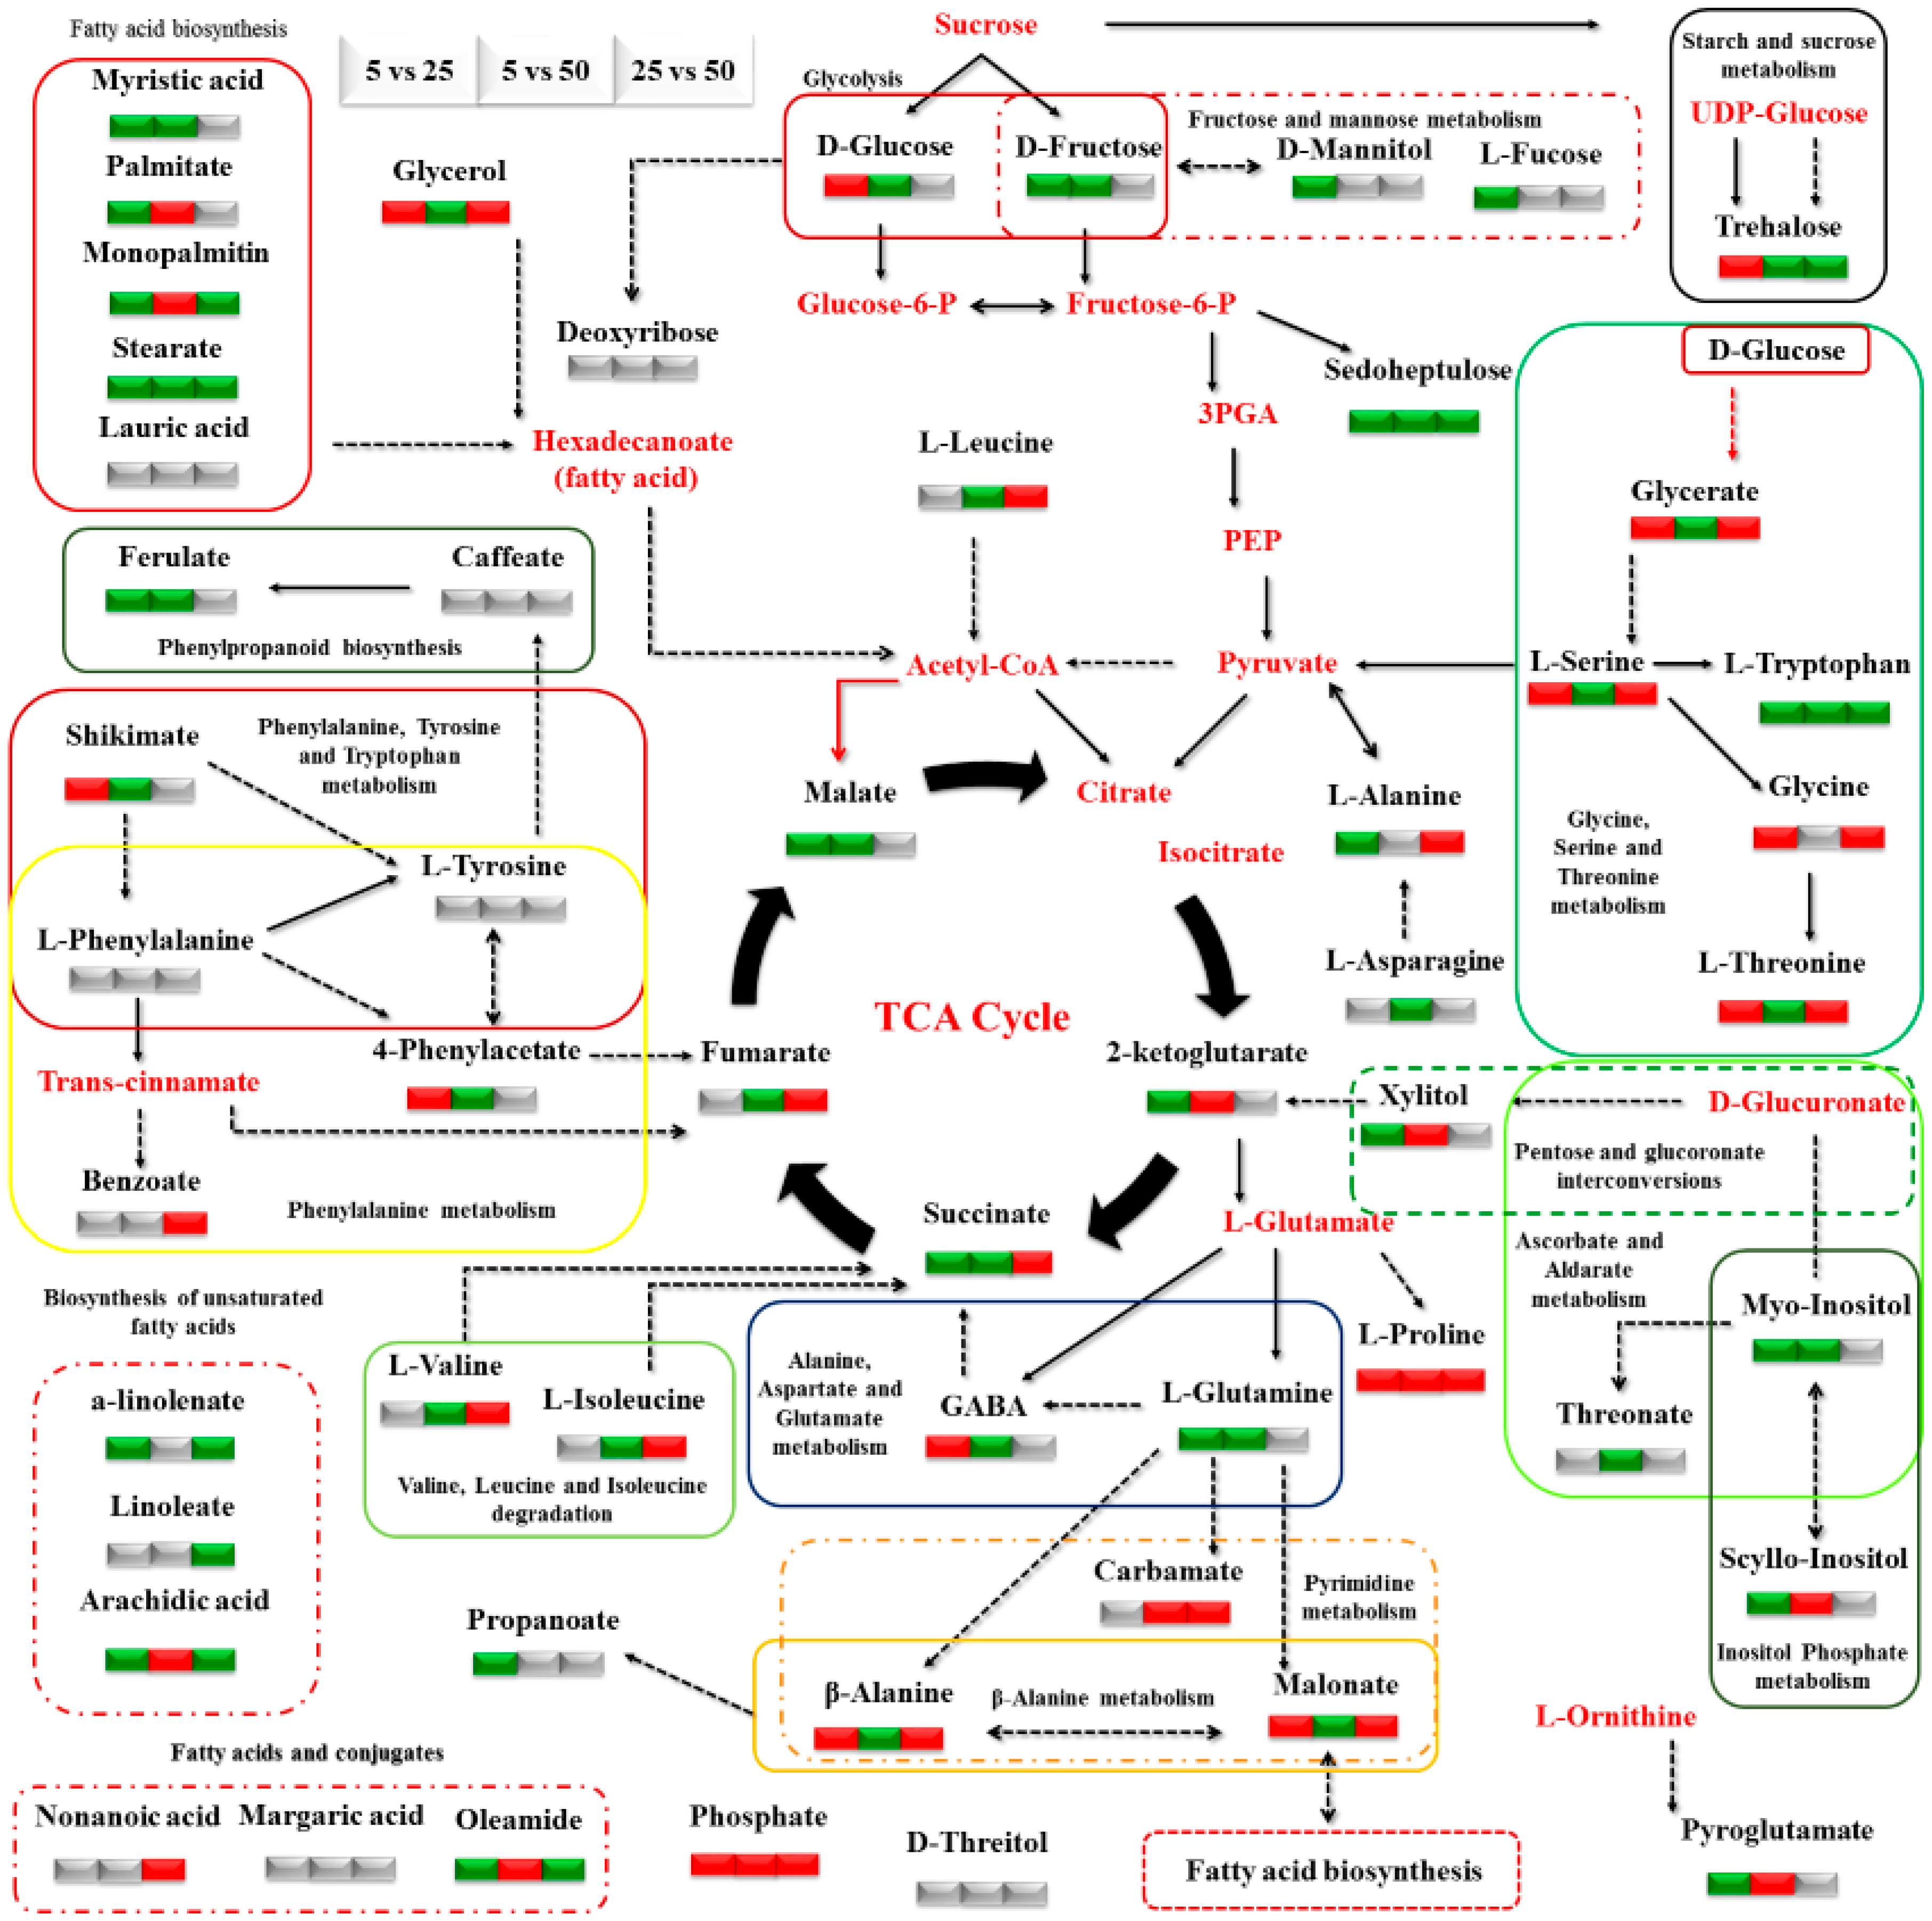
3.4. Impact of N Supply Level and N Source Ratio on Carboxylic Acids, Fatty Acids, and Selected Stamnagathi Metabolites

Carboxylic acids, which are intermediates of the TCA cycle, were substantially affected by the N supply level and N source. The highest effect of the N supply level was observed on glycerate and malate levels. Moreover, increasing the NH4+-N/total-N ratio from 0.05 to 0.50 decreased the levels of both metabolites. Additionally, the levels of malate, shikimate, and succinate decreased in the montane ecotype when the N level was low in the supplied NS (Figure 6). In contrast to malate and succinate, 2-ketoglutarate increased when plants were grown at a total-N concentration of 4 mM in comparison to 16 mM in the supplied NS. Other carboxylic acids such as fumarate, threonate, and carbamate were not affected by the changes in the N level or the ecotype (Figure 6). Fatty acids such as linoleate (LA), which are well known for their benefits on human health, were not significantly affected by the ecotype or the total-N supply level (Figure 6). On the other hand, the biosynthesis of stearate was downregulated in the montane compared to the seaside ecotype and increased when the supply of N was reduced from 16 mM to 4 mM. Additionally, all three comparisons between the different NH4-N/total-N fractions indicate that the increase of the NH4+ fraction in the total N supply decreased the concentration of this fatty acid (Figure 7). Caffeate from the group of phenylpropanoids was not influenced either by the ecotype, the N-supply lever, or the NH4+-N/total-N fraction. Finally, phosphate from the phosphoric acid derivatives group was significantly higher in the montane compared to the coastal ecotype, under low compared to high N supply and with increasing NH4+-N/total-N fractions.

4. Discussion

In the present study, GC/EI/MS metabolomics was employed to acquire insights into the effects of N supply levels and source ratio on the metabolism of stamnagathi. The observed distribution of the recorded metabolite profiles of plants in the OPLS-DA score plots revealed a substantial impact of the genetic backgrounds and treatments on their metabolism. Several of the annotated metabolites were recorded in higher or lower levels, exhibiting a high leverage to the observed discriminations.
Nitrogen is a fundamental element for plant growth and development, being a constituent of chlorophylls, nucleic acids and AA, secondary metabolites, proteins, and phospholipids. AA, in addition to their role as the building blocks for the biosynthesis of proteins and metabolites, are involved in various physiological processes related to plant growth and a plethora of cellular functions [36]. Additionally, they participate in intracellular pH regulation, generation of metabolic energy, or redox power, and many AA play a crucial role in carbohydrate metabolism, signaling, and defense mechanisms, as well as in plant responses to abiotic stresses [36]. Shortage in N supply has a substantial impact on plant metabolism. In tomato and cabbage, insufficient N supply can lead to a decline in the levels of AA and the downregulation of most of the corresponding encoding genes [23,37], while re-supply of N was found to induce their reactivation in barley plants [38]. In the current study, some of the annotated AA were discovered in lower levels in plants grown under reduced N supply (4 mM) compared to those grown under standard N supply (control: 16 mM); GABA and L-serine exhibited a decrease, which is in agreement with previous study on the impact of N starvation on cabbage shoots [37]. The levels of the AA Asn, Val, Ile, and Leu were not substantially altered, while in contrast, those of Gln and Ala increased.
NO3 is reduced to nitrite via nitrate reductase in the cytosol. Nitrite is toxic to plant cells, but it is rapidly reduced to NH4+ in the plastids via nitrite reductase. Then, NH4+ is converted to Gln through the action of glutamine synthase (GS) and glutamine/oxoglutarate aminotransferase (GOGAT). A low inorganic N supply typically reduces the levels of Gln, since it restricts the availability of NH4+, and concomitantly the Gln/Glu ratio [22,39]. The observed decrease of Gln under low-N conditions in the current study is in agreement with previous reports [22,40]. Furthermore, insufficient N supply has been reported to result in starch accumulation and the reduction of the plants’ AA pool, proteins, N-containing compounds, as well as their biomass [41,42,43,44].
Nevertheless, a previous study showed that stamnagathi is highly resilient to low-N supply levels, since a total-N concentration of 4 mM in the supplied NS did not reduce plant biomass compared to a standard concentration of 16 mM [45]. These two contrasting stamnagathi ecotypes, originating from montane and seaside habitats, were used in the experimental design in order to investigate different responses in their metabolism under limited N supply, due to the fact that those ecotypes were grown in a completely different environment. In general, according to our previous study [45], the montane ecotype was superior in terms of growth, tissue nitrate concentration, and antioxidant capacity, whereas the seaside ecotype accumulated more nutrient microcations in leaves. Thus, the montane ecotype could be used as a valuable genetic source in breeding for C. spinosum cultivars with a high antioxidant content and thus a high nutritional value. However, it seems that the reduction in the level of Gln caused by the limited N supply was not adequate to negatively affect the production of biomass. The overall minor fluctuations that were triggered by the different N supply treatments are in agreement with this observation. Glutamate; aspartate; and in some cases, Gln serve as amino donors in the biosynthesis of various AA. There is evidence that NO3-N enhances the expression of Gln 1, (which encodes the cytosolic GS activity-GS1), Gln 2 (gene encoding plastid GS activity-GS2), and Glu in maize and tobacco roots, as well as in tobacco leaves [39]. In stamnagathi, Gln level was negatively affected by the NH4+. It is well documented that high-N levels in spinach result in elevated levels of AA [46], whereas low-N supply substantially decreases the AA pool of plants [38]. Interestingly, resupply of nitrogen to N-starved plants results in complete recovery of the AA pool.
There are several symptoms of NH4+ toxicity when plants are exposed to excessive NH4+ concentrations in the supplied NS. Among others, leaf chlorosis, ion imbalance, hormone deregulation, disorder in pH regulation, dysfunction of net photosynthesis, but mainly substantial fluctuations in metabolite levels will appear (e.g., AA, organic acids, and carbohydrates). Therefore, the N source ratio (NH4-N/total-N) in stamnagathi plants should not exceed a threshold of 0.25, since higher ratios can reduce the pH in the root zone to levels lower than 5. Several studies have already demonstrated the detrimental effects of too high NH4-N/total-N supply ratios on plant metabolism. At the highest NH4-N/total-N supply ratios, the pH showed a decrease in the root zone as indicated by the pH measured in the drainage solution, especially at the highest NH4+ ratio (0.50). This decrease was more markedly when the 0.50 ratio was combined with the highest total N supply (16 mM), since this combination entails an even higher NH4+ supply to the plants. The NH4+-related decrease of pH in the root zone of plants may be a result of both preferential uptake of NH4+ by plant roots and nitrification [45]. Additionally, plants that are supplemented with high N levels show an increase in their AA content, with NH4-supplied plants usually exhibiting the highest concentrations of AA compared to those that were NO3-supplied [47]. Furthermore, in NO3-grown soybean plants, the level of serine, Gln, and Asn were lower in comparison with NH4+-grown plants, while glutamate was not affected by the source N [48].
There is no clear classification of plants to species preferring NO3-N and species preferring NH4+-N. However, most plants preferably take up the NH4+ form as the energy requirement for N assimilation is lower when N enters into the cells as NH4+. On the other hand, most plants do not have efficient mechanisms to detoxify NH4+ and its derivate NH3 into plant cells, as they originate from environments with low soil NH4-N levels [49]. Therefore, NH4+ toxicity can also appear even in plants that are considered NH4+-tolerant species. In the present study, proline levels were increased by high NH4+ supply, irrespective of the NH4-N/total-N (0.25 or 0.50, respectively) levels. On the other hand, the levels of L-serine, L-threonine, glycine, and β-alanine increased when the N source ratio (NH4-N/total-N) was 0.25 and decreased at 0.50. Higher N supply is correlated with increased AA content of leaves. Such increase is normally associated with higher total N concentrations, as well as increased synthesis of proteins and photosynthetic rate, leading to a higher dry matter content. Moreover, total-N concentration in the leaves is not considered a good stress indicator, as the concentrations of compounds containing N in their structure—i.e., AA—can increase under stress conditions without changes in total N levels [50]. The leaf organic N in stamnagathi leaves showed an increase either with an increase from 4 to 16 mM of the total-N level or with the different NH4-N/total-N ratios in the supplied NS. In agreement with this observation, the leaf dry weight of stamnagathi plants treated with a low-N nutrient solution (4 mM) was higher when the NH4-N/total-N ratio increased from 0.05 to 0.25 and 0.50 in the NS [45].
Furthermore, the AA levels in plant tissues have been proposed as a more sensitive indicator of the N status than the total N concentration. As already mentioned above, when plants are exposed to higher NH4+ ratios, symptoms including chlorosis, ionic imbalance, and reduced photosynthetic activity, as well as changes in the concentrations of NH4+, AA, organic acids, and carbohydrates might appear. Moreover, higher NH4+ ratios (NH4-fed plants) lead to a higher accumulation of N-rich AA (Gln and Asn) in plant tissues, and might be a crucial response of plants to NH4+ toxicity. There are also reports indicating that NH4+-fed plants are strongly linked with the assimilation (enhance) of products such as AA, which act as stress signaling molecules, activating metabolic pathways associated with the accumulation of reactive oxygen species (ROS) [51]. Here, the AA pool of plants treated with high NH4+ concentrations declined. In contrast to the highest ratio (0.50), at the medium NH4+ supply (0.25), AA levels either increased or remained unaffected, indicating that a normal supply (not excessive) with NH4+ form (0.5 vs. 0.25 and 0.25 vs. 0.50) can enhance their levels.
The levels of Asn were also decreased when the N source ratio (NH4-N/total-N) was 0.50. Asn, which was first isolated from asparagus, is an AA that plays a key role not only in the synthesis of proteins, but also in the transportation and storage of N within plant tissues. This is attributed to the higher N to C ratio compared to other AA, in combination with its relatively high stability. It is the major metabolite involved in the N transportation in legumes and non-leguminous plants [52]. It is synthesized by Gln and aspartate, as Gln acts as an amino donor, and the glutamine-dependent enzyme of asparagine synthetase (AS) catalyzes this reaction. NH4 can also serve as an AS substrate, especially in the case of maize, and the production of Asn is a product of its detoxification when plants are treated with high ratios of NH4+-N. Elevated levels of carbohydrates and light stimulate the activity of GS and Fd-GOGAT, repressing the activity of AS. As a result, the assimilation of N into Gln and Glu (C-rich compounds) is being promoted. On the other hand, lower energy and light enhance the activity of AS and N assimilation into Asn (N-rich compound), which is capable of transferring N or for its long-term storage.
Carbohydrates are essential for plants, as well as animals and humans, regulating their metabolism and stress resistance [53]. In photosynthetic tissues, inorganic N is considered a fundamental element that allows carbohydrates to be used for plant growth, as well as for photosynthesis. In photosynthetic tissues, N is necessary due to carbohydrate degradation, which provides reducing equivalents, ATP, and C skeletons to enhance N assimilation toward the biosynthesis of metabolites that contain N (e.g., AA and nucleotides). If the C or N supply is altered, a large number of metabolites participate in their metabolism change, while at low light conditions, photosynthesis is inhibited, resulting in decreased carbohydrate content [54]. N assimilation is also affected and the AA pool declines [54]. Furthermore, plants grown under N limitation conditions are capable of accumulating most of the carbohydrates in the form of starch, while sugars and AA are reduced [54]. With respect to the total-N supply, sugars such as a,a-trehalose, fructose (Fru), and glucose (Glu) have been found to exhibit a decrease under low N, while the levels of sugar alcohols such as myo-inositol tend to increase. This observation is in agreement with a previous study on tomato plants that were grown under a low N-supply status [23]. Furthermore, N starvation seems to increase the sugar content in cabbage shoots [37]. The latter is in contrast with our results on low-N treatment when compared to high-N, but is in agreement with those on myo-inositol, which increased. Additionally, in barley, untreated plants exhibited no changes in their carbohydrate content, in contrast to plants from low-N treatments, in which the Fru concentration increased [38].
There is a strong correlation between tissue NO3 and carbohydrate levels. Studies have indicated a correlation between the levels of starch, sugars, and AA when the N supply is modified [41]. In N-starved plants, re-supplementation with NO3 causes alteration in a large number of genes [18,44], such as those involved in NO3 assimilation, as well as genes that are necessary for protein, lipid, and cell wall synthesis. Lack of sugars has an impact on plant growth, inhibits NO3 assimilation, and leads to a breakdown of the nitrate reductase (NIA) transcript and post-translational inactivation of NIA and NIA proteins [55,56]. Re-supply of plants with sugars results in their recovery and a huge number of genes involved in various metabolic functions (e.g., N assimilation, organic acid biosynthesis, cytosolic GS). In the current study, Fru, Glu, and a,a-trehalose were downregulated in plants treated with high NH4+ levels, especially in those fed with the highest NH4-N/total-N ratio of 0.50. In hydroponically grown tomato, increased carbohydrate content in N-starved plants has been recorded [20]. On the contrary, in maize, sucrose was not affected by N-starvation, while Glu and Fru significantly decreased [24]. Sedoheptulose content increased under N deficiency conditions, but decreased under high NH4+.
The reduction of biomass in many plant species has been linked to reduced levels of carbohydrates. The main reasons are the NH4+ assimilation from plants, a process that requires excessive consumption of sugars and energy losses due to the futile transmembrane NH3/NH4+ cycling in root cells [57]. There are only a few species that have adapted their ability to store NH4+ in the vacuoles and/or improved its assimilation without any visible symptoms caused by NH4+ toxicity. In addition, some plants seem to benefit from NH4+ nutrition because they save the energy to convert NO3 into NO2 and then NO2 into NH4+ [51]. According to a previous study [58], the accumulation of carbohydrates in plants supplied with inadequate N is probably associated with the reduction in sink size of the plant, as well as translocation of the carbohydrates in other plant organs. In addition, when the photosynthetic procedure is inhibited due to a lower N supply, plants may recycle the enzymatic N required for secondary metabolism, thereby increasing the concentrations of the secondary metabolites (phenolics and flavonoids). In the current study, the changes in the levels of total phenols as well as flavonoids did not show a consistent pattern in response to the NH4+/total-N ratio [45].
The TCA cycle operates in mitochondria and constitutes the second stage of aerobic respiration in plants. Pyruvate, the final product of glycolysis, is transferred from the cytosol to mitochondria, and via pyruvate dehydrogenase initiates the cycle. Malate, in plant cells compared to animal cells, is another final product of glycolysis—it enters into TCA cycle (intermediate compound) but its concentration depends on other metabolites. For instance, the use of 2-ketoglutarate towards N assimilation in the chloroplasts leads to malate deficiency. Moreover, malate is also synthesized from phosphoenolpyruvate (PEP) carboxylase in cytosol via oxaloacetate and malate dehydrogenase, and its activity depends on light conditions, whereas it is enhanced by N supply. N deficiency has been reported to decrease malate, succinate, and fumarate levels [59]. Analyses revealed that low N supply reduced the levels of malate and succinate, which participate in the TCA cycle, having no impact on fumarate levels while increasing those of 2-ketoglutarate, compared to standard N supply. A previous study [23] revealed that the organic acids of the TCA cycle (e.g., citrate, succinate, fumarate, malate) in tomato plants were decreased under N starvation, with the results presumably suggesting either increased decomposition of Gln and Glu or higher assimilation of 2-ketoglutarate in the roots. Moreover, in cabbage, it has been reported that the levels of the organic acids in the shoots differed in their response under abiotic stress, being dependent on the type of organic acid [37]. The results of this study are in agreement with a previous study [24], which reported the reduction of organic acid synthesis in maize under low N-supply conditions.
However, GABA, an AA which accumulates under biotic and abiotic stresses, is also synthesized by 2-ketoglutarate and it is degraded to succinate in an interaction that bypasses the TCA cycle (GABA shunt). The GABA shunt is correlated with many physiological responses of plants, such as the pH regulation in the cytosol, C fluxes into the TCA cycle, and N metabolism, and acts as an osmoregulator, protector under oxidative stress, and signaling molecule [60]. Furthermore, 2-ketoglutarate is responsible for glutamate composition. In addition, for the synthesis of the minor AA (i.e., aromatic AA, branched and unbranched chain aliphatic AA such as lysine, histidine, arginine, cysteine, methionine, and proline) a variety of C precursors are used as amino donors, including glutamate, aspartate, and, in some cases, Gln [39]. Thus, there is a correlation between organic acids and AA for the reason that the NH2-part (contains N) in the AA skeleton comes from the GS and GOGAT activity, while on the other hand, their C-skeleton either comes from phosphoenolpyruvate (PEP) or from pyruvate, or even from oxaloacetate or 2-ketoglutarate. With respect to total-N supply, plants exhibit increased levels of 2-ketoglutarate when grown under low-N supply, compared to those grown under high-N supply conditions.
Furthermore, the biosynthesis of organic acids participating in the TCA cycle decreased under high NH4+/total-N ratios in the supplied NS. Specifically, malate and succinate decreased at both medium and high NH4-N/total-N ratios, in contrast to 2-ketogutarate, which increased only at the 0.50 ratio. High levels of NO3 have been responsible for increased organic acid concentrations via the expression of phosphoenolpyruvate (PEP) carboxylase [44,46]. According to a previous report [22], the concentration of malate and fumarate is strongly correlated with NO3 assimilation. Due to malate action as a counter-anion, NO3 assimilation mainly leads to the accumulation of malate. Additionally, it was found that malate and especially fumarate significantly decreased under low total-N treatments, mainly when the NO3 concentrations were very low and the AA were accumulated. In general, lower levels of malate and fumarate under low N supply are strongly linked to a low rate of NO3 assimilation. Malate; fumarate; succinate; and, to a lesser extent, a-ketoglutarate decreased under different N conditions, which is in agreement with the responses of stamnagathi shoots to the NO3 concentration. Indeed, a medium and a higher NH4+ ratio diminishes the concentration of NO3 in stamnagathi leaves, especially when plants are treated with the highest NH4-N/total-N ratio of 0.50 [45].
With respect to fatty acid composition, some of the most important fatty acids, i.e., α-linolenate, linoleate, and myristic acid, were not substantially affected by N starvation. Stearate and monopalmitin increased under low N supply levels. In maize plants, it was found that the fatty acid levels decreased under N limitation, especially the medium- to long-chain fatty acids (lauric acid, stearate, palmitate, and myristic acid), while the long-chain fatty acids were upregulated [24].

5. Conclusions

The acquisition of comprehensive information on the primary metabolism and enzymatic activities, which is facilitated nowadays thanks to the advances in –omics technologies, enabled a deeper understanding of the mechanisms that are deployed by the plants to cope with a nutrient limitation. The current study revealed that different N supply levels and NH4+/total-N supply ratios may have a strong impact on the levels of AA, carbohydrates, and carboxylic acids that participate in the TCA cycle. An increase of the NH4-N/total-N supply ratio from 0.05 to 0.25 increased the AA levels, while a further increase to 0.50 resulted in the decrease of the AA pool. However, a large number of the major AA (Gln, Ala, Gly, Ser, Asn, etc.) were either increased or decreased when plants were exposed to different N supply and form, indicating that plants have adopted mechanisms that, in some cases, are different than those of the commonly cultivated plants.
Carbohydrates are strongly linked with the biomass and the production of other secondary metabolites, including flavonoids and total phenols. Under low N conditions, plants are used to accumulate carbohydrates, but in stamnagathi plants, most of the carbohydrates in the glycolysis pathway were decreased. Furthermore, malate and fumarate, from the group of organic acids, also followed a decreasing trend under conditions of reduced N supply, especially malate, which is strongly linked to the NO3 assimilation. On the other hand, the levels 2-ketoglutarate were increased by both low-N supply and high NH4-N/total-N ratio (0.50), presumably because under low total-N and NH4-N supply they were consumed in the production of other AA.

Supplementary Materials

The following are available online at https://www.mdpi.com/2073-4395/10/7/952/s1, Table S1: The EC; pH; and the concentrations of K+, Ca2+, Mg2+, NH4+, NO3, H2PO4, and SO42− in the six different nutrient solution treatments that were applied to the plants by combining two levels of total-N supply (4 or 16 mmol L−1, denoted as 4TN and 16TN, respectively) and NH4/total-N fraction (0.05, 0.25, and 0.50) in the nutrient solution. Dataset S1: Identified metabolites and their biochemical and metabolic properties, drawing on information retrieved from NIST, PubChem, KEGG, and the Golm Metabolome Databases. Figure S1: Representative GC/EI/MS metabolite profiles of stamnagathi plants (Chicorium spinosum L.) of the montane (a) and seaside (b) ecotypes grown under low total-N supply level and 50% NH4+ to total-N ratio ((1) L-proline, (2) L-isoleucine, (3) malonate, (4) L-valine, (5) β-alanine, (6) phosphate, (7) glycerol, (8) L-threonine, (9) succinate, (11) aspartate, (12) malate). Figure S2: Fluctuations of the stamnagathi metabolic composition (chemical groups) following treatments with total N concentration (4 or 16 mmol L−1, denoted as Low-N and High-N, respectively) in the nutrient solution supplied to the montane ecotype of stamnagathi grown in perlite bags and the seed origin (montane vs. seaside) of stamnagathi plants grown under a total-N concentration of 4 mmol L−1. The y-axis corresponds to instances, since each metabolite can be involved in multiple pathways. The first bar (red) corresponds to metabolites whose concentration increased in response to the treatment, the second (green) to those that decreased, and the third (gray) to those that were not substantially altered. The coding system of KEGG was adopted. Figure S3: Fluctuations of the stamnagathi metabolic composition (chemical groups) following treatments with NH4/total-N fraction (5% vs. 25%, 5% vs. 50%, and 25% vs. 50%) in the nutrient solution supplied to the montane ecotype of stamnagathi grown in perlite bags. The y-axis corresponds to instances, since each metabolite can be involved in multiple pathways. The first bar (red) corresponds to metabolites whose concentration increased in response to the treatment, the second (green) to those that decreased, and the third (gray) to those that were not substantially altered. The coding system of KEGG was adopted.

Author Contributions

D.S. conceived and designed the experiments. M.C., G.N., and K.A.A. performed the experiments and the analyses. M.C., G.N., and K.A.A. analyzed the data. M.C., K.A.A., G.N., and D.S. wrote and reviewed the paper. All authors have read and approved the manuscript.

Funding

M.C. was supported by a scholarship from Bodossakis Foundation for her Ph.D studies.

Conflicts of Interest

The authors declare no conflict of interest.

References

  1. Kusano, M.; Fukushima, A.; Redestig, H.; Saito, K. Metabolomic approaches toward understanding nitrogen metabolism in plants. J. Exp. Bot. 2011, 62, 1439–1453. [Google Scholar] [CrossRef]
  2. von Wiren, N.; Gazzarrini, S.; Gojon, A.; Frommer, W.B. The molecular physiology of ammonium uptake and retrieval. Curr. Opin. Plant Biol. 2000, 3, 254–261. [Google Scholar] [CrossRef]
  3. Santamaria, P.; Elia, A.; Serio, F.; Todaro, E. A survey of nitrate and oxalate content in fresh vegetables. J. Sci. Food Agric. 1999, 79, 1882–1888. [Google Scholar] [CrossRef]
  4. Bryan, N.S.; Alexander, D.D.; Coughlin, J.R.; Milkowski, A.L.; Boffetta, P. Ingested nitrate and nitrite and stomach cancer risk: An updated review. Food Chem. Toxicol. 2012, 50, 3646–3665. [Google Scholar] [CrossRef] [PubMed]
  5. Vidal, E.A.; Gutierrez, R.A. A systems view of nitrogen nutrient and metabolite responses in Arabidopsis. Curr. Opin. Plant Biol. 2008, 11, 521–529. [Google Scholar] [CrossRef] [PubMed]
  6. Krouk, G.; Crawford, N.M.; Coruzzi, G.M.; Tsay, Y.F. Nitrate signaling: Adaptation to fluctuating environments. Curr. Opin. Plant Biol. 2010, 13, 266–273. [Google Scholar] [CrossRef]
  7. Alvarez, J.M.; Vidal, E.A.; Gutierrez, R.A. Integration of local and systemic signaling pathways for plant N responses. Curr. Opin. Plant Biol. 2012, 15, 185–191. [Google Scholar] [CrossRef] [PubMed]
  8. Rahayu, Y.S.; Walch-Liu, P.; Neumann, G.; Romheld, V.; von Wiren, N.; Bangerth, F. Root-derived cytokinins as long-distance signals for NO3-Induced stimulation of leaf growth. J. Exp. Bot. 2005, 56, 1143–1152. [Google Scholar] [CrossRef] [PubMed]
  9. Marin, I.C.; Loef, I.; Bartetzko, L.; Searle, I.; Coupland, G.; Stitt, M.; Osuna, D. Nitrate regulates floral induction in Arabidopsis, acting independently of light, gibberellin and autonomous pathways. Planta 2011, 233, 539–552. [Google Scholar] [CrossRef] [PubMed] [Green Version]
  10. Alboresi, A.; Gestin, C.; Leydecker, M.T.; Bedu, M.; Meyer, C.; Truong, H.N. Nitrate, a signal relieving seed dormancy in Arabidopsis. Plant Cell Environ. 2005, 28, 500–512. [Google Scholar] [CrossRef] [PubMed]
  11. Bowsher, C.G.; Hucklesby, D.P.; Emes, M.J. Nitrate reduction and carbohydrate-metabolism in plastids purified from roots of Pisum sativum L. Planta 1989, 177, 359–366. [Google Scholar] [CrossRef]
  12. Bowsher, C.G.; Boulton, E.L.; Rose, J.; Nayagam, S.; Emes, M.J. Reductant for glutamate synthase is generated by the oxidative pentose-phosphate pathway in non-photosynthetic root plastids. Plant J. 1992, 2, 893–898. [Google Scholar] [CrossRef]
  13. Foyer, C.H.; Valadier, M.H.; Migge, A.; Becker, T.W. Drought induced effects on nitrate reductase activity and mRNA and on the coordination of nitrogen and carbon metabolism in maize leaves. Plant Physiol. 1998, 117, 283–292. [Google Scholar] [CrossRef] [PubMed] [Green Version]
  14. Bowsher, C.G.; Emes, M.J.; Cammack, R.; Hucklesby, D.P. Purification and properties of nitrite reductase from roots of pea (Pisum sativum cv. Meteor). Planta 1988, 175, 334–340. [Google Scholar] [CrossRef] [PubMed]
  15. Hoff, T.; Truong, H.N.; Caboche, M. The use of mutants and transgenic plants to study nitrate assimilation. Plant Cell Environ. 1994, 17, 489–506. [Google Scholar] [CrossRef]
  16. Ferrario-Mery, S.; Hodges, M.; Hirel, B.; Foyer, C.H. Photorespiration-dependent increases in phosphoenolpyruvate carboxylase, isocitrate dehydrogenase and glutamate dehydrogenase in transformed tobacco plants deficient in ferredoxin-dependent glutamine-alpha-ketoglutarate aminotransferase. Planta 2002, 214, 877–886. [Google Scholar] [CrossRef]
  17. Lancien, M.; Martin, M.; Hsieh, M.H.; Leustek, T.; Goodman, H.; Coruzzi, G.M. Arabidopsis glt1-T mutant defines a role of NADH-GOGAT in the non-photorespiratory ammonium assimilatory pathway. Plant J. 2002, 29, 347–358. [Google Scholar] [CrossRef]
  18. Stitt, M. Nitrate regulation of metabolism and growth. Curr. Opin. Plant Biol. 1999, 2, 178–186. [Google Scholar] [CrossRef]
  19. Alseekh, S.; Bermudez, L.; De Haro, L.A.; Fernie, A.R.; Carrari, F. Crop metabolomics: From diagnostics to assisted breeding. Metabolomics 2018, 14, 148. [Google Scholar] [CrossRef] [Green Version]
  20. Urbanczyk-Wochniak, E.; Fernie, A.R. Metabolic profiling reveals altered nitrogen nutrient regimes have diverse effects on the metabolism of hydroponically-grown tomato (Solanum lycopersicum) plants. J. Exp. Bot. 2005, 56, 309–321. [Google Scholar] [CrossRef] [Green Version]
  21. Fernie, A.R. Metabolome characterization in plant system analysis. Funct. Plant Biol. 2003, 30, 111–120. [Google Scholar] [CrossRef]
  22. Tschoep, H.; Gibon, Y.; Carillo, P.; Armengaud, P.; Szecowka, M.; Nunes-Nesi, A.; Fernie, A.R.; Koehl, K.; Stitt, M. Adjustment of growth and central metabolism to a mild but sustained nitrogen-limitation in Arabidopsis. Plant Cell Environ. 2009, 32, 300–318. [Google Scholar] [CrossRef] [PubMed]
  23. Sung, J.; Lee, S.; Lee, Y.; Ha, S.; Song, B.; Kim, T.; Waters, B.M.; Krishnan, H.B. Metabolomic profiling from leaves and roots of tomato (Solanum lycopersicum L.) plants grown under nitrogen, phosphorus or potassium-deficient condition. Plant Sci. 2015, 241, 55–64. [Google Scholar] [CrossRef] [PubMed]
  24. Schlüter, U.; Masher, M.; Colmsee, C.; Scholz, U.; Bräutigam, A.; Fahnenstich, H.; Sonnewald, U. Maize source leaf adaptation to nitrogen deficiency affects not only nitrogen and carbon metabolism but also control phosphate homeostasis. Plant Physiol. 2012, 160, 1384–1406. [Google Scholar] [CrossRef] [Green Version]
  25. Amiour, N.; Imbaud, S.; Clement, G.; Agier, N.; Zivy, M.; Valot, B.; Balliau, T.; Armengaud, P.; Quillere, I.; Canas, R.; et al. The use of metabolomics integrated with transcriptomic and proteomic studies for identifying key steps involved in the control of nitrogen metabolism in crops such as maize. J. Exp. Bot. 2012, 63, 5017–5033. [Google Scholar] [CrossRef] [PubMed] [Green Version]
  26. Chatzigianni, M.; Ntatsi, G.; Theodorou, M.; Stamatakis, A.; Livieratos, I.; Rouphael, Y.; Savvas, D. Functional Quality, Mineral Composition and Biomass Production in Hydroponic Spiny Chicory (Cichorium spinosum L.) Are Modulated Interactively by Ecotype, Salinity and Nitrogen Supply. Front. Plant Sci. 2019, 10, 1040. [Google Scholar] [CrossRef] [PubMed] [Green Version]
  27. Zeghichi, S.; Kallithraka, S.; Simopoulos, A.P. Nutritional composition of Molokhia (Corchorus olitorius) and stamnagathi (Cichorium spinosum). World Rev. Nutr. Diet. 2003, 91, 1–21. [Google Scholar] [PubMed]
  28. Petropoulos, S.A.; Fernandes, A.; Ntatsi, G.; Levizou, E.; Barros, L.; Ferreira, I.C.F.R. Nutritional profile and chemical composition of Cichorium spinosum ecotypes. LWT Food Sci. Technol. 2016, 73, 95–101. [Google Scholar] [CrossRef]
  29. Ntatsi, G.; Aliferis, K.A.; Rouphael, Y.; Napolitano, F.; Makris, K.; Kalala, G.; Katopodis, G.; Savvas, D. Salinity source alters mineral composition and metabolism of Cichorium spinosum. Environ. Exp. Bot. 2017, 141, 113–123. [Google Scholar] [CrossRef]
  30. Savvas, D.; Adamidis, C. Automated management of nutrient solutions based on target electrical conductivity, pH, and nutrient concentration ratios. J. Plant Nutr. 1999, 22, 1415–1432. [Google Scholar] [CrossRef]
  31. Kostopoulou, S.; Ntatsi, G.; Arapis, G.; Aliferis, K.A. Assessment of the effects of metribuzin, glyphosate, and their mixtures on the metabolism of the model plant Lemna minor L. applying metabolomics. Chemosphere 2020, 239, 124582. [Google Scholar] [CrossRef] [PubMed]
  32. Karamanou, D.A.; Aliferis, K.A. The yeast (Saccharomyces cerevisiae) YCF1 vacuole transporter: Evidence on its implication into the yeast resistance to flusilazole as revealed by GC/EI/MS metabolomics. Pestic. Biochem. Physiol. 2020, (in press). [Google Scholar] [CrossRef]
  33. Tsugawa, H.; Cajka, T.; Kind, T.; Ma, Y.; Higgins, B.; Ikeda, K.; Kanazawa, M.; VanderGheynst, J.; Fiehn, O.; Arita, M. MS-DIAL: Data-independent MS/MS deconvolution for comprehensive metabolome analysis. Nat. Methods 2015, 12, 523–526. [Google Scholar] [CrossRef]
  34. Babicki, S.; Arndt, D.; Marcu, A.; Liang, Y.; Grant, J.R.; Maciejewski, A.; Wishart, D.S. Heatmapper: Web-enabled heat mapping for all. Nucleic Acids Res. 2016, 44, W147–W153. [Google Scholar] [CrossRef]
  35. Aliferis, K.A.; Faubert, D.; Jabaji, S. A metabolic profiling strategy for the dissection of plant defense against fungal pathogens. PLoS ONE 2014, 9, e111930. [Google Scholar] [CrossRef] [Green Version]
  36. Hildebrandt, T.M.; Nunes Nesi, A.; Araújo, W.L.; Braun, H.P. Amino acid catabolism in plants. Mol. Plant 2015, 8, 1563–1579. [Google Scholar] [CrossRef] [PubMed] [Green Version]
  37. Sung, J.; Yun, H.; Back, S.; Fernie, A.R.; Kim, Y.X.; Lee, Y.; Lee, S.; Lee, D.; Kim, J. Changes in mineral nutrient concentrations and C-N metabolism in cabbage shoots and roots following macronutrient deficiency. J. Plant Nutr. Soil Sci. 2018, 181, 777–786. [Google Scholar] [CrossRef]
  38. Fataftah, N.; Mohr, C.; Hajirezaei, M.R.; von Wirén, N.; Humbeck, K. Changes in nitrogen availability lead to a reprogramming of pyruvate metabolism. Plant Biol. 2018, 18, 77. [Google Scholar] [CrossRef] [PubMed]
  39. Stitt, M.; Krapp, A. The interaction between elevated carbon dioxide and nitrogen nutrition: The physiological and molecular background. Plant Cell Environ. 1999, 22, 583–621. [Google Scholar] [CrossRef]
  40. Amtmann, A.; Armengaud, P. Effects of N, P, K and S on metabolism: New knowledge gained from multi-level analysis. Curr. Opin. Plant Biol. 2009, 12, 275–283. [Google Scholar] [CrossRef]
  41. Scheible, W.R.; Gonzalez-Fontes, A.; Lauerer, M.; Mueller-Roeber, B.; Caboche, M.; Stitt, M. Nitrate acts as a signal to induce organic acid metabolism and repress starch metabolism in tobacco. Plant Cell 1997, 9, 783–798. [Google Scholar] [CrossRef] [PubMed]
  42. Scheible, W.R.; Lauerer, M.; Schulze, E.D.; Caboche, M.; Stitt, M. Accumulation of nitrate in the shoot acts as a signal to regulate shoot-root allocation in tobacco. Plant J. 1997, 11, 671–691. [Google Scholar] [CrossRef] [Green Version]
  43. Wang, R.C.; Okamoto, M.; Xing, X.J.; Crawford, N.M. Microarray analysis of the nitrate response in Arabidopsis roots and shoots reveals over 1000 rapidly responding genes and new linkages to glucose, trehalose-6-phosphate, iron, and sulfate metabolism. Plant Physiol. 2003, 132, 556–567. [Google Scholar] [CrossRef] [Green Version]
  44. Scheible, W.R.; Morcuende, R.; Czechowski, T.; Fritz, C.; Osuna, D.; Palacios-Rojas, N.; Schindelasch, D.; Thimm, O.; Udvardi, M.K.; Stitt, M. Genome-wide reprogramming of primary and secondary metabolism, protein synthesis, cellular growth processes, and the regulatory infrastructure of Arabidopsis in response to nitrogen. Plant Physiol. 2004, 136, 2483–2499. [Google Scholar] [CrossRef] [PubMed] [Green Version]
  45. Chatzigianni, M.; Alkhaled, B.; Livieratos, I.; Stamatakis, A.; Ntatsi, G.; Savvas, D. Impact of nitrogen source and supply level on growth, yield and nutritional value of two contrasting ecotypes of Cichorium spinosum L. grown hydroponically. J. Sci. Food Agric. 2018, 98, 1615–1624. [Google Scholar] [CrossRef] [PubMed]
  46. Okazaki, K.; Oka, N.; Shinano, T.; Osaki, M.; Takebe, M. Differences in the metabolite profiles of spinach (Spinacia oleracea L.) leaf in different concentrations of nitrate in the culture solution. Plant Cell Physiol. 2008, 49, 170–177. [Google Scholar] [CrossRef] [Green Version]
  47. Neuberg, M.; Pavlíková, D.; Pavlík, M.; Balík, J. The effect of different nitrogen nutrition on proline and asparagine content in plant. Plant Soil Environ. 2010, 56, 305–311. [Google Scholar] [CrossRef]
  48. Barneix, A.J.; Causin, H.F. The central role of amino acids on nitrogen utilization and plant growth. J. Plant Physiol. 1996, 149, 358–362. [Google Scholar]
  49. Raab, T.K.; Terry, N. Nitrogen source regulation of growth and photosynthesis in Beta vulgaris L. Plant Physiol. 1994, 105, 1159–1166. [Google Scholar] [CrossRef] [Green Version]
  50. de Oliveira Ferreira, E.V.; Novais, R.F.; Dubay, G.R.; Pereira, G.L.; Araujo, W.L.; Jackson, R.B. Nitrogen supply affects root and shoot amino acid composition in Eucalyptus clones. Aust. J. Crop Sci. 2016, 10, 280–290. [Google Scholar]
  51. Miranda, R.S.; Gomes-Filho, E.; Prisco, J.T.; Alvarez-Pizarro, J.C. Ammonium improves tolerance to salinity stress in Sorghum bicolor plants. Plant Growth Regul. 2016, 78, 121–131. [Google Scholar] [CrossRef]
  52. Lam, H.M.; Coschigano, K.T.; Oliveira, I.C.; MeloOliveira, R.; Coruzzi, G.M. The molecular-genetics of nitrogen assimilation into amino acids in higher plants. Annu. Rev. Plant Biol. 1996, 47, 569–593. [Google Scholar] [CrossRef]
  53. Zhang, Q.; Song, X.; Bartels, D. Sugar metabolism in the desiccation tolerant grass Oropetium thomaeum in response to environmental stresses. Plant Sci. 2018, 270, 30–36. [Google Scholar] [CrossRef] [PubMed]
  54. Fritz, C.; Palacios-Rojas, N.; Feil, R.; Stitt, M. Regulation of secondary metabolism by the carbon-nitrogen status in tobacco: Nitrate inhibits large sectors of phenylpropanoid metabolism. Plant J. 2006b, 46, 533–548. [Google Scholar] [CrossRef] [PubMed]
  55. Matt, P.; Schurr, U.; Krapp, A.; Stitt, M. Growth of tobacco in short day conditions leads to high starch, low sugars, altered diurnal changes of the NIA transcript and low nitrate reductase activity, and an inhibition of amino acid synthesis. Planta 1998, 207, 27–41. [Google Scholar] [CrossRef] [PubMed]
  56. Klein, D.; Morcuende, R.; Stitt, M.; Krapp, A. Regulation of nitrate reductase expression in leaves by nitrate and nitrogen metabolism is completely overridden when sugars fall below a critical level. Plant Cell Environ. 2000, 23, 863–871. [Google Scholar] [CrossRef]
  57. Sarasketa, A.; González-Moro, M.B.; González-Murua, C.; Marino, D. Nitrogen source and external medium pH interaction differentially affects root and shoot metabolism in Arabidopsis. Front Plant Sci. 2016, 7, 29. [Google Scholar] [CrossRef] [Green Version]
  58. Ibrahim, M.H.; Jaafar, H.Z.E.; Rahmat, A.; Rahman, Z.A. The relationship between phenolics and flavonoids production with total non structural carbohydrate and photosynthetic rate in Labisia pumila Benth. under high CO2 and nitrogen fertilization. Molecules 2010, 16, 162–174. [Google Scholar] [CrossRef] [Green Version]
  59. Obata, A.; Fernie, R. The use of metabolomics to dissect plant responses to abiotic stresses. Cell. Mol. Life Sci. 2012, 69, 3225–3243. [Google Scholar] [CrossRef] [Green Version]
  60. Bouché, N.; Fromm, H. GABA in plants: Just a metabolite? Trends Plant Sci. 2004, 9, 110–115. [Google Scholar] [CrossRef]
Figure 1. Pipeline for the dissection of the effects of two different N supply levels—low at 4 mmol L−1 and high at 16 mmol L−1—combined with three different NH4/total-N fractions (5%, 25%, and 50%, respectively) on the metabolism of Cichorium spinosum L. plants, employing gas chromatography–electron impact–mass spectrometry (GC/EI/MS) metabolomics. Experiments were performed in an unheated glasshouse on bags using perlite as the substrate. In total, 12 biological replications for each ecotype were performed per treatment, every 3 of which were pooled to provide a pooled sample. Four pooled samples and one quality control sample (QC) were analyzed per treatment. Sampling was performed at the second harvest following treatments.
Agronomy 10 00952 g001
Figure 2. Orthogonal partial least squares-discriminant analysis (OPLS-DA) score plot for the recorded GC/EI/MS profiles of Cichorium spinosum (stamnagathi) leaves (a) for all of the examined treatments. (b) Pairwise comparison between the montane (M) and seaside (S) grown under low-N supply level. (c) Stamnagathi plants of the montane and seaside ecotype treated with either 4 or 16 mmol L−1 (denoted as Low-N and High-N, respectively). The following pairwise comparisons were performed: (d) S vs. M under low-N supply and medium NH4/total-N fraction (25%), (e) High-N vs. Low-N in the montane ecotype grown under medium NH4/total-N fraction (25%), (f) 5% vs. 25% NH4/total-N fraction under high-N conditions for the montane ecotype, (g) 5% vs. 50% NH4/total-N fraction under high-N conditions for the montane ecotype, and (h) 25% vs. 50% NH4/total-N fraction under high-N conditions for the montane ecotype. The ellipse represents the Hotelling’s T2 with 95% confidence interval. In total, 12 biological replications were performed per treatment, every 3 of which were pooled to provide a pooled sample. Four pooled samples and one quality control sample were analyzed per treatment (PC: principal component).
Agronomy 10 00952 g002
Figure 3. Heat map for the overview of fluctuations in the recorded Cichorium spinosum L. GC/EI/MS leaf metabolome following treatments. Twelve treatments were performed: two contrasting ecotypes; two different total-N levels in the supplied NS, 4 mM as Low-N and 16 mM as High-N; and three NH4+/total-N ratios—5%, 25%, and 50%, respectively. Red blocks indicate metabolites that were detected at higher levels, while blue blocks represent the metabolites that were detected at lower levels following treatments. The Heatmapper software [34] was used. Each Heatmap block represents the average value of four replicates.
Agronomy 10 00952 g003
Figure 4. Fluctuations of the stamnagathi metabolic functions following treatments with total-N concentration (4 or 16 mmol L−1, denoted as Low-N and High-N, respectively) upon different seed origin (montane vs. seaside) of stamnagathi plants grown under a total-N concentration of 4 mmol L−1 (A) and in the nutrient solution supplied to the montane ecotype of stamnagathi grown in perlite bags (B). The y-axis corresponds to instances, since each metabolite can be involved in multiple pathways. The first bar (red) corresponds to metabolites whose concentration increased in response to the treatment, the second (green) to those decreased, and the third (gray) to those that were not substantially altered. The coding system of KEGG (Kyoto Encyclopedia of Genes and Genomes) as adopted.
Agronomy 10 00952 g004
Figure 5. Fluctuations of the stamnagathi metabolic functions following treatments with NH4/total-N fraction (5% vs. 25% (A), 5% vs. 50% (B), and 25% vs. 50% (C) in the nutrient solution supplied to the montane ecotype of stamnagathi grown in perlite bags. The y-axis corresponds to instances, since each metabolite can be involved in multiple pathways. The first bar (red) corresponds to metabolites whose concentration increased in response to the treatment, the second (green) to those decreased, and the third (gray) to those that were not substantially altered. The coding system of KEGG was adopted.
Agronomy 10 00952 g005
Figure 6. Fluctuation of Cichorium spinosum metabolite levels between the seaside (S) and montane (M) ecotypes (first block below metabolites) that were grown under low-N and 0.25 NH4+/total-N supply level and between plants of the montane ecotype grown in perlite bags. The figure also shows the impact of the two different total-N supply levels in the montane ecotype grown under medium ratio NH4+/total-N on its metabolic response (right block below metabolites). The metabolites in bold red font indicate the undetected metabolites. Red color corresponds to metabolites whose relative composition increased in the montane (M) ecotype or plants grown under low-N supply, whereas green applies to metabolites that decreased. Gray color blocks correspond to metabolites whose levels were not substantially altered (first block below metabolites). Data were retrieved from the KEGG database (http://www.genome.jp/kegg). Solid arrows correspond to subsequent steps of a biosynthetic pathway, whereas dashed arrows correspond to multi-step links. TCA: tricarboxylic acid cycle; PEP: phosphoenolpyruvate; GABA: γ-aminobutyric acid; UDP-Glucose: Uridine diphosphate glucose; 3PGA: 3-Phosphoglycerate.
Agronomy 10 00952 g006
Figure 7. Fluctuation of Cichorium spinosum montane ecotype plants’ metabolite levels followed treatments with three different NH4+/total-N ratios. The first block (from left to right) below metabolites corresponds to the comparison between the lowest and the medium NH4+/total-N ratios, the middle block to the one between the lowest and the highest NH4+/total-N ratios, and the third block to the comparison between the medium and the highest NH4+/total-N ratios. The metabolites in bold red font indicate the undetected metabolites. Red color bars correspond to metabolites whose relative composition increased in the montane (M) ecotype, whereas green bars correspond to metabolites that decreased. Gray color corresponds to metabolites whose levels were not substantially altered. Data were retrieved from the KEGG database (http://www.genome.jp/kegg). Solid arrows correspond to subsequent steps of a biosynthetic pathway, whereas dashed arrows correspond to multi-step links.
Agronomy 10 00952 g007

