The Effect on Tytanit Foliar Application on the Yield and Nutritional Value of Festulolium braunii


Abstract
1. Introduction
2. Material and Methods
- control (no treatment);
- ammonium nitrate (N1) 80 kg N ha−1, (24 g N plot−1);
- ammonium nitrate (N2) 160 kg N ha−1, (47 g N plot−1);
- Tytanit (Ti1) 0.2% (1 cm3 in 500 cm3 of water);
- Tytanit (Ti2) 1% (5 cm3 in 500 cm3 of water);
- ammonium nitrate (N1) + Tytanit (Ti1);
- ammonium nitrate (N2) + Tytanit (Ti2).
3. Results and Discussion
4. Conclusions
- Across all growing seasons, the largest biomass yield of Festulolium braunii was on plots treated with mineral nitrogen at a dose of 160 kg ha−1 in combination with 1% Tytanit foliar application. The yield was 40 to 75% higher than that on control.
- Tytanit foliar application with a concentration of 1% increased the yield of plants compared to traditional mineral nitrogen treatment.
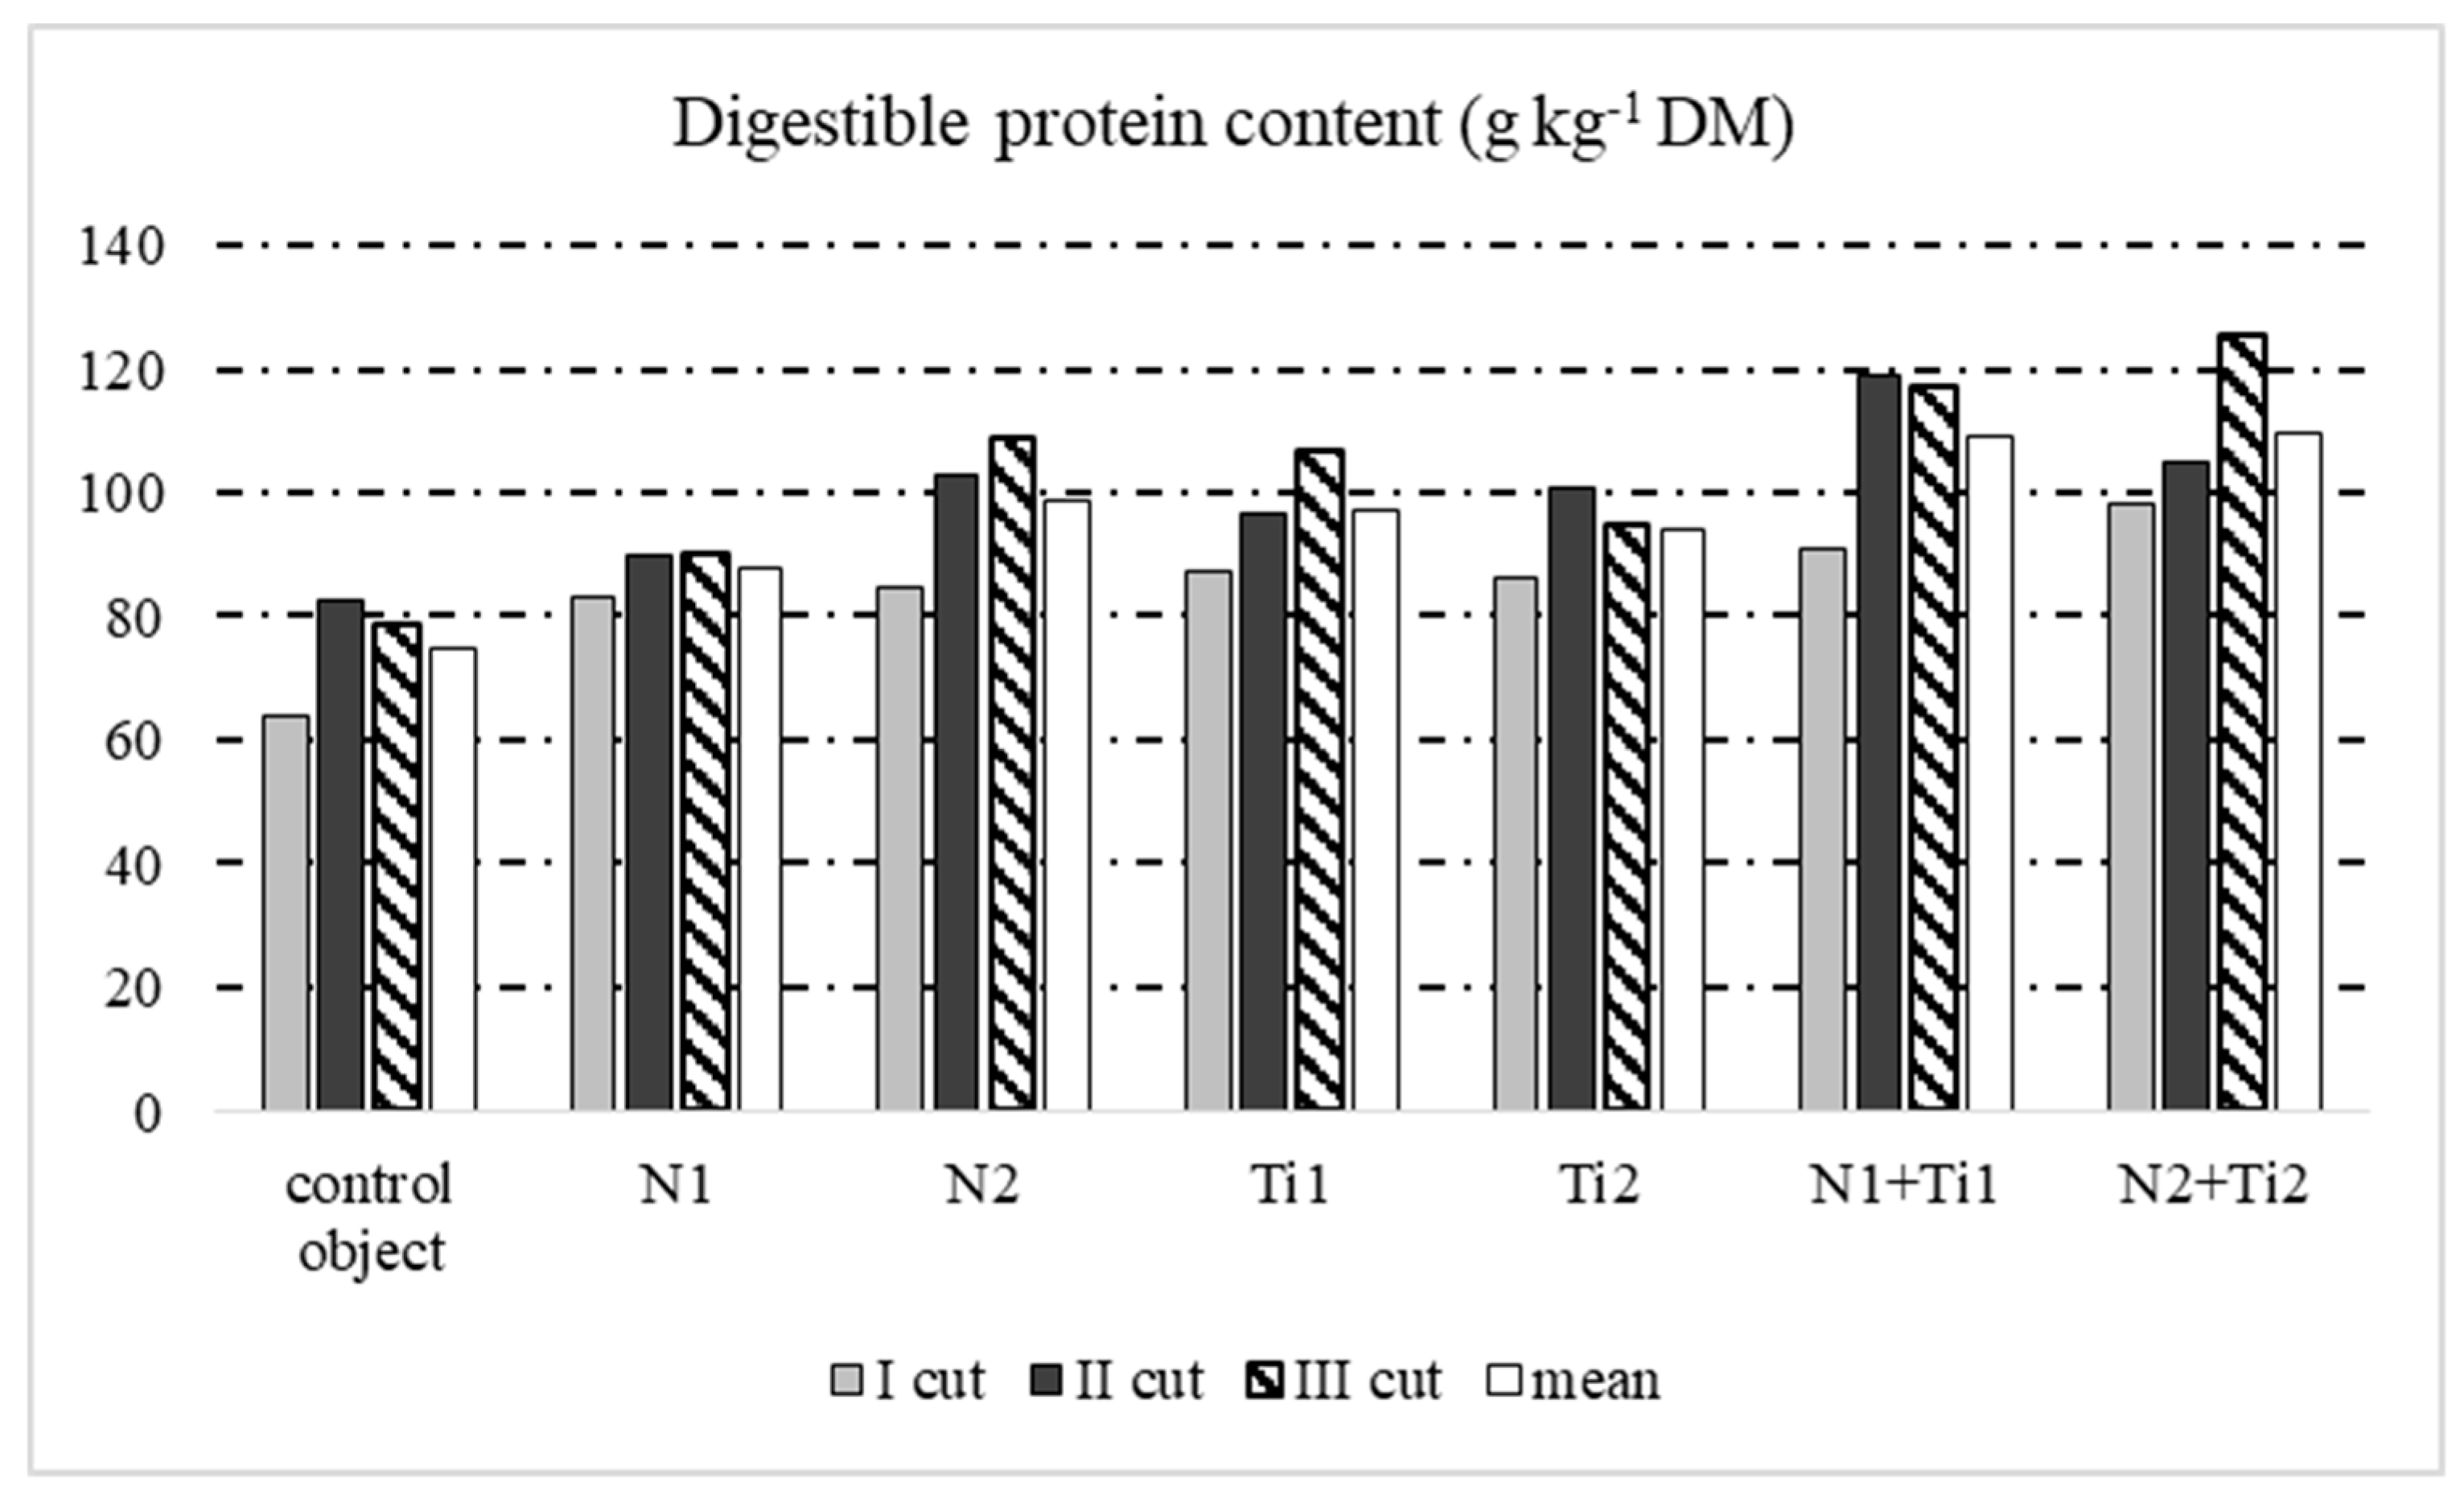
- Mineral nitrogen treatment in combination with Tytanit application positively affected the concentration of protein in the grass.
- In the first and second years of the experiment, a single Tytanit application with a concentration of 1% increased the content of soluble sugars in Festulolium braunii, compared to grass treated with nitrogen.
Author Contributions
Funding
Conflicts of Interest
References
- Domański, P.; Joks, W. Festulolium varieties—Effects of biological progres. Zesz. Nauk. ATR Bydgoszcz. 220. Rolnictwo. 1999, 44, 88–93. (In Polish) [Google Scholar]
- Oertel, C.; Matzk, F. Introgression of crown rust resistance from Festuca spp. into Lolium multiflorum. Plant Breed. 1999, 118, 491–496. [Google Scholar] [CrossRef]
- Rzeźnik, A.; Goliński, P. Achievements in hybrid breeding x Festulolium. Grassl. Sci. Pol. 2013, 16, 79–98. (In Polish) [Google Scholar]
- Humphreys, M.W.; Thomas, H.; Harper, J.; Morgan, G.; James, A.; Ghamari-Zare, A.; Thomas, H. Dissecting drought—And cold tolerance traits in the Lolium—Festuca complex by introgression mapping. N. Phytolog. 1997, 137, 55–60. [Google Scholar] [CrossRef]
- Borowiecki, J. Review of work on Festulolium braunii (K. Richter) A. Camus. Pam. Puł. 2005, 140, 15–23. (In Polish) [Google Scholar]
- Boller, B.; Posselt, U.K.; Veronesi, F. (Eds.) Fodder Crops and Amenity Grasses; Springer: New York, NY, USA, 2010; p. 523. [Google Scholar]
- Sosnowski, J. The value of production. energy and food of Festulolium braunii (K. Richt.) A. Camus microbiologically and mineral supplied. Fragm. Agron. 2012, 29, 115–122. [Google Scholar]
- Østrem, L.; Volden, B.; Larsen, A. Morphology. dry matter yield and phenological characters at different maturity stages of Festulolium compared with other grass species. Acta Agric. Scand. 2013, 63, 531–542. [Google Scholar]
- Gutmane, I.; Adamovics, A. Influence of nitrogen fertilization rates on Festulolium and Lolium × boucheanum forage yield and persistency. Grassl. Sci. Eur. 2009, 14, 336–338. [Google Scholar]
- Mengel, K.; Kirkby, E.A.; Kosegarten, H.; Appel, T. Nitrogen. In Principles of Plant Nutrition; Mengel, K., Kirkby, E.A., Kosegarten, H., Appel, T., Eds.; Springer: Dordrecht, The Netherlands, 2001. [Google Scholar]
- Kocon, A.; Grenda, A. The effect of titanite on photosynthesis. Yield and nutrient uptake by rapeseed plants. Adv. Agric. Sci. Probl. 2004, 502, 135–140. (In Polish) [Google Scholar]
- Janas, R.; Grzesik, M. The usefulness of biological compounds in organic farming production of promedical plants. J. Res. Appl. Agric. Eng. 2011, 53, 152–157. [Google Scholar]
- Ciepiela, G.A. Content of structural and nonstructural carbohydrates and lignin in Dactylis glomerata L. and Festulolium braunii (K. Richt.) A. Camus supplied by biostimulator Kelpak SL and nitrogen. Nauka Przyr. Technol. 2014, 8, 2. (In Polish) [Google Scholar]
- Jankowski, K.; Truba, M.; Malinowska, E.; Wiśniewska-Kadżajan, B. The effect of soil conditioners and weather on lawn appearance. J. Ecol. Eng. 2019, 20, 44–52. [Google Scholar] [CrossRef]
- Jankowski, K.; Ciepiela, G.A.; Jodełka, J.; Kolczarek, R. Turf Areas; Wydawnictwo Uniwersytetu Przyrodniczo-Humanistycznego w Siedlcach: AP Siedlce, Poland, 2005. (In Polish) [Google Scholar]
- Holter, J.A.; Reid, J.T. Relationship between the concentrations of crude protein and apparently digestible protein in forages. J. Anim. Sci. 1959, 18, 1339–1349. [Google Scholar] [CrossRef]
- Skowera, B.; Puła, J. Pluviometric extreme conditions in spring season in Poland in the years 1971–2000. Acta Agroph. 2004, 3, 171–177. (In Polish) [Google Scholar]
- StatSoft. Inc. Statistica (Data Analysis Software System); Version 10; StatSoft: Tulsa, OK, USA, 2011; Available online: www.statsoft.com (accessed on 30 March 2020).
- Shangguan, Z.P.; Shao, M.A.; Dyckmans, J. Nitrogen nutrition and water stress effects on leaf photosynthetic gas exchange and water use efficiency in winter wheat. Environ. Exp. Bot. 2000, 44, 141–149. [Google Scholar] [CrossRef]
- Olszewska, M. Leaf greenness (Spad) and yield of Festulolium braunii (K. Richt.) A. Camus grown in mixtures with legumes depending on multiple nitrogen rates. Pol. J. Nat. 2008, 23, 310–325. [Google Scholar] [CrossRef]
- Mastalerczuk, G.; Borawska-Jarmułowicz, B.; Kalaji, H.M.; Dąbrowski, P.; Paderewski, J. Gas-exchange parameters and morphological features of Festulolium (Festulolium braunii K. Richter, A. Camus) in response to nitrogen dosage. Phytosynthetica 2017, 55, 20–30. [Google Scholar] [CrossRef]
- Staniak, M. Yielding and nutritional value of Festulolium braunii variety Felopa depending on the date of harvesting the first swath. I. Yield and selected elements of its structure. Pam. Puł. 2004, 137, 117–131. (in Polish). [Google Scholar]
- Pais, I. The biological importance of titanium. J. Plant. Nutr. 1983, 6, 3–131. [Google Scholar] [CrossRef]
- Malinowska, E.; Kalembasa, S. The yield and content of Ti, Fe, Mn, Cu in celery leaves (Apium Graveolens, L. var. dulce Mill. Pers.) as a result of Tytanit application. Acta Sci. Pol. Hortorum Cultus 2012, 11, 69–80. [Google Scholar]
- Kalembasa, S.; Malinowska, E.; Kalembasa, D.; Symanowicz, B. Effect of foliar fertilization with Tytanit on the content of selected macroelements and sodium in celery. J. Elem. 2014, 683–696. [Google Scholar] [CrossRef]
- Murawska, B.; Gabrowska, M.; Spychaj-Fabisiak, E.; Wszelaczyńska, E.; Chmielewski, J. Production and environmental aspects of the application of biostimulators Asahi SL, Kelpak SL and stimulator Tytanit with limited doses of nitrogen. Environ. Prot. Nat. Res. 2017, 28, 10–15. [Google Scholar] [CrossRef][Green Version]
- Brzóska, F. Quality of roughage and their use in animal nutrition. Production of roughage for ruminants. In Proceedings of the Naukowej Konferencji, Puławy, Poland, 8–9 May 2007; Institute of Soil Science and Plant Cultivation: Puławy, Poland; pp. 63–70. 2007. (In Polish) [Google Scholar]
- Ciepiela, G.A.; Godlewska, A. Changes in protein compounds and monosacharides in select grass species following application of a seaweed extract. Pol. J. Environ. Stud. 2014, 23, 35–41. [Google Scholar]
- Fagerberg, B. The quantitative effect of weather on growth and nutritional value of grass leys. In Proceedings of the 16th EGF Meeting Grassland and Land Use Systems, Grado, Italy, 15–19 September 1996; pp. 83–86. [Google Scholar]
- Łyszczarz, R. Influence of harvest date on selected features of two varieties of cocksfoot. Biuletyn IHAR 2003, 225, 139–149. (In Polish) [Google Scholar]
- Tonn, B.; Bienvenu, C.; Isselstein, J. Assessing quantity and quality of grazed forage on multi-species swards. In The Role of Grasslands in a Green Future, Proceedings of the 17th Symposium of the European Grassland Federation, Akureyri, Iceland, 23–26 June 2013; Helgadóttir, Á., Hopkins, A., Eds.; Agricultural University of Iceland: Reykjavik, Iceland, 2013; Volume 18, pp. 82–84. [Google Scholar]
- Godlewska, A.; Ciepiela, G.A. Assessment of the effect of various biostimulants on Medicago x varia T. Martyn yielding and content of selected organic components. Appl. Ecol. Environ. Res. 2018, 16, 5571–5581. [Google Scholar] [CrossRef]
- Buraczewski, S. Animal nutrition and feed science. In Physiological and Biochemical Grounds of Animal Nutrition; Wyd Nauk PWN: Warsaw, Poland, 2004; Volume 1, p. 55. (In Polish) [Google Scholar]
- Grzelak, M. The productivity and fodder value of Hay from extensively utilised Noteć River Valley Meadows. Nauka Przyr. Technol. 2010, 4, 1–8. [Google Scholar]
- Spychała, W.; Frąckowiak, P.; Adamczyk, F. Influence of extrusion parameters of the screw press prototype on the quality of Camelina seed oil and marc. J. Res. Appl. Agric. Eng. 2011, 56, 110–113. [Google Scholar]
- Central Statistical Office in Poland (CSO) 2018. Available online: https://stat.gov.pl/obszary-tematyczne/rolnictwo-lesnictwo/rolnictwo/rolnictwo-w-2018-roku,3,15.html (accessed on 30 March 2020).
- Czyż, H.; Jänicke, H.; Kitczak, T.; Bury, M. The usefulness of grass mixtures with Festulolium braunii and Lolium perenne for the renewal of grasslands on mucky organic soil. Water-Environ.-Rural Areas 2015, 15, 17–29. (In Polish) [Google Scholar]
- Watts, K.A. Carbohydrates in forage: What is a safe grass? In Proceedings of the 2008 Kentucky Equine Research Conference “Facing Today’s Nutritional Challenges, Lexington, Kentucky, 14–16 April 2008.
- Ciepiela, G.A.; Jankowski, J.; Jodełka, J. Evaluation of yield and fodder value of mixtures of meadow clover with brome Biul. Nauk. 1998, 1, 31–38. (In Polish) [Google Scholar]


| Year | Month | |||||||
|---|---|---|---|---|---|---|---|---|
| IV | V | VI | VII | VIII | IX | X | Mean | |
| Temperature | ||||||||
| 2015 | 9.7 | 13.7 | 15.1 | 20.5 | 17.8 | 13.7 | 8.4 | 14.1 |
| 2016 | 8.2 | 12.3 | 16.5 | 18.7 | 21.0 | 14.5 | 6.5 | 14.0 |
| 2017 | 8.3 | 13.9 | 17.8 | 16.9 | 18.4 | 13.9 | 9.0 | 13.8 |
| Mean | 8.3 | 13.3 | 16.5 | 18.7 | 19.1 | 14.0 | 8.0 | 13.9 |
| Mean of 2004-2014 | 8.5 | 14.0 | 17.4 | 19.8 | 18.9 | 13.2 | 7.9 | 14.2 |
| Rainfall (mm) | ||||||||
| 2015 | 39.5 | 79.5 | 74.2 | 37.5 | 105.7 | 26.3 | 3.00 | 52.2 |
| 2016 | 30.0 | 100.2 | 43.3 | 62.6 | 11.9 | 77.1 | 39.0 | 52.0 |
| 2017 | 59.6 | 49.5 | 57.9 | 23.6 | 54.7 | 80.1 | 53.0 | 54.1 |
| Mean | 43.0 | 76.4 | 58.5 | 41.2 | 57.4 | 61.2 | 31.7 | 52.8 |
| Mean of 2004-2014 | 33.0 | 52.0 | 52.0 | 65.0 | 56.0 | 48.0 | 28.0 | 47.7 |
| Sielianinov’s coefficient (K) | ||||||||
| 2015 | 1.36 (o) | 1.87 (mw) | 1.64 (mw) | 0.59 (sd) | 1.92 (mw) | 0.64 (sd) | 0.12 (ed) | - |
| 2016 | 1.22 (md) | 2.63 (sw) | 0.87 (d) | 1.08 (md) | 0.18 (ed) | 1.46 (o) | 1.94 (mw) | - |
| 2017 | 2.88 (sw) | 1.15 (md) | 1.08 (md) | 0.45 (sd) | 0.96 (d) | 1.92 (mw) | 1.90 (mw) | - |
| Treatment | Yield of Each Year | Mean for Years | ||
|---|---|---|---|---|
| 2015 (1st Year) | 2016 (2nd Year) | 2017 (3rd Year) | ||
| Control | 7.00 | 6.05 | 6.08 | 6.38 |
| N1 | 7.30 | 6.20 | 6.99 | 6.83 |
| N2 | 9.80 | 7.50 | 9.73 | 9.01 |
| Ti1 | 7.40 | 8.00 | 8.08 | 7.83 |
| Ti2 | 8.60 | 8.20 | 9.19 | 8.66 |
| N1 + Ti1 | 8.30 | 7.80 | 9.54 | 8.55 |
| N2 + Ti2 | 9.80 | 9.35 | 10.61 | 9.92 |
| mean | 8.31 | 7.59 | 8.60 | 8.17 |
| LSD0.05 for: | ||||
| A-years A-0.510 | ||||
| B-treatment B-0.994 | ||||
| A×B, B×A-interaction A×B-1.35 | ||||
| B×A-1.72 | ||||
| Treatment | 2015 (the 1st Year) | 2016 (the 2nd Year) | 2017 (the 3rd Year) | |||||||||
|---|---|---|---|---|---|---|---|---|---|---|---|---|
| Cuts | Cuts | Cuts | ||||||||||
| I | II | III | Mean | I | II | III | Mean | I | II | III | Mean | |
| Control | 71.57 | 73.40 | 74.18 | 73.05 | 76.32 | 85.37 | 84.71 | 82.13 | 65.65 | 114.5 | 101.3 | 93.82 |
| N1 | 91.83 | 87.44 | 82.94 | 87.40 | 86.21 | 90.11 | 91.36 | 89.23 | 97.23 | 119.2 | 122.5 | 113.0 |
| N2 | 99.83 | 108.7 | 127.3 | 111.9 | 88.01 | 95.23 | 96.23 | 93.16 | 92.20 | 129.4 | 132.9 | 118.2 |
| Ti1 | 112.4 | 109.1 | 130.9 | 117.4 | 90.36 | 88.36 | 97.01 | 91.91 | 85.53 | 120.5 | 121.9 | 108.6 |
| Ti2 | 111.7 | 116.1 | 115.4 | 114.4 | 87.12 | 89.36 | 90.23 | 88.90 | 86.39 | 125.4 | 106.9 | 106.2 |
| N1 + Ti1 | 124.3 | 125.0 | 142.6 | 130.7 | 90.23 | 95.12 | 100.2 | 95.18 | 84.69 | 162.7 | 158.6 | 135.3 |
| N2 + Ti2 | 109.7 | 114.8 | 133.4 | 119.3 | 100.2 | 99.67 | 112.3 | 104.06 | 112.7 | 130.2 | 163.9 | 135.6 |
| mean | 103.1 | 104.9 | 115.3 | 107.7 | 88.35 | 91.89 | 96.01 | 92.08 | 88.92 | 128.8 | 129.7 | 115.8 |
| LSD0.05 for: | ||||||||||||
| A-cuts A-9.66 | A-1.65 | A-4.21 | ||||||||||
| B-treatment B-4.96 | B-3.22 | B-8.20 | ||||||||||
| A×B–interaction A×B-13.12 | A×B-4.37 | A×B-11.14 | ||||||||||
| B×A B×A-16.73 | B×A-5.58 | B×A-14.21 | ||||||||||
| Treatment | 2015 (1st Year) | 2016 (2nd Year) | 2017 (3rd Year) | |||||||||
|---|---|---|---|---|---|---|---|---|---|---|---|---|
| Cuts | Cuts | Cuts | ||||||||||
| I | II | III | Mean | I | II | III | Mean | I | II | III | Mean | |
| Control object | 88.51 | 91.02 | 100.3 | 93.28 | 90.23 | 88.54 | 98.74 | 92.50 | 82.64 | 85.57 | 84.28 | 84.16 |
| N1 | 92.48 | 95.66 | 99.23 | 95.79 | 89.97 | 102.3 | 96.39 | 96.22 | 92.07 | 93.46 | 92.80 | 93.11 |
| N2 | 98.40 | 90.21 | 89.56 | 92.72 | 100.2 | 99.78 | 110.2 | 103.4 | 90.18 | 91.26 | 94.80 | 91.99 |
| Ti1 | 95.42 | 94.56 | 100.2 | 96.73 | 99.87 | 100.7 | 89.67 | 96.73 | 88.73 | 87.25 | 86.40 | 87.46 |
| Ti2 | 100.4 | 123.0 | 132.3 | 118.6 | 113.6 | 100.3 | 99.07 | 104.3 | 92.91 | 90.25 | 93.46 | 92.21 |
| N1 + Ti1 | 118.9 | 109.9 | 109.7 | 112.8 | 120.7 | 118.9 | 120.5 | 120.3 | 129.4 | 116.7 | 120.5 | 122.2 |
| N2 + Ti2 | 125.4 | 112.3 | 120.9 | 119.5 | 109.6 | 118.8 | 120.0 | 116.1 | 124.1 | 119.3 | 123.4 | 122.3 |
| mean | 102.8 | 102.4 | 107.5 | 104.2 | 103.5 | 104.2 | 104.9 | 105.4 | 100.0 | 97.83 | 99.34 | 99.06 |
| LSD0.05 for: | ||||||||||||
| A-cuts A-0.447 | A-ns | A-0.831 | ||||||||||
| B-treatment B-0.871 | B-3.647 | B-1.62 | ||||||||||
| A×B–interaction A×B-1.18 | A×B-4.95 | A×B-2.20 | ||||||||||
| B×A B×A-1.51 | B×A-6.32 | B×A-2.80 | ||||||||||
| Treatments | 2015 (1st Year) | 2016 (2nd Year) | 2017 (3rd Year) | |||||||||
|---|---|---|---|---|---|---|---|---|---|---|---|---|
| Cuts | Cuts | Cuts | ||||||||||
| I | II | III | Mean | I | II | III | Mean | I | II | III | Mean | |
| Control | 1.24 | 1.24 | 1.35 | 1.28 | 1.18 | 1.04 | 1.17 | 1.13 | 1.26 | 0.747 | 0.832 | 0.946 |
| N1 | 1.03 | 1.09 | 1.20 | 1.11 | 1.04 | 1.14 | 1.06 | 1.08 | 0.947 | 0.784 | 0.758 | 0.830 |
| N2 | 0.986 | 0.830 | 0.704 | 0.840 | 1.14 | 1.05 | 1.15 | 1.11 | 0.978 | 0.705 | 0.713 | 0.799 |
| Ti1 | 0.849 | 0.867 | 0.765 | 0.827 | 1.11 | 1.14 | 0.924 | 1.06 | 1.04 | 0.724 | 0.709 | 0.824 |
| Ti2 | 0.899 | 0.944 | 1.15 | 0.998 | 1.30 | 1.33 | 1.11 | 1.25 | 1.08 | 0.720 | 0.874 | 0.891 |
| N1 + Ti1 | 0.957 | 0.879 | 0.848 | 0.895 | 1.34 | 1.25 | 1.27 | 1.29 | 1.53 | 0.717 | 0.760 | 1.00 |
| N2 + Ti2 | 1.14 | 0.978 | 0.906 | 1.01 | 1.09 | 1.19 | 1.15 | 1.14 | 1.10 | 0.916 | 0.753 | 0.923 |
| mean | 1.01 | 0.975 | 0.989 | 0.993 | 1.17 | 1.16 | 1.12 | 1.15 | 1.13 | 0.759 | 0.771 | 0.888 |
| LSD0.05 for: | ||||||||||||
| A-cuts A-ns | A-ns | A-0.111 | ||||||||||
| B-fertilization B-ns | B-ns | B-ns | ||||||||||
| A×B-interaction A×B-0.20 | A×B-ns | A×B -0.294 | ||||||||||
| B×A B×A-ns | B×A-ns | B×A-0.375 | ||||||||||
© 2020 by the authors. Licensee MDPI, Basel, Switzerland. This article is an open access article distributed under the terms and conditions of the Creative Commons Attribution (CC BY) license (http://creativecommons.org/licenses/by/4.0/).
Share and Cite
Malinowska, E.; Jankowski, K.; Kania, P.; Gałecka, M. The Effect on Tytanit Foliar Application on the Yield and Nutritional Value of Festulolium braunii. Agronomy 2020, 10, 848. https://doi.org/10.3390/agronomy10060848
Malinowska E, Jankowski K, Kania P, Gałecka M. The Effect on Tytanit Foliar Application on the Yield and Nutritional Value of Festulolium braunii. Agronomy. 2020; 10(6):848. https://doi.org/10.3390/agronomy10060848
Chicago/Turabian StyleMalinowska, Elżbieta, Kazimierz Jankowski, Paweł Kania, and Martyna Gałecka. 2020. "The Effect on Tytanit Foliar Application on the Yield and Nutritional Value of Festulolium braunii" Agronomy 10, no. 6: 848. https://doi.org/10.3390/agronomy10060848
APA StyleMalinowska, E., Jankowski, K., Kania, P., & Gałecka, M. (2020). The Effect on Tytanit Foliar Application on the Yield and Nutritional Value of Festulolium braunii. Agronomy, 10(6), 848. https://doi.org/10.3390/agronomy10060848