Article

Evaluation of Selection Methods for Resistance to a Specialist Insect Pest of Squash (Cucurbita pepo)

by
Lauren J. Brzozowski
* and
Michael Mazourek
Plant Breeding and Genetics Section, School of Integrative Plant Science, Cornell University, Ithaca, NY 14853, USA
*
Author to whom correspondence should be addressed.
Agronomy 2020, 10(6), 847; https://doi.org/10.3390/agronomy10060847
Submission received: 28 April 2020 / Revised: 10 June 2020 / Accepted: 12 June 2020 / Published: 14 June 2020

Abstract

:
Plant varieties resistant to insect pests are a critical component of integrated pest management, but challenges associated with plant breeding for insect resistance, such as a long breeding cycle duration and low trait heritability, slow progress in the field. In this study, we tested two novel selection schemes to improve genetic gain for resistance to the major pest, the striped cucumber beetle (Acalymma vittatum), in squash (Cucurbita pepo, e.g., zucchini). First, we tested an indirect selection scheme using a proxy insect with correlated resistance phenotypes, Trichoplusia ni, in place of the seasonally available A. vittatum. We found that while resistance to herbivory by T. ni was heritable, there was no reciprocal benefit for resistance to A. vittatum. Second, we tested genomic selection, a method that allows for selection without phenotyping every generation, for both resistance to A. vittatum directly and resistance to the proxy T. ni. Although there was moderate genomic predictive ability, we did not observe realized gains from selection in field trials. Overall, strategies that minimize investment in direct phenotyping, leverage efficiencies from phenotyping correlated traits, and shorten breeding cycle duration are needed to develop insect resistant varieties, and this study provides examples and empirical data of two such approaches deployed in an applied breeding program.

1. Introduction

Development and cultivation of varieties resistant to insect damage is a cornerstone of integrated pest management [1], yet the use of resistant fruit and vegetable crops is limited [2]. Successful breeding for resistance to insect pests has been largely restricted to cases where the genetic architecture is oligogenic and heritability is high, as in gene-for-gene interactions in some hemipteran and dipteran pests [3]. For many other pests, such as beetles (Coleoptera), plant breeders are challenged by factors including quantitative inheritance, low heritability, and limited knowledge of resistance mechanisms [4]. Thus, improved plant breeding strategies are needed to increase genetic gain in an economically viable manner.
The amount of genetic gain plant breeders can attain by selection is governed by trait heritability, phenotypic variance, and selection intensity [5]. Broadly, heritability can be improved through enhanced phenotyping and experimental design [6]; however, if phenotyping insect resistance relies on natural pest infestation, the degree to which heritability can be improved may be limited due to stochastic fluctuations in pest density or confounded by pest behaviors (e.g., aggregation). As a consequence, plant breeders may instead evaluate and select upon correlated traits, such as defensive chemistry [7,8] or physical defenses [9,10]. When correlated traits have a shared genetic basis, comparable or higher heritability, or more individuals can be phenotyped in a high-throughput manner, indirect selection on those traits can translate to greater genetic gain [11]. A barrier to this method is that correlated traits may not be identified, and mechanism discovery may be beyond the scope of some breeding programs.
In applied breeding programs, the most relevant metric for assessing success is genetic gain per unit time [12]. Decreasing breeding cycle duration may also be more accessible than other strategies; for instance, increasing selection intensity may require larger populations and field space [13]. One readily apparent solution for breeding for insect resistance would be incorporating, or exclusively using, indirect selection on traits that allow for more generations of selection per year than would be possible with direct phenotyping. Another method increasingly used in breeding programs is genomic selection, a method with the goal to increase genetic gain in a shorter time span, in part by allowing for population advancement without phenotyping [14]. Thus, phenotypes that are difficult or expensive to measure, such as insect resistance, are likely to benefit from genomic selection [15,16]. However, genomic selection for insect resistance has received little attention compared to more widespread application for traits like yield and disease resistance [17]; we are aware of a single study of resistance to the pine weevil (Pissodes strobi, Coleoptera: Curculionidae) in Norway spruce (Picea abies) [18]. Overall, methods that decrease breeding cycle duration, and shift (indirect selection) or reduce (genomic selection) phenotyping should be explored to improve breeding for resistance to insect pests.
We tested such selection methods in an applied breeding program for Cucurbita pepo (e.g., zucchini) resistance to a major agricultural pest, the striped cucumber beetle, Acalymma vittatum (Coleoptera: Chrysomelidae). Acalymma vittatum causes damage through herbivory of all plant tissues in both larval and adult stages [19], and vectors disease-causing bacteria (Erwinia tracheiphila [20]) as well as seed-transmissible Squash mosaic virus [21]. There is variation for leaf damage by adult beetles in C. pepo cultivars [22,23] at economically meaningful levels [24]. However, there are numerous challenges to breeding for resistance to leaf damage. First, A. vittatum adults group in pheromone-mediated aggregations [25], amplifying spatial variation in damage and thus decreasing heritability. In addition, maintaining A. vittatum colonies large enough to screen breeding populations is prohibitive, so phenotypic selection typically occurs only once per year during natural A. vittatum field infestation and carries risks of failure due to disease occurrence. Finally, accurately measuring damage is time-intensive and requires trained observers, making phenotyping a significant investment. Overall, there is a clear need for innovative methods to increase genetic gain for resistance that is sensitive to low heritability, mitigates risks of beetle-vectored disease, and decreases cycle length in a manner that is attainable for applied breeding programs.
One approach would be to indirectly select for resistance to leaf damage by A. vittatum based on a correlated trait. Unfortunately, mechanisms of leaf resistance to A. vittatum have yet to be characterized in cultivated C. pepo. Cucurbitacins, bitter triterpenoids of the Cucurbitaceae that A. vittatum seeks and sequesters for its own defense [26], are not found in leaves of cultivated C. pepo [27,28], nor do other traits frequently associated with resistance like nutrient content and leaf thickness [28,29] affect leaf attack. As a result, there is not a chemical or physical leaf trait can be targeted for indirect selection. However, we previously observed that resistance to Trichoplusia ni (Lepidoptera: Noctuidae), an occasional herbivore of squash [30], and A. vittatum were highly correlated at the cultivar level (rP = 0.893); increased resistance to T. ni larvae (reduced performance as measured by larval mass) is associated with increased resistance to A. vittatum (reduced leaf damage) [28]. In addition, C. pepo resistance to T. ni can be evaluated on small plants in controlled environments year-round as T. ni are available through commercial sources, making it a promising ‘proxy’ chewing insect to use in a rapid-cycling indirect selection scheme.
We also evaluated the gain from genomic selection for resistance to A. vittatum. The benefits of genomic selection are magnified in this system in both allowing for additional generations of selection per year and also for alleviating issues with seasonal A. vittatum availability and plant disease transmission. In the only other genomic selection study, we are aware of, for insect resistance, the authors demonstrated a prediction accuracy of 0.83 for resistance to pine weevils in Norway spruce with a multi-trait prediction model incorporating traits correlated to resistance (e.g., tree height), although realized gains were not measured [18]. More specifically to this system of study, genomic selection has been shown to be a viable method for improving other quantitative fruit quality traits in Cucurbita spp. [31].
To test selection methods for reducing breeding cycle time and increasing genetic gain for resistance to A. vittatum in C. pepo, we developed a biparental intermated C. pepo population between a susceptible and resistant cultivar, selected for two generations, and measured realized gains. In testing indirect selection through use of T. ni as a proxy, we hypothesized that there would be a shared genetic basis of resistance between T. ni and A. vittatum, and that resistance to T. ni would have greater heritability than that of A. vittatum damage due to the inability of T. ni larvae to move between plants. We also predicted that genomic selection with models developed from both A. vittatum and T. ni phenotypes would lead to population improvement. Overall, these methods tested different strategies to develop resistant varieties through reducing breeding cycle length and were evaluated in an applied breeding program.

2. Materials and Methods

2.1. Plants

All germplasm was sourced from the Cornell University breeding program. This includes population founders, the susceptible Cucurbita pepo ssp. pepo cv. Black Beauty (zucchini), and resistant C. pepo ssp. ovifera (syn texana) cv. Success PM (summer squash), the intermated F2 population as the base population, and all derived populations. The selection scheme shown in Figure 1. All plants were started from untreated seeds in the Cornell University Agricultural Experiment Station greenhouses (Ithaca, NY, USA) and grown with a 16 h day, 8 h night photoperiod with supplemental lighting and temperatures of 27 °C and 21 °C, respectively. Plants used in founder phenotype evaluations, T. ni indirect selection and common garden experiments, and genomic selection were sown individually into 10 cm pots and kept in the greenhouse. Plants used in A. vittatum realized gain field trials were sown into 72-cell trays in the greenhouse and subsequently transplanted in certified organic fields of the Homer C. Thompson Vegetable Research Farm (Freeville, NY, USA, 42°31′05.7″ N 76°20′07.1″ W). Plants had 1to 3 fully expanded true leaves at the beginning of assays.

2.2. Acalymma vittatum Assays

All Acalymma vittatum used in field evaluations were naturally occurring adult populations at the Homer C. Thompson Vegetable Research Farm. For greenhouse assays, A. vittatum were collected up to 24 h before trials commenced. Resistance to A. vittatum was measured as leaf damage to plants; not mass, as adult mass is fixed. Leaf damage was both visually estimated as percent defoliation, and measured from photographs using ImageJ [32].

2.3. Trichoplusia ni Assays

Eggs were supplied from a colony maintained at Cornell University (Dr. Ping Wang, Cornell AgriTech, Geneva, NY, USA) and held in a 30 °C growth chamber. Immediately upon hatching, 2 to 3 neonates were applied to the newest fully expanded true leaf of plants in the greenhouse. Plants were then individually enclosed in a mesh sleeve (30 cm × 18 cm) and watered daily. After five days, larvae were removed from plants, placed in Eppendorf tubes, frozen, and weighed (AT21 Comparator Microbalance, Mettler-Toledo, Columbus, OH, USA). Resistance to T. ni was quantified by larval mass, a metric of T. ni performance [28].

2.4. Founder Phenotypic Evaluation

While previous work had established that C. p. pepo cultivars are more susceptible to A. vittatum (greater leaf damage) [22,23] and to T. ni (T. ni sustain greater larval growth) [28] than C. p. ovifera, we tested differences between the two specific founders for both metrics. We evaluated A. vittatum leaf damage in paired choice tests. In June 2018, one plant of each founder was placed 25 cm apart in a 25 cm × by 30 cm mesh bag, five beetles were added, and leaf damage was visually estimated after 48 h. Thirty-one pairs were evaluated over four temporally separated blocks each with six to nine replicates each. Differences in estimated leaf defoliation between founders were assessed with a linear mixed effects model with founder genotype and block as fixed effects, individual pairing nested within block as a random effect. To test for differences in resistance to T. ni, we measured T. ni larval mass on a total of 25 plants of the susceptible and 20 of the resistant founder in two blocks in January 2018. Average mass of recovered larvae was analyzed as a linear model with fixed effects of the genotype and block.

2.5. Indirect Selection Using Resistance to Trichoplusia ni

Two generations of indirect selection based on resistance to T. ni were conducted (Figure 1a). In March 2018, 131 plants from the base population were evaluated in an augmented incomplete block design of seven blocks of 18 to 20 base population plants each with both founders as checks. Mass of T. ni larvae was measured from each plant (most had 2 to 3 larvae). Best linear unbiased predictors (BLUPs) were calculated for T. ni mass with random effects of genotype and block, and fixed effect of the checks, and then deregressed [33].
The 15% of individuals (n = 20) with lowest BLUPs (most resistant to T. ni; lowest T. ni larval mass) were randomly intermated with one pollination per plant to complete the first generation of phenotypic selection and create “TniPS1”. Seeds from TniPS1 were then mixed in equal numbers per maternal genotype, and a second generation of phenotypic selection was conducted in July 2018. An augmented incomplete block design was used with 14 blocks of 14–15 TniPS1 plants (n = 209 total), and with a check of each founder per block. Using BLUPs calculated by the same method, the best 29 plants (14%) were randomly intermated to create “TniPS2”. Seeds of TniPS2 were then mixed in equal numbers per maternal genotype for subsequent evaluation.

2.6. Genomic Selection Training Population Evaluation

2.6.1. Resistance to T. ni

The base population used in the first generation of T. ni phenotypic selection was used as the T. ni genomic selection training population (Figure 1a). The BLUPs described above (TniPS1) were used for training genomic selection models, and tissue was collected for DNA extraction from the 131 individuals.

2.6.2. Resistance to A. vittatum

Individuals from the base population were evaluated in the field for resistance to A. vittatum to provide phenotypes for training the A. vittatum genomic selection model (Figure 1b). The field was prepared by creating four raised bed rows running east to west with black plastic mulch and drip irrigation spaced 2.1 m apart. The A. vittatum training population was then transplanted into the field in June 2018 with 0.45 m between individual plants in an augmented incomplete block design. Each of the four rows was split into two blocks (north and south), and founder checks were included in each block. Although only 190 plants could be genotyped in the training population, 240 plants were transplanted (60 per row) to create a buffer for plant or sample loss associated with transplanting or causes unrelated to beetle damage. Plant damage was evaluated once founder checks had substantial differences in defoliation, July 2018, and tissue was collected for DNA extraction.
Best linear unbiased predictors were calculated from the 209 phenotyped individuals for the following response variables were used: estimated percent leaf defoliation (%), actual measured percent leaf defoliation (%), log(actual measured percent leaf defoliation), and actual measured leaf defoliation (cm2). The models had random effects of genotype, row, and block nested within row and a fixed effect of the checks. Broad sense heritability (H2) and phenotypic correlations were also calculated, and deregressed BLUPs were used to train the A. vittatum genomic selection model.

2.7. Genotyping and SNP Calling–Training Populations and Genomic Selection

DNA was extracted from all populations with a Qiagen DNeasy 96 Plant kit from lyophilized tissue according to the manufacturer’s instructions (Qiagen, Hilden, Germany). 192-plex GBS library preparation was done at University of Wisconsin-Madison Biotechnology Center (Madison, WI, USA), and the libraries were sequenced at Cornell University Biotechnology Resource Center (Ithaca, NY, USA) on an Illumina NextSeq 500 (Illumina, San Diego, CA, USA) with single-end 75 bp reads.
Reads were aligned to the most recent Cucurbita pepo genome (v4.1) [34] with the ‘bwa’ aligner in the GBSv2 pipeline in TASSEL 5 [35], and 129,953 single nucleotide polymorphisms (SNPs) were called. SNPs were filtered to be biallelic, minor allele frequency of 0.05, and missing in less than 50% of samples with VCFtools [36], leaving 22,213 SNPs. Then, only the 16,052 SNPs polymorphic between the population parents were retained. Finally, missing genotypes were imputed with an accuracy of 87% with LB-Impute, imputation software developed for biallelic populations, with a window size of five [37].

2.8. Genomic Selection

Two genomic selection models were trained with phenotypic data from the A. vittatum and T. ni training populations. For both, previously described BLUPs were used as phenotypes and there were 190, 130 individuals with both phenotypes and genotypes for A. vittatum and T. ni, respectively. Predictive ability of different genomic selection statistical models were evaluated in the R package PopVar [38] with five-fold cross-validation and 100 replications. Ultimately, genomic BLUP (GBLUP) was used to train the genomic selection model, and was implemented in TASSEL 5 [35]. Narrow sense heritability (h2) was also calculated in TASSEL 5 using the mixed linear model (MLM) function with kinship derived from all genomic SNPs.
Then, two generations of genomic selection based on the training models from both A. vittatum and T. ni were conducted (Figure 1c). In Fall 2018, the first cycle of genomic selection began with sowing 190 seeds from the base population and selecting the best 23 (12%), 27 (14%) individuals based on the genomic estimated breeding values (GEBVs) calculated from the A. vittatum and T. ni GBLUP models, respectively. Within each population, individuals were randomly intermated. Seeds from pollinations (AvitGS1 and TniGS1) were then mixed within selection models in equal numbers per maternal genotype for the subsequent generation. In Spring 2019, another cycle of selection was conducted on both populations using the same model. For the A. vittatum selection scheme, 190 individuals were genotyped, and 31 (16%) were selected, and for the T. ni selection scheme, 174 individuals were genotyped, and 19 (11%) were selected. Again, within each population, individuals were randomly intermated and seeds from pollinations (AvitGS2 and TniGS2) were then mixed within selection models in equal numbers per maternal genotype for subsequent evaluation. The resulting AvitGS2 and TniGS2 populations were not genotyped. After completing all cycles of selection, population differentiation was visualized using principal component analysis of genome-wide SNPs in TASSEL, and quantified by mean weighted FST values calculated in VCFtools [36].

2.9. Realized Gains from Selection

2.9.1. Resistance to Acalymma vittatum

Populations were evaluated for realized gain for resistance to A. vittatum from different selection methods in the field during Summer 2019. The field was prepared with raised beds with drip irrigation and black plastic mulch with each row spaced 3 m apart. Populations were evaluated in a randomized complete block design of 20 plant plots with 0.45 m between plants in four blocks (rows). There were sentinel plots of six individuals of each founder line at the end of each row to assess damage progression, and plants were phenotyped when the susceptible founder had >50% leaf damage.
Populations were evaluated over two periods due to seed availability. First, the base population, both T. ni phenotypically selected populations (TniPS1 and TniPS2), and both first generations of genomic selection (TniGS1 and AvitGS1) were transplanted in June and evaluated in July. The second set evaluated included the base population and all genomic selection populations (TniGS1, TniGS2, AvitGS1, and AvitGS2), and was transplanted and evaluated in August. Resistance to A. vittatum (measured percent damage) in each trial was modeled with a linear mixed effect model with a fixed effect of population and random effect of block.

2.9.2. Resistance to T. ni

We assessed the effect of selection on resistance to T. ni in two common gardens. First, both generations of T. ni phenotypic selection (TniPS1 and TniPS2) were compared to the base population in Summer 2019. Then, in Fall 2019, both first generations of genomic selection (TniGS1 and AvitGS1) were compared to the base population. Two independent experiment iterations were conducted for each common garden. In each iteration, we used a randomized block design to account for spatial variation in the greenhouse, and there were four blocks with approximately 12 plants per block. In sum, nBasePop = 87, nTniPS1 = 94, and nTniPS2 = 95 plants were evaluated in the first common garden and nBasePop = 82, nAvitPS1 = 92, and nTniGS1 = 90 in the second common garden. All T. ni that recovered from each plant were weighed together to calculate the average mass of the two to three larvae. Differences in T. ni larval mass between generations or selection type was evaluated separately by each common garden with the linear mixed effect model with fixed effects of genotype and experimental iteration and a random effect of block, and an ANOVA was conducted on the fixed effects.

2.10. Statistics

All statistical analyses were conducted in R [39]. Linear models were assessed with the ‘lm’ function, and linear mixed effect models were evaluated with the ‘lmer’ function R/lme4 [40]. Significance of fixed effects was determined with ANOVA.

3. Results

3.1. Phenotypic Extremes in Population Founders

We first confirmed that founder genotypes of the population for the selection experiment had substantial phenotypic differences in resistance to Acalymma vittatum and Trichoplusia ni. Indeed, A. vittatum caused four times greater percent leaf damage (F1,56 = 47.53, p < 0.001), and T. ni larvae attained 61.1% greater mass (F1,42 = 34.56, p < 0.001), on the susceptible than resistant founder.

3.2. Indirect Selection Approach

We tested an indirect selection approach for resistance to A. vittatum with resistance to a proxy insect (T. ni) that had the potential to decrease breeding cycle duration, and was hypothesized to have higher heritability than direct resistance to A. vittatum (Figure 1a). In phenotypically selecting the top 15% most resistant individuals (lowest T. ni larval mass) for two generations, we observed moderate heritability (Table 1). Later, the base population and both generations of phenotypic selection were evaluated in a common garden and there was a significant effect of selection (F2,269 = 5.64, p = 0.004). Mean T. ni mass in base population was close to the mid-parent value (3.5% less), dropped after one generation of selection (TniPS1, 15.4% less), reflecting increased resistance to T. ni, and was maintained after another generation of selection (TniPS2, 15.5% less).

3.3. Genomic Selection Approach

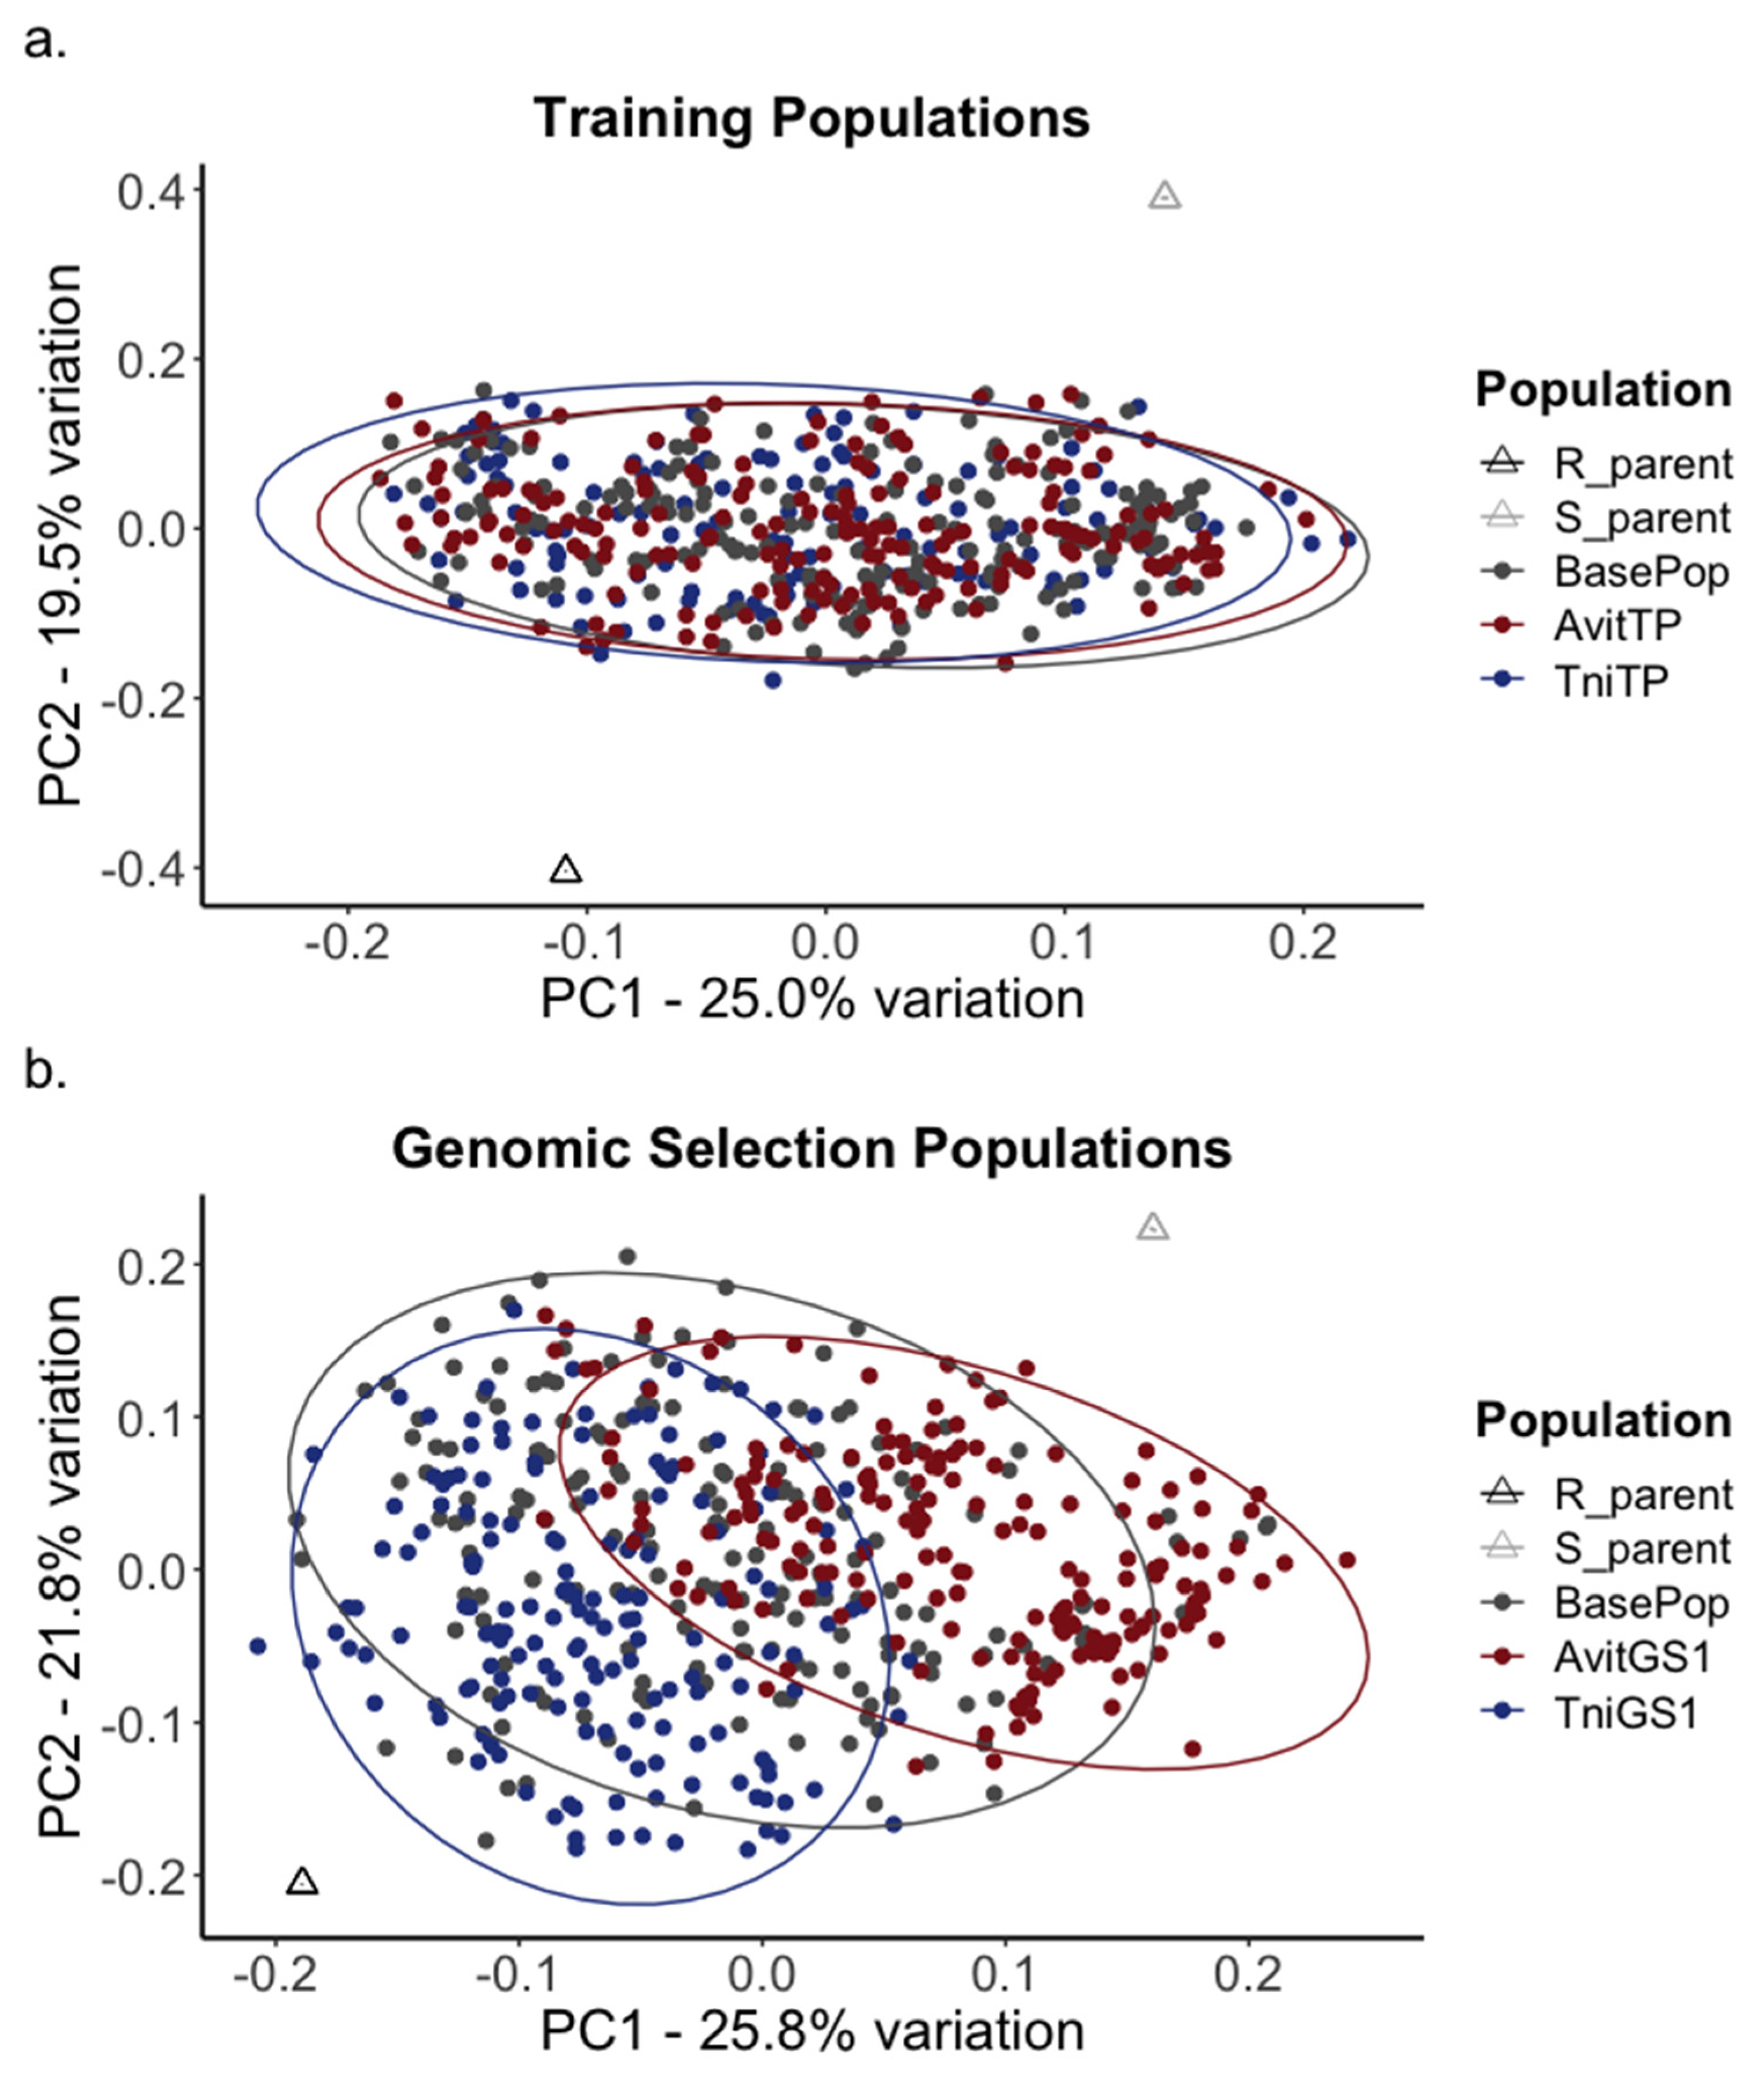
We first phenotypically evaluated individuals from the base population to train genomic selection models (Figure 1a,b). For the A. vittatum training population, of the three leaf damage resistance metrics quantified, actual measured percent defoliation had the highest broad-sense heritability on a plot basis (Table 2), even though estimated and actual percent damage were correlated (Pearson’s r = 0.838, p < 0.001). The T. ni training population phenotype, mean larvae mass, had lower broad-sense heritability than most A. vittatum phenotypes (Table 2). Although distinct individuals were used for the base population and both training populations, the training populations are representative samples of the base population (Figure 2a).
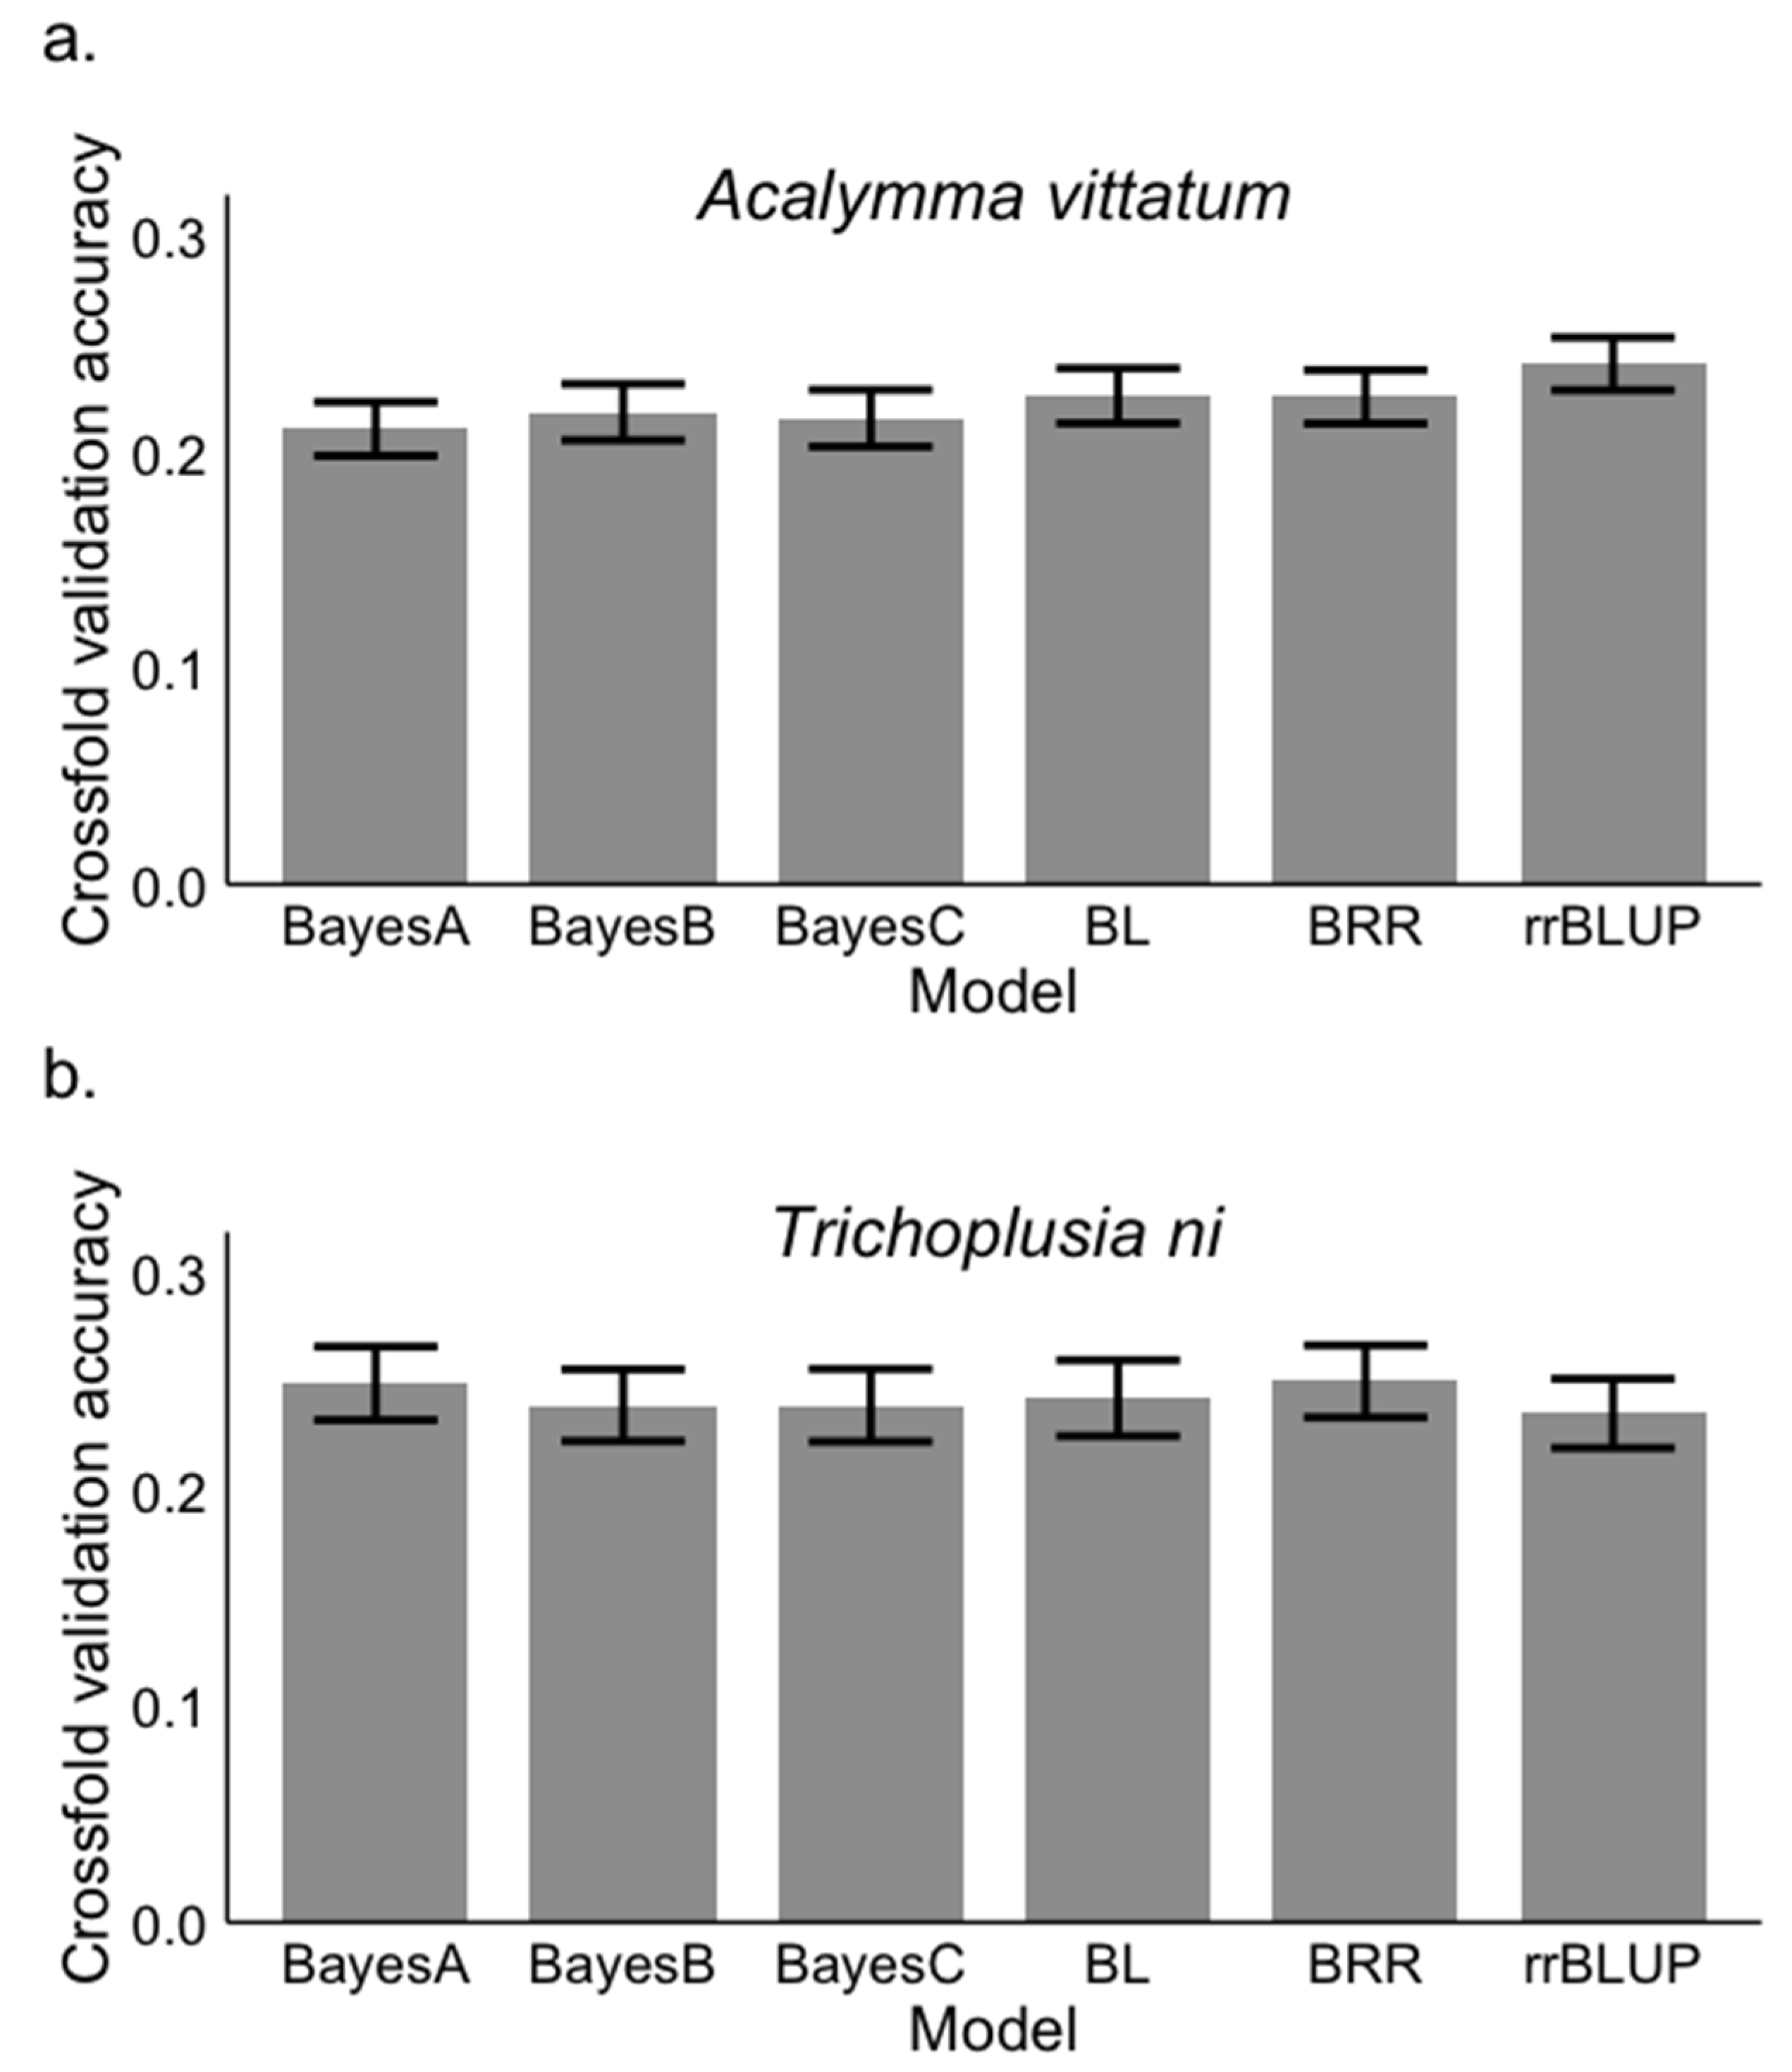
Different statistical methods for creating genomic selection models had similar cross-fold validation accuracies (Figure 3), and thus GBLUP (equivalent to rrBLUP when the genomic relationship matrix is used [41]) was chosen for future selection. Predictive ability was similar between the models derived from each phenotype (resistance to A. vittatum: 0.248 ± 0.010; resistance to T. ni: 0.230 ± 0.018), but resistance to T. ni had higher narrow sense heritability (h2 = 0.290) than resistance to A. vittatum (h2 = 0.192).
Genomic selection was then conducted (Figure 1c), and there was population differentiation from one generation of selection (base to TniGS1: FST = 0.020; base to AvitGS1: FST = 0.031; Figure 2b). While we predicted there would be shared genetic basis between resistance to T. ni and A. vittatum, a completely different set of individuals were selected from the base population in the first generation of genomic selection, leading to population divergence (FST = 0.059).

3.4. Realized Gains for Resistance to A. vittatum and T. ni

The response to selection for increased resistance to A. vittatum was mixed. In general, there was no effect of either indirect or genomic selection, but in the second field experiment, TniGS1 and AvitGS1 sustained significantly less leaf damage than the other populations evaluated (Table 3). TniGS1 and AvitGS1 were also evaluated in the greenhouse for realized gain from selection for resistance to T. ni and there was no differentiation between either and the starting population (F2259 = 0.33, p = 0.72).

4. Discussion

Challenges associated with breeding for quantitative resistance to insect pests can be addressed in part by testing methods to increase genetic gain in a time and cost-effective manner. In this study, we evaluated new selection methods for resistance to the specialist insect pest, the striped cucumber beetle (Acalymma vittatum) in squash (Cucurbita pepo, e.g., zucchini). Using a biparental population, we conducted two generations of an indirect selection scheme using a proxy insect and genomic selection. Overall, we had moderate predictive ability from genomic selection and mixed results of realized gain from both selection schemes. This study highlights opportunities to incorporate new selection methods for insect resistance into applied breeding programs, and provides specific insights into future directions for breeding for resistance to A. vittatum.

4.1. Indirect Selection Approaches

We tested a novel indirect selection scheme by selecting C. pepo based on resistance to Trichoplusia ni, as it is highly correlated with resistance to A. vittatum at the cultivar level (rP = 0.893) [28]. Trichoplusia ni was chosen also because we predicted resistance to T. ni would have higher heritability than resistance to A. vittatum, and up to three cycles of selection per year could occur (instead of one by phenotyping A. vittatum damage in a single field season). Thus, we expected to observe gain from selection on the measured trait of resistance to T. ni and the target trait of resistance to A. vittatum. We found that there was heritable variation for resistance to T. ni and resistance increased by selection. However, contrary to our predictions, heritability of resistance to T. ni was on par with that of A. vittatum, and we did not observe strong evidence of genetic correlation and cross-resistance to A. vittatum. These results indicate that resistance to T. ni and A. vittatum likely has distinct mechanistic bases.
While this study was predicated on the phenotypic correlation between traits, future work would be more compelling if the genetic correlation was first concretely established. For instance, estimating heritability and trait covariance from phenotyping both traits in structured populations, like parent–offspring regression [11], or from investigating the underlying shared genetic basis using genotypes and phenotypes with structural equation modeling [42]. Then, knowing those components, the likelihood of success from selecting upon the correlated trait would be predictable. From the heritability estimates derived from our genotyping and phenotyping associated with genomic selection, we can now estimate that the genetic correlation would need to exceed rA > 0.8 to have the same response for correlated and direct selection for resistance to A. vittatum. So, while resistance to T ni did have slightly greater heritability than resistance to A. vittatum, it was not high enough to be productive lacking a strong genetic correlation between traits.
More broadly, indirect selection is a promising method for breeding for the emergent trait of insect resistance, but a major drawback to this approach is that the measured trait may only account for a portion of the variation in resistance to a herbivore (e.g., maysin, a defensive flavone in silk tissue of Zea mays, to corn earworm [43,44]). Our study attempted to address this shortcoming by integrating multiple potential resistance traits by selecting with a proxy insect, and is the first of its kind to our knowledge. A critique may be to instead use insects more closely related to each other than those used in our work. While both A. vittatum and T. ni share a feeding guild, and thus are exposed to similar chemistry and defense signaling as compared to insects across guilds [45], A. vittatum has developed specialized metabolism to counter defenses of Cucurbitaceae plants while the generalist T. ni has not [46]. Thus, we may expect that employing organisms more closely related to A. vittatum such as other Cucurbitaceae specialist beetles would have likely greater genetic correlation. However, the drawback of using other specialized beetles is that they share similar barriers to genetic gain (e.g., ease of phenotyping) as A. vittatum; in contrast, experimenting with use of T. ni as a proxy eliminated some of those barriers.

4.2. Genomic Selection Approaches

We also applied genomic selection, a method that can be especially important for phenotypes that are difficult or expensive to measure [15,16], but has only been evaluated in one other instance for insect resistance [18]. Our genomic predictive abilities were moderate and realized gains were mixed, and several factors would have likely led to more successful outcomes. For instance, using replicated inbred lines instead of a segregating population as a model training population would have likely improved prediction accuracies. More broadly, while simulation studies indicate that traits with low heritability (h2 = 0.2) will still lead to realized gains by genomic selection [47], there are few studies that report empirical data [48]. In the studies that have reported realized gains for quantitative traits (nutritional quality [49] and disease resistance [50]), trait heritability has been higher (h2 > 0.4).

4.3. Insights into Mechanisms of Resistance to A. vittatum and Future Breeding Directions

While the motivation of this study was to evaluate different selection methods, our observations will influence future efforts to phenotype resistance to leaf damage by A. vittatum. In the A. vittatum training population, we measured leaf damage by estimated percent damage rating, measured percent damage, and amount of tissue consumed. The results demonstrated that measuring the exact percent damage dramatically increased heritability, even though measured percent damage is highly correlated with estimates, and estimates reliably distinguish differences in damage at the cultivar level [22,23]. As percent leaf area consumed is also the metric associated with economic loss [24], it may be worthwhile for plant breeders to invest in precision phenotyping for this trait.
This work has also provided insight into mechanisms of A. vittatum host choice and resistance. Leaf volume consumed and feeding efficiency are often important indicators of food quality for insect herbivores [51], but we found that total leaf tissue area consumed by A. vittatum was not a heritable trait. Intriguingly, we also previously found that T. ni did not differ in feeding efficiency across C. pepo cultivars [28]. Instead, given that percent damage was heritable indicates that visual cues like green leaf area or contrast may be important for host choice in A. vittatum, as it is for other Chrysomelid beetles [52]. Additional support for the importance of visual cues in host choice is that A. vittatum does not demonstrate host preference when plants are visually masked [25]. Nonetheless, continued work to identify mechanisms of resistance to A. vittatum in C. pepo leaves, including through application of transcriptomics and non-targeted metabolomic assays, is critical. Such mechanisms could then become candidates for indirect selection or integrated into a multi-trait genomic selection scheme, as it has been shown to increase genomic prediction accuracies for insect resistance [18].

5. Conclusions

In summary, we tested two selection strategies to accelerate genetic gain in improving C. pepo resistance to A. vittatum. Both indirect and genomic selection schemes decreased the breeding cycle length and had moderate predictive abilities, but had mixed realized gains from selection. While genomic selection model training could be improved through more precise phenotyping (e.g., of inbred lines) and realized gains may be evident in inbred lines derived from segregating populations instead of the populations themselves, this study nonetheless provides an example of applying new selection techniques and evaluating empirical results in an applied breeding program, and motivates further work to elucidate molecular mechanisms of pest resistance. Overall, improving resistance to insect pests is a persistent challenge for plant breeding, and implementing selection methods that reduce breeding cycle duration may be a productive approach for improving genetic gain.

Author Contributions

Conceptualization, L.J.B. and M.M.; methodology, formal analysis; investigation, writing—original draft preparation, L.J.B. All authors have read and agreed to the published version of the manuscript.

Funding

This work was supported by the United States Department of Agriculture (USDA) National Institute of Food and Agriculture Predoctoral Fellowship (2018-67011-28001) to L.J.B. L.J.B. was supported by a Seed Matters Graduate Student Fellowship (2015–2020).

Acknowledgments

We thank the Mazourek lab staff, especially Jonathan Vantman for assistance with field work, Ping Wang and Wendy Kain for kindly providing Trichoplusia ni eggs, and the Cornell University Agricultural Experiment Station greenhouse staff for providing excellent care of plant material. Early drafts of this manuscript were improved by constructive feedback by members of the Mazourek lab.

Conflicts of Interest

L.J.B. declares no conflict of interest. M.M. is the co-founder of Row 7, an organic seed company.

References

  1. Mitchell, C.; Brennan, R.M.; Graham, J.; Karley, A.J. Plant Defense against Herbivorous Pests: Exploiting Resistance and Tolerance Traits for Sustainable Crop Protection. Front. Plant Sci. 2016, 7, 1–8. [Google Scholar] [CrossRef] [Green Version]
  2. Smith, C.M.; Clement, S.L. Molecular bases of plant resistance to arthropods. Annu. Rev. Entomol. 2012, 57, 309–328. [Google Scholar] [CrossRef]
  3. Stuart, J. Insect effectors and gene-for-gene interactions with host plants. Curr. Opin. Insect Sci. 2015, 9, 56–61. [Google Scholar] [CrossRef]
  4. Kliebenstein, D.J. Quantitative Genetics and Genomics of Plant Resistance to Insects. Annu. Plant Rev. Online 2017, 47, 235–262. [Google Scholar] [CrossRef]
  5. Lush, J. Animal Breeding; Collegiate Press: Ames, IA, USA, 1937. [Google Scholar]
  6. Cobb, J.N.; DeClerck, G.; Greenberg, A.; Clark, R.; McCouch, S. Next-generation phenotyping: Requirements and strategies for enhancing our understanding of genotype-phenotype relationships and its relevance to crop improvement. Theor. Appl. Genet. 2013, 126, 867–887. [Google Scholar] [CrossRef] [Green Version]
  7. Widstrom, N.W.; Snook, M.E. Recurrent selection for maysin, a compound in maize silks, antibiotic to earworm. Plant Breed. 2001, 120, 357–359. [Google Scholar] [CrossRef]
  8. Ben-Mahmoud, S.; Smeda, J.R.; Chappell, T.M.; Stafford-Banks, C.; Kaplinsky, C.H.; Anderson, T.; Mutschler, M.A.; Kennedy, G.G.; Ullman, D.E. Acylsugar amount and fatty acid profile differentially suppress oviposition by western flower thrips, frankliniella occidentalis, on tomato and interspecific hybrid flowers. PLoS ONE 2018, 13, e0201583. [Google Scholar] [CrossRef] [PubMed]
  9. Moore, V.M.; Tracy, W.F. Recurrent Full-sib Family Selection for Husk Extension in Sweet Corn. J. Am. Soc. Hortic. Sci. 2019, 144, 63–69. [Google Scholar] [CrossRef] [Green Version]
  10. Berzonsky, W.A.; Ding, H.; Haley, S.D.; Harris, M.O.; Lamb, R.J.; McKenzie, R.I.; Ohm, H.W.; Patterson, F.L.; Peairs, F.B.; Porter, D.R.; et al. Breeding Wheat for Resistance to Insects. In Plant Breeding Reviews; Janick, J., Ed.; John Wiley & Sons: Hoboken, NJ, USA, 2003; Volume 22, pp. 221–230. ISBN 0-471-21541-4. [Google Scholar]
  11. Falconer, D.S.; MacKay, T.F. Correlated Characters. In Introduction to Quantitative Genetics; Longmans Green: Harlow, UK, 1996; pp. 312–334. [Google Scholar]
  12. Eberhart, S.A. Factors effecting efficiencies of breeding methods. African Soils 1970, 15, 655–680. [Google Scholar]
  13. Cobb, J.N.; Juma, R.U.; Biswas, P.S.; Arbelaez, J.D.; Rutkoski, J.; Atlin, G.; Hagen, T.; Quinn, M.; Ng, E.H. Enhancing the rate of genetic gain in public-sector plant breeding programs: Lessons from the breeder’s equation. Theor. Appl. Genet. 2019, 132, 627–645. [Google Scholar] [CrossRef] [PubMed] [Green Version]
  14. Heffner, E.L.; Sorrells, M.E.; Jannink, J.L. Genomic selection for crop improvement. Crop Sci. 2009, 49, 1–12. [Google Scholar] [CrossRef]
  15. Heslot, N.; Jannink, J.-L.; Sorrells, M.E. Perspectives for Genomic Selection Applications and Research in Plants. Crop Sci. 2015, 55, 1. [Google Scholar] [CrossRef]
  16. Bhat, J.A.; Ali, S.; Salgotra, R.K.; Mir, Z.A.; Dutta, S.; Jadon, V.; Tyagi, A.; Mushtaq, M.; Jain, N.; Singh, P.K.; et al. Genomic selection in the era of next generation sequencing for complex traits in plant breeding. Front. Genet. 2016, 7, 1–11. [Google Scholar] [CrossRef] [PubMed] [Green Version]
  17. Crossa, J.; Pérez-Rodríguez, P.; Cuevas, J.; Montesinos-López, O.; Jarquín, D.; de los Campos, G.; Burgueño, J.; González-Camacho, J.M.; Pérez-Elizalde, S.; Beyene, Y.; et al. Genomic Selection in Plant Breeding: Methods, Models, and Perspectives. Trends Plant Sci. 2017, 22, 961–975. [Google Scholar] [CrossRef] [PubMed]
  18. Lenz, P.R.N.; Nadeau, S.; Mottet, M.; Perron, M.; Isabel, N.; Beaulieu, J.; Bousquet, J. Multi-trait genomic selection for weevil resistance, growth, and wood quality in Norway spruce. Evol. Appl. 2019, 76–94. [Google Scholar] [CrossRef] [Green Version]
  19. Metcalf, R.L.; Metcalf, E.R. Diabroticite rootworm beetles. In Plant kairomones in Insect Ecology and Control; Miller, T.A., van Emden, H.F., Eds.; Chapman & Hall: New York, NY, USA, 1992; pp. 64–108. [Google Scholar]
  20. Rand, R.V. Transmission and control of bacterial wilt of cucurbits. J. Agric. Res. 1916, 6, 417–434. [Google Scholar]
  21. Gergerich, R.C.; Scott, H.A.; Fulton, J.P. Evaluation of Diabrotica beetles as vectors of plant viruses. In Methods for the Study of Pest Diabrotica; Krysan, J.L., Miller, T.A., Eds.; Springer: New York, NY, USA, 1986; pp. 227–250. [Google Scholar]
  22. Hoffmann, M.P.; Robinson, R.W.; Kyle, M.M.; Kirkwyland, J.J. Defoliation and infestation of Cucurbita pepo genotypes by Diabroticite beetles. HortScience 1996, 31, 439–442. [Google Scholar] [CrossRef] [Green Version]
  23. Brzozowski, L.J.; Leckie, B.M.; Gardner, J.; Hoffmann, M.P.; Mazourek, M. Cucurbita pepo subspecies delineates striped cucumber beetle (Acalymma vittatum) preference. Hortic. Res. 2016, 3, 16028. [Google Scholar] [CrossRef] [Green Version]
  24. Hoffmann, M.P.; Ayyappath, R.; Gardner, J. Effect of striped cucumber beetle (Coleoptera: Chrysomelidae) foliar feeding on pumpkin yield. J. Entomol. Sci. 2003, 38, 439–448. [Google Scholar] [CrossRef]
  25. Smyth, R.R.; Hoffmann, M.P. A male-produced aggregation pheromone facilitating Acalymma vittatum [F.] (Coleoptera: Chrysomelidae) early-season host plant colonization. J. Insect Behav. 2003, 16, 347–359. [Google Scholar] [CrossRef]
  26. Metcalf, R.L.; Metcalf, R.A.; Rhodes, A.M. Cucurbitacins as kairomones for diabroticite beetles. Proc. Natl. Acad. Sci. USA 1980, 77, 3769–3772. [Google Scholar] [CrossRef] [PubMed] [Green Version]
  27. Metcalf, R.L.; Rhodes, A.M.; Metcalf, R.A.; Ferguson, J.; Metcalf, E.R.; Lu, P. Cucurbitacin contents and Diabroticite (Coleoptera: Chrysomelidae) feeding upon Cucurbita ssp. Environ. Entomol. 1982, 11, 931–937. [Google Scholar] [CrossRef]
  28. Brzozowski, L.J.; Mazourek, M.; Agrawal, A.A. Mechanisms of Resistance to Insect Herbivores in Isolated Breeding Lineages of Cucurbita pepo. J. Chem. Ecol. 2019, 45, 313–325. [Google Scholar] [CrossRef] [PubMed]
  29. Theis, N.; Barber, N.A.; Gillespie, S.D.; Hazzard, R.V.; Adler, L.S. Attracting mutualists and antagonists: Plant trait variation explains the distribution of specialist floral herbivores and pollinators on crops and wild gourds. Am. J. Bot. 2014, 101, 1–9. [Google Scholar] [CrossRef] [PubMed] [Green Version]
  30. Sutherland, D.W.S.; Greene, G.L. Suppression and Management of Cabbage Looper Populations. USDA Tech. Bull. 1984, 1684, 1–13. [Google Scholar]
  31. Hernandez, C.; Wyatt, L.E.; Mazourek, M. Genomic Prediction and Selection for Fruit Traits in Winter Squash. Submitted.
  32. Schneider, C.A.; Rasband, W.S.; Eliceiri, K.W. NIH Image to ImageJ: 25 years of image analysis. Nat. Methods 2012, 9, 671–675. [Google Scholar] [CrossRef]
  33. Garrick, D.J.; Taylor, J.F.; Fernando, R.L. Deregressing estimated breeding values and weighting information for genomic regression analyses. Genet. Sel. Evol. 2009, 41, 1–8. [Google Scholar] [CrossRef] [Green Version]
  34. Montero-Pau, J.; Blanca, J.; Bombarely, A.; Ziarsolo, P.; Esteras, C.; Martí-Gómez, C.; Ferriol, M.; Gómez, P.; Jamilena, M.; Mueller, L.; et al. De novo assembly of the zucchini genome reveals a whole-genome duplication associated with the origin of the Cucurbita genus. Plant Biotechnol. J. 2018, 16, 1161–1171. [Google Scholar] [CrossRef] [Green Version]
  35. Glaubitz, J.C.; Casstevens, T.M.; Lu, F.; Harriman, J.; Elshire, R.J.; Sun, Q.; Buckler, E.S. TASSEL-GBS: A high capacity genotyping by sequencing analysis pipeline. PLoS ONE 2014, 9, e90346. [Google Scholar] [CrossRef]
  36. Danecek, P.; Auton, A.; Abecasis, G.; Albers, C.A.; Banks, E.; DePristo, M.A.; Handsaker, R.E.; Lunter, G.; Marth, G.T.; Sherry, S.T.; et al. The variant call format and VCFtools. Bioinformatics 2011, 27, 2156–2158. [Google Scholar] [CrossRef]
  37. Fragoso, C.A.; Heffelfinger, C.; Zhao, H.; Dellaporta, S.L. Imputing genotypes in biallelic populations from low-coverage sequence data. Genetics 2016, 202, 487–495. [Google Scholar] [CrossRef] [PubMed]
  38. Mohammadi, M.; Tiede, T.; Smith, K.P. PopVar: A Genome-Wide Procedure for Predicting Genetic Variance and Correlated Response in Biparental Breeding Populations. Crop Sci. 2015, 55, 2068–2077. [Google Scholar] [CrossRef]
  39. R Core Team. R: A Language and Environment for Statistical Computing; R Foundation for Statistical Computing: Vienna, Austria, 2016. [Google Scholar]
  40. Bates, D.; Maechler, M.; Bolker, B.; Walker, S. Fitting Linear Mixed-Effects Models Using lme4. J. Stat. Softw. 2015, 67, 1–48. [Google Scholar] [CrossRef]
  41. Clark, S.A.; van der Werf, J. Genomic Best Linear Unbiased Prediction (gBLUP) for the Estimation of Genomic Breeding Values. In Genome-Wide Association Studies and Genomic Prediction. Methods in Molecular Biology (Methods and Protocols); Gondro, C., van der Werf, J., Hayes, B., Eds.; Humana Press: Totowa, NJ, USA, 2013. [Google Scholar]
  42. Li, R.; Tsaih, S.W.; Shockley, K.; Stylianou, I.M.; Wergedal, J.; Paigen, B.; Churchill, G.A. Structural model analysis of multiple quantitative traits. PLoS Genet. 2006, 2, 1046–1057. [Google Scholar] [CrossRef] [PubMed]
  43. Byrne, P.F.; McMullen, M.D.; Wiseman, B.R.; Snook, M.E.; Musket, T.A.; Theuri, J.M.; Widstrom, N.W.; Coe, E.H. Maize silk maysin concentration and corn earworm antibiosis: QTLS and genetic mechanisms. Crop Sci. 1998, 38, 461–471. [Google Scholar] [CrossRef]
  44. Lee, E.A.; Byrne, P.F.; McMullen, M.D.; Snook, M.E.; Wiseman, B.R.; Widstrom, N.W.; Coe, E.H. Genetic mechanisms underlying apimaysin and maysin synthesis and corn earworm antibiosis in maize (Zea mays L.). Genetics 1998, 149, 1997–2006. [Google Scholar] [PubMed]
  45. Howe, G.A.; Jander, G. Plant Immunity to Insect Herbivores. Annu. Rev. Plant Biol. 2008, 59, 41–66. [Google Scholar] [CrossRef] [Green Version]
  46. Ali, J.G.; Agrawal, A.A. Specialist versus generalist insect herbivores and plant defense. Trends Plant Sci. 2012, 17, 293–302. [Google Scholar] [CrossRef] [PubMed]
  47. Bernardo, R.; Yu, J. Prospects for genomewide selection for quantitative traits in maize. Crop Sci. 2007, 47, 1082–1090. [Google Scholar] [CrossRef] [Green Version]
  48. Voss-Fels, K.P.; Cooper, M.; Hayes, B.J. Accelerating crop genetic gains with genomic selection. Theor. Appl. Genet. 2019, 132, 669–686. [Google Scholar] [CrossRef] [PubMed]
  49. Asoro, F.G.; Newell, M.A.; Beavis, W.D.; Scott, M.P.; Tinker, N.A.; Jannink, J.L. Genomic, marker-assisted, and pedigree-BLUP selection methods for β-glucan concentration in elite oat. Crop Sci. 2013, 53, 1894–1906. [Google Scholar] [CrossRef] [Green Version]
  50. Rutkoski, J.; Singh, R.P.; Huerta-Espino, J.; Bhavani, S.; Poland, J.; Jannink, J.L.; Sorrells, M.E. Genetic Gain from Phenotypic and Genomic Selection for Quantitative Resistance to Stem Rust of Wheat. Plant Genome 2015, 8, 1–10. [Google Scholar] [CrossRef] [Green Version]
  51. Mattson, W.J. Herbivory in Relation to Plant Nitrogen Content. Annu. Rev. Ecol. Syst. 1980, 11, 119–161. [Google Scholar] [CrossRef]
  52. Fernandez, P.; Hilker, M. Host plant location by Chrysomelidae. Basic Appl. Ecol. 2007, 8, 97–116. [Google Scholar] [CrossRef]
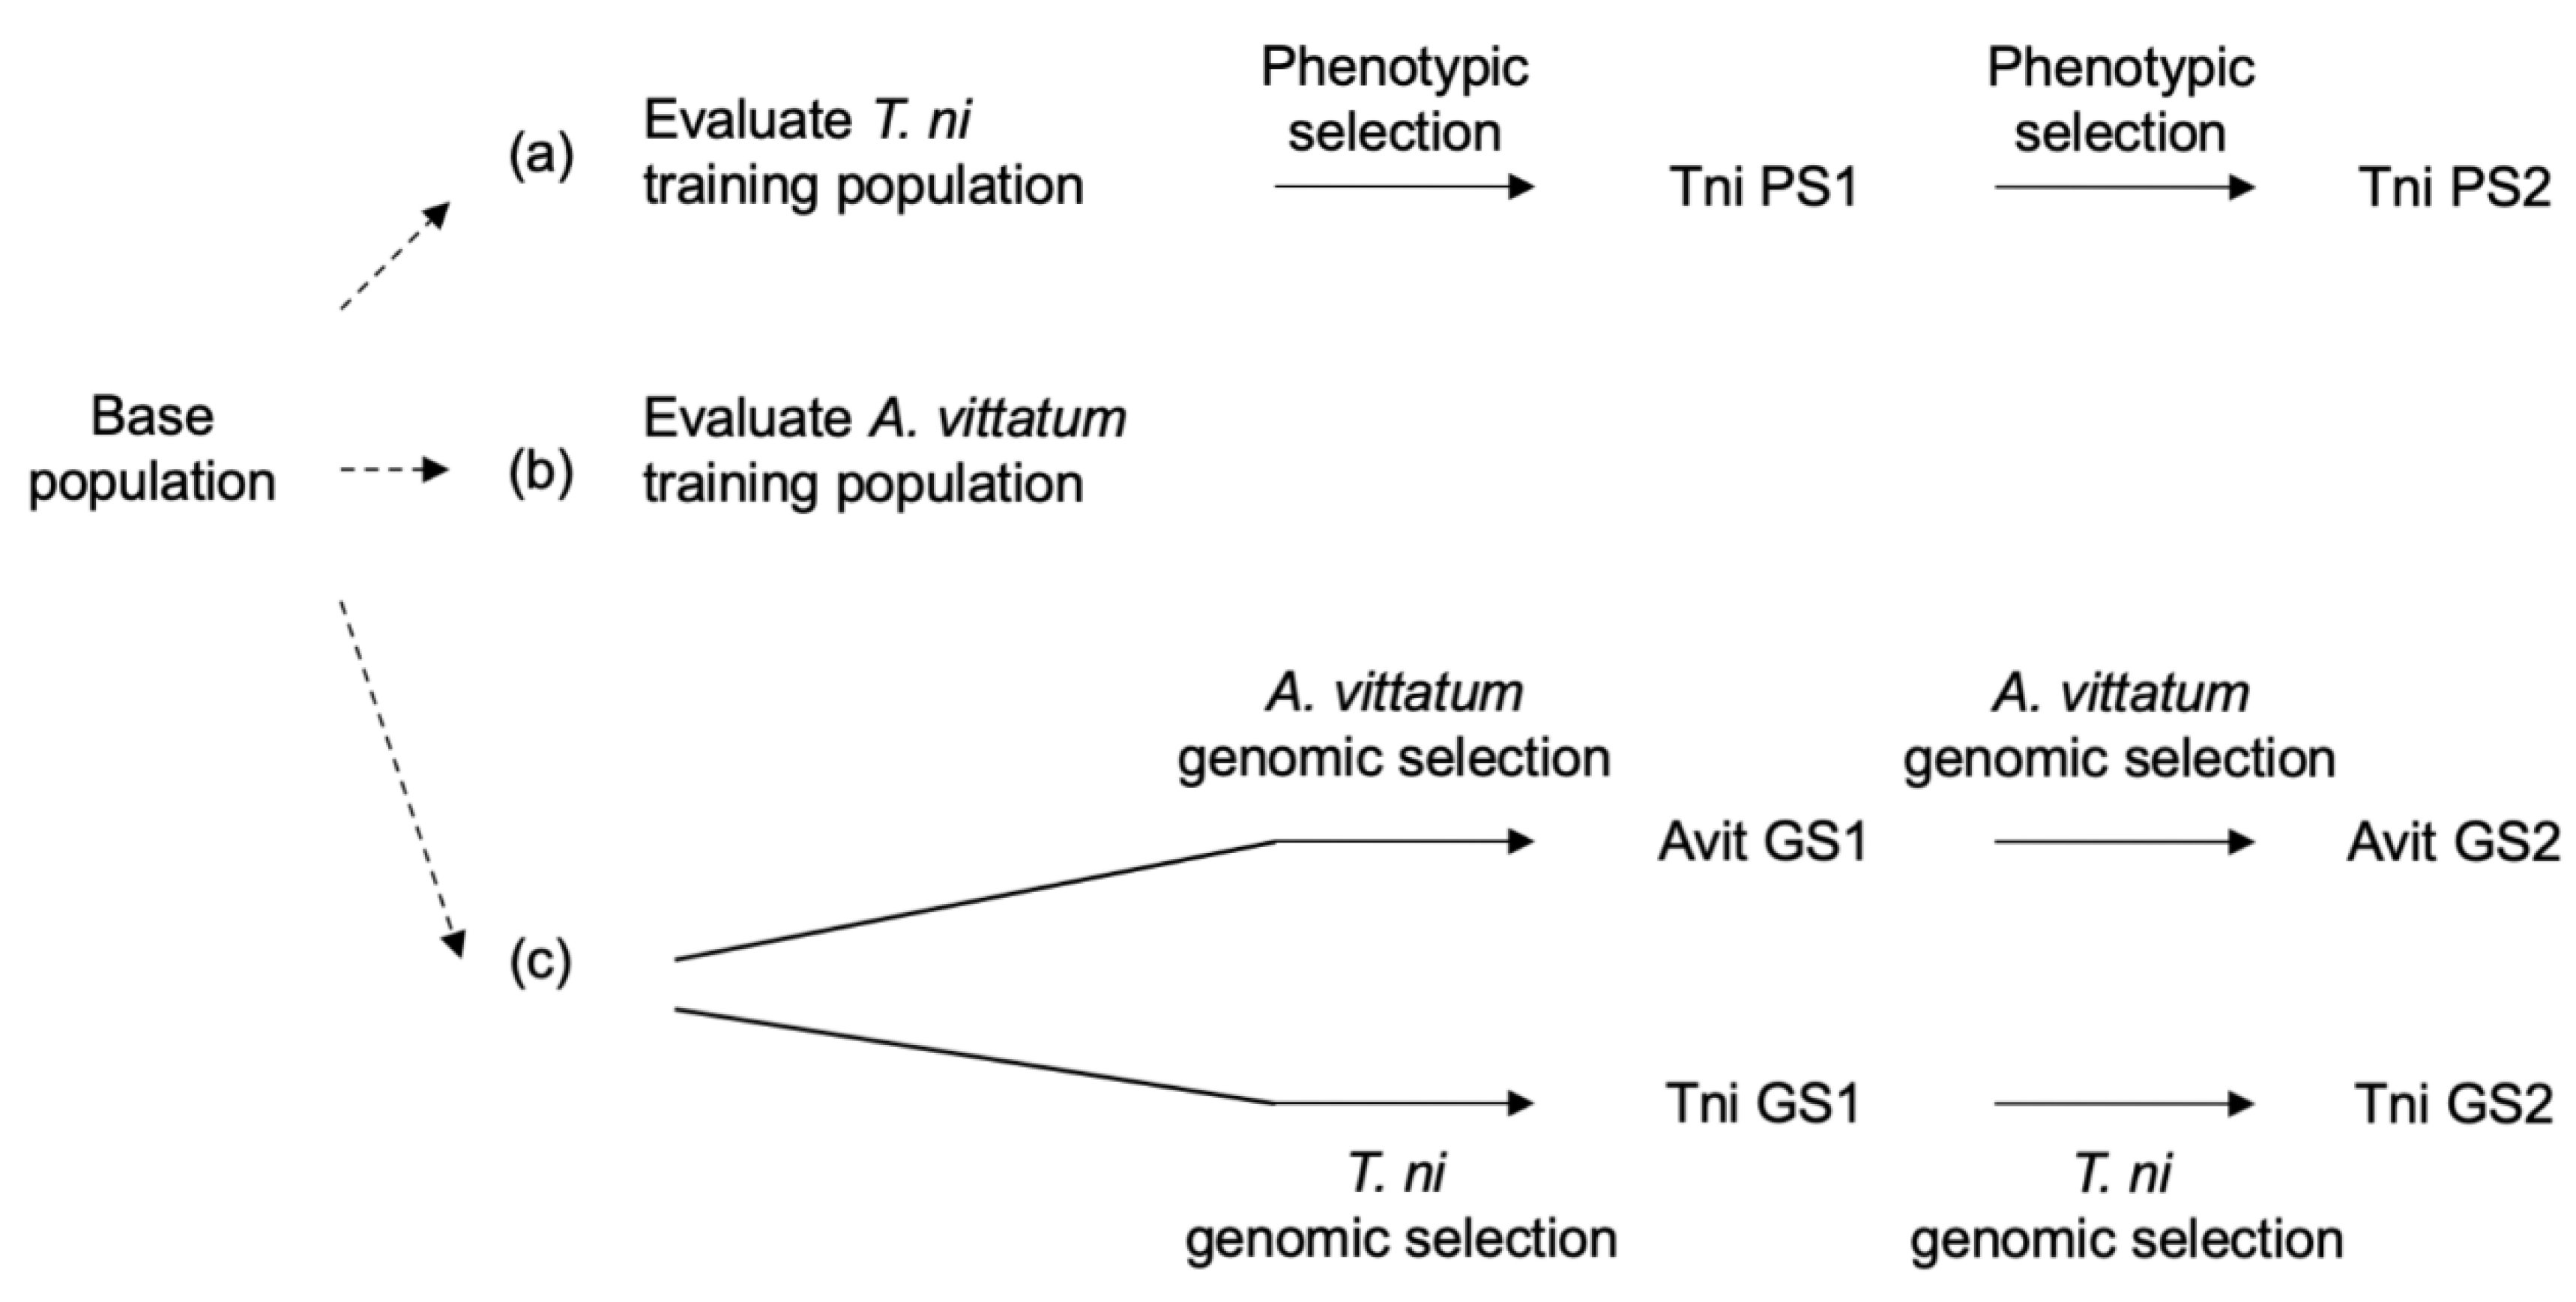
Figure 1. Diagram of selection schemes. The (a) T. ni training population and starting material for the indirect selection scheme, (b) A. vittatum training population, and (c) starting material for the genomic selection schemes were sourced from the base population. The dashed arrows represent source of germplasm, and the solid arrows represent a generation of selection. The type of selection is described above the solid arrows.
Agronomy 10 00847 g001
Figure 2. Principal component analyses (PCA) plots from genome-wide SNP marker matrix for genomic selection (a) training populations and (b) after one generation of selection (“GS1”). The percent variation explained by the first two principal components are given on the x- and y-axis respectively. The points representing the resistant (“R_parent”) and susceptible parent (“S_parent”) are triangle shaped and the points representing the base population (“BasePop”), A. vittatum and T. ni training and genomic selection populations are red and blue circles, respectively. Ellipses represent normal confidence intervals for each group.
Agronomy 10 00847 g002
Figure 3. Comparison of different genomic selection models for training population cross-fold validation accuracy for resistance to (a) Acalymma vittatum and (b) Trichoplusia ni. The model abbreviations are as follows: “BL” is Bayesian Lasso, “BRR” is Bayesian Ridge Regression, and rrBLUP is a ridge-regression best linear unbiased predictor (BLUP), which is equivalent to GBLUP. The error bars represent one standard error.
Agronomy 10 00847 g003
Table 1. Trichoplusia ni mass in each generation of indirect selection where lower mass indicates increased resistance. µ0 refers to the mean of the evaluated population, µselected refers to the mean of selected individuals, and H2 is the broad sense heritability on a plot basis.
GenerationAs % Less than Mid-ParentAs % Less than High ParentH2
µ0µselectedµ0µselected
Generation 1 (Base → TniPS1)1.04%27.60%23.69%44.18%0.228
Generation 2 (TniPS1 → TniPS2)18.81%59.40%46.25%73.12%0.289
Table 2. Training population phenotypes where H2 refers to broad sense heritability on a plot basis from phenotypes alone (genomic data not incorporated).
Training PopulationPhenotypeH2
Acalymma vittatumEstimated percent leaf damage (%)0.066
Measured percent leaf damage (%)0.369
Log(Measured leaf damage)0.314
Measured total damage (cm2)0
Trichoplusia niLarvae mass0.228
Table 3. Realized response of resistance to A. vittatum (measured percent leaf damage) to selected populations in field. Values with different letters in the same experiment indicate significant differences as determined by the Tukey–Kramer honest significant difference test (p < 0.05).
ExperimentPopulationDamage (%) SE Statistics
June 2019Base12.05±2.90aF4,386 = 1.008 p = 0.403
TniPS114.71±2.90a
TniPS214.79±2.90a
TniGS111.85±2.90a
AvitGS114.35±2.90a
August 2019Base30.94±5.07bF4,388 = 9.496 p < 0.001
TniGS117.32±5.07a
TniGS232.60±5.06b
AvitGS114.98±5.06a
AvitGS222.98±5.06ab