Article

Weed Management in the Transition to Conservation Agriculture: Farmers’ Response

Agroécologie, AgroSup Dijon, INRAE, Univ. Bourgogne, Univ. Bourgogne Franche-Comté, F-21000 Dijon, France
*
Author to whom correspondence should be addressed.
Agronomy 2020, 10(6), 843; https://doi.org/10.3390/agronomy10060843
Submission received: 8 May 2020 / Revised: 8 June 2020 / Accepted: 9 June 2020 / Published: 13 June 2020
(This article belongs to the Special Issue Conservation Agriculture and Agroecological Weed Management)

Abstract

:
Recently adopted in France, conservation agriculture still faces some challenges to its adoption, particularly weed management. To highlight the weed management practices used by farmers in conservation agriculture and the changes induced by its adoption, a large sample of 425 French farmers were invited to complete an online survey. Weed management practices used by farmers were requested for three periods: before adoption, during the first years of conservation agriculture (one to two years after adoption), and when the agricultural system is considered “mastered” by the farmer. The use of each farming practice was firstly studied independently for each period. Then, a multiple correspondence analysis followed by a hierarchical ascendant classification resulted in groups of farmers with different combinations of practices for each period. Finally, the groups of farmers were followed through the periods. Results showed that changes in weed management done according to farmers when adopting and mastering conservation agriculture are multiple and vary according to farmers and their previous weed management. Although some similar choices were identified, some farmers’ trajectories, especially those with a prior combination driven by either a soil disturbance strategy or a crop competitiveness strategy, are difficult to identify when adopting conservation agriculture. Upon mastering the agricultural system, farmers’ choices become more apparent.

1. Introduction

Conservation agriculture (CA), as defined by Reicosky [1], is characterized by the simultaneous and continuous use of three principles: (1) minimum soil disturbance (no-tillage), (2) residue cover on the soil surface (cover crops or dead mulch), and (3) diverse crop rotations and cover crop mixes. This form of agricultural production aims to enable profitable food production while preserving and enhancing the resource base and the environment [2].
Although the principles are fixed, their application is adapted to each farm. Influenced by local conditions (pedoclimatic, socio-economic or technical) and by farmer’s wishes, each of these principles meets different objectives.
  • Some farmers reduce soil disturbances for economic benefits such as minimizing workload, fuel and machine hours spent establishing a crop [3]. For others, adoption of the principle may be motivated by environmental benefits, such as preventing and minimizing soil erosion [4] and improving soil properties [5] and biodiversity [6].
  • Maximizing soil coverage can also meet different objectives, such as protecting soil from erosion [7], fixing atmospheric nitrogen with legumes [8], reducing nitrate losses [9], improving soil porosity [10], and potentially limiting annual weed development [11].
  • Crop diversification allows for a better distribution of workload and a reduction in vulnerability to weather conditions or market prices. It also provides effective pest and disease control [12] and limits the selection of well-adapted weed species [13].
The simultaneous and continuous application of these three principles is possible in Europe since the 1970s [14] but two major challenges were met before the adoption of CA: the control of perennial weeds [14] and the lack of equipment adapted for sowing [15]. These challenges were partially resolved. Suitable seed drills were imported into Europe, and non-selective foliar herbicides (aminotriazole in 1958, paraquat in 1963, glyphosate in 1975 and glufosinate in 1986) were used to control perennial weeds [16]. With these new tools, the adoption of CA by farmers began in France in the 1990s. In 2014, CA encompassed approximately 300,000 hectares [17].
Despite the availability of herbicides with new active ingredients, weed problems remain and still represent one of the main challenges to the adoption of no-till systems for farmers [18,19]. The adoption of CA has an effect on both agronomic and ecological standpoints. From an ecological point of view, CA modifies all the usual weed selection pressures (germination conditions, modification of predation, and competition). Identified weed changes that occurred during the transition to CA may have varied from one system to another, but perennial broadleaved species and grasses appeared to be the most favored species [13,20]. In France, the same trend was observed in a one-year study [21]. From an agronomic point of view, the adoption of CA implies that farmers modify their weed management practices (absence of tillage, cover management, or crop succession strategy). Changes made by farmers when adopting CA are unclear and vary according to the previous system. The aim of this paper is to identify combinations of weed management practices chosen by farmers to manage weeds in CA. To be as representative as possible, we chose to directly survey French farmers using an online survey.

2. Materials and Methods

2.1. Questionnaire

The tracking of on-farm innovations is a concrete approach to identifying local practices [22,23,24]. This method makes it possible to gain access to a great diversity of practices used by farmers, which is more difficult to achieve through traditional methods. Because unknown farmers who may have different skills, weed acceptances, or even different opinions are targeted, the main limitation of this method is the impossibility to confirm the data.
The survey was carried out with a questionnaire focused on agronomic and weed sciences and targeted French farmers using or experienced in CA. Three parts composed the survey: (1) status before the adoption of CA (named “Before CA”); (2) status during the first years of CA (one to two years after adoption, named “Starting CA”); (3) status when the system was considered “mastered”, in reference to weed management (named “Mastered CA”). Only the farmers who considered they mastered their systems answered to the Mastered CA part and indicated the number of years it took them to master their systems. For each part, the farming practices used to manage weeds were requested. We asked farmers to answer in a way that represented all their CA fields. The proposed weed management practices referred to different strategies:
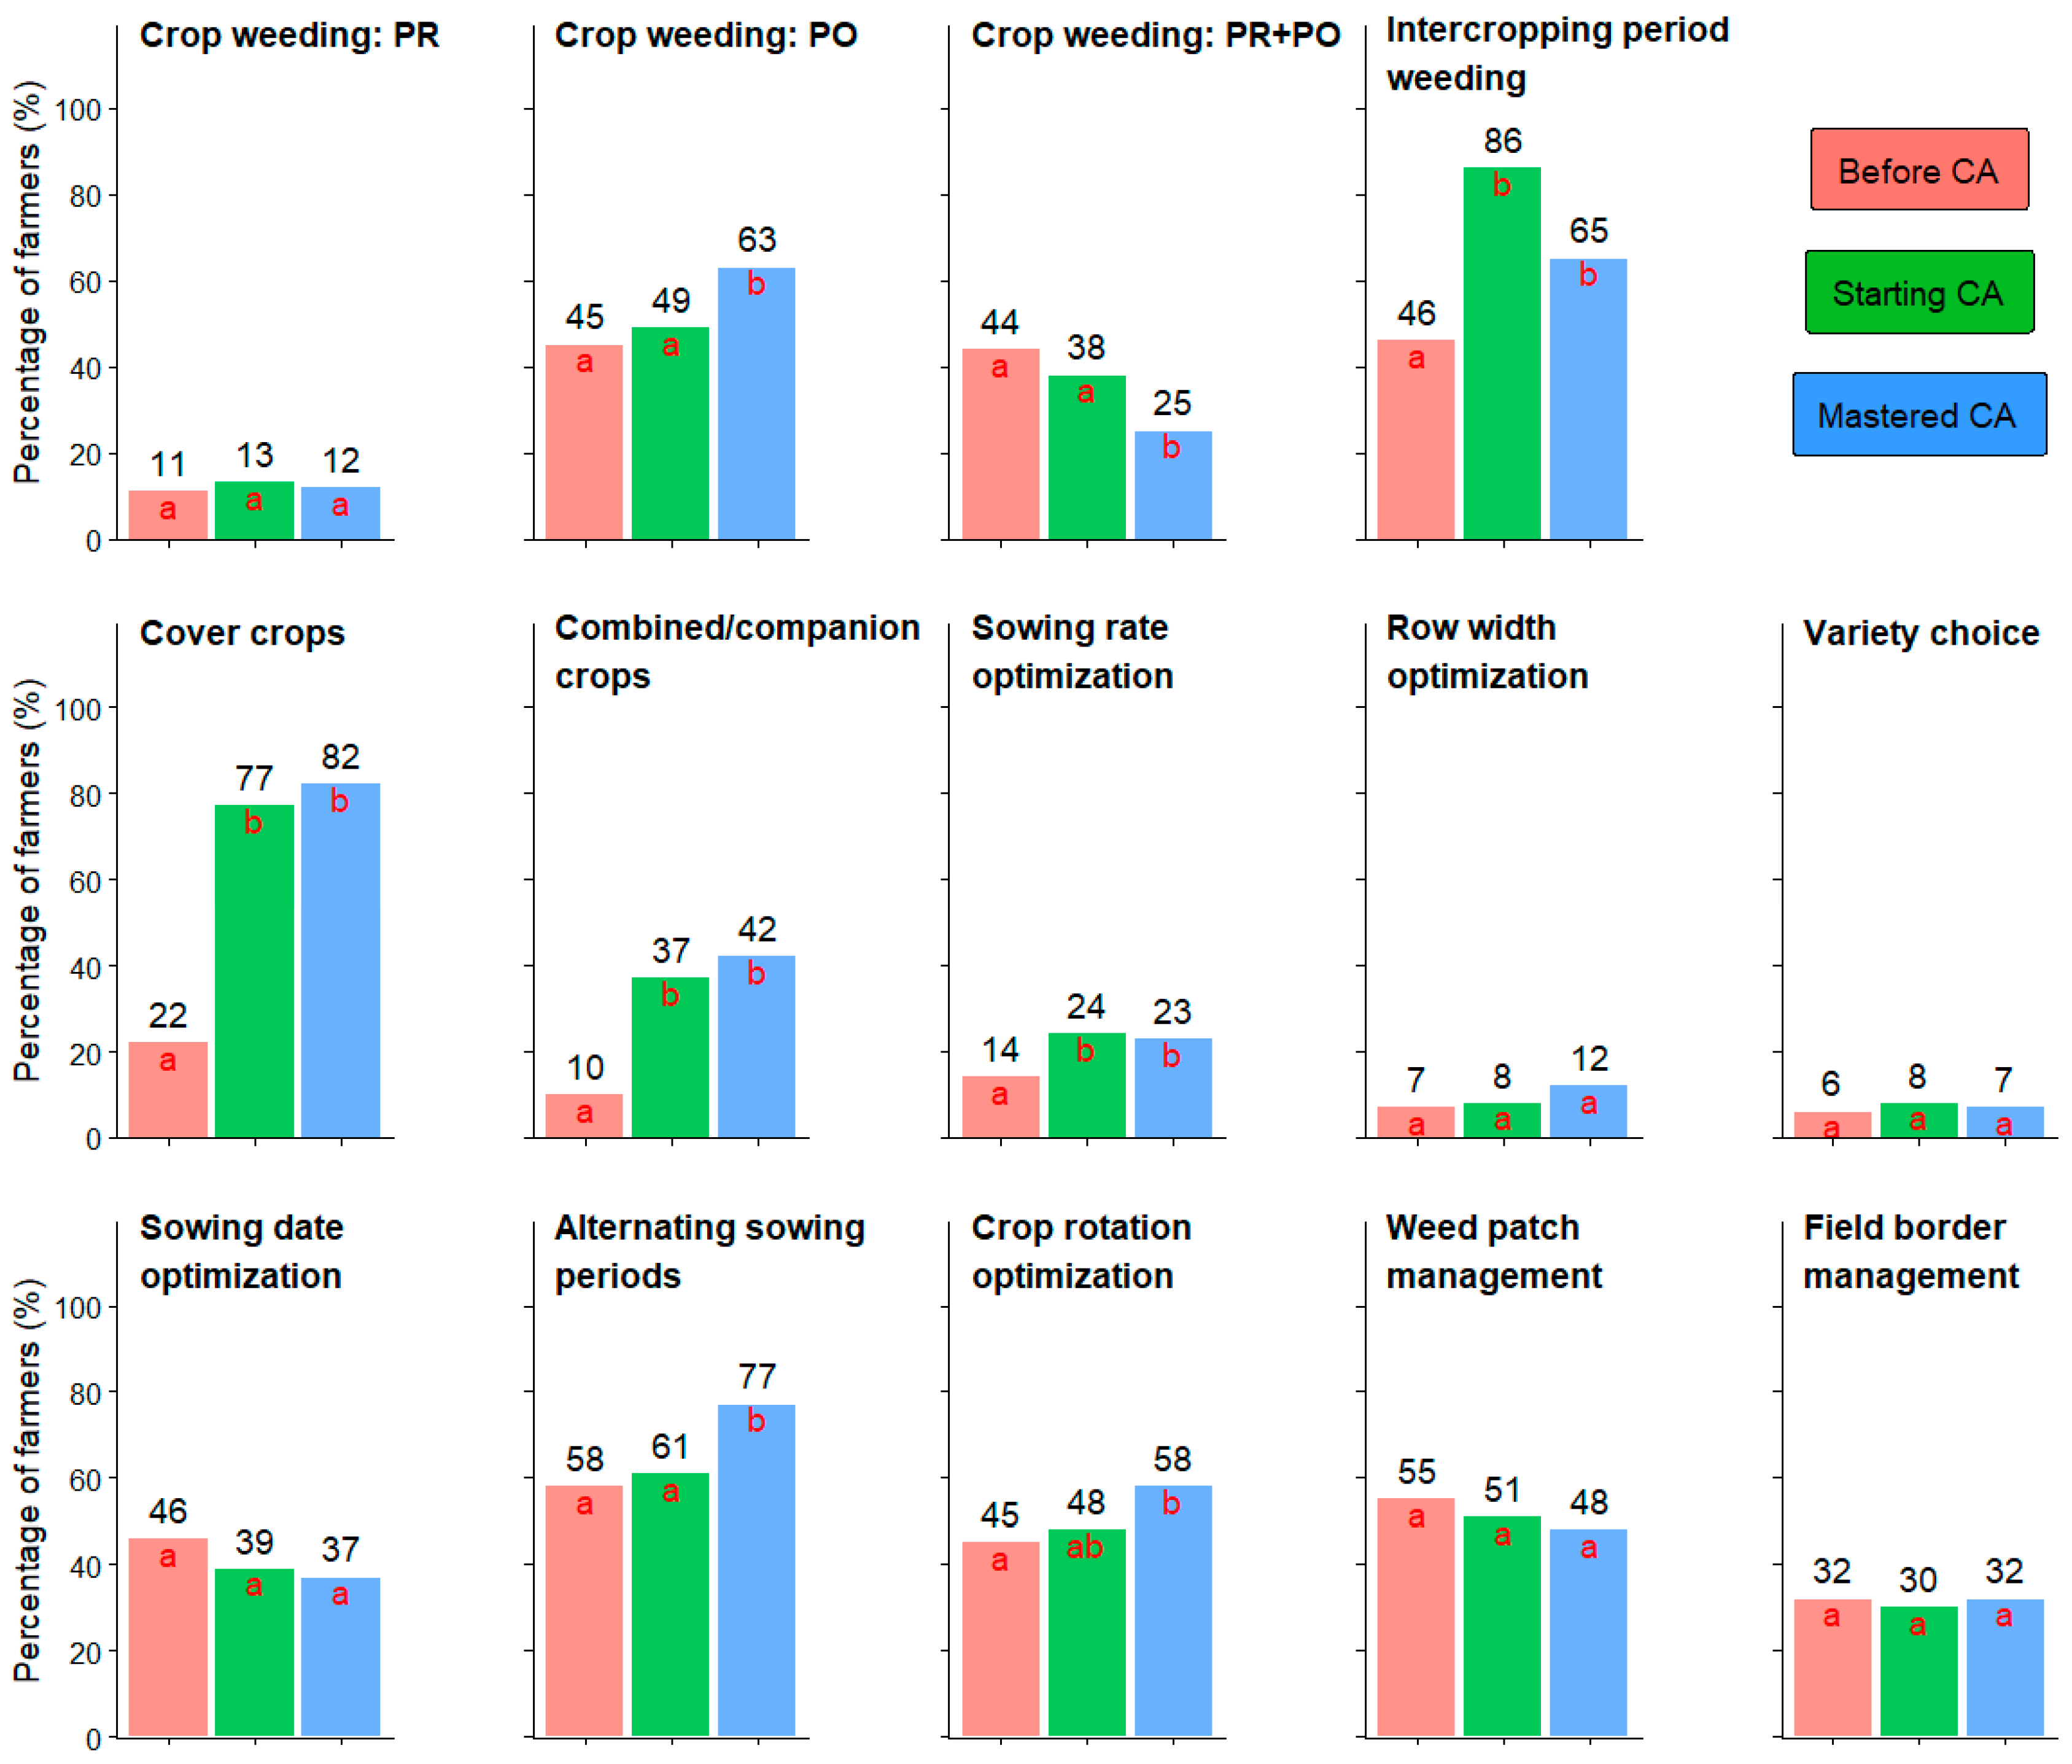
  • Soil disturbance: ploughing, stubble ploughing, stale seedbeds and mechanical weeding.
  • Chemical weeding: crop weeding and intercropping period weeding.
  • Competition by adding species: cover crops and combined/companion crops.
  • Crop competitiveness: sowing rate optimization (lower or higher), row width optimization (larger or smaller spacing) and variety choice.
  • Weed emergence avoidance: sowing date optimization (earlier or later), alternating sowing periods and crop rotation optimization.
  • spot weeding: Weed patch management and field border management (refers to the border and/or the first turn of the field).
The chemical weeding part included four possible responses: pre-emergence only, post-emergence only, pre- and post-emergence applications, or no application. All the other practices were either used or not.
The questionnaire was made available on the internet using the Lime Survey tool (https://www.limesurvey.org/fr/). Before the questionnaire was broadcast, some farmers, weed scientists, and field research technicians pretested it so as to assess its acceptability and readability. The main groups of French conservation agriculture started to distribute the questionnaire link before technical institutes and Chambers of Agriculture. Finally, the link was posted on a social network (Facebook). The survey remained online from 9 November 2018 to 4 March 2019. During this period, 425 completed French questionnaires were recorded out of 1167 connections. A total of 143 farmers completed the third part on Mastered CA.

2.2. Farm Profiles

The area surveyed by this paper reached approximately 49,500 hectares and involved all regions of France. Of the studied farms, arable crop systems represented 55%, and the rest were mixed arable-livestock systems. A high diversity of soils was present, with predominantly clay soils and loamy and silty clays and a small number of fine silty soils. Before adopting CA, 65% of farmers used simplified cultivation techniques (TCS), 31% used a ploughed system and 4% used direct sowing without cover. The adoption of CA by farmers began in 1992, but half of the adoptions took place after 2015.

2.3. Statistical Analysis

To start, the use of each weed management practice was compared independently for Before, Starting, and Mastered CA periods using a chi-square test. Then, we looked at similar combinations of practices between farmers by performing a multiple correspondence analysis (MCA) followed by a hierarchical ascendant classification (HAC) for each period. The multiple correspondence analysis was used as a pre-processing step on the categorical variables before the HAC analysis. While preserving the distance between individuals as much as possible, MCA located all the individuals as a point in a Euclidean subspace of lower dimensions. Once the coordinates of all the components were obtained, the HAC analysis aggregated the farmers into groups while minimizing the reduction in the between-inertia (Ward’s method). The final partitioning solutions were obtained after consolidation with k-means. Seven, six and five groups were retained for the Before, Starting and Mastered CA periods, respectively. In this paper, in order to describe the different groups for the three periods, the abbreviations from B1 to B7 referred to the seven groups for the Before CA period, the abbreviations from S1 to S6 referred to the six groups for the Starting CA period, and the abbreviations from M1 to M5 referred to the five groups for the Mastered CA period.
The hierarchical trees before consolidation of k-means are presented in Figures S1–S3 in Supplementary Materials. To identify the combinations of weed management practices that characterized each group, we compared the proportion of farmers that used a practice in each group with the proportion in the whole sample. Where the difference was significant, the practice discriminated the group of individuals (Vtest with p value ≤ 0.05) and was considered a characteristic of the group. All the statistical analyses were conducted using R [25] with the FactoMineR package [26]. Finally, since a group was assigned for each farmer and each period, the farmers’ trajectories were examined throughout all the periods.
Before the analysis, we removed organic farmers (“no” chemical weeding), present in the minority, (12, 14 and 6 for Before, Starting and Mastered CA periods, respectively) and farmers who indicated they re-used tillage after some years in CA (11 for Mastered CA period). For MCA, practices not used by farmers such as row width optimization and variety choice and not referring to the management within a field such as field border management, were used as supplementary variables. A new variable (“Use of practices”), referring to the number of practices used by farmers, was created and used as a supplementary variable. Sixteen practices were proposed for Before CA compared with twelve for the other periods. Three categories were created: Few (1 to 4 practices), some (5 to 8 for Before CA, 5 to 7 for the other periods), and many (9 or more for Before CA, 8 or more for the other periods).

3. Results

3.1. Weed Management Practice Use

Before adopting CA, 11% of the farmers used ploughing, 54% used stubble ploughing, 35% used stale seedbeds and 37% used mechanical weeding to control weeds. When adopting CA, as a matter of principle, the farmers abandoned all these soil disturbance practices but increased the use of other weed management practices (Figure 1). During the first years of CA, the most significant changes occurred for intercropping period practices. Applied respectively by 46% and 22% of the farmers Before CA, the use of intercropping period weeding and cover crops reached 86% and 77% in the Starting CA period. In the Mastered CA period, even with fewer farmers using intercropping period weeding (65%), the use of both practices remained similar. In the Starting CA period, other increased uses included combined/companion crops (from 10 to 37%) and sowing rate optimization (from 14 to 24%). Their use remained similar in the Mastered CA period. In contrast, the use of alternating sowing periods and crop rotation optimization was not different in the Before CA (58% and 45%) and Starting CA (61% and 48%) periods but increased in the Mastered CA period (77% and 58%). Adopting CA did not seem to modify the use of row width optimization, variety choice, sowing date optimization, weed path, and field border management. Concerning crop weeding, the use of post-emergence only application increased in the Mastered CA period at the expense of pre- and post-emergence applications. Of all the proposed weed management practices, only few farmers used row width optimization and variety choice.

3.2. Combinations of Weed Management Practices
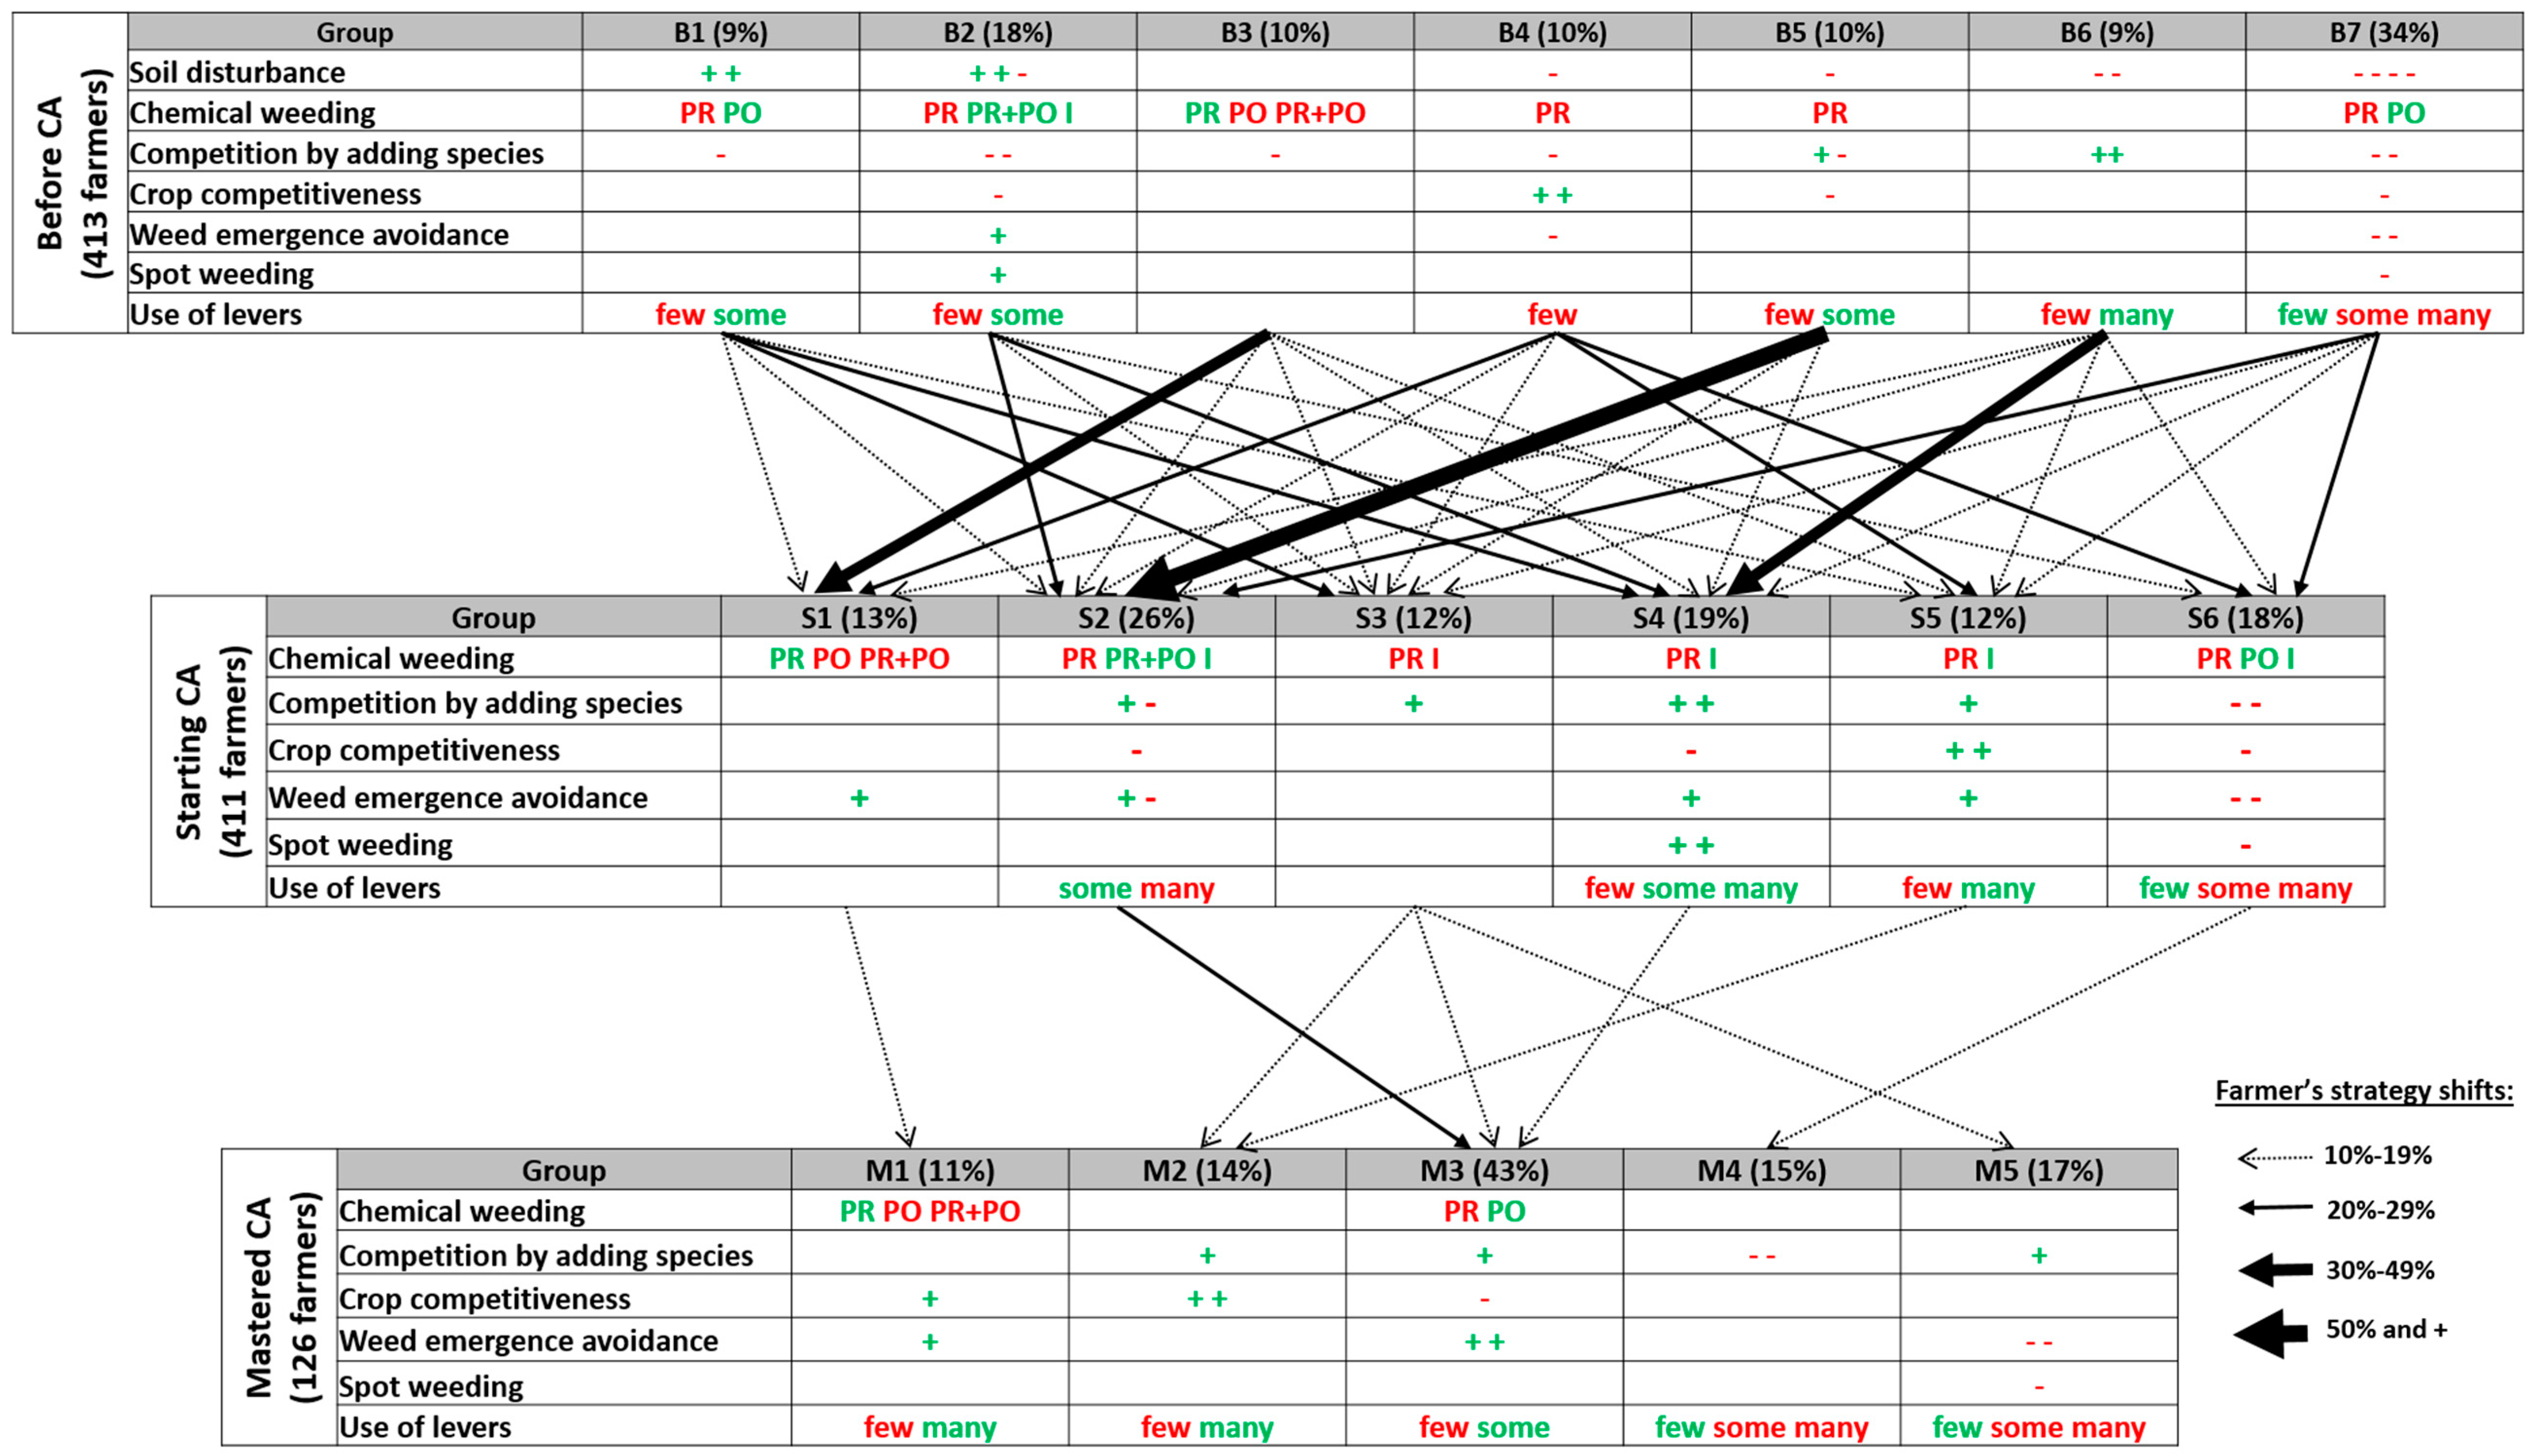
3.2.1. Before CA

The main contributing practices for partitioning the farmers in seven groups came from different strategies, such as competition by adding species (combined/companion crops and cover crops), soil disturbances (ploughing), chemical weeding (crop weeding) and crop competitiveness (sowing rate optimization).
Combinations that described groups B1 (9% of the farmers) and B2 (18%) were driven by soil disturbance practices (Table 1). In both groups, the combinations included quite a high number of practices. While B1 utilized deep and stubble ploughing, B2 excluded deep soil disturbances. Practices such as sowing rate optimization (for B2) and cover crops and combined/companion crops, which have limited compatibility with soil disturbances, were not used. Farmers from group B2 also utilized sowing date optimization to avoid weed emergence and weed patch management. While farmers from group B1 used only post-emergence application, those from B2 used pre-, post-emergence, and intercropping period application.
Soil disturbance practices did not drive the B3, B4 and B5, except for excluding ploughing (for B4 and B5). The farmers from B3 (10%) used only a pre-emergence application and excluded the use of combined/companion crops. Groups B4 (10%) and B5 (10%) regrouped the farmers with a pre- and post-emergence application or only a post-emergence application. Both groups quite mobilized a high number of practices. Farmers from group B4 focused mainly on crop competitiveness using sowing rate optimization and row width optimization but excluded some practices from competition by adding species with combined/companion crops and from weed emergence avoidance strategy by alternating sowing periods. Farmers from group B5 increased competition by adding cover crops.
The groups B6 (9%) and B7 (34%) described farmers who excluded most of the soil disturbance practices. A post-emergence application and few practices used to control weeds characterized B7. By contrast, the farmers from B6 used many practices, especially those increasing competition by adding species such as cover crops and combined/companion crops.

3.2.2. Starting CA

The main contributing practices for partitioning the farmers in six groups came from different strategies. These strategies were chemical weeding (crop weeding and intercropping period weeding), competition by adding species (cover crops, combined/companion crops) and crop competitiveness (sowing rate optimization).
Crop weeding drove groups S1, S2 and S6 (Table 2). Farmers from group S1 (13%) used only pre-emergence application and sowing date optimization. Farmers from group S2 (26%) managed weeds by pre-, post-emergence, and intercropping period application, and quite a high number of practices, including cover crops and alternating sowing periods. However, farmers from group S2 did not use crop rotation optimization, combined/companion crops and sowing rate optimization. Farmers from group S6 (18%) used post-emergence and intercropping period application and excluded most of the other practices.
Group S3 (12%) was defined by the use of cover crops during the intercropping period but excluded the use of chemical weeding during this period.
For S4 (19%) and S5 (12%), herbicides were applied during the crop cycle either pre- and post-emergence or post-emergence. They regrouped the farmers that used a high number of practices. Both groups used chemical control during the intercropping period. They completed their weed management by a strategy based on competition by adding other species and weed emergence avoidance. In addition, S4 maximized spot management through weed task and field border managements whereas S5 maximized crop competitiveness with sowing rate optimization and variety choice.

3.2.3. Mastered CA

The main contributing practices were quite similar to those of the Starting CA period. The only change was the intercropping period application, which was replaced by alternating sowing periods.
A good way to describe the five groups was to take into account the number of practices used to manage weeds. As shown on the left of Table 3, M1 (11%) and M2 (14%) used many practices. Farmers from group M1 used not only pre-emergence application but also practices used to avoid weed emergence (sowing date optimization) and to increase crop competitiveness (variety choice). Group M2 regrouped the farmers who based their weed management mainly on competition through sowing rate optimization, row width optimization, and combined/companion crops.
Group M3 was the main group (43%). This group used some practices (5 to 7) among which practices to maximize the weed emergence avoidance and cover crops. It excluded sowing rate optimization and used post-emergence application most preferentially.
Farmers from groups M4 (15%) and M5 (17%) focused their weed management on few but specific practices. Farmers from group M4 excluded practices related to competition by adding species strategy, unlike those from group M5, who used cover crops. Farmers from group M5 excluded weed emergence avoidance practices (alternating sowing date optimization and crop rotation optimization).

3.3. Farmers’ Trajectories

The farmers’ trajectories during the CA adoption process were used to determine what weed management changes occurred. In Figure 2, the main changes are represented by the largest shifts (30 to 49% of the farmers or 50% or more):
  • To maximize weed emergence avoidance through alternating sowing periods. This change appeared to be the only change occurring for the farmers using pre-emergence application (from group B3 to S1).
  • To increase the weeding times (pre-emergence, post-emergence and intercropping period) and to add a weed emergence avoidance practice (alternating sowing periods) while excluding others, such as combined/companion crops and crop rotation optimization (from B5 to S2).
  • To increase the weeding times (spot weeding and intercropping period) and to add weed emergence avoidance practice (alternating sowing periods) while excluding crop competitiveness (from B6 to S4).
For other groups, trajectories were not well identified. This means that in these initial groups the farmers did not make similar changes when adopting CA.
As some farmers just started CA, the number of farmers’ responses decreased in the analysis from 409 to 126 between the Starting and Mastered CA periods. The farmers’ trajectories are represented by shifts with lower percentages, but the main changes can still be identified (Figure 2):
  • To use many practices only while maximizing crop competitiveness (variety choice) is the change made by farmers with a pre-emergence application (from S1 to M1).
  • To maximize competition during the crop period (sowing rate optimization, row width optimization and combined/companion crops) while decreasing weed emergence avoidance (from S3 and S5 to M2).
  • To reduce weeding times (intercropping period, spot management and crop weeding) and to add practices to avoid weed emergence avoidance (alternating sowing periods and crop rotation optimization) (from S2 and S4 to M3).
  • To remove the systematic absence of intercropping period weeding while reducing chemical weeding to a post-emergence application and to maximize weed emergence avoidance (from S3 to M3).
  • To remove the systematic absence of intercropping period weeding and to exclude a weed emergence avoidance strategy (from S3 to M5).
  • To continue to use few practices while decreasing the number of practices excluded (row width optimization, alternating sowing periods, and weed patch management) (from S6 to M4).

4. Discussion

Soil disturbance practices are fundamental practices of integrated weed management [27]. In particular, they allow preventive weed management during the intercropping period both through seed burying by ploughing or the decrease in superficial viable seeds by stubble ploughing and stale seedbeds. They also allow curative management by the use of mechanical weeding. Therefore, adopting CA may deprive many farmers of effective weed management practices. Although a significant number of farmers used soil disturbance practices in the Before CA period, our results showed that only 27% of farmers based their entire weed management on soil disturbance practices. For the latter category of farmers, changes could be influenced either directly by farmers (personal wishes, habits, or equipment available) or by the social environment. In France, the adoption of CA started with some active farmers groups supported by private firms (e.g., the Brazilian company Semeato, producer of direct sowing seed drills), before being supported by research and public policies (e.g., local subsidies for equipment since 2010) [28]. Based on sharing knowledge and farmer to farmer mentoring, these active farmers groups shared this form of agricultural production across the country. Practices used to control weeds can be quite diversified and the orientations promoted or supported may have differed from one farmers group to another and may have interfered in the choice made by these farmers. The situation is quite similar for farmers who, before CA, based their weed management mainly on a crop competitiveness strategy (10%) or on the use of few practices (34%).
For 29% of the farmers, the changes made when adopting CA were more apparent. Except for the farmers who initially used pre-emergence application, an increase in the weeding times (pre- and post-emergence and intercropping period) and the addition of spot weeding were the main changes. In addition, these farmers chose to maximize weed emergence avoidance. Without any soil disturbances in CA, a large proportion of seeds of the weed seedbank remain generally close to the soil surface, waiting for adequate conditions to germinate [29]. Therefore, avoiding weed emergence favors seedbank depletion through time, seed desiccation or seed predation and avoids weed germination flushes. These farmers chose either to use alternating sowing periods or sowing date optimization to do so. The last change occurring when adopting CA for these farmers was the use of cover crops, if they were not already used before CA.
With almost 80% of farmers using them, cover crops and intercropping period weeding became the main points of weed management during the first years of CA. Chemical weeding during the intercropping period ensures the start of the next crop. To do this, non-selective herbicides with foliar penetration, such as glyphosate, are applied. Applied alone or in combination, glyphosate can target annual grasses, eudicotyledons or perennial weeds depending on the rate used. With the withdrawal of non-selective active ingredients (paraquat in 2007, aminotriazole in 2016 and glufosinate in 2018), glyphosate, together with other molecules (pelargonic acid, dicamba and 2,4-D), represents one of the last molecules approved for use during the intercropping period. In addition to controlling weeds, this chemical application can also be used to terminate cover crops.
Unlike chemical weeding, cover crops act as a preventive weed management method. With favorable establishment, cover crops may provide efficient weed control on annual weeds by limiting weed growth and, for some species, by affecting weed emergence [11]. Cover crops or their residues on the soil surface affect weeds through different mechanisms: Biological and physical (temperature and availability of water and nutrients) or chemical (modification of the C/N ratio or allelopathic compounds) [30]. Cover crop efficiency is highly variable and depends on weather conditions and management decisions, such as the choice of cover crop species, sowing season, sowing rate optimization and termination date [31].
With the adoption of CA, the use of sowing rate optimization and combined/companion crops by farmers increased. Sowing rate optimization, like the other practices in its category (row width optimization and variety choice), has an indirect effect on weeds by maximizing crop competitiveness. While a high density rate can provide effective weed control, it can also be a disadvantage to the yield if the rate is not well adapted with other crop sowing parameters, such as variety, row width and climatic conditions [32]. Often combined with sowing rate optimization in the established combinations, row width optimization and variety choice were not used by farmers to manage weeds. Different reasons may explain this result, such as other variety choice drivers (yield or climatic conditions) or a potential lack of adapted varieties to CA. The lack of use of row width optimization may result from additional equipment required. The effect of combined/companion crops on weeds is efficient for French farm systems [33], but little is known about the governing of those effects (direct or indirect effect).
According to the farmers, approximately five years are required to reach a “mastered” level of the CA system. Upon mastering the CA system, weed management still evolved, but the choices made by the farmers were more easily identified. The first changes were related to weeding times and seemed to contradict the previous results. In the Mastered CA period, the use of two applications during the crop cycle (pre- and post-emergence) decreased in favor of post-emergence application only. Locke et al. [34] found a similar result for farmers in CA and explained the findings by a lower efficacy of pre-emergence herbicides due to higher organic matter levels on the soil surface. The reduction in weeding times involve not only crop weeding but also the intercropping period and spot management. Despite a non-significant decrease in use, chemical weeding during the intercropping period became non-systematic for all the combinations in the Mastered CA period. Many farmers also excluded spot management. All these choices showed that when adopting CA, the farmers tend to secure their systems through chemical weeding, but when reaching a mastered system, chemical weeding applications decrease. These weeding changes were accompanied by the addition of practices to avoid weed emergence. Alternating the sowing periods and crop rotation optimization were the main practices added by the farmers, which could explain their increased use. Although crop rotation optimization is considered an effective practice to control weeds [27] and is the third principle of CA, its use to manage weeds increased only in the Mastered CA period. Crop rotation optimization can be preventive by disrupting the life cycle of weeds or curative by alternating herbicide modes of action [35].
The other changes involve the farmers who decided to increase crop competitiveness (variety choice, sowing rate optimization and row width optimization) or competition by adding other species (combined/companion crops). This increase in the intensity of competition was the only change made by the farmers using pre-emergence application in the Starting CA period. For the other farmers, this change resulted in the reduced use of weed emergence avoidance strategy.

5. Conclusions

Conservation agriculture was identified as a farming system that can potentially provide sustainable agriculture worldwide. Therefore, any change made by farmers to optimize the transition regarding weed management or other aspects, such as fertilization, should be studied so as to constitute a basis for reflection for other farmers. In France, weed management appears to be the major factor that requires an adaptation of their practices and strategies. Although the weed management changes during the transition to CA varied markedly from one farmer to another and according to their prior management, some similarities between farmers were identified. Main changes appeared when adopting the farming system, but farmers still made some adjustments to reach a mastered level of weed management. According to farmers, around five years were required before mastering the system.
When referring to weed management, CA should not be studied as a unique model of agriculture but as a diversity of agricultural systems using different practices or strategies that can change with present or future global contexts, such as climatic stress or herbicide use restriction.

Supplementary Materials

The following are available online at https://www.mdpi.com/2073-4395/10/6/843/s1, Figure S1: Hierarchical tree before consolidation of k-means and representation of groups on the first two dimensions of the ACM for Before CA period, Figure S2: Hierarchical tree before consolidation of k-means and representation of groups on the first two dimensions of the ACM for Starting CA period, Figure S3: Hierarchical tree before consolidation of k-means and representation of groups on the first two dimensions of the ACM for Mastered CA period.

Author Contributions

D.D., B.C., E.F. and F.D. contributed equally to this work. All authors have read and agreed to the published version of the manuscript; the work reported.

Funding

This research was funded by European Union’s horizon 2020 research and innovation programme under grant agreement No 727321 (IWMPraise) and by the agreement to support a thesis grant No 2017-9201AAO048S01305 of the Bourgogne-Franche-Comté region.

Acknowledgments

The authors thank, for their participation to the survey broadcast, all farmers’ groups (APAD, BASE, GIEE DU SOL EAU SOLEIL, AOC Sols, Club AgroEcos, GIEE MAGELLAN, Clé de Sol), the project partners (Terres Inovia, Arvalis Institut du Végétal), the representatives of chambers of agriculture and the A2C website. All farmers are also greatly thanked for their participation.

Conflicts of Interest

The authors declare no conflict of interest.

References

  1. Reicosky, D.C. Conservation tillage is not conservation agriculture. J. Soil Water Conserv. 2015, 70, 103–108. [Google Scholar] [CrossRef] [Green Version]
  2. Berger, A.; Friedrich, T.; Kienzle, J. Conservation Agriculture. In Soils Plant Growth and Crop Production, 1st ed.; Verheye, W., Ed.; Eolss Publishers: Oxford, UK, 2010; p. 2. ISBN 978-90-481-6211-6. [Google Scholar]
  3. Hobbs, P.R.; Sayre, K.; Gupta, R. The role of conservation agriculture in sustainable agriculture. Philos. Trans. R. Soc. B Biol. Sci. 2008, 363, 543–555. [Google Scholar] [CrossRef] [PubMed]
  4. Sun, Y.; Zeng, Y.; Shi, Q.; Pan, X.; Huang, S. No-tillage controls on runoff: A meta-analysis. Soil Tillage Res. 2015, 153, 1–6. [Google Scholar] [CrossRef]
  5. Schwen, A.; Bodner, G.; Scholl, P.; Buchan, G.D.; Loiskandl, W. Temporal dynamics of soil hydraulic properties and the water-conducting porosity under different tillage. Soil Tillage Res. 2011, 113, 89–98. [Google Scholar] [CrossRef]
  6. Henneron, L.; Bernard, L.; Hedde, M.; Pelosi, C.; Villenave, C.; Chenu, C.; Bertrand, M.; Girardin, C.; Blanchart, E. Fourteen years of evidence for positive effects of conservation agriculture and organic farming on soil life. Agron. Sustain. Dev. 2015, 35, 169–181. [Google Scholar] [CrossRef] [Green Version]
  7. Laloy, E.; Bielders, C. Effect of intercropping period management on runoff and erosion in a maize cropping system. J. Environ. Qual. 2010, 39, 1001–1008. [Google Scholar] [CrossRef] [PubMed]
  8. Parr, M.; Grossman, J.M.; Reberg-Horton, S.C.; Brinton, C.; Crozier, C. Nitrogen delivery from legume cover crops in no-till organic corn production. Agron. J. 2011, 103, 1578–1590. [Google Scholar] [CrossRef]
  9. Constantin, J.; Beaudoin, N.; Laurent, F.; Cohan, J.-P.; Duyme, F.; Mary, B. Cumulative effects of catch crops on nitrogen uptake, leaching and net mineralization. Plant Soil 2011, 341, 137–154. [Google Scholar] [CrossRef]
  10. Carof, M.; De Tourdonnet, S.; Coquet, Y.; Hallaire, V.; Roger-Estrade, J. Hydraulic conductivity and porosity under conventional and no-tillage and the effect of three species of cover crop in northern France. Soil Use Manag. 2007, 23, 230–237. [Google Scholar] [CrossRef]
  11. Cordeau, S.; Wayman, S.; Reibel, C.; Strbik, F.; Chauvel, B.; Guillemin, J.-P. Effects of drought on weed emergence and growth vary with the seed burial depth and presence of a cover crop. Weed Biol. Manag. 2018, 18, 12–25. [Google Scholar] [CrossRef]
  12. Barzman, M.; Bàrberi, P.; Birch, A.N.E.; Boonekamp, P.; Dachbrodt-Saaydeh, S.; Graf, B.; Hommel, B.; Jensen, J.E.; Kiss, J.; Kudsk, P. Eight principles of integrated pest management. Agron. Sustain. Dev. 2015, 35, 1199–1215. [Google Scholar] [CrossRef]
  13. Debaeke, P.; Orlando, D. Simplification du travail du sol et evolution de la flore adventice: Consequences pour le desherbage à l’échelle de la rotation. In Simplification du Travail du Sol; Lessaffre, B., Thevenet, G., Eds.; INRA: Paris, France, 1991; pp. 35–62. [Google Scholar]
  14. Baeumer, K.; Bakermans, W.A.P. Zero tillage. Adv. Agron. 1974, 25, 77–123. [Google Scholar] [CrossRef]
  15. Aubineau, M.; Billot, J.F. Techniques simplifiées de semis: Description et performances de quelques matériels. In La Simplification des Techniques de Travail du Sol; CNRA: Versailles, France, 1975; pp. 9–56. [Google Scholar]
  16. Evans, D.M. Field performance of glyphosate derivatives in the control of Agropyron repens and other perennial weeds. Brit. Weed Contr. Conf. Proc. 1972, 1, 64–70. [Google Scholar]
  17. Kassam, A.H.; Friedrich, T.; Derpsch, R. Global spread of Conservation Agriculture. Int. J. Environ. Stud. 2019, 76, 29–51. [Google Scholar] [CrossRef]
  18. Buhler, D.D. Influence of tillage systems on weed population dynamics and management in corn and soybean in the Central USA. Crop Sci. 1995, 35, 1247–1258. [Google Scholar] [CrossRef]
  19. Bijttebier, J.; Ruysschaert, G.; Hijbeek, R.; Werner, M.; Pronk, A.A.; Zavattaro, L.; Bechini, L.; Grignani, C.; ten Berge, H.; Marchand, F.; et al. Adoption of non-inversion tillage across Europe: Use of a behavioural approach in understanding decision making of farmers. Land Use Policy 2018, 78, 460–471. [Google Scholar] [CrossRef]
  20. Murphy, S.D.; Clements, D.R.; Belaoussoff, S.; Kevan, P.G.; Swanton, C.J. Promotion of weed species diversity and reproduction of weed seedbanks with conservation tillage and crop rotation. Weed Sci. 2006, 54, 69–77. [Google Scholar] [CrossRef]
  21. Trichard, A.; Alignier, A.; Chauvel, B.; Petit, S. Identification of weed community traits response to conservation agriculture. Agric. Ecosyst. Environ. 2013, 179, 179–186. [Google Scholar] [CrossRef]
  22. Casagrande, M.; Alletto, L.; Naudin, C.; Lenoir, A.; Siah, A.; Celette, F. Enhancing planned and associated biodiversity in French farming systems. Agron. Sustain. Dev. 2017, 37. [Google Scholar] [CrossRef] [Green Version]
  23. Peigné, J.; Casagrande, M.; Payet, V.; David, C.; Sans, F.X.; Blanco-Moreno, J.M.; Cooper, J.; Gascoyne, K.; Antichi, D.; Bàrberi, P.; et al. How organic farmers practice conservation agriculture in Europe. Renew. Agric. Food Syst. 2016, 31, 72–85. [Google Scholar] [CrossRef] [Green Version]
  24. Regnier, E.E.; Harrison, S.K.; Loux, M.M.; Holloman, C.; Venkatesh, R.; Diekmann, F.; Taylor, R.; Ford, R.A.; Stoltenberg, D.E.; Hartzler, R.G.; et al. Certified Crop Advisors’ Perceptions of Giant Ragweed (Ambrosia trifida) Distribution, Herbicide Resistance, and Management in the Corn Belt. Weed Sci. 2016, 64, 361–377. [Google Scholar] [CrossRef] [Green Version]
  25. R Core Team (2019); A language and environment for statistical computing; R Foundation for Statistical Computing: Vienna, Austria, 2019.
  26. Lê, S.; Josse, J.; Husson, F. FactoMineR: An R Package for Multivariate Analysis. J. Stat. Softw. 2008, 25, 1–18. [Google Scholar] [CrossRef] [Green Version]
  27. Swanton, C.J.; Mahoney, K.; Chandler, K.; Gulden, R.H. Integrated weed management: Knowledge-based weed management systems. Weed Sci. 2008, 56, 168–172. [Google Scholar] [CrossRef]
  28. Goulet, F.; Hernández, V. Vers un modèle de développement et d’identités professionnelles agricoles globalisés? Dynamique d’innovation autour du semis direct en argentine et en France. Rev. Tiers Monde 2011, 207, 115–132. [Google Scholar] [CrossRef]
  29. Chauhan, B.S.; Singh, R.G.; Mahajan, G. Ecology and management of weeds under conservation agriculture: A review. Crop Prot. 2012, 38, 57–65. [Google Scholar] [CrossRef]
  30. Christoffoleti, P.J.; de Carvalho, S.J.P.; López-Ovejero, R.F.; Nicolai, M.; Hidalgo, E.; da Silva, J.E. Conservation of natural resources in Brazilian agriculture: Implications on weed biology and management. Crop Prot. 2007, 26, 383–389. [Google Scholar] [CrossRef]
  31. Osipitan, O.A.; Dille, J.A.; Assefa, Y.; Radicetti, E.; Ayeni, A.; Knezevic, S.Z. Impact of cover crop management on level of weed suppression: A meta-analysis. Crop Sci. 2019, 59, 833–842. [Google Scholar] [CrossRef]
  32. Li, P.; Mo, F.; Li, D.; Ma, B.L.; Yan, W.; Xiong, Y. Exploring agronomic strategies to improve oat productivity and control weeds: Leaf type, row spacing, and planting density. Can. J. Plant Sci. 2018, 98, 1084–1093. [Google Scholar] [CrossRef]
  33. Verret, V.; Gardarin, A.; Makowski, D.; Lorin, M.; Cadoux, S.; Butier, A.; Valantin-Morison, M. Assessment of the benefits of frost-sensitive companion plants in winter rapeseed. Eur. J. Agron. 2017, 91, 93–103. [Google Scholar] [CrossRef]
  34. Locke, M.A.; Reddy, K.N.; Zablotowicz, R.M. Weed management in conservation crop production systems. Weed Biol. Manag. 2002, 2, 123–132. [Google Scholar] [CrossRef]
  35. Doucet, C.; Weaver, S.E.; Hamill, A.S.; Zhang, J. Separating the Effects of Crop Rotation from Weed Management on Weed Density and Diversity. Weed Sci. 1999, 47, 729–735. [Google Scholar] [CrossRef]
Figure 1. Use of weed management practices by farmers during the three periods (Before CA, Starting CA and Mastered CA). Different letters mean significant differences (chi-square, p < 0.05 PR: Pre-emergence; application; PO: Post-emergence application; PR + PO: Pre-emergence and post emergence applications. Values with different letters are significantly different (p < 0.05).
Agronomy 10 00843 g001
Figure 2. Trajectories of the farmers’ groups between each period. The green color or + indicate a significantly higher use of a weed management practice; the red color or - indicate a significantly lower use. PR: Pre-emergence; PO: Post-emergence application; I: Intercropping period weeding.
Agronomy 10 00843 g002
Table 1. Description of the groups for Before CA period by their use of weed management practices. The green color indicates a proportion of farmers significantly higher than the whole sample and the red color indicates a proportion significantly lower than the whole sample for the same period (Vtest with p < 0.05).
Weed Management PracticesBefore CA (413 Farmers) **
B1 (9%)B2 (18%)B3 (10%)B4 (10%)B5 (10%)B6 (9%)B7 (34%)
Soil disturbancePloughing100%0% 0%0%0%0%
Stubble ploughing73%83% 36%39%
Stale seedbed 92% 1%
Mechanical weeding 30%
Chemical weedingCrop weeding0%0%0%100%0% 0%0%
PO62% 0% 56%56%
PR + PO 61%0%
Intercropping period weeding 60%
Competition by adding speciesCover crops5%0% 100%69%0%
Combined/companion crops 0%0%0%0%100%0%
Crop competitivenessSowing rate optimization 0% 100%0% 0%
Row width optimization * 23%
Variety choice *
Weed emergence avoidanceSowing date optimization 64% 34%
Alternating sowing periods 43%
Crop rotation optimization 36%
Spot weedingWeed patch management 72% 45%
Field border management *
Use of practices *Few (1 to 4)11%7% 13%12%5%56%
Some (5 to 8 or 5 to 7)78%83% 79% 44%
Many (9+ or 8+) 31%0%
* As supplementary variable for MCA; ** Number of farmers after filtering answers (no chemical weeding use). PR: Pre-emergence application; PO: Post-emergence application; PR + PO: Pre-emergence and post emergence applications.
Table 2. Description of the groups for Starting CA period by their use of weed management practices. The green color indicates a proportion of farmers significantly higher than the whole sample and the red color indicates a proportion significantly lower than the whole sample for the same period (Vtest with p < 0.05). PR: Pre-emergence application; PO: Post-emergence application; PR + PO: Pre-emergence and post-emergence applications.
Weed Management PracticesStarting CA (411 Farmers) **
S1 (13%)S2 (26%)S3 (12%)S4 (19%)S5 (12%)S6 (18%)
Chemical weedingCrop weedingPR100%0%0%0%0%0%
PO0% 67%
PR + PO0%49%
Intercropping period weeding 100%0%100%100%100%
Competition by adding speciesCover crops 100%90%97%100%0%
Combined/companion crops 0% 100% 16%
Crop competitivenessSowing rate optimization 0% 0%100%
Row width optimization * 3%
Variety choice * 16%
Weed emergence avoidanceSowing date optimization53% 53%
Alternating sowing periods 70% 75% 49%
Crop rotation optimization 37% 37%
Spot weedingWeed patch management 70% 37%
Field border management * 41%
Use of practices *Few (1 to 4) 1%0%63%
Some (5 to 8 or 5 to 7) 70% 71% 36%
Many (9+ or 8+) 3% 28%43%1%
* As supplementary variable for MCA; ** Number of farmers after filtering answers (no chemical weeding use).
Table 3. Description of the groups for Mastered CA period by their use of weed management practices. The green color indicates a proportion of farmers significantly higher than the whole sample and the red color indicates a proportion significantly lower than the whole sample for the same period (Vtest with p < 0.05). PR: Pre-emergence application; PO: Post-emergence application; PR + PO: Pre-emergence and post-emergence applications.
Weed Management PracticesMastered CA (126 Farmers) **
M1 (11%)M2 (14%)M3 (43%)M4 (15%)M5 (17%)
Chemical weedingCrop weedingPR100% 0%
PO0% 74%
PR + PO0%
Intercropping period weeding
Competition by adding speciesCover crops 100%0%100%
Combined/companion crops 78% 5%
Crop competitivenessSowing rate optimization 100%0%
Row width optimization * 28%
Variety choice *29%
Weed emergence avoidanceSowing date optimization71%
Alternating sowing periods 100% 0%
Crop rotation optimization 69% 24%
Spot weedingWeed patch management
Field border management * 10%
Use of practices *Few (1 to 4)0%0%7%68%67%
Some (5 to 8 or 5 to 7) 76%32%33%
Many (9+ or 8+)43%56% 0%0%
* As supplementary variable for MCA; ** Number of farmers after filtering answers (no chemical weeding use and reuse of tillage).

