Article

The Photosynthetic Performance of Red Leaf Lettuce under UV-A Irradiation

Institute of Horticulture, Lithuanian Research Centre for Agriculture and Forestry, Kaunas str. 30, Kedainiai 58344, Lithuania
*
Author to whom correspondence should be addressed.
Agronomy 2020, 10(6), 761; https://doi.org/10.3390/agronomy10060761
Submission received: 20 April 2020 / Revised: 21 May 2020 / Accepted: 22 May 2020 / Published: 27 May 2020
(This article belongs to the Special Issue Control of LED Lighting Based on Plant Physiological Principles)

Abstract

:
The objective of this study was to evaluate how different UV-A wavelengths influence the morphology and photosynthetic behavior of red-leaf lettuce (Lactuca sativa L. cv. Maiko). In the experiments, the main photosynthetic photon flux consisted of red (R) and blue (B) light, supplemented with equal doses of different UV-A wavelengths (402, 387 and 367 nm). Treating the crops with low dosages of specific narrow-band UV-A radiation at key points in the life cycle initiated a cascade of responses in the above-ground biomass. According to the results, red-leaf lettuces acclimated to longer UV-A wavelengths by increasing biomass production, whereas different UV-A wavelengths had no significant effect on plant senescence reflectance, nor on the normalized difference vegetation index. A significant decrease in the maximum quantum yield of the PSII photochemistry of dark (Fv/Fm) and light (ΦPSII) adapted plants was observed. A lack of significant changes in non-photochemical fluorescence quenching indicates that photo-inhibition occurred under RBUV367, whereas the photosynthetic response under RB, RBUV402, and RBUV387 suggests that there was no damage to PSII. The correlation of the photosynthetic rate (Pr) with the stomatal conductance (gs) indicated that the increase in the Pr of lettuce under supplemental UV-A radiation was due to the increase of gs, instead of the ratio of the intracellular to ambient CO2 content (Ci/Ca) or stomatal limitations.

1. Introduction

The impact of different light indices, such as the wavelength and intensity, on plant photophysiological responses has been well described [1,2,3]. The understanding of the importance of controlling the light conditions in closed environment agricultural (CEA) systems is growing [1,4,5,6,7]. However, despite major research efforts focused on clarifying the impact of light quality and/or quantity on plants, there is still relatively little data concerning UV-A mediated responses. It has been established that plant responses to UV-A are mediated by blue-light photoreceptors, such as phototropins, cryptochromes (peak absorption at 370 and 450 nm) and Zeitlupe (ZTL) proteins [8,9]. In contrast to UVR8 photoreceptors, which absorb light between 280 and 315 nm [10], these systems act as photon counters within the range of 350–500 nm [11]. Generally, blue and red light are considered to be the most efficient wavelengths for driving photosynthesis in plants, and this has been a topical issue for several decades [12]. The perception of blue light through the aforementioned photoreceptors allows plants to sense the intensity of competition for light. Besides the morphogenetic effects, fluctuations in blue light involve changes in both energy balance components, and in gas exchange dynamics through stomatal functioning [13]. There is currently limited data concerning plant responses to UV-A. However, some remarks can be drawn regarding the effects UV-A has on plants, as it affects both plant biomass accumulation and morphology [14,15], photosynthetic processes [16], and metabolic responses [17], although the direction of the responses depends on dose, duration [18,19], plants’ genetic backgrounds [20], and the plant’s organs [21].
The absorption, transmission or reflection of the electromagnetic spectrum by plant pigments can play a significant role in the monitoring of their response to environmental factors. Optical properties of plant species depend on plant physiology, morphology or anatomy, and thus variations in leaf structure, as well as pigment and water content, can result in changing reflectance properties [22]. The light reactions of photosynthesis regulate the conversion of electric light energy into biomass. However, not all photons are used to drive light reactions. Higher plants have developed a complex set of responses to excess light, which allows them to safely dissipate excess light energy as heat or as fluorescence [23]. The complex set of photo- and non-photochemical quenching reactions that have evolved in plants to mitigate photoinhibition has allowed them to thrive [24]. However, there is currently no common opinion concerning plant responses to UV-A. The objective of this study was to explore the physiological responses of red leaf lettuce to the UV-A spectrum, and to determine the effects of irradiation with different wavelengths of UV-A LEDs on biomass accumulation and photosynthetic behavior.

2. Materials and Methods

2.1. Plant Material and Growth Conditions

The experiments were performed in a walk-in controlled-environment growth chamber (4 × 6 m). Day/night temperatures of 21/17 ± 2 °C were established, with a 16 h photoperiod and relative humidity of 50–60%. Red leaf lettuce (Lactuca sativa L. cv. Maiko) was cultivated in a peat substrate (Profi 1, JSC Durpeta, Sepeta, Lithuania) (pH 6). The average amounts of nutrients (mg L−1) in the substrate were as follows: N, 110; P2O5, 50; K2O, 160. The microelements Fe, Mn, Cu, B, Mo and Zn were also present. Electrical conductivity (EC) varied between 2.0 and 2.5 m S/cm ± 0.03 m S/cm. Three seeds were seeded into a 120 ml vessel (58 × 55 × 70 mm); 28 vessels were used for each treatment. The plants were watered as needed to maintain an even soil moisture. Analyses were performed at the end of the lighting experiment in the maturity stage, at 49 according to the BBCH-scale, when typical above ground biomass was reached.
The plants were illuminated with a custom-made lighting system containing four separate modules for parallel growth runs. In order to achieve different spectra, desired values of PPFD, and the required light switch on/off regimes, each group of LEDs in each lighting module was independently controlled with the help of a remote computer. The surface area under each lighting module was 0.22 m2. The distance between the canopy and light source was 25 cm. The main photosynthetic photon flux was provided by blue and deep-red LEDs, with peak wavelengths of 447 nm (LedEngin LZ1-00B200, Osram Sylvania, Wilmington, MA, USA) and 665 nm (Luxeon Rebel LXM3-PD01-0300, Philips Lumileds Lighting Co., San Jose, CA, USA), respectively. Three lighting modules were equipped with supplemental high-power UV-A LEDs emitting at 367 nm (LedEngin LZ4-04UV00, Osram Sylvania, Wilmington, MA, USA), 387 nm (LedEngin LZ440UB00-U4, Osram Sylvania, Wilmington, MA, USA), or 402 nm (LedEngin LZ440UB00-U7, Osram Sylvania, Wilmington, MA, USA). The photosynthetic photon flux density (PPFD) of the blue and red components and photon flux densities (PFD) of the UV-A wavelengths are presented in Table 1. The PPFD was measured and regulated at the soil level using a photometer–radiometer (RF-100, Sonopan, Bialystok, Poland).
The emission spectra of the LEDs were measured using a photonic multichannel analyzer (Hamamatsu PMA- 12, Japan), and are presented in Figure 1. For the simultaneous measurement of emission spectra and irradiance level from UV LEDs, a calibrated spectrometer (Ocean Optics Flame-S-UV-VIS-ES, USA) with a cosine corrector (Ocean Optics CC-3-DA, USA) was used.

2.2. Leaf Gas Exchange Indices

The photosynthetic rate (Pr, µmol CO2 m−2 s−1), transpiration rate (Tr, mmol H2O m−2 s−1), stomatal conductance (gs, mol H2O m−2 s−1), intracellular CO2 concentration (µmol mol−1), and ratio of intercellular to ambient CO2 concentration (Ci/Ca) were measured on the third developed leaf, using a portable photosynthesis system (LI-COR 6400XT, USA). The leaf chamber conditions were set at 21 °C, a CO2 concentration of 400 µmol mol−1, and 60% relative humidity. Artificial irradiation in the leaf chamber was supplied from 665 and 470 nm LED sources (665 and 470 nm), PPFD ~1000 µmol m−2 s−1. Photosynthesis was measured from 9 to 12 am. Water usage efficiency (WUE, µmol CO2 mmol−1 H2O) and light use efficiency (LUE, mol CO2 mol−1 photons) were also calculated.

2.3. Chlorophyll Fluorescence

Chlorophyll fluorescence was measured using red (660 nm) and blue (450 nm) excitation wavelengths as the measuring light, using a multi-mode chlorophyll fluorometer acquisition system (OS5p, Opti-Sciences, USA).
Measurements of light-adapted steady state chlorophyll fluorescence (F’), light-saturated chlorophyll fluorescence (F’m), and F’0 were used to calculate the relative PSII operating efficiency (ΦPSII). Dark-adapted (40 min) F0 and Fm measurements allowed the calculation of the maximum quantum efficiency of PSII (Fv/Fm). Non-photochemical quenching (NPQ) was calculated using the following formula:
NPQ = Fm/F’m − 1
The electron transport rate (ETR) was estimated using the equation given by Baker [25]:
ETR = 0.5 × 0.84 × PPFD × ΦPSII

2.4. Spectral Reflectance Indices

The spectral reflectance was measured using a leaf spectrometer (CID Bio-Science, USA) from 9 to 12 am. Reflection spectra obtained from the leaves were used to calculate the photochemical reflectance index (PRI), which shows changes in the xanthophyll cycle, using the following formula:
PRI = (R531 − R570)/(R531 + R570)
The normalized difference vegetation index (NDVI), which shows changes in biomass content, was calculated by:
NDVI = (R800 − R680)/(R800 + R680)
The plant senescence reflectance index (PSRI), which shows changes in dry or senescent carbon, was calculated by:
PSRI = (R680 − R500)/R750
The carotenoid reflectance index (CRI), which shows changes in the carotenoids to chlorophyll ratio, was calculated by:
CRI = (1/R510) − (1/R700)
The anthocyanin reflectance index (ARI), which shows changes in the anthocyanin amount, was calculated by:
ARI = (1/R550) − (1/R700)
where R800, R750, R700, R680, R570, R550, R531, R510 and R500 represent the leaf reflectance integrated over a 10 nm wavelength band centered on 800, 750, 700, 680, 570, 550, 531, 510 and 500 nm, respectively.

2.5. Sugars

The fructose, glucose, sucrose, and raffinose content was analyzed in leaves of plants of technical maturity at the end of the experiment, according to the Ma et al. method [26], with some modifications. Half a gram of fresh plant tissue was ground and diluted with deionized H2O. The extraction was carried out for 4 h at room temperature with mixing. Samples were centrifuged at 14,000 g for 15 min. A clean-up step to remove soluble proteins, according to Brons and Olieman’s instructions [27], was performed prior to the chromatographic analysis: One (1) mL of the supernatant was mixed with 1 mL of 0.01% (w/v) ammonium acetate in acetonitrile and incubated for 30 min at + 4 °C. The samples were centrifuged at 14,000 g for 15 min and filtered through a 0.22 µm PTPE syringe filter (VWR International, USA). The analyses were performed on a Shimadzu HPLC (Japan) instrument equipped with an evaporative light scattering detector (ELSD). The separation of carbohydrates was performed on a Shodex VG-50 4D HPLC column with deionized water (mobile phase A) and acetonitrile (mobile phase B) gradient. The gradient was maintained at 88% B for 13 minutes, changed linearly to 70% B in 9 minutes, kept at 70% B for one minute, raised back to 88% B in two minutes, and then the column was equilibrated to 88% B for five minutes. The flow rate was 0.8 mL min−1.

2.6. Biometric Measurements

Plant dry weight (DW) was determined by harvesting leaves from five different plants per light treatment. DW was weighed after tissue dehydration at 70 °C for 48 h (Venticell-BMT, Czech Republic). Leaf area (LA) was determined by using a leaf area meter (AT Delta–T Devices, UK).

2.7. Statistical Analysis

The data were processed using XLStat software (Addinsoft, USA, 2019), and analyzed using the Tukey (HSD) test at a confidence level of p = 0.05, or in MS Excel (version 7.0); the standard deviation representing the mean of three replications and multivariate principal component analysis (PCA) were performed. The results are presented in a PCA scatter plot showing the distinct differences in the photosynthetic indices and primary metabolites in lettuce under different lighting spectra, and a correlation circle (based on Pearson’s correlation matrix) summarizes the metabolic relationships between the investigated metabolites and minerals under different lighting spectra.

3. Results

3.1. Leaf Pigments, Morphology and Biomass

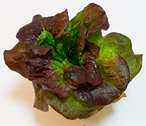
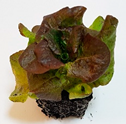
Both the carotenoid (CRI) and anthocyanin (ARI) reflectance indices of red leaf lettuce increased significantly under RBUV387 treatment during the experiment, compared with RB (control) (Table 2). The CRI and ARI of lettuce under RBUV387 were 1.7 and 1.4 times higher than that of the control plants. A significant increase of dry weight (DW) and leaf area (LA) was observed under RBUV402 treatment, while other UV-A components resulted in a significant decrease of DW and LA. DW and LA were lower by 15.6% and 21.6% under RBUV387, and were 34.4% and 27.8% lower under RBUV367, respectively. Changes of the plant senescence reflectance (PSRI) and normalized difference vegetation (NDVI) indices were not significant between treatments.

3.2. Photosynthetic Response

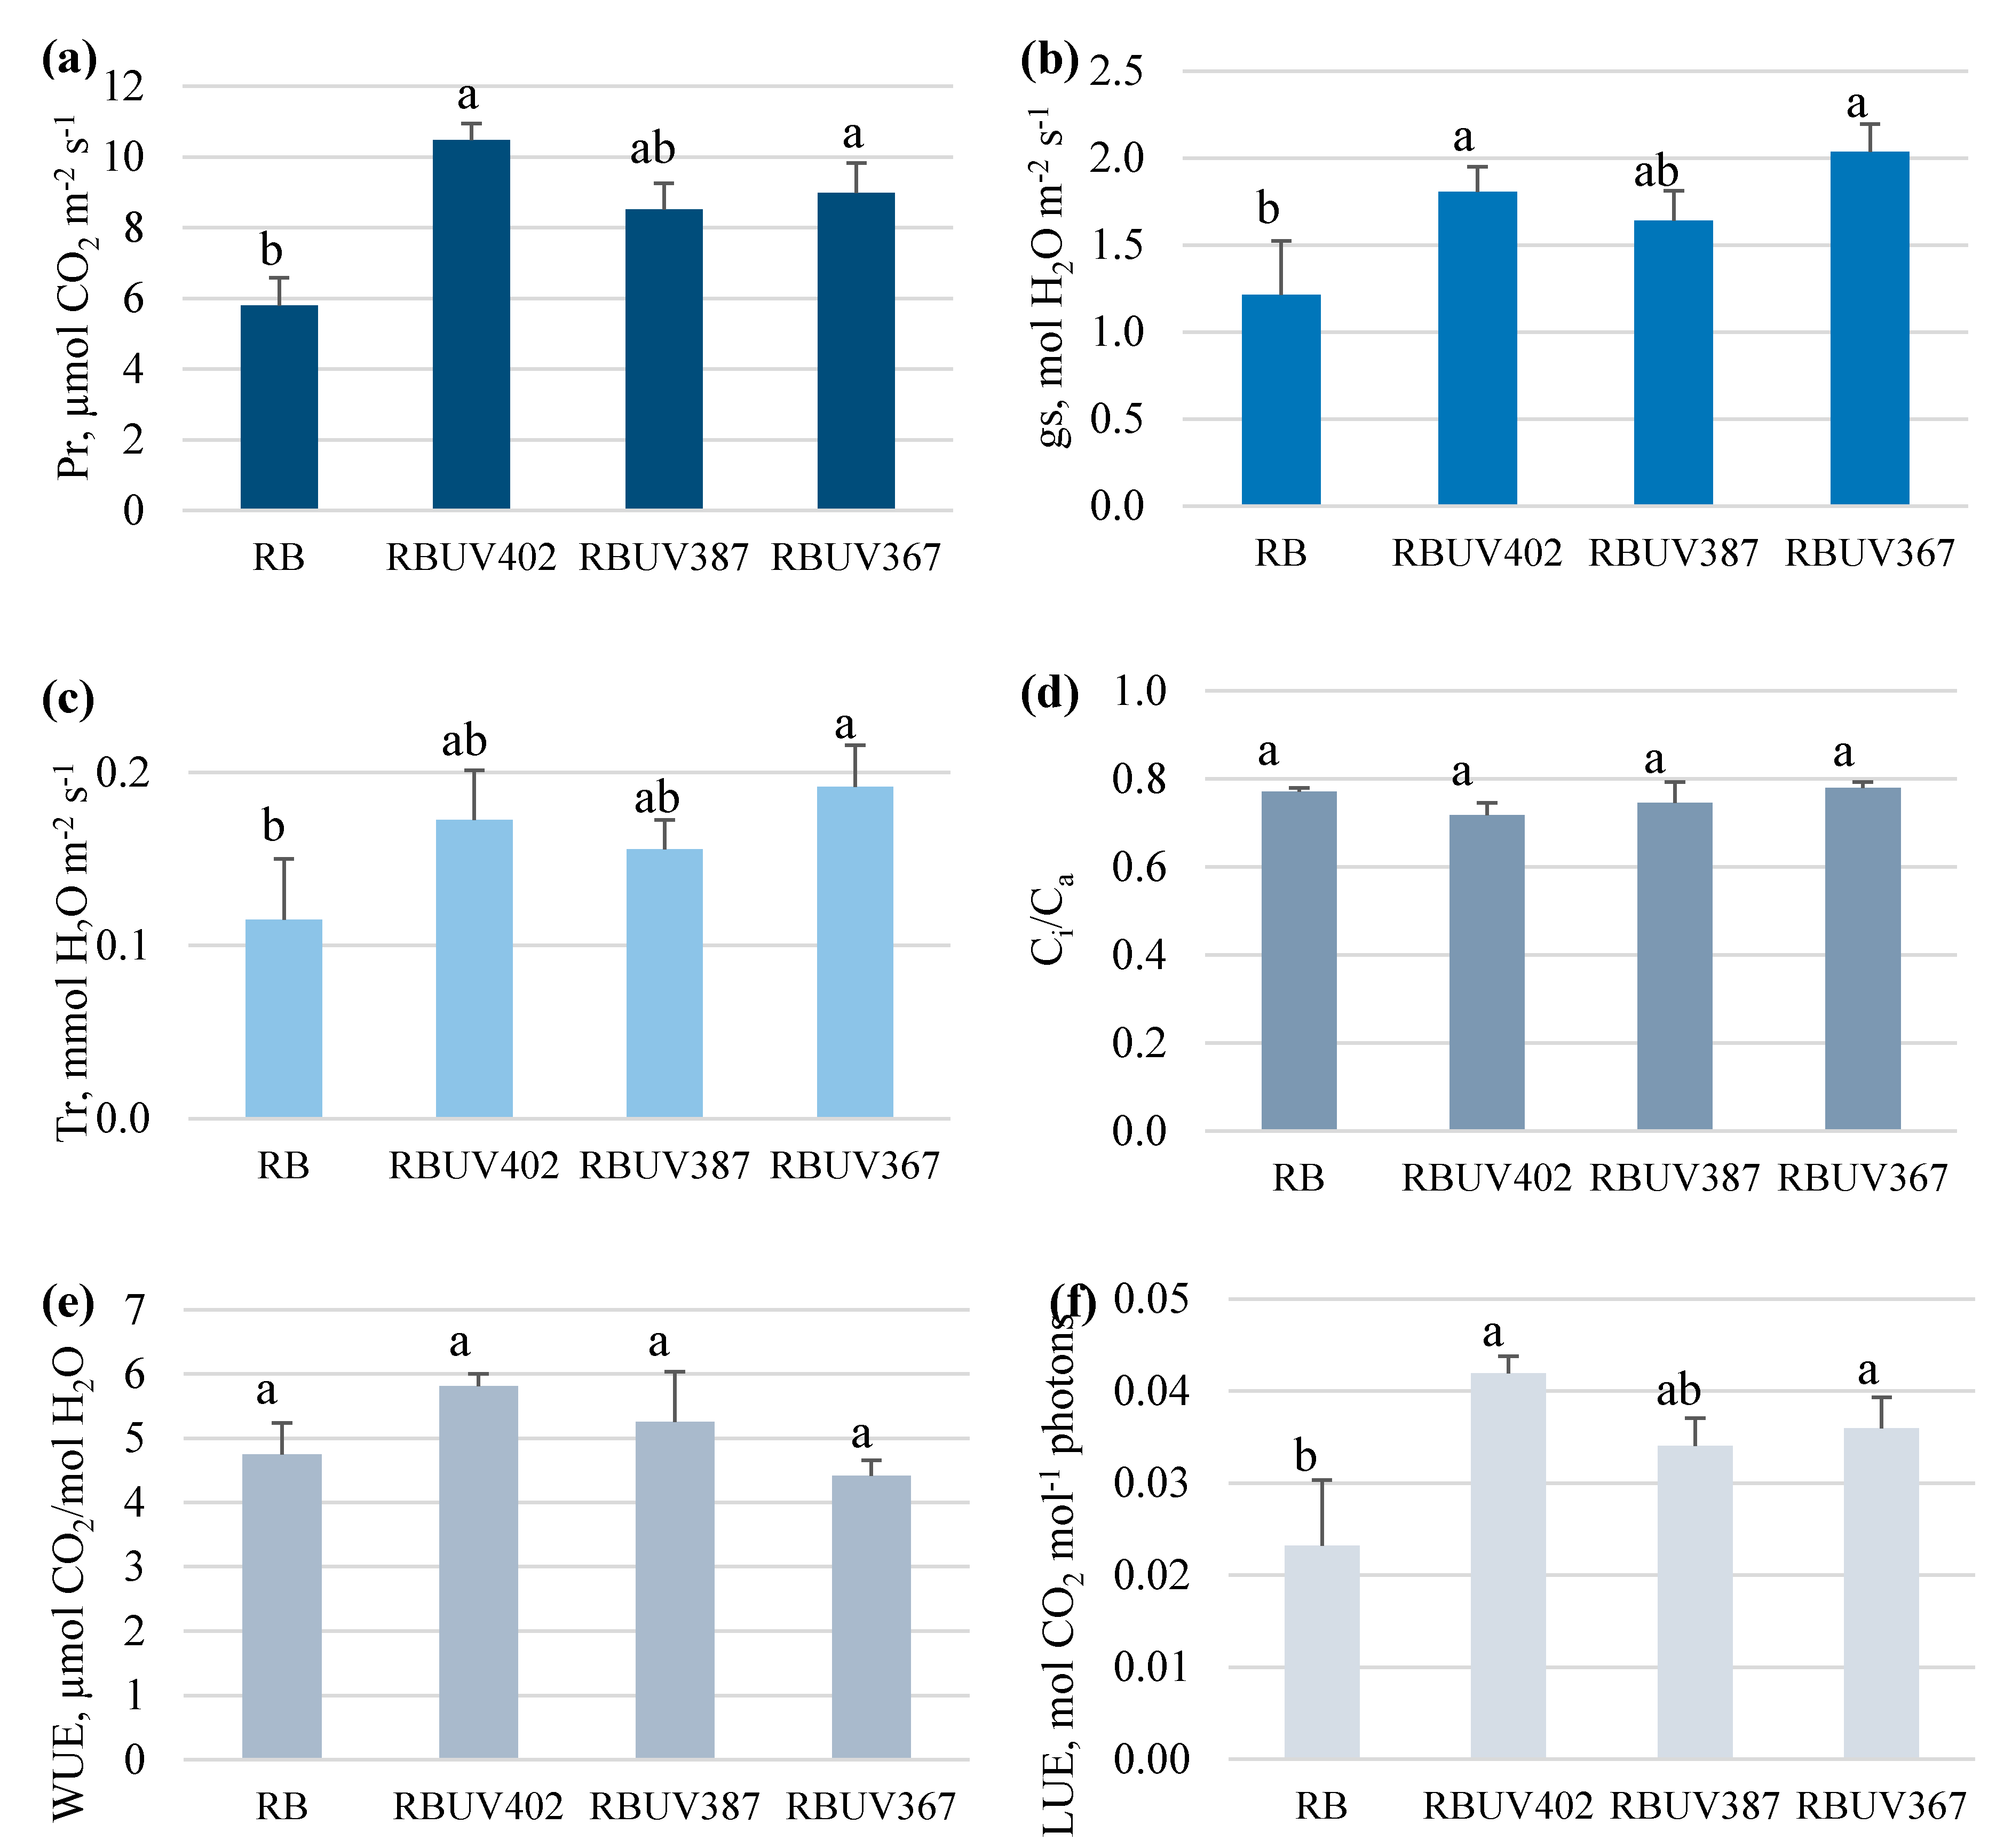
RBUV367 resulted in a significant increase of the photosynthetic rate (Pr), stomatal conductance (gs), transpiration rate (Tr), and light use efficiency (LUE). The Pr, gs, Tr and LUE of RBUV367 showed values about 1.6 times greater than in control plants. RBUV402 also resulted in a significant increase of Pr, gs and LUE, of up to 1.8 times higher compared to RB treatment. No significant differences between treatments were detected in water use efficiency (WUE) and the ratio between intracellular and ambient CO2 content (Ci/Ca) (Figure 2). The lowest values of Pr, gs, Tr and LUE were found under BR treatment.
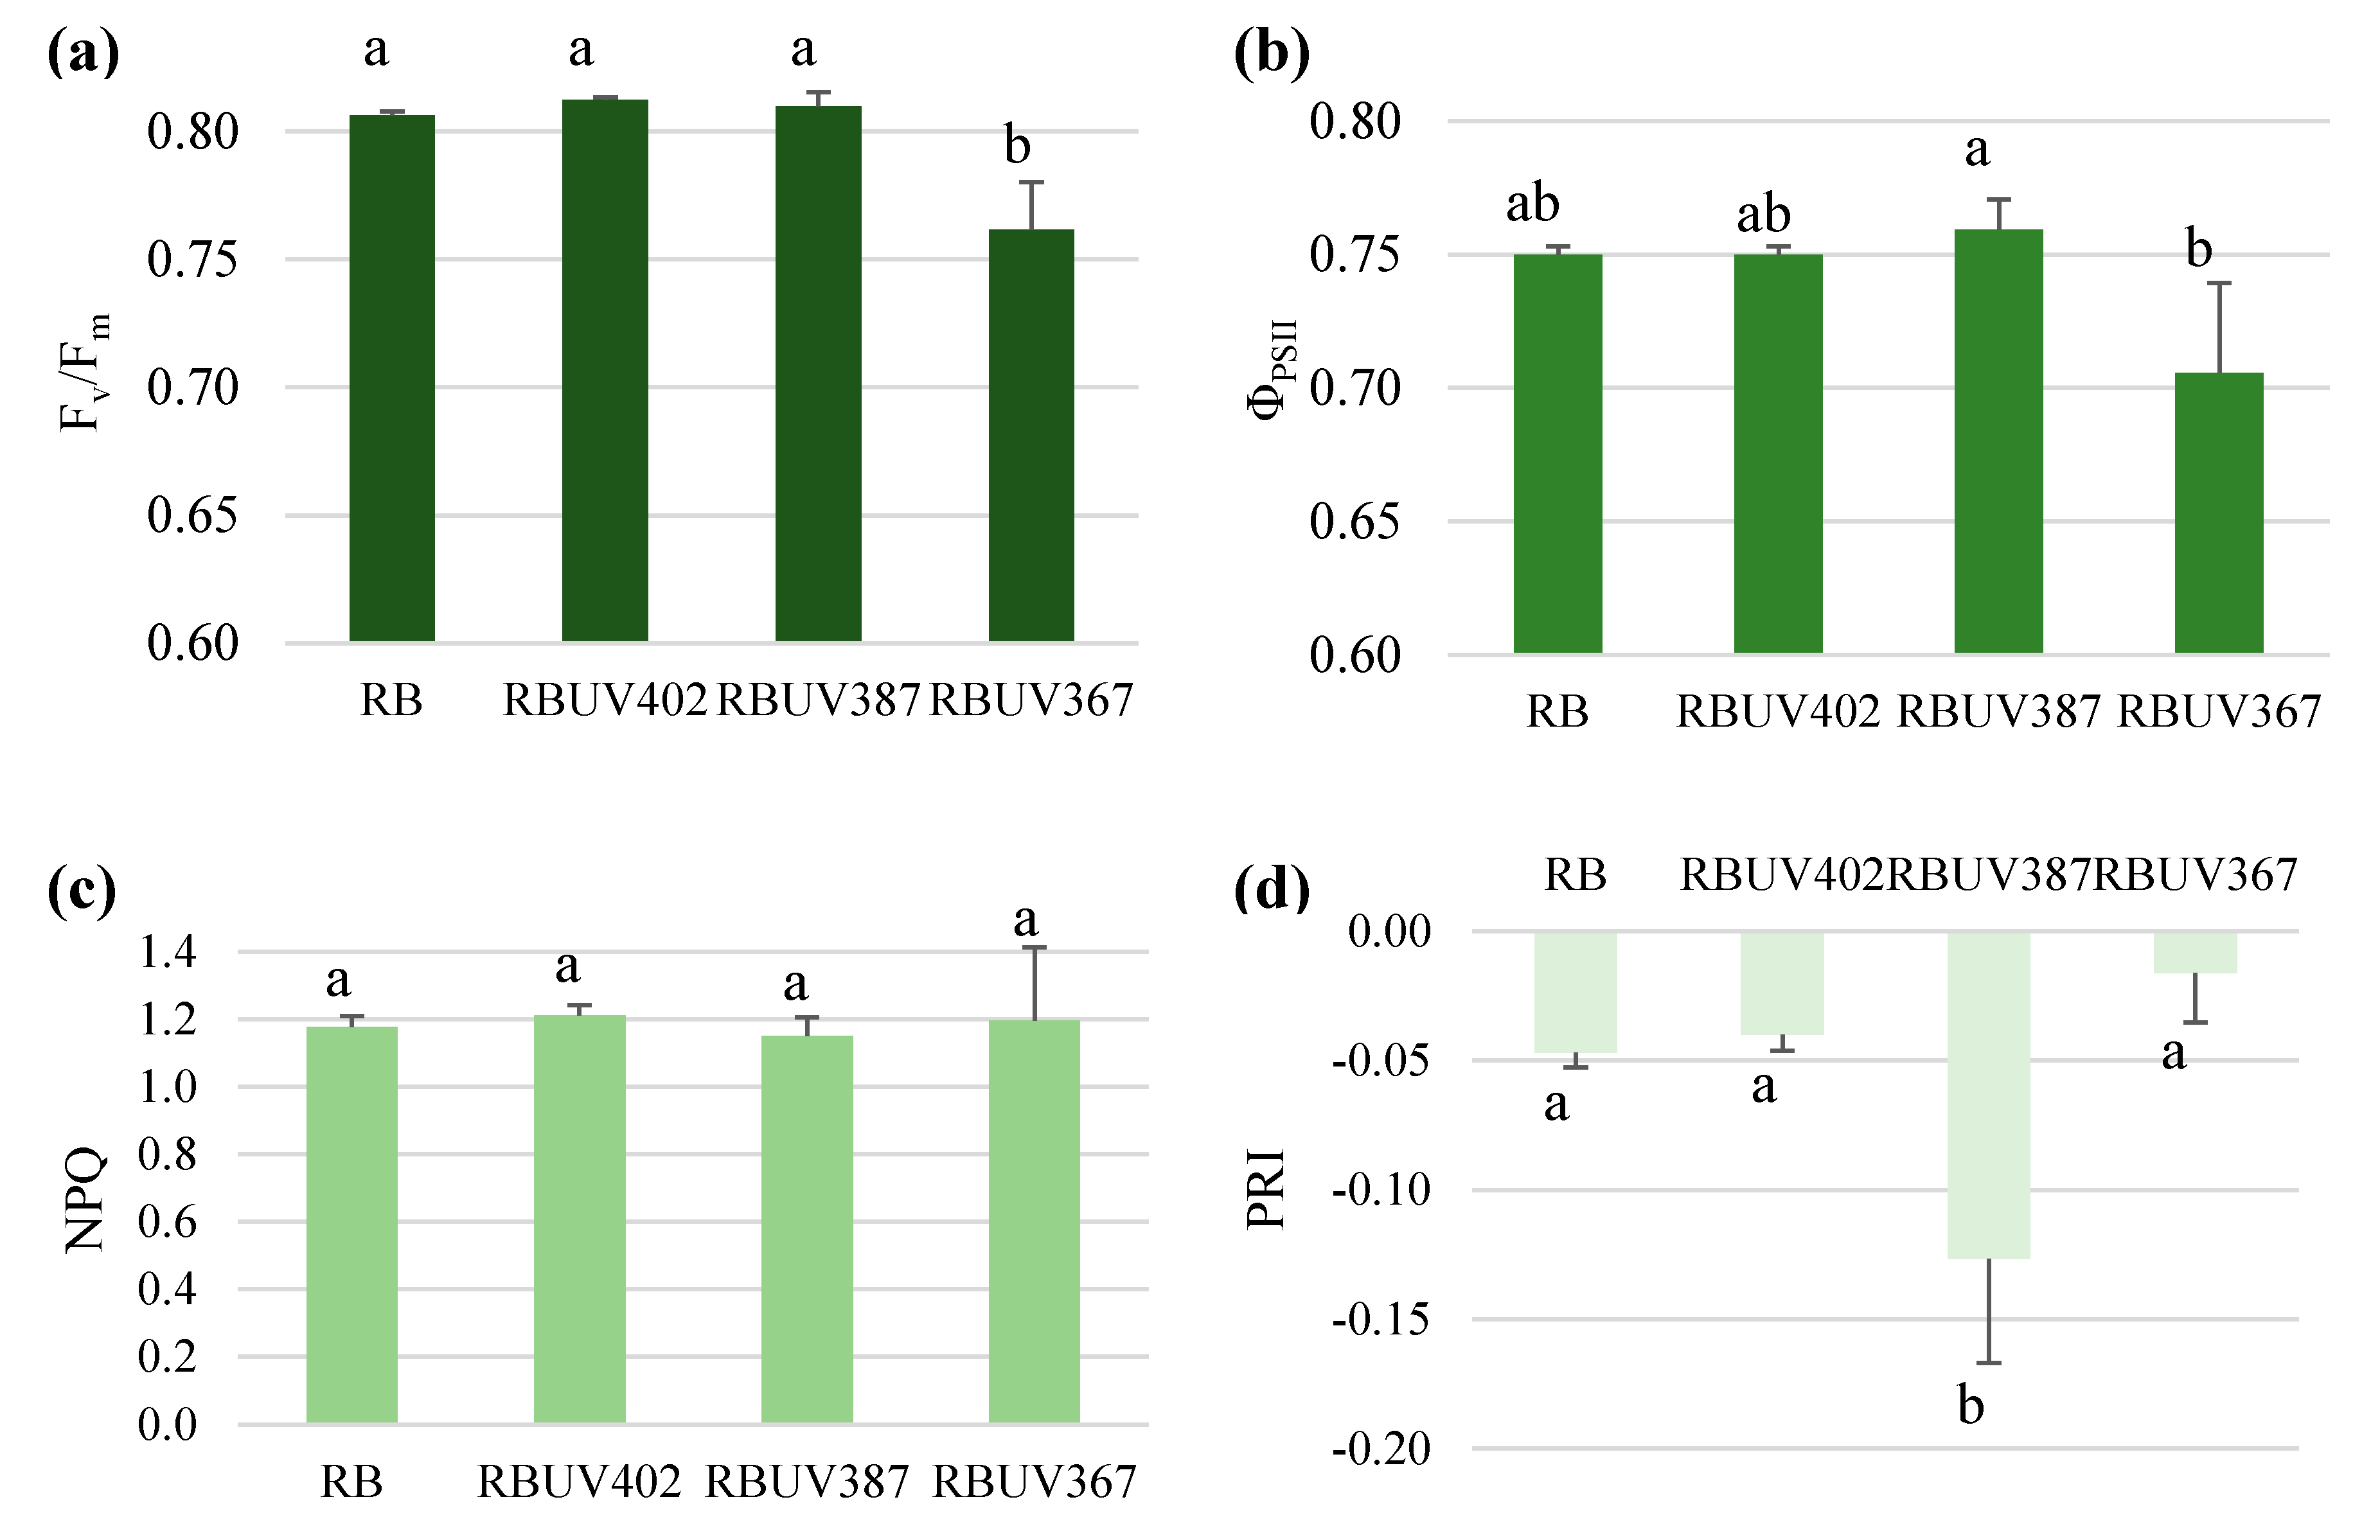
The maximum quantum yield of the PSII photochemistry of dark (Fv/Fm) and light (ΦPSII) adapted plants (Figure 3A,B) under RBUV367 was significantly lower (6–7%) compared to the other lighting treatments. The value of the photochemical reflectance index (PRI) under RBUV367 was higher, whereas no significant differences were found between RB or RB402 (Figure 3D). Non-photochemical fluorescence quenching (NPQ) also showed no significant differences between treatments.

3.3. Soluble Sugars

In general, the hexose to sucrose ratio (Hex/Suc) increased with decreasing wavelengths of UV-A radiation (Figure 4). The hex/suc ratio under RBUV367 was 3.2 times higher compared to under RB treatment. Compared to RB treatment, RBUV368 resulted in a significant increase of glucose (1.5 times) and a significant decrease of raffinose (5.9 times). A significant increase of fructose and sucrose was detected under RBUV402, by 1.4 and 1.2 times, respectively, compared to RB. The highest total content of carbohydrates of all lighting treatments was observed under RBUV402.

3.4. PCA Scatterplot and Correlations

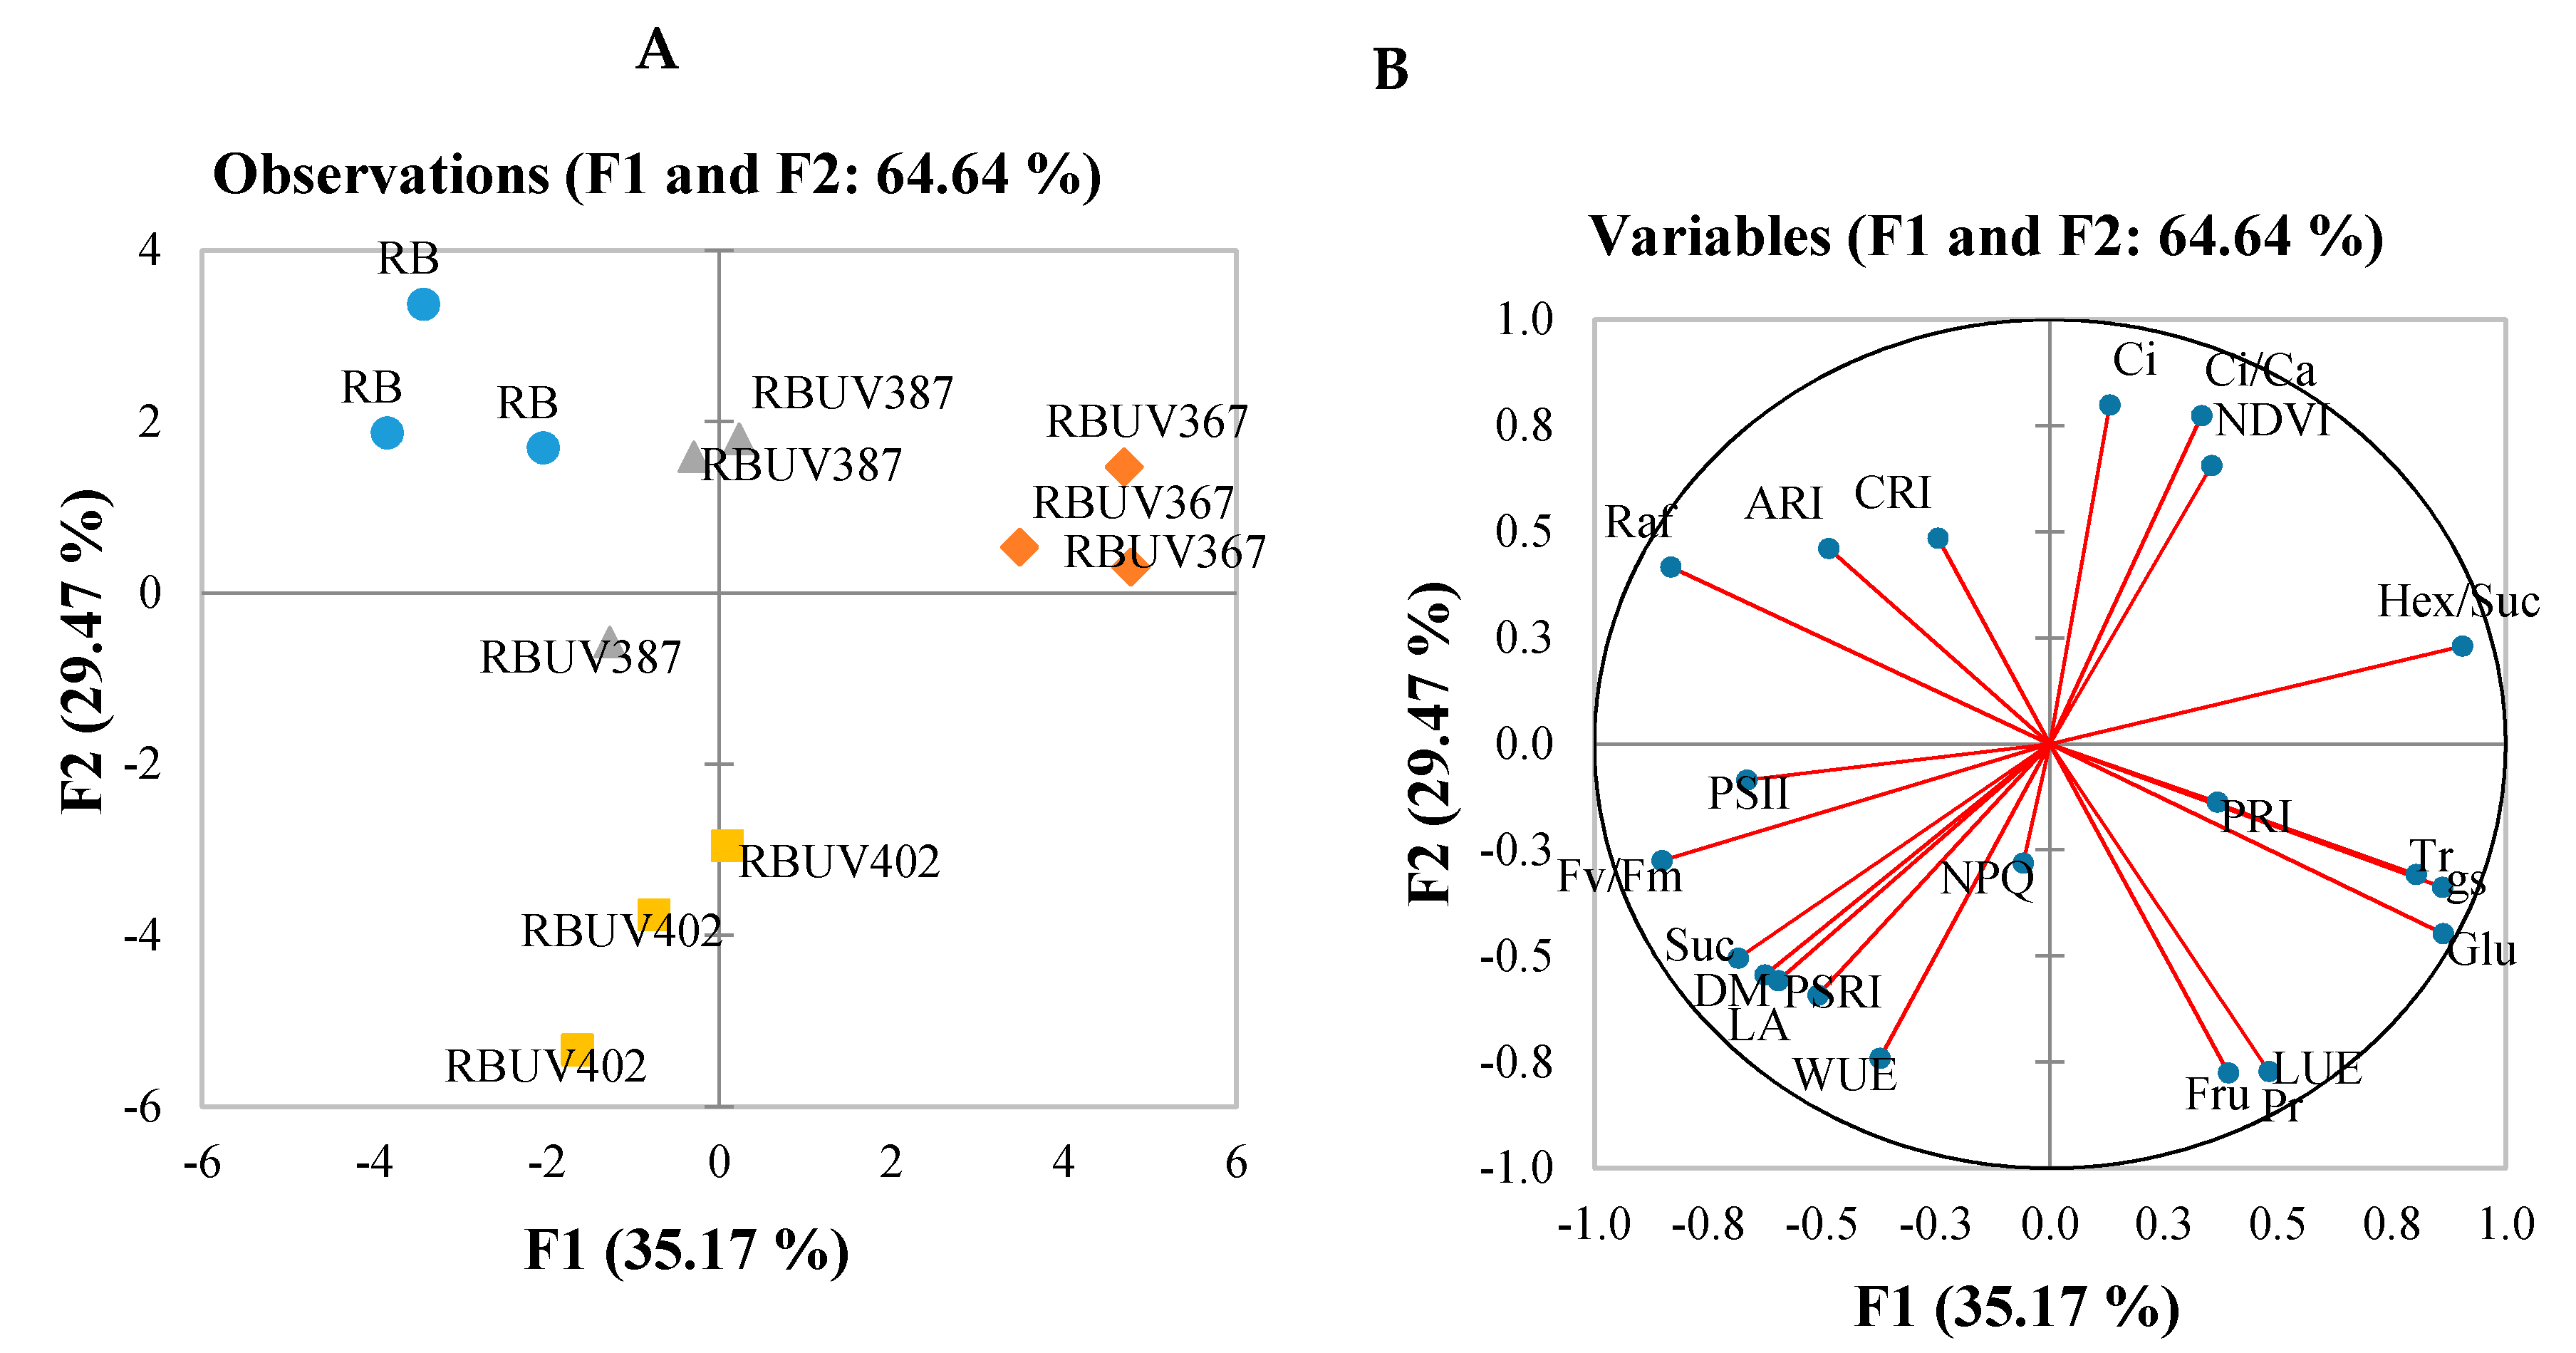
The results of the PCA score scatterplot show the average coordinates of the photosynthetic indices (Pr, gs, Ci, Ci/Ca, Tr, WUE, LUE), quantum efficiency for the PSII photochemistry (Fv/Fm, ΦPSII), non-photochemical and photochemical photochemistry (NPQ, PRI), individual sugars (fructose, glucose, sucrose and raffinose), leaf pigments (CRI, ARI), and growth characteristics (PSRI, NDVI, DW, LA) under different supplemental UV-A wavebands. The first two factors (F1 vs. F2) of the PCA, as shown in the scatterplot (Figure 5A) and correlation circle (Figure 5B), explained 64.64% of the total data variance of the red lettuce. F1 explained 35.17%, whereas F2 explained 29.47% of the total variability. To summarize all the effects in the PCA scatter plot, the common reactions of red lettuce to different UV-A treatments were not significantly different from those under RB treatment (Figure 5A). The plant response to RBUV402 and RBUV367 showed a clear distinction in terms of F1 score, while the F2 scores showed a distinction between RB402 and the other lighting treatments. Very strong or strong positive correlations between gs and Pr, gs and Tr, gs and LUE, gs and Fru, gs and Glu, between Pr and Tr, Pr and LUE, Pr and Fru, Pr and Glu, between tr and LUE, Tr and Fru, Tr and Glu, and between DW, LA and Suc were found (Figure 5B and Table S1). Negative correlations between Ci and LUE, and WUE and Fv/Fm, were detected, and the same negative correlation was found for Ci/Ca. Moderate or weak correlations between Fv/Fm or ΦPSII and most of the analyzed indices were detected. Negative moderate correlations between NPQ and Ci, and NPQ and ΦPSII, were found. Very strong or strong negative correlations between Raf and Pr, Raf and tr, Raf and gs, Raf and LUE, Raf and Fru, and Raf and Glu were found. A very strong negative correlation between PSRI and NDVI, a strong positive correlation between PSRI and DV, and moderate positive correlations between PSRI and LA, and PSRI and Suc, were observed. A very strong positive correlation between CRI and ARI, a strong positive correlation between CRI and NDVI, and a negative moderate correlation between CRI and Glu were found. Negative strong correlations between NDVI, DW, LA and Suc were observed.

4. Discussion

The findings of the present study indicate that the presence of different UV-A wavelengths can be conducive for proper growth of red lettuce (Table 2). The response in terms of the dry weight (DW) and leaf area (LA), compared with earlier studies carried out with various plant species, including different microgreens [18], baby leaf lettuce [28], basil, leaf lettuce [14], tomatoes [29], and barley [15] was not unique. An increase of the UV-A wavelength and transduction of light energy from the UV-B to UV-A region, and further to longer wavelengths, resulted in a significant increase of DW and LA, and had no significant effect on plant senescence reflectance (PSRI) nor on the normalized difference vegetation (NDVI) index, which represent the chlorophyll to carotenoid ratio and biomass content, respectively (Table 2). The PSRI and NDVI values showed that plants were subject to very good conditions [30]. The negative correlation suggests that UV-A mediated changes in DW and LA cannot be related to biomass accumulation (NDVI) (Table S1). However, the correlation matrix shows that DW and LA positively correlate with the PSII quantum yield (Fv/Fm and ΦPSII), and negatively correlate with the ratio of intracellular to ambient CO2 content (Ci/Ca). Klem et al. [15] found that the growth of above-ground biomass and photosynthetic performance of barley were enhanced by the combined action of red, blue, far-red, and UV-A (370 nm) light. The formation of LA in basil, beets, and pak choi microgreens was not unique, nor was it UV-A wavelength and/or intensity dependent [18]. One outcome from data analysis is that biomass production decreases with shorter wavelengths of UV-A radiation (Table 2), and this tendency is greater with UV-B radiation [9,20]. The highest values of the carotenoid and anthocyanin reflectance indices (CRI and ARI) and better coloration of red lettuce occurred under RBUV387. Since the phenolic phytochemicals induced by ultraviolet radiation tend to be localized in the leaf epidermal layers, the significantly higher anthocyanin amount under RBUV387 under these treatment conditions may have reduced the photoprotective requirement for chloroplast carotenoids [31]. The changes of the carotenoids to chlorophyll ratio (CRI) was not reflected in the stimulation of carbohydrate production. However, a significant increase of the hexose to sucrose ratio and significant decrease of CRI under RBUV637 (Figure 4, Table 2) were found. The same trend in the photosynthetic rate (Pr) and stomatal conductance (gs) indicated that an increase in the Pr of lettuce under supplemental UV-A radiation was due to the increase of gs, instead of the ratio of intracellular to ambient CO2 content (Ci/Ca) or stomatal limitation (Ci) (Figure 2, Table S1). The existence of a distinct low-fluence and photosynthesis-independent response to blue light was established by Inoue and Kinoshita [32]. However, it is well known that blue light is one of the dominant signals that controls stomatal movements in the leaves of plants in a natural environment [33]. Van Ieperen et al. [34] also reported that blue light is needed to promote stomatal opening, improving access to CO2 and driving transpiration, as well as increasing nutrient uptake and water use efficiency (WUE). This blue light response is mediated by blue/UV-A light-absorbing phototropins and cryptochromes [33]. In this study, neither RB nor supplemental UV-A radiation influenced Ci/Ca or WUE (Figure 2). Moreover, Tr increased with decreasing wavelength of UV-A, and the same trend of gs response to lighting treatments was observed (Figure 2). These data suggest that Tr was mediated by incident thermal radiation instead of stomatal opening [11]. A significant decrease in ΦPSII and Fv/Fm (0.76), but no significant change in NPQ (Figure 3A–C) indicates that photo-inhibition occurred under RBUV367, such that an increasing fraction of the absorbed light energy was dissipated as heat (an upregulation of NPQ) [23]. Moreover, the same trend of ΦPSII and ETR (Figure S1) suggests that RBUV367 leads to a reduction of electron receptors in the electron transport pathway. This results in a closure of PSII reaction centers, since the primary PSII electron acceptors are unable to transfer absorbed electrons to the next carrier in the electron transport chain. These reaction centers re-open after light-induced activation of Calvin cycle enzymes [35]. In contrast to RBUV367, high Fv/Fm values (~0.81) under RB, RBUV402, and RBUV387 indicate that there was no damage to PSII. Despite this, phototropins and cryptochromes were both perceived in the blue and UV-A light, and the activation of these photoreceptors can be expected to have similar effects on plant responses [8,9]. However, the photosynthetic, metabolic, and growth responses of red lettuce to different UV-A wavelengths were not the same. The PCA score scatterplot showed a clear distinction in terms of F1 score between RBUV402 and RBUV367 (Figure 5A). In contrast to 367 nm UV-A radiation, the response to longer UV-A wavelengths was more common than the blue light-mediated response.

5. Conclusions

Treating crops with low dosages of specific narrow-band UV-A radiation at key points in the life cycle could initiate a cascade of responses in the above-ground biomass. We conclude that red leaf lettuces acclimate to longer UV-A wavelengths by increasing biomass production, whereas different UV-A wavelengths had no significant effect either on plant senescence reflectance, or on the normalized difference vegetation index. A significant decrease in the maximum quantum yield of the PSII photochemistry of dark (Fv/Fm) and light (ΦPSII) adapted plants, and non-significant changes in non-photochemical fluorescence quenching, indicate that photo-inhibition occurred under RBUV367, whereas the photosynthetic response under RB, RBUV402, and RBUV387 indicate that there was no damage to PSII. The correlations of the photosynthetic rate (Pr) and stomatal conductance (gs) indicate that the increase in Pr of lettuce under supplemental UV-A radiation was due to the increase of gs, instead of the ratio of intracellular to ambient CO2 content (Ci/Ca) or stomatal limitation (Ci).

Supplementary Materials

The following are available online at https://www.mdpi.com/2073-4395/10/6/761/s1, Figure S1: Electron transport rate (ETR) of lettuce subjected to different light qualities, Table S1: The correlation matrix (Pearson (n)) between the photosynthetic indices, metabolites, and growth indices in lettuce.

Author Contributions

Data analysis, writing of the manuscript, G.S.; common coordination of the experiment, modeling of light parameters, data summarizing, A.V.; realization of lighting schedules in vegetative experiments, data analysis, A.B.; chromatographic analysis, P.H.; measurement of photosynthetic and optical indices, J.M., K.L.; realization of vegetative experiments, biometric measurements, J.J., A.K.; maintenance and control of LED lighting units, A.N. All authors have read and agreed to the published version of the manuscript.

Funding

This research was funded by the European Regional Development Fund according to the supported activity ‘Research Projects Implemented by World-Class Researcher Groups’ under Measure No. 01.2.2-LMT-K-718-01-0049.

Conflicts of Interest

The authors declare that they have no conflicts of interest.

References

  1. Davis, P.A.; Burns, C. Photobiology in protected horticulture. Food Energy Secur. 2016, 5, 223–238. [Google Scholar] [CrossRef]
  2. Samuolienė, G.; Brazaitytė, A.; Vaštakaitė, V. Light-emitting diodes (LEDs) for improved nutritional quality. In Light Emitting Diodes for Agriculture; Dutta Gupta, S., Ed.; Springer: Singapore, 2017; pp. 149–190. [Google Scholar]
  3. Stutte, G.W.; Edney, S.; Skerritt, T. Photoregulation of bioprotectant content of red leaf lettuce with light-emitting diodes. HortScience 2009, 44, 79–82. [Google Scholar] [CrossRef] [Green Version]
  4. Bantis, F.; Smirnakou, S.; Ouzounis, T.; Koukounaras, A.; Ntagkas, N.; Radoglou, K. Current status and recent achievements in the field of horticulture with the use of light-emitting diodes (LEDs). Sci. Hortic. 2018, 235, 437–541. [Google Scholar] [CrossRef]
  5. Cocetta, G.; Casciani, D.; Bulgari, R.; Musante, F.; Kołton, A.; Rossi, M.; Ferrante, A. Light use efficiency for vegetables production in protected and indoor environments. Eur. Phys. J. Plus 2017, 132, 43. [Google Scholar] [CrossRef]
  6. Olle, M.; Viršilė, A. The effects of light-emitting diode lighting on greenhouse plant growth and quality. Agric. Food Sci. 2013, 22, 223–234. [Google Scholar] [CrossRef]
  7. Wargent, J.J. UV LEDs in horticulture: From biology to application. Acta Hortic. 2016, 1134, 25–32. [Google Scholar] [CrossRef]
  8. Casal, J.J. Photoreceptor signaling networks in plant responses to shade. Annu. Rev. Plant Biol. 2013, 64, 403–427. [Google Scholar] [CrossRef]
  9. Huché-Thélier, L.; Crespel, L.; Le Gourrierec, J.; Morel, P.; Sakr, S.; Leduc, N. Light signaling and plant responses to blue and UV radiations–perspectives for applications in horticulture. J. Environ. Exp. Bot. 2016, 121, 22–38. [Google Scholar] [CrossRef]
  10. Jenkins, G.I. The UV-B photoreceptor UVR8: From structure to physiology. Plant Cell 2014, 26, 21–37. [Google Scholar] [CrossRef] [Green Version]
  11. Barillot, R.; Frak, E.; Combes, D.; Durand, J.-L.; Escobar-Gutiérrez, A.J. What determines the complex kinetics of stomatal conductance under blue less PAR in Festuca arundinacea? Subsequent effects on leaf transpiration. J. Exp. Bot. 2010, 61, 2795–2806. [Google Scholar] [CrossRef] [Green Version]
  12. Sager, J.C.; Smith, W.O.; Edwards, J.L.; Cyr, K.L. Photosynthetic efficiency and phytochrome photoequilibria determination using spectral data. Trans. Am. Soc. Agric. Eng. 1988, 31, 1882–1889. [Google Scholar] [CrossRef]
  13. Lawson, T. Guard cell photosynthesis and stomatal function. New Phytol. 2009, 181, 13–34. [Google Scholar] [CrossRef] [PubMed]
  14. Bantis, F.; Ouzounis, T.; Radoglou, K. Artificial LED lighting enhances growth characteristics and total phenolic content of Ocimum basilicum, but variably affects transplant success. Sci. Hortic. (Amst.) 2016, 198, 277–283. [Google Scholar] [CrossRef] [Green Version]
  15. Klem, K.; Gargallo-Garriga, A.; Rattanapichai, W.; Oravec, M.; Holub, P.; Veselá, B.; Sardans, J.; Peñuelas, J.O. Urban, distinct morphological, physiological, and biochemical responses to light quality in barley leaves and roots. Front. Plant Sci. 2019, 10, 1026. [Google Scholar] [CrossRef] [Green Version]
  16. Štroch, M.; Meterová, Z.; Vrábl, D.; Karlický, V.; Šigut, L.; Nezval, J.; Špunda, V. Protective effect of UV-A radiation during acclimation of the photosynthetic apparatus to UV-B treatment. Plant Physiol. Biochem. 2015, 96, 90–96. [Google Scholar] [CrossRef]
  17. Lee, M.J.; Son, J.E.; Oh, M.M. Growth and phenolic compounds of Lactuca sativa L. grown in a closed-type plant production system with UV-A -B, or -C lamp. J. Sci. Food Agric. 2014, 94, 197–204. [Google Scholar] [CrossRef]
  18. Brazaitytė, A.; Viršilė, A.; Jankauskienė, J.; Sakalauskienė, S.; Samuolienė, G.; Sirtautas, R.; Novičkovas, A.; Dabašinskas, L.; Miliauskienė, J.; Vaštakaitė, V.; et al. Effect of supplemental UV-A irradiation in solid-state lighting on the growth and phytochemical content of microgreens. Int. Agrophys. 2015, 29, 13–22. [Google Scholar] [CrossRef]
  19. Brazaitytė, A.; Viršilė, A.; Samuolienė, G.; Vaštakaitė-Kairienė, V.; Jankauskienė, J.; Miliauskienė, J.; Novičkovas, A.; Duchovskis, P. Response of mustard microgreens to different wavelengths and durations of UV-A LEDs. Front. Plant Sci. 2019, 10, 1153. [Google Scholar] [CrossRef] [Green Version]
  20. Verdaguer, D.; Jansen, M.A.K.; Llorens, L.; Morales, L.O.; Neugart, S. UV-A radiation effects on higher plants: Exploring the known unknown. Plant Sci. 2017, 255, 72–81. [Google Scholar] [CrossRef]
  21. Kataria, S.; Guruprasad, K.N.; Ahuja, S.; Singh, B. Enhancement of growth, photosynthetic performance and yield by exclusion of ambient UV components in C3 and C4 plants. J. Photochem. Photobiol. B Biol. 2013, 127, 140–152. [Google Scholar] [CrossRef]
  22. Thenkabail, P.S.; Smith, R.B.; De Pauw, E. Hyperspectral vegetation indices and their relationships with agricultural crop characteristics. Remote Sens. Environ. 2000, 71, 158–182. [Google Scholar] [CrossRef]
  23. Van Iersel, M.W.; Weaver, G.; Martin, M.T.; Ferrarezi, R.S.; Mattos, E.; Haidekker, M. A chlorophyll fluorescence-based biofeedback system to control photosynthetic lighting in controlled environment agriculture. J. Am. Soc. Hortic. Sci. 2016, 141, 169–176. [Google Scholar] [CrossRef] [Green Version]
  24. Verdaguer, D.; Díaz-Guerra, L.; Fonta, J.; González, J.A.; Llorens, L. Contrasting seasonal morphological and physio-biochemical responses to UV radiation and reduced rainfall of two mature naturally growing Mediterranean shrubs in the context of climate change. Environ. Exp. Bot. 2018, 147, 189–201. [Google Scholar] [CrossRef]
  25. Baker, N.R. Chlorophyll fluorescence: A probe of photosynthesis in vivo. Annu. Rev. Plant Biol. 2008, 59, 89–113. [Google Scholar] [CrossRef] [PubMed] [Green Version]
  26. Ma, C.; Sun, Z.; Chen, C.; Zhang, L.; Zhu, S. Simultaneous separation and determination of fructose, sorbitol, glucose and sucrose in fruits by HPLC–ELSD. Food Chem. 2014, 145, 784–788. [Google Scholar] [CrossRef]
  27. Brons, C.; Olieman, C. Study of the high-performance liquid chromatographic separation of reducing sugars, applied to the determination of lactose in milk. J. Chromatogr. 1983, 259, 79–86. [Google Scholar] [CrossRef]
  28. Li, Q.; Kubota, C. Effects of supplemental light quality on growth and phytochemicals of baby leaf lettuce. Environ. Exp. Bot. 2009, 67, 59–64. [Google Scholar] [CrossRef]
  29. Khoshimkhujaev, B.; Kwon, J.K.; Park, K.S.; Choi, H.G.; Lee, S.Y. Effect of monochromatic UV-A LED irradiation on the growth of tomato seedlings. Hortic. Environ. Biotechnol. 2014, 55, 287–292. [Google Scholar] [CrossRef]
  30. Zagajewski, B.; Tømmervik, H.; Bjerke, J.W.; Raczko, E.; Bochenek, Z.; Kłos, A.; Jarocińska, A.; Lavender, S.; Ziółkowski, D. Intraspecific differences in spectral reflectance curves as indicators of reduced vitality in high-arctic plants. Remote Sens. 2017, 9, 1289. [Google Scholar] [CrossRef] [Green Version]
  31. Britz, S.J.; Caldwell, C.R.; Mirecki, R.; Slusser, J.; Gao, W. Effect of supplemental ultraviolet radiation on the concentration of phytonutrients in green and red leaf lettuce (Lactuca sativa) cultivars. In Proceedings of SPIE 5886, Ultraviolet Ground- and Space-Based Measurements, Models, and Effects V, 58860W; International Society for Optics and Photonics: San Francisco, CA, USA, 2005; Volume 5886, pp. 1–8. [Google Scholar] [CrossRef]
  32. Inoue, S.-I.; Kinoshita, T. Blue light regulation of stomatal opening and the plasma membrane H1-ATPase. Plant Physiol. 2017, 174, 531–538. [Google Scholar] [CrossRef] [Green Version]
  33. Chen, C.; Xiao, Y.G.; Li, X.; Ni, M. Light-regulated stomatal aperture in Arabidopsis. Mol. Plant 2012, 5, 566–572. [Google Scholar] [CrossRef] [PubMed] [Green Version]
  34. Van Ieperen, W.; Savvides, A.; Fanourakis, D. Red and blue light effects during growth on hydraulic and stomatal conductance in leaves of young cucumber plants. Acta Hortic. 2012, 956, 223–230. [Google Scholar] [CrossRef] [Green Version]
  35. Maxwell, K.; Johnson, G.N. Chlorophyll fluorescence—A practical guide. J. Exp. Bot. 2000, 51, 659–668. [Google Scholar] [CrossRef] [PubMed]
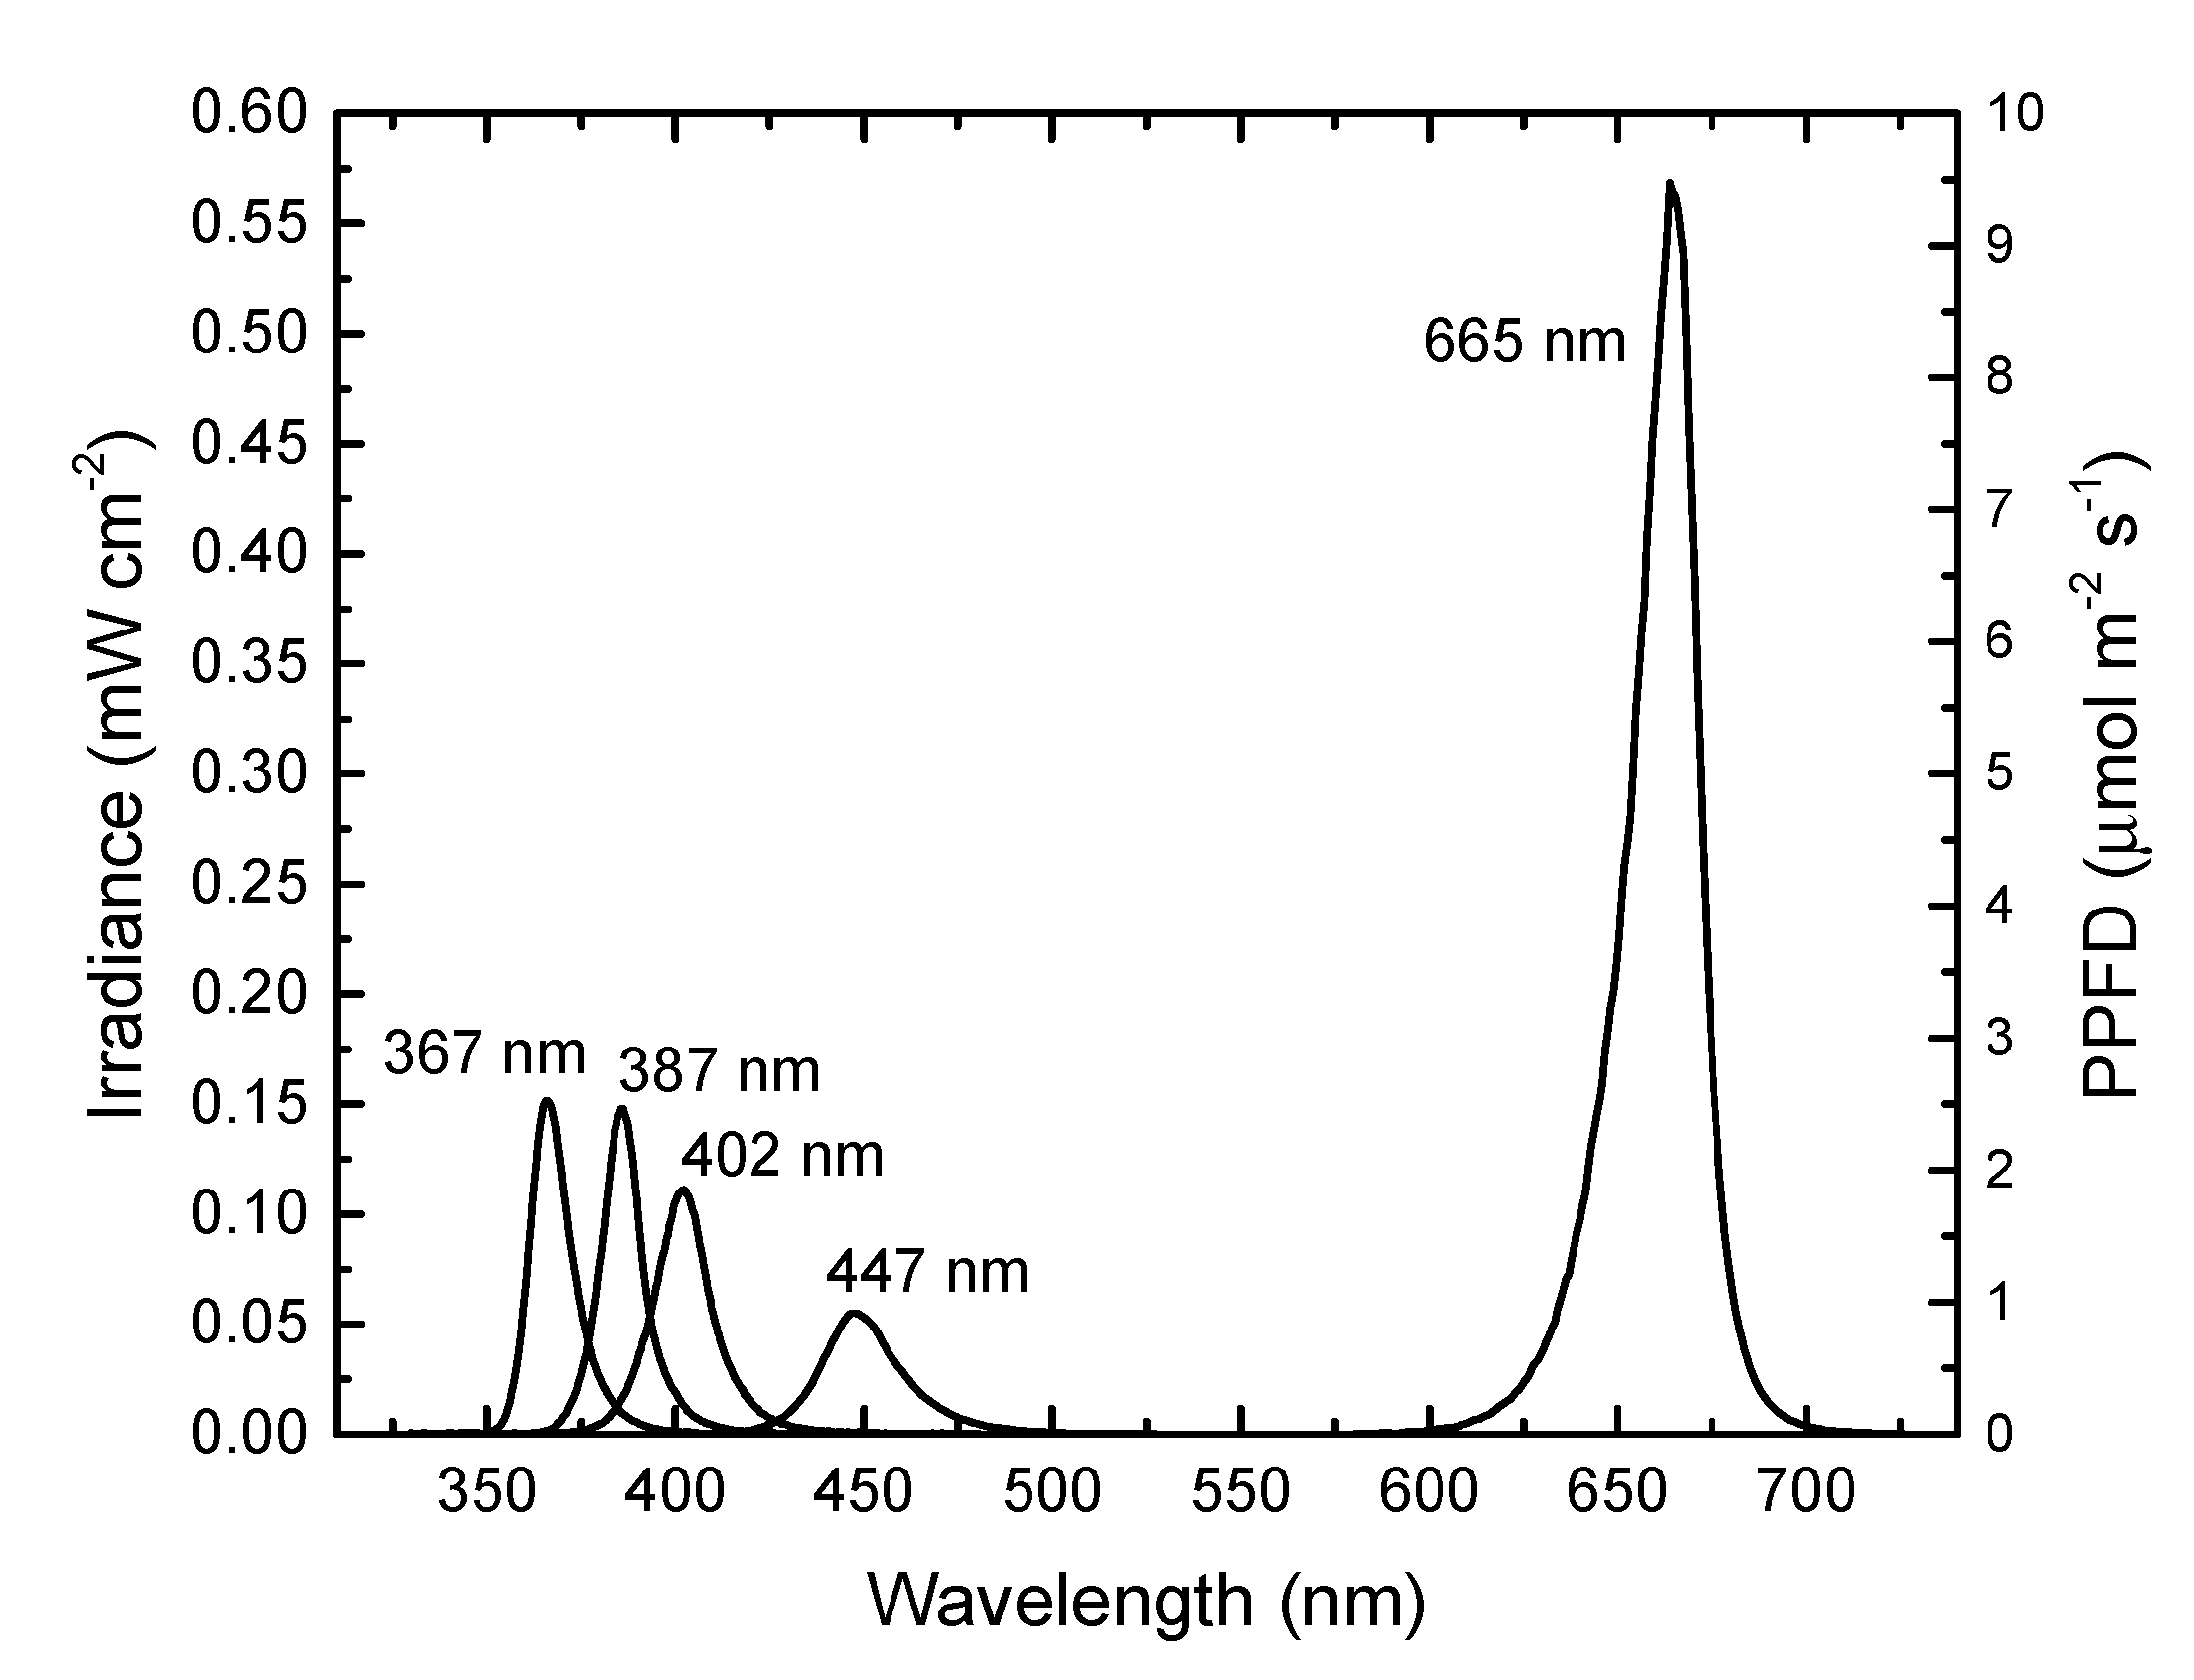
Figure 1. Emission spectra of the LEDs used in the lighting equipment. UV-A at 367, 387 and 402 nm is represented on the left axis as irradiance (mW cm−2); blue 447 nm and red 665 nm are represented on the right axis as photosynthetic photon flux density (PPFD) (µmol m−2 s−1).
Agronomy 10 00761 g001
Figure 2. Photosynthetic status of lettuce subjected to different light qualities: RB—Red 662 and Blue 452 nm (Control); BRUV402—Control with UV-A 402 nm; BRUV387—Control with UV-A 387 nm; BRUV367—Control with UV-A 367 nm. Total PPFD was maintained at 250 µmol m−2 s−1, changing the input of red to 662 nm. The data were processed using XLStat software and the Tukey (HSD) test at a confidence level of p = 0.05 (biological replicates, n = 5). Different letters indicate significant differences at p < 0.05. Pr (a)—photosynthetic rate, gs (b)—stomatal conductance, Ci/Ca (c)—ratio between intracellular and ambient CO2 content, Tr (d)—transpiration rate, WUE (e)—water use efficiency, LUE (f)—light use efficiency.
Agronomy 10 00761 g002
Figure 3. Quantum efficiency of PSII photochemistry (a,b), non-photochemical fluorescence quenching (NPQ) (c), and the photochemical reflectance index (PRI) photochemistry (d) of lettuce subjected to different light qualities: RB—Red 662 and Blue 452 nm (Control); BRUV402—Control with UV-A 402 nm; BRUV387—Control with UV-A 387 nm; BRUV367—Control with UV-A 367 nm. Total PPFD was maintained at 250 µmol m−2 s−1, changing the input of red to 662 nm. The data were processed using XLStat software and the Tukey (HSD) test at a confidence level of p = 0.05 (biological replicates, n = 5). Different letters indicate significant differences at p < 0.05. Fv/Fm—maximum quantum yield of PSII photochemistry of dark-adapted plants; ΦPSII—actual quantum yield of PSII photochemistry of light-adapted plants.
Agronomy 10 00761 g003
Figure 4. Alteration of soluble sugars of lettuce subjected to different light qualities: RB—Red 662 and Blue 452 nm (Control); BRUV402—Control with UV-A 402 nm; BRUV387—Control with UV-A 387 nm; BRUV367—Control with UV-A 367 nm. Total PPFD was maintained at 250 µmol m−2 s−1, changing the input of red to 662 nm. The data were processed using XLStat software and the Tukey (HSD) test at a confidence level of p = 0.05 (biological replicates, n = 5). Different letters indicate significant differences at p < 0.05. Fru—fructose, Glu—glucose, Suc—sucrose, Raf—raffinose, Hex—sum of hexoses.
Agronomy 10 00761 g004
Figure 5. Principal component analysis (PCA) (A) and correlation circle (B) demonstrating the photosynthetic, metabolic, and growth responses of lettuce subjected to different light qualities: RB—Red 662 and Blue 452 nm (Control); BRUV402—Control with UV-A 402 nm; BRUV387—Control with UV-A 387 nm; BRUV367—Control with UV-A 367 nm. Total PPFD was maintained at 250 µmol m−2 s−1, changing the input of red to 662 nm. The data were processed using XLStat software and the Tukey (HSD) test at a confidence level of p = 0.05 (biological replicates, n = 5).
Agronomy 10 00761 g005
Table 1. Experimental lighting conditions.
TreatmentR665
mol m−2 s−1
B447
mol m−2 s−1
UV402
mW cm−2
UV387
mW cm−2
UV367
mW cm−2
RB22525
RBUV402225252.2
RBUV38722525 2.2
RBUV36722525 2.2
Table 2. Leaf pigments and growth characteristics of lettuce subjected to different light qualities.
TreatmentsCRIARIPSRINDVIDW, gLA cm2
RB0.15b 0.030.12b 0.020.03a 0.010.77a 0.050.96ab 0.09798.8ab 98.4
RBUV4020.08b 0.040.05c 0.010.06a 0.040.65a 0.161.17a 0.23899.5a 81.1
RBUV3870.26a 0.020.17a 0.020.03a 0.000.85a 0.020.81b 0.11626.0bc 93.4
BRUV3670.10b 0.020.03c 0.010.01a 0.000.83a 0.000.63b 0.02576.5c 59.3
Agronomy 10 00761 i001 Agronomy 10 00761 i002 Agronomy 10 00761 i003 Agronomy 10 00761 i004
RBRBUV402RBUV387RBUV367
RB—Red 662 and Blue 452 nm (Control); BRUV402—Control with UV-A 402 nm; BRUV387—Control with UV-A 387 nm; BRUV367—Control with UV-A 367 nm. Total PPFD was maintained at 250 µmol m−2 s−1, changing the input of red to 662 nm. The data were processed using XLStat software and the Tukey (HSD) test at a confidence level of p = 0.05 (biological replicates, n = 5). CRI—carotenoids/chlorophyll ratio, ARI—anthocyanin amount, PSRI—dry or senescent carbon, NDVI—biomass content, DW—dry weight, LA—leaf area.