QTL Mapping for Resistance to Early Blight in a Tetraploid Potato Population


Abstract
1. Introduction
2. Materials and Methods
2.1. Plant Material and Crossing
2.2. Field Experiments
2.3. Inoculum Preparation
2.4. Tuber Resistance Test
2.5. Data Analysis
2.6. Linkage Mapping and QTL Analysis
3. Results
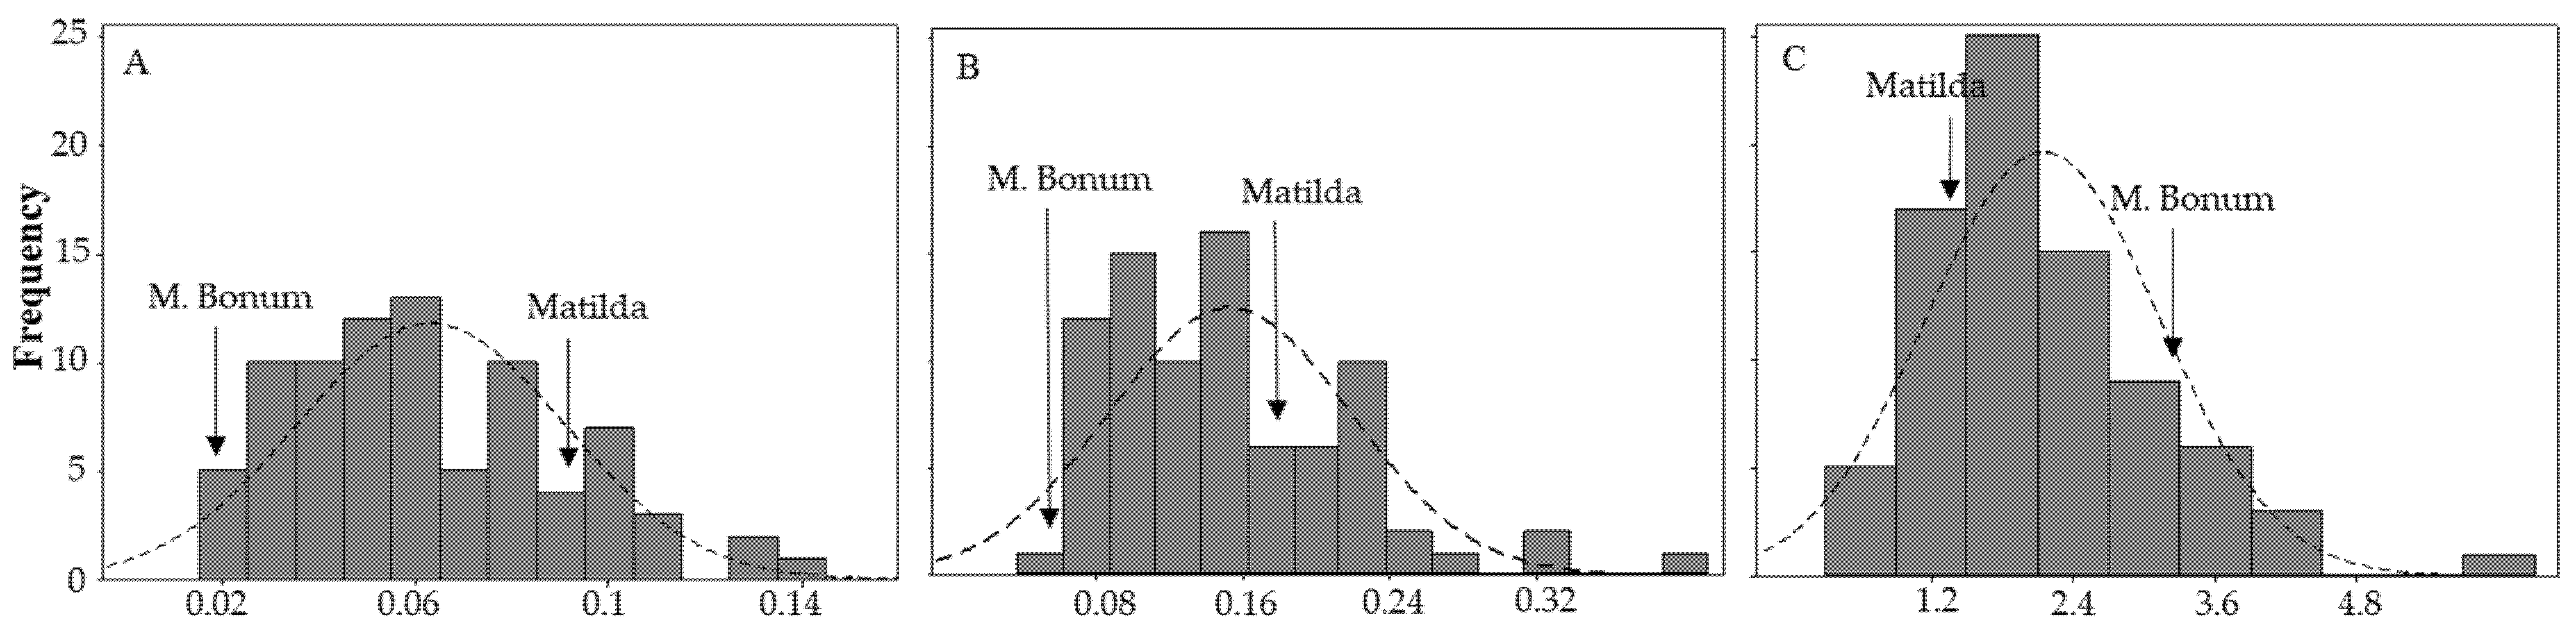
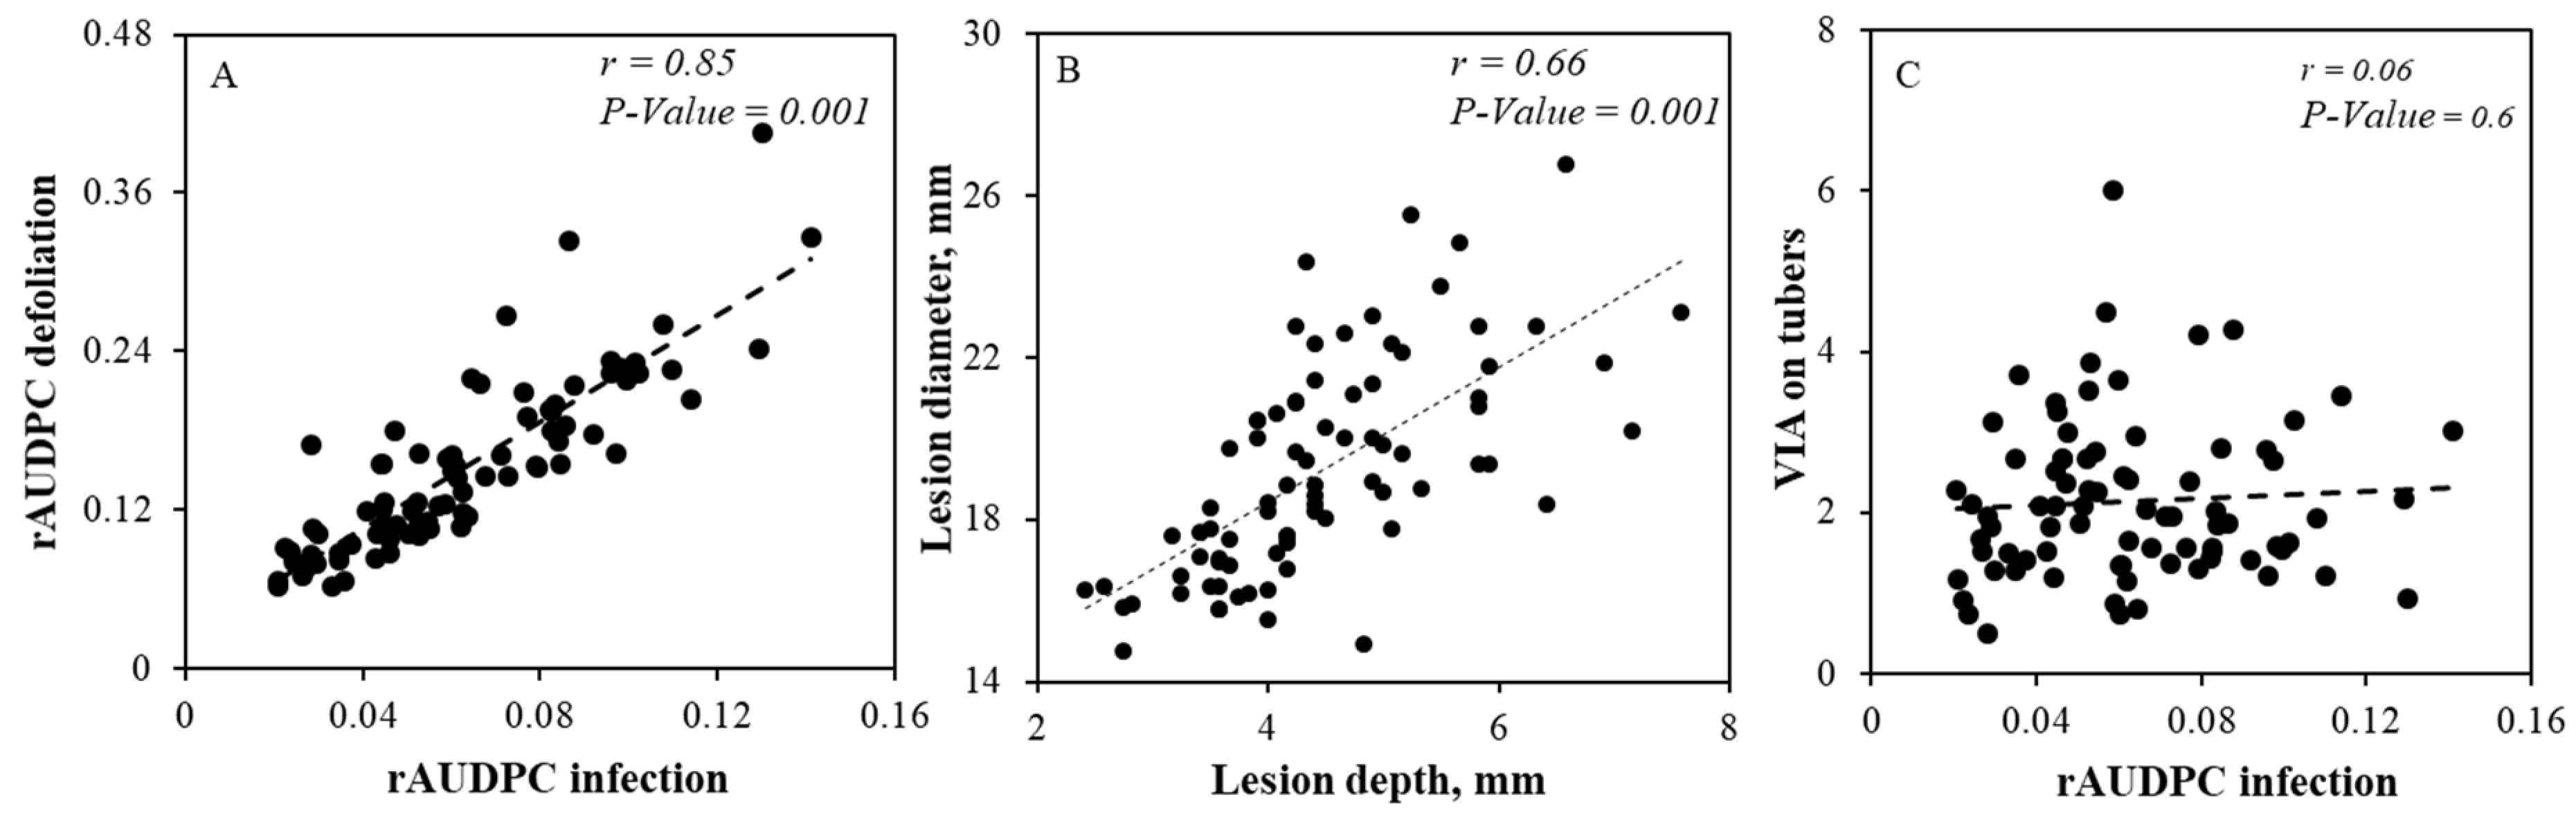
3.1. Phenotyping
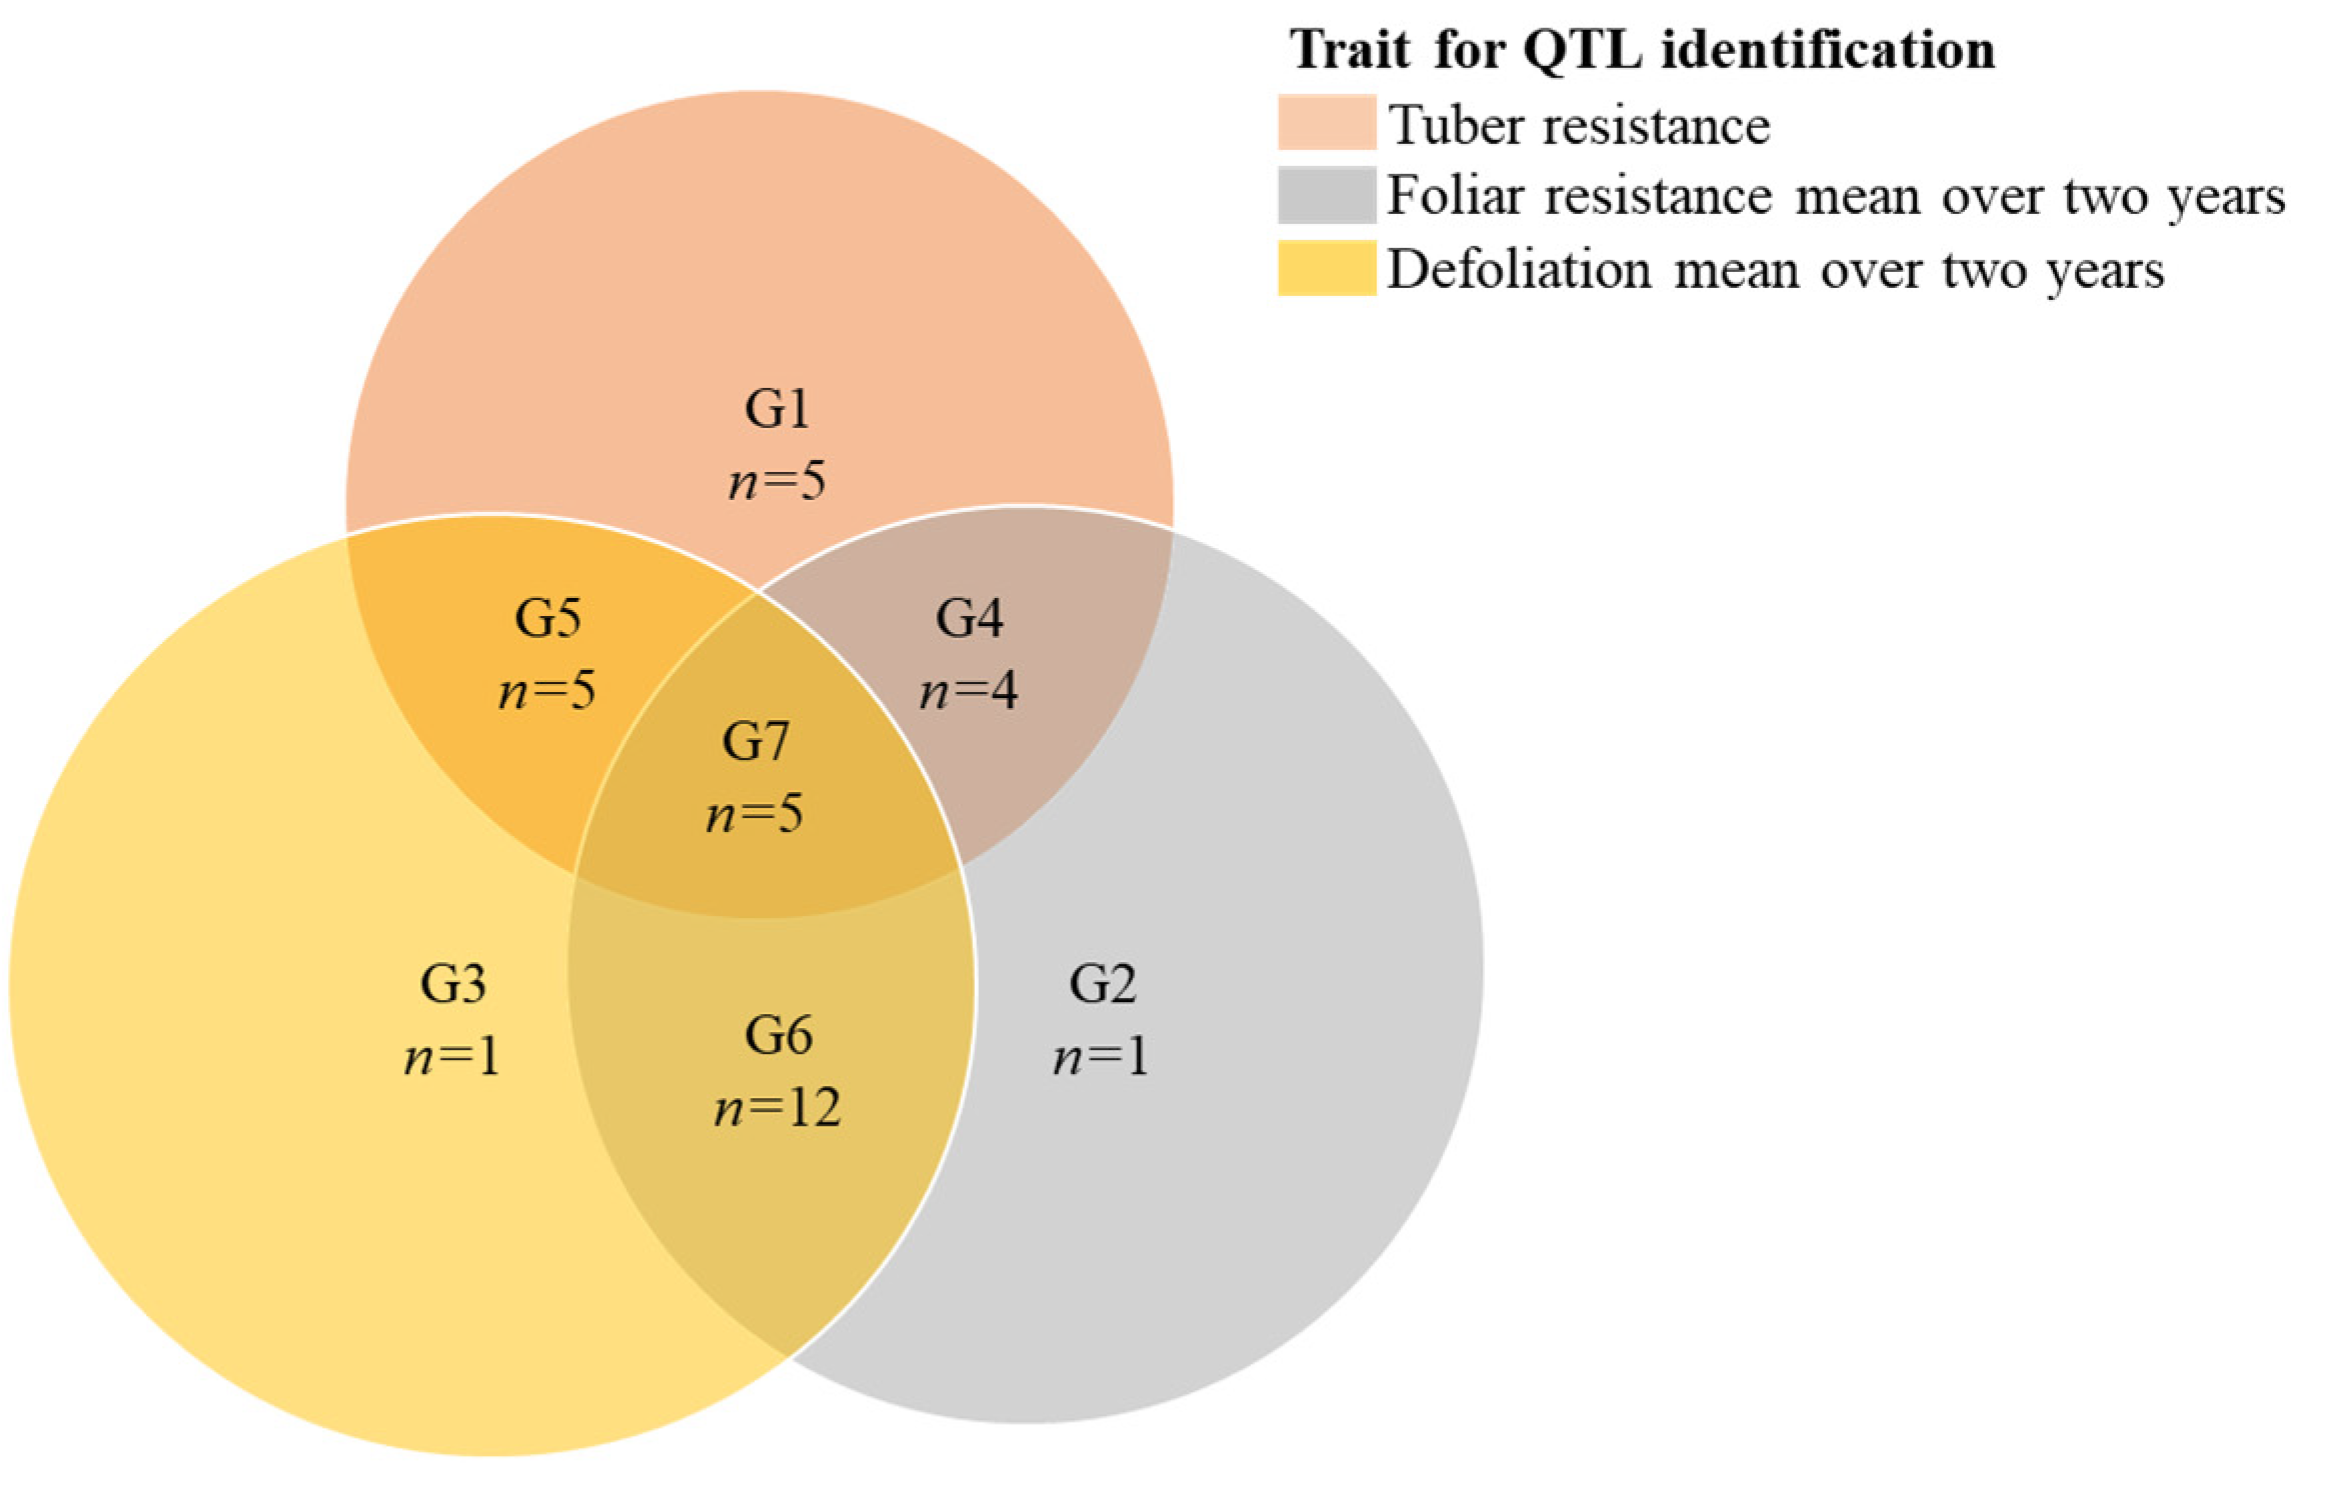
3.2. Linkage Map Construction
4. Discussion
5. Conclusions
Supplementary Materials
Author Contributions
Funding
Acknowledgments
Conflicts of Interest
References
- FAOSTAT. Food and Agriculture Organization. 2017. Available online: http://faostat.Fao.Org (accessed on 22 March 2018).
- Shuman, J.; Christ, B. Integrating a host-resistance factor into the fast system to forecast early blight of potato. Am. J. Potato Res. 2005, 82, 9–19. [Google Scholar] [CrossRef]
- van der Waals, J.E.; Korsten, L.; Aveling, T.A.S.; Denner, F.D.N. Influence of environmental factors on field concentrations of Alternaria solani conidia above a south african potato crop. Phytoparasitica 2003, 31, 353–364. [Google Scholar] [CrossRef]
- Leiminger, J.H.; Hausladen, H. Early blight control in potato using disease-orientated threshold values. Plant Dis. 2012, 96, 124–130. [Google Scholar] [CrossRef] [PubMed]
- Nnodu, E.C.; Harrison, M.D.; Parke, R.V. The effect of temperature and relative humidity on wound-healing and infection of potato tubers by Alternaria solani. Am. Potato J. 1982, 59, 297–311. [Google Scholar] [CrossRef]
- Al-Mughrabi, K.I. Efficacy of oxidate for control of early blight (Alternaria solani) in potato storages. Plant Pathol. J. 2005, 4, 1–4. [Google Scholar]
- Runno-Paurson, E.; Loit, K.; Hansen, M.; Tein, B.; Williams, I.H.; Maend, M. Early blight destroys potato foliage in the northern baltic region. Acta Agric. Scand. Sect. B—Soil Plant Sci. 2015, 65, 422–432. [Google Scholar] [CrossRef]
- Kapsa, J.S.; Osowski, J. Host-pathogen interaction between Alternaria species and S. tuberosum under different conditions. Spec. Rep. 2012, 15, 107–112. [Google Scholar]
- Edin, E.; Andersson, B. The early blight situation in Sweden-species abundance and strobilurin sensitivity. PPO Spec. Rep. 2014, 16, 83–84. [Google Scholar]
- Rodriguez, M.A.D.; Brommonschenkel, S.H.; Matsuoka, K.; Mizubuti, E.S.G. Components of resistance to early blight in four potato cultivars: Effect of leaf position. J. Phytopathol. 2006, 154, 230–235. [Google Scholar] [CrossRef]
- Campo Arana, R.O.; Zambolim, L.; Costa, L.C. Potato early blight epidemics and comparison of methods to determine its initial symptoms in a potato field. Rev. Fac. Nac. de Agron Medellín 2007, 60, 3877–3890. [Google Scholar]
- Leiminger, J.H.; Adolf, B.; Hausladen, H. Occurrence of the F129L mutation in Alternaria solani populations in germany in response to qoi application, and its effect on sensitivity. Plant Pathol. 2014, 63, 640–650. [Google Scholar] [CrossRef]
- Edin, E.; Liljeroth, E.; Andersson, B. Long term field sampling in Sweden reveals a shift in occurrence of cytochrome b genotype and amino acid substitution F129L in Alternaria solani, together with a high incidence of the G143A substitution in Alternaria alternata. Eur. J. Plant Pathol. 2019, 155, 1–15. [Google Scholar] [CrossRef]
- Odilbekov, F.; Edin, E.; Mostafanezhad, H.; Coolman, H.; Grenville-Briggs, L.J.; Liljeroth, E. Within-season changes in Alternaria solani populations in potato in response to fungicide application strategies. Eur. J. Plant Pathol. 2019, 155, 953–965. [Google Scholar] [CrossRef]
- Haverkort, A.J.; Boonekamp, P.M.; Hutten, R.; Jacobsen, E.; Lotz, L.A.P.; Kessel, G.J.T.; Visser, R.G.F.; van der Vossen, E.A.G. Societal costs of late blight in potato and prospects of durable resistance through cisgenic modification. Potato Res. 2008, 51, 47–57. [Google Scholar] [CrossRef]
- Herriott, A.B.; Haynes, F.L., Jr.; Shoemaker, P.B. Inheritance of resistance to early blight disease in tetraploid x diploid crosses of potatoes. HortScience 1990, 25, 224–226. [Google Scholar] [CrossRef]
- Abuley, I.K.; Nielsen, B.J.; Labouriau, R. Resistance status of cultivated potatoes to early blight (Alternaria solani) in Denmark. Plant Pathol. 2018, 67, 315–326. [Google Scholar] [CrossRef]
- Christ, B.J. Effect of disease assessment method on ranking potato cultivars for resistance to early blight. Plant Dis. 1991, 75, 353–356. [Google Scholar] [CrossRef]
- Odilbekov, F.; Carlson-Nilsson, U.; Liljeroth, E. Phenotyping early blight resistance in potato cultivars and breeding clones. Euphytica 2014, 197, 87–97. [Google Scholar] [CrossRef]
- Duarte, H.S.S.; Zambolim, L.; Rodrigues, F.A.; Paul, P.A.; Pádua, J.G.; Ribeiro Júnior, J.I.; Júnior, A.F.N.; Rosado, A.W.C. Field resistance of potato cultivars to foliar early blight and its relationship with foliage maturity and tuber skin types. Trop. Plant Pathol. 2014, 39, 294–306. [Google Scholar] [CrossRef]
- Xue, W.; Haynes, K.G.; Qu, X. Characterization of early blight resistance in potato cultivars. Plant Dis. 2019, 103, 629–637. [Google Scholar] [CrossRef]
- Boiteux, L.S.; Reifschneider, F.J.B.; Fonseca, M.E.N.; Buso, J.A. Search for sources of early blight (Alternaria solani) field resistance not associated with vegetative late maturity in tetraploid potato germplasm. Euphytica 1995, 83, 63–70. [Google Scholar] [CrossRef]
- Zhang, R. Genetic characterization and mapping of partial resistance to early blight in diploid potato. Ph.D. Thesis, The Pennsylvania State University, University Park, PA, USA, 2004. [Google Scholar]
- Ortiz, R.; Martin, C.; Iwanaga, M.; Torres, H. Inheritance of early blight resistance in diploid potatoes. Euphytica 1993, 71, 15–19. [Google Scholar] [CrossRef]
- Christ, B.J.; Haynes, K.C. Inheritance of resistance to early blight disease in a diploid potato population. Plant Breed. 2001, 120, 169–172. [Google Scholar] [CrossRef]
- Christ, B.J.; Haynes, K.G.; Vinyard, B.T. Inheritance of early blight resistance from open-pollinated 4x-2x potato hybrids. Am. J. Potato Res. 2002, 79, 403–410. [Google Scholar] [CrossRef]
- Massa, A.N.; Manrique-Carpintero, N.C.; Coombs, J.; Haynes, K.G.; Bethke, P.C.; Brandt, T.L.; Gupta, S.K.; Yencho, G.C.; Novy, R.G.; Douches, D.S. Linkage analysis and QTL mapping in a tetraploid russet mapping population of potato. BMC Genet. 2018, 19, 87. [Google Scholar] [CrossRef]
- Hamilton, J.P.; Hansey, C.N.; Whitty, B.R.; Stoffel, K.; Massa, A.N.; Van Deynze, A.; De Jong, W.S.; Douches, D.S.; Buell, C.R. Single nucleotide polymorphism discovery in elite north american potato germplasm. BMC Genom. 2011, 12, 302. [Google Scholar] [CrossRef]
- Vos, P.G.; Uitdewilligen, J.G.; Voorrips, R.E.; Visser, R.G.; van Eck, H.J. Development and analysis of a 20k snp array for potato (Solanum tuberosum): An insight into the breeding history. Theor. Appl. Genet. 2015, 128, 2387–2401. [Google Scholar] [CrossRef]
- Sharma, S.K.; Bolser, D.; de Boer, J.; Sønderkær, M.; Amoros, W.; Carboni, M.F.; D’Ambrosio, J.M.; de la Cruz, G.; Di Genova, A.; Douches, D.S. Construction of reference chromosome-scale pseudomolecules for potato: Integrating the potato genome with genetic and physical maps. G3 Genes Genomes Genet. 2013, 3, 2031–2047. [Google Scholar] [CrossRef]
- Massa, A.N.; Manrique-Carpintero, N.C.; Coombs, J.J.; Zarka, D.G.; Boone, A.E.; Kirk, W.W.; Hackett, C.A.; Bryan, G.J.; Douches, D.S. Genetic linkage mapping of economically important traits in cultivated tetraploid potato (Solanum tuberosum L.). G3 Genes Genomes Genet. 2015, 5, 2357–2364. [Google Scholar]
- Lindqvist-Kreuze, H.; Gastelo, M.; Perez, W.; Forbes, G.A.; de Koeyer, D.; Bonierbale, M. Phenotypic stability and genome-wide association study of late blight resistance in potato genotypes adapted to the tropical highlands. Phytopathology 2014, 104, 624–633. [Google Scholar] [CrossRef]
- Santa, J.D.; Berdugo-Cely, J.; Cely-Pardo, L.; Soto-Suárez, M.; Mosquera, T. QTL analysis reveals quantitative resistant loci for Phytophthora infestans and Tecia solanivora in tetraploid potato (Solanum tuberosum L.). PLoS ONE 2018, 13, e0199716. [Google Scholar] [CrossRef] [PubMed]
- Da Silva, W.L.; Ingram, J.; Hackett, C.A.; Coombs, J.J.; Douches, D.; Bryan, G.J.; De Jong, W.; Gray, S. Mapping loci that control tuber and foliar symptoms caused by PVY in autotetraploid potato (Solanum tuberosum L.). G3 Genes Genomes Genet. 2017, 7, 3587–3595. [Google Scholar]
- Schönhals, E.M.; Ding, J.; Ritter, E.; Paulo, M.J.; Cara, N.; Tacke, E.; Hofferbert, H.-R.; Lübeck, J.; Strahwald, J.; Gebhardt, C. Physical mapping of QTL for tuber yield, starch content and starch yield in tetraploid potato (Solanum tuberosum L.) by means of genome wide genotyping by sequencing and the 8.3 K solcap snp array. BMC Genom. 2017, 18, 642. [Google Scholar] [CrossRef] [PubMed]
- Manrique-Carpintero, N.C.; Coombs, J.J.; Pham, G.M.; Laimbeer, F.P.E.; Braz, G.T.; Jiang, J.; Veilleux, R.E.; Buell, C.R.; Douches, D.S. Genome reduction in tetraploid potato reveals genetic load, haplotype variation, and loci associated with agronomic traits. Front. Plant Sci. 2018, 9. [Google Scholar] [CrossRef] [PubMed]
- Tiemens-Hulscher, M.; Delleman, J. Potato Breeding: A Practical Manual for the Potato Chain; S.l.: Aardappelwereld, The Natherlands, 2013. [Google Scholar]
- OEPP/EPPO. Eppo standards. Efficacy evaluation of plant protection products. In Fungicides and Bactericides; European and Mediterranean Plant Protection Organization: Paris, France, 2004; Volume 2. [Google Scholar]
- Simmons, E.G. Alternaria: An identification Manual; CBS Fungal Biodiversity Centre: Utrecht, The Netherlands, 2007. [Google Scholar]
- Gannibal, P.B.; Orina, A.S.; Mironenko, N.V.; Levitin, M.M. Differentiation of the closely related species, Alternaria solani and A. tomatophila, by molecular and morphological features and aggressiveness. Eur. J. Plant Pathol. 2014, 139, 609–623. [Google Scholar] [CrossRef]
- Covarrubias-Pazaran, G. Genome-assisted prediction of quantitative traits using the R package sommer. PLoS ONE 2016, 11, e0156744. [Google Scholar] [CrossRef]
- Hackett, C.A.; Milne, I.; Bradshaw, J.E.; Luo, Z. Tetraploidmap for windows: Linkage map construction and QTL mapping in autotetraploid species. J. Hered. 2007, 98, 727–729. [Google Scholar] [CrossRef]
- Rak, K.; Bethke, P.C.; Palta, J.P. QTL mapping of potato chip color and tuber traits within an autotetraploid family. Mol. Breed. 2017, 37, 15. [Google Scholar] [CrossRef]
- Bradshaw, J.E.; Hackett, C.A.; Pande, B.; Waugh, R.; Bryan, G.J. QTL mapping of yield, agronomic and quality traits in tetraploid potato (Solanum tuberosum subsp tuberosum). Theor. Appl. Genet. 2008, 116, 193–211. [Google Scholar] [CrossRef]
- McCord, P.H.; Sosinski, B.R.; Haynes, K.; Clough, M.; Yencho, G. QTL mapping of internal heat necrosis in tetraploid potato. Theor. Appl. Genet. 2011, 122, 129–142. [Google Scholar] [CrossRef]
- Luo, Z.; Hackett, C.; Bradshaw, J.; McNicol, J.; Milbourne, D. Construction of a genetic linkage map in tetraploid species using molecular markers. Genetics 2001, 157, 1369–1385. [Google Scholar] [PubMed]
- Hackett, C.; Bradshaw, J.; McNicol, J. Interval mapping of quantitative trait loci in autotetraploid species. Genetics 2001, 159, 1819–1832. [Google Scholar] [PubMed]
- Pelletier, J.R.; Fry, W.E. Characterization of resistance to early blight in three potato cultivars: Incubation period, lesion expansion rate, and spore production. Phytopathology 1989, 79, 511–517. [Google Scholar]
- Meyer, R.; Milbourne, D.; Hackett, C.; Bradshaw, J.; McNichol, J.; Waugh, R. Linkage analysis in tetraploid potato and association of markers with quantitative resistance to late blight (Phytophthora infestans). Mol. Gen. Genet. 1998, 259, 150–160. [Google Scholar] [CrossRef] [PubMed]
- Hackett, C.A.; Boskamp, B.; Vogogias, A.; Preedy, K.F.; Milne, I. Tetraploidsnpmap: Software for linkage analysis and QTL mapping in autotetraploid populations using SNP dosage data. J. Hered. 2017, 108, 438–442. [Google Scholar] [CrossRef]
- Bourke, P.M.; van Geest, G.; Voorrips, R.E.; Jansen, J.; Kranenburg, T.; Shahin, A.; Visser, R.G.; Arens, P.; Smulders, M.J.; Maliepaard, C. Polymapr—linkage analysis and genetic map construction from F1 populations of outcrossing polyploids. Bioinformatics 2018, 34, 3496–3502. [Google Scholar] [CrossRef]
- Vos, P.G.; Paulo, M.J.; Voorrips, R.E.; Visser, R.G.F.; van Eck, H.J.; van Eeuwijk, F.A. Evaluation of LD decay and various LD-decay estimators in simulated and SNP-array data of tetraploid potato. Theor. Appl. Genet. 2017, 130, 123–135. [Google Scholar] [CrossRef]
- Kirk, W.; Felcher, K.; Douches, D.; Niemira, B.; Hammerschmidt, R. Susceptibility of potato (Solanum tuberosum L.) foliage and tubers to the US8 genotype of Phytophthora infestans. Am. J. Potato Res. 2001, 78, 319–322. [Google Scholar] [CrossRef]


| Foliar Resistance | ||||||
|---|---|---|---|---|---|---|
| Source of Variation | DF | SS | MS | F | P-Value | H2 |
| Clone | 81 | 0.4979 | 0.0061 | 3.08 | 2.83 × 10⁻¹⁴ | 0.48 |
| Error | 571 | 1.167 | 0.0020 | |||
| Total | 653 | 1.665 | ||||
| Defoliation | ||||||
| Clone | 81 | 5.931 | 0.0732 | 5.65 | 2 × 10⁻¹⁶ | 0.64 |
| Error | 899 | 11.657 | 0.0130 | |||
| Total | 980 | 17.588 | ||||
| Trait | Mapping Parent | Chr | Group | QTL Interval Position cM | LOD | PVE% | QTL Genetic Model | Marker Closest to Proposed QTL Position | Homologous Chr | Main Q Effect | QTL Code |
|---|---|---|---|---|---|---|---|---|---|---|---|
| Tuber resistance | Magnum Bonum | 1 | 1– | 56–60 | 2.492 | 8.19 | full model | ||||
| 5 | 7 | 5.7–6.2 | 3.264 | 22.12 | full model | ||||||
| 8 | 1 | 6.6–34 | 3.687 | 50.6 | duplex | snp_c2_28580 | Q12 | - | EBT-lg3.1 | ||
| 11 | 4 | 19.5–39.7 | 3.215 | 48.70 | full model | ||||||
| 12 | 4 | 33.3–39.5 | 3.140 | 17.58 | full model | ||||||
| Matilda | 2 | 1 | 15.9–16 | 3.652 | 46.51 | full model | |||||
| 3 | 5 | 25.2–34.7 | 2.524 | 12.82 | simplex | PotVar0120608 | C3 | ↑ | EBT-lg1 | ||
| 4 | 1 | 2.3–19.9 | 4.367 | 19.39 | full model | ||||||
| 8 | 5 | 52.3–68 | 2.816 | 20.52 | duplex | PotVar0063945 | Q13 | ↓ | EBT-lg6 | ||
| 11 | 4 | 15.4–20.4 | 3.045 | 30.23 | duplex | PotVar0008448 | Q23 | ↑ | EBT-lg9.1 | ||
| 11 | 1 | 11.7–18 | 3.069 | 35.96 | duplex | snp_c2_49316 | Q14 | - | EBT-lg9.2 | ||
| Foliar resistance | Magnum Bonum | 1 | 6 | 0–26.4 | 2.439 | 13.06 | duplex | PotVar0098794 | Q14 | ↓ | EBF-lg9.3 |
| 5 | 2 | 0–16.9 | 2.077 | 11.60 | simplex | PotVar0026113 | C1 | ↑ | EBF-lg11.1 | ||
| 5 | 7 | 7.8–8.7 | 3.014 | 46.51 | full model | ||||||
| 5 | 6 | 0–28 | 9.857 | 43.36 | simplex | PotVar0079374 | C1 | ↓ | EBF-lg11.3 | ||
| 7 | 6 | 0–5.9 | 2.744 | 9.93 | full model | ||||||
| 12 | 6 | 7.7–8.5 | 2.134 | 35.81 | duplex | PotVar0052987 | Q13 | - | EBF-lg10.2 | ||
| Matilda | 5 | 7 | 19.8–20 | 2.717 | 17.16 | full model | |||||
| 6 | 6 | 49.1–50 | 2.371 | 21.42 | simplex | PotVar0087396 | C2 | - | EBF-lg3.2 | ||
| 10 | 6 | 0–6.7, 10.9–30 | 3.093 | 15.68 | duplex | PotVar0108340 | Q24 | ↓ | EBF-lg4.2 | ||
| 11 | 4 | 3.4–14.4 | 3.271 | 51.96 | full model | ||||||
| 12 | 7 | 21.4–29 | 3.017 | 15.12 | duplex | snp_c2_17613 | Q34 | ↑ | EBF-lg5.1 | ||
| Defoliation | Magnum Bonum | 1 | 3 | 12.3–16.1 | 3.961 | 29.93 | full model | ||||
| 1 | 6 | 17.2–28.8 | 2.700 | 29.88 | duplex | PotVar0044984 | Q23 | ↓ | SEN-lg9.3 | ||
| 3 | 5 | 0–2.1 | 3.327 | 42.61 | full model | ||||||
| 3 | 5 | 29.8–30.1 | 2.932 | 28.25 | duplex | PotVar0094921 | Q34 | - | SEN-lg6.2 | ||
| 5 | 7 | 7.9–8.1 | 4.094 | 51.29 | full model | ||||||
| 5 | 6 | 0–28 | 8.104 | 36.87 | simplex | PotVar0079374 | C1 | ↓ | SEN-lg11.3 | ||
| 7 | 6 | 0–22 | 3.063 | 11.21 | full model | ||||||
| 8 | 5 | 21.5–30 | 4.803 | 47.71 | full model | ||||||
| 12 | 6 | 22.6–26.8 | 4.765 | 52.92 | full model | ||||||
| Matilda | 6 | 6 | 49.8–50 | 2.789 | 33.49 | full model | |||||
| 10 | 6 | 15.5–16.3 | 2.443 | 12.42 | duplex | PotVar0108340 | Q24 | ↓ | SEN-lg4.2 |
© 2020 by the authors. Licensee MDPI, Basel, Switzerland. This article is an open access article distributed under the terms and conditions of the Creative Commons Attribution (CC BY) license (http://creativecommons.org/licenses/by/4.0/).
Share and Cite
Odilbekov, F.; Selga, C.; Ortiz, R.; Chawade, A.; Liljeroth, E. QTL Mapping for Resistance to Early Blight in a Tetraploid Potato Population. Agronomy 2020, 10, 728. https://doi.org/10.3390/agronomy10050728
Odilbekov F, Selga C, Ortiz R, Chawade A, Liljeroth E. QTL Mapping for Resistance to Early Blight in a Tetraploid Potato Population. Agronomy. 2020; 10(5):728. https://doi.org/10.3390/agronomy10050728
Chicago/Turabian StyleOdilbekov, Firuz, Catja Selga, Rodomiro Ortiz, Aakash Chawade, and Erland Liljeroth. 2020. "QTL Mapping for Resistance to Early Blight in a Tetraploid Potato Population" Agronomy 10, no. 5: 728. https://doi.org/10.3390/agronomy10050728
APA StyleOdilbekov, F., Selga, C., Ortiz, R., Chawade, A., & Liljeroth, E. (2020). QTL Mapping for Resistance to Early Blight in a Tetraploid Potato Population. Agronomy, 10(5), 728. https://doi.org/10.3390/agronomy10050728