Article

Wild Miscanthus Germplasm in a Drought-Affected Area: Physiology and Agronomy Appraisals

by
Danilo Scordia
1,*,
Giovanni Scalici
1,
John Clifton-Brown
2,
Paul Robson
2,
Cristina Patanè
3 and
Salvatore Luciano Cosentino
1
1
Dipartimento di Agricoltura, Alimentazione e Ambiente (Di3A), University of Catania, via Valdisavoia 5, 95123 Catania, Italy
2
Institute of Biological, Environmental and Rural Sciences (IBERS), Aberystwyth University, Gogerddan, Aberystwyth, Wales SY23 3EE, UK
3
CNR-Istituto per la BioEconomia (IBE), Sede Secondaria di Catania, Via P. Gaifami 18, 95126 Catania, Italy
*
Author to whom correspondence should be addressed.
Agronomy 2020, 10(5), 679; https://doi.org/10.3390/agronomy10050679
Submission received: 10 April 2020 / Revised: 6 May 2020 / Accepted: 7 May 2020 / Published: 12 May 2020

Abstract

:
Predictions of future climate scenarios indicate that yields from perennial biomass crops (PBCs) growing in the Mediterranean region are likely to decline due to prolonged drought. Among PBCs, Miscanthus grasses with C4 photosynthesis combine high yield potentials and water use efficiencies. However, the standard commercial clone M. x giganteus (Mxg), with minimal stomatal regulation, is too sensitive to drought for reliable yields in the Mediterranean regions. This paper screened a diverse panel of thirteen Miscanthus genotypes (M. sinensis, M. floridulus, M. sacchariflorus and Mxg) to identify which types could maximize yield under summer drought conditions typical in the South Mediterranean climate. In the second growing season, significant differences were observed for plant height (from 63 to 185 cm), stem number (from 12 to 208 stems plant−1), biomass yield (from 0.17 to 6.4 kg DM plant−1) and whole crop water use efficiency (from 0.11 to 7.0 g L−1). Temporal variation in net photosynthesis, stomatal conductance, transpiration rate and instantaneous water use efficiency identified different strategies adopted by genotypes, and that genotypes selected from M. floridulus and M. sinensis were better adapted to rainfed conditions and could produce six times more biomass than the Mxg. These accessions are being used as parents in experimental breeding aimed at producing future seed-based drought resilient hybrids.

1. Introduction

Growing biomass crops on marginal lands has been proposed as a feasible solution to reduce pressure on higher-grade lands and to reduce competition with food crops [1]. However, unfavorable lands are constrained by climatic, edaphic and other biophysical limitations to different extents; hence, biomass crops that are resilient to stress resulting from specific climatic and soil conditions will be needed [2,3,4,5].
It is expected that perennial biomass crops (PBCs) will make a substantial contribution to renewable low carbon energy systems and in combination with bio-energy with carbon capture and storage (BECCS) will produce carbon-negative energy [6]. Research on PBCs has demonstrated a number of important characteristics including the ability to grow in variable environments, a natural resistance to pests and diseases, a positive energy balance and overall high levels of environmental sustainability [7,8,9,10,11]. Among PBCs, a large effort in Europe has been focused on Miscanthus, mainly due to its wide geographical adaptability, C4 photosynthetic metabolism and high biomass output to input ratio [7,12]. Despite the large genetic diversity of this genus, the most widely used Miscanthus for biomass production is M. x giganteus, a naturally occurring triploid hybrid [7,13,14]. M. x giganteus is sterile therefore commercial expansion is limited by low multiplication rates from clonal propagation, high establishment costs and patchiness associated with rhizome propagation [15,16]. Furthermore, the physiology of M. x giganteus is not well suited to areas with limited water supply and extreme summer drought, such as the southern Mediterranean [17,18].
Natural diversity in physiological, morphological and compositional traits is important for breeding improved, high-yielding and locally adapted varieties that are resilient to climate change and extreme weather events [16]. A replicated spaced plant trial in the UK, containing 244 genotypes of the three species demonstrated large variations in canopy height, stem density, flowering time, leaf senescence rate and biomass yield [19]. Furthermore, genotypic variation in cell wall composition for both biochemical and thermochemical conversion pathways has also been observed [20,21]. From such studies other Miscanthus species, such as M. sinensis, M. floridulus and M. sacchariflorus, have been recommended as candidates for breeding programs in Europe [15]. M. sinensis is widely distributed from the subtropics in eastern Asia to southern Russia, M. sacchariflorus and M. floridulus have more northern and southern adaptive ranges, respectively [15,22,23].
Predictions of future climate scenarios suggest that the frequency of both floods and droughts will increase. These scenarios indicate yields from many crops, including perennial biomass crops growing in the Mediterranean region are likely to decline due to prolonged drought [24]. In this environmental zone, the observed rate of climate change exceeds global trends [25]. The annual mean air temperature in the Mediterranean region is 1.4 °C above late-19th century levels, and the frequency and intensity of summer heat waves and drought has steadily increased since 1950 [25,26]. The environment in this geographic area is characterized by mild and wet winters, high light intensity and air temperatures resulting in high accumulated degree-day values during the spring-summer-early fall period [24]. In addition, high evapotranspiration and vapor pressure deficit (VPD) due to long hot and dry summers and short dry periods during fall and spring reduces leaf conductance, plant CO2 assimilation, plant growth rates and biomass yield [27,28]. The increase in water scarcity due to climate change alone, is expected to raise irrigation water demands by between 4 and 18% by the end of the century (for 2 °C and 5 °C warming, respectively) if crop production is to be maintained at current levels [29]. Since irrigation for biomass crops is unlikely to be economically and environmentally sustainable, it is important to identify genotypes that use available water efficiently and that are tolerant to water-deficit stress [30].
Biomass yields are a function of physiological trait responses to the depth, duration and patterns of water deficits during the growing season. Changes in physiological and biochemical mechanisms, plant morphology, phenology, growth, development and yield have been commonly observed in plants subjected to severe and prolonged drought [31]. Clifton-Brown et al. [16] suggested that breeding needs to exploit natural diversity to produce hybrids able to survive and thrive in climatic extremes across successive growing seasons. To this end, the present study screened a diverse panel of twelve Miscanthus accessions collected from Taiwan, China and Japan between 2006 and 2008 with representatives of the three species M. sinensis, M. floridulus and M. sacchariflorus, and a thirteenth entry of the standard clonal M. x giganteus to identify which types could maximize yield under summer drought conditions typical of the South Mediterranean climate. Genotypes were grown and analysed under full water restoration (applying 100% of maximum evapotranspiration) and rainfed regimes in southern Italy.

2. Materials and Methods

2.1. Field Trial Set-Up

The field trial was at the Experimental Farm of the University of Catania (37°24′ N, 15°03′ E, 10 m a.s.l.) in a soil with the following characteristics: 22.4% silt, 49.3% sand, 28.3% clay, 1.4% organic matter, 1.0 g kg−1 total N, 5.0 mg kg−1 available P, 244.8 g kg−1 exchangeable K, and pH 8.6. The bulk density was 1.1 g cm−3. The soil moisture contents at field capacity (at −0.03 MPa) and nominal wilting point (at −1.5 MPa) were 27 and 11 g H2O 100 g−1 dry weight respectively. The experimental field area was ploughed to a depth of 35 cm in the autumn, and in spring disk-harrowed to a depth of 25 cm before planting with rhizomes of thirteen Miscanthus genotypes. The selections were made from the wild collections of the Institute of Biological, Environmental and Rural Sciences of Aberystwyth University [32] and included examples of M. sinensis (Andersson), M. sacchariflorus (Maxim.) Benth, M. floridulus (Labill.) Warb. ex K. Schum. & Lauterb and as a commercial standard control genotype the triploid hydrid M. x giganteus (Greef et Deuter) (more details in Table 1).
Rhizomes (one per plant) were transplanted on 24th April 2013 into a completely randomized split-plot design. The main plot was the irrigation (rainfed vs. irrigation at 100% ETm restoration) and measured 52 m2 each, while the subplot was the genotype (represented by one plant replicated four times each genotype, at a density of 1 plant m−2 randomly distributed). Irrigated and rainfed blocks were separated by 10 m paths to prevent the risk of horizontal water movements. Fertilization was neither applied at transplant nor as a top dressing. Weeds were controlled mechanically when necessary. During the first growing season, all genotypes were irrigated at optimal soil water availability to ensure plant survival at establishment. The first harvest was in mid-February 2014 by cutting the aboveground biomass to a height of 5 cm above soil level, chipping and leaving it as a mulch layer.
During the second growing season, no fertilization or weed control was performed, while irrigation was applied from the beginning of May to the end of September 2014 to only the irrigated plot through drippers. Total irrigation amounted to 564 mm scheduled in nine events. The irrigation volumes were determined on the basis of the maximum available water content in the first 0.6 m of soil, where most of the root is expected to grow, as:
V = 0.66   ( F C W P )   Φ   D
where V = water amount; 0.66 = fraction of readily available soil water permitting unrestricted evapotranspiration; FC = soil water at field capacity (27% of dry soil weight); WP = soil water at wilting point (11% of dry soil weight); Φ = bulk density (1.1 g cm−3); D = soil depth (0.6 m).
The irrigation was scheduled when the sum of daily maximum evapotranspiration (ETm) corresponded to V:
E T m = E T 0   ·   K p   ·   K c
where ET0 = evaporation of class A pan (mm); Kp = pan coefficient, equal to 0.80 in semi-arid environments; Kc = crop coefficient, as reported by Cosentino et al. [18].

2.2. Measurements

Maximum and minimum air temperature and rainfall were measured by a weather station connected to a data logger (Delta-T, WS-GP1 Compact, Cambridge, UK), and ET0 by a Class A pan, both located 300 m from the experimental field. Daily data was aggregated to ten-day increments, from February 2014 to February 2015, corresponding to the second growing season. Before and after each irrigation, the soil water content was measured by means of ECH2O EC-5 soil moisture sensors (METER Group, Inc. USA 2365 NE Hopkins Court Pullman, WA, USA) installed at 0.6 m soil depth in both irrigated and rainfed treatments, and data were logged by a ProCheck device (Decagon Devices, Inc. 2365 NE Hopkins Court Pullman, WA, USA).
In the rainfed treatment, the soil moisture (mm) was modelled to estimate the drought stress over the growing season according to Nunn et al. [33], modified by Scordia et al. [34]. Briefly, the plant available water in the soil was calculated as the difference between the field capacity (27% of dry soil weight) and the wilting point (11% of dry soil weight) in a soil bulk density of 1.1 g cm−3 and a rooting depth of 0.6 m [35]. The maximum plant available water was obtained by applying an availability coefficient of 50%, which was increased by rainfall and decreased by the crop ET [18,36]. On days when the soil moisture fell below 20% of the plant available water, plants were considered to be suffering from drought stress [33].
Leaf gas exchange, recorded as net photosynthesis (PN, μmol CO2 m−2 s−1), transpiration rate (E, mmol H2O m−2 s−1) and stomatal conductance (Gs, mol m−2 s−1) were measured using a portable photosynthesis system (Li6400, Li-Cor Inc., Lincoln, NE, USA), at a flow rate of 500 mL min−1 and at ambient CO2 concentration. Measurements were performed during cloudless days and at a time of maximum solar radiation (e.g., 12:00 to 2:00 p.m.) on the mid-section of the last fully expanded leaf, on 20 June, 15 July, 10 August and 5 September 2014, corresponding to the day after full soil water restoration of the irrigated treatment. Intrinsic water use efficiency (iWUE) was calculated as PN/E at each measurement time (μmol CO2 mmol H2O−1).
Before the mid-February harvest in 2015, plant height, measured to the last ligulate leaf (cm) and stem number (number of stems plant−1) were recorded. Aboveground dry matter yields (DMY) were calculated from measurements of the fresh weight of whole plants cut 5 cm above ground level. Representative wet subsamples were placed in plastic zip bags and weighed, and then dried to a constant weight at 60 °C to determine the subsample dry weight. The percentage dry weight was calculated according to Robson et al. [19]. The aboveground plant water use efficiency (hereinafter referred to as whole plant water use efficiency-WUEWP, g L−1) was calculated as the balance between DMY and crop water use by the plant. The crop water use was assumed the same for all genotypes and was determined as in Cosentino et al. [36].

2.3. Statistical Analysis

Morphological (plant height and stem number) and productive data (DMY and WUEWP) were analysed by two-way analysis of variance (ANOVA) using the CoHort Software (CoStat 6.003), according to the experimental design. Before conducting the ANOVA, the Bartlett’s test was used to verify the assumption of homogeneity of variances. Irrigation and genotype were considered as fixed factors, and means were evaluated for significance using the Student-Newman-Keuls test at 95% confidence level.
Physiological data (PN, Gs, E and iWUE) were analysed by two-way ANOVA with time as a repeated measure, where the measurement date represents the within-factor, the irrigation and the genotype the between-factor (SPSS, PASW Statistics 18). When data failed Mauchly’s sphericity test, the univariate results were adjusted by using the Greenhouse-Geisser Epsilon and the Huynh-Feldt Epsilon correction factors. When univariate results satisfied sphericity tests for within-subjects effects, the F-values and associated p-values for between-subjects effects were tested. Differences between means were evaluated as above.
The Pearson’s correlation test among physiological, morphological and productive traits were reported with 95% confidence level (Minitab Statistical Software version 16).
Relationships among physiological data were calculated by linear models, forcing the line to go through the origin (y = ax). The Shapiro-Wilk test was used to test residuals for normality. Coefficients were considered significant when p-values were less than 0.05. The goodness of fit was assessed by calculating R2 (SigmaPlot11, Systat Software Inc., San Jose, CA, USA).

3. Results

3.1. Environmental Conditions

Through the growing season (February 2014 to February 2015), the meteorological data were typical of a semi-arid Mediterranean environment, with wet and mild winter and dry and hot summer. The seasonal averaged maximum air temperature was 23.1 °C (31 °C during summertime), the minimum was 12.7 °C (6.1 °C during wintertime) and the seasonal mean was 17.9 °C.
Rainfall was 596 mm, distributed between 45.9% in winter, 42.8% in autumn, 9.0% in spring and 2.3% in summer. The ET0 was 1184 mm and was distributed between 40.5% in summer, 28.8% in spring, 16.0% in autumn and 14.6% in winter (Figure 1). The modelled soil moisture was consistent with precipitation and evapotranspiration trends: in winter, and particularly at the beginning of spring, it was adequate to allow plant regrowth; however, it sharply decreased in late spring to approach the minimum content through the summertime and increased again in autumn when ET0 decreased and precipitation increased.

3.2. Morphological and Productive Traits

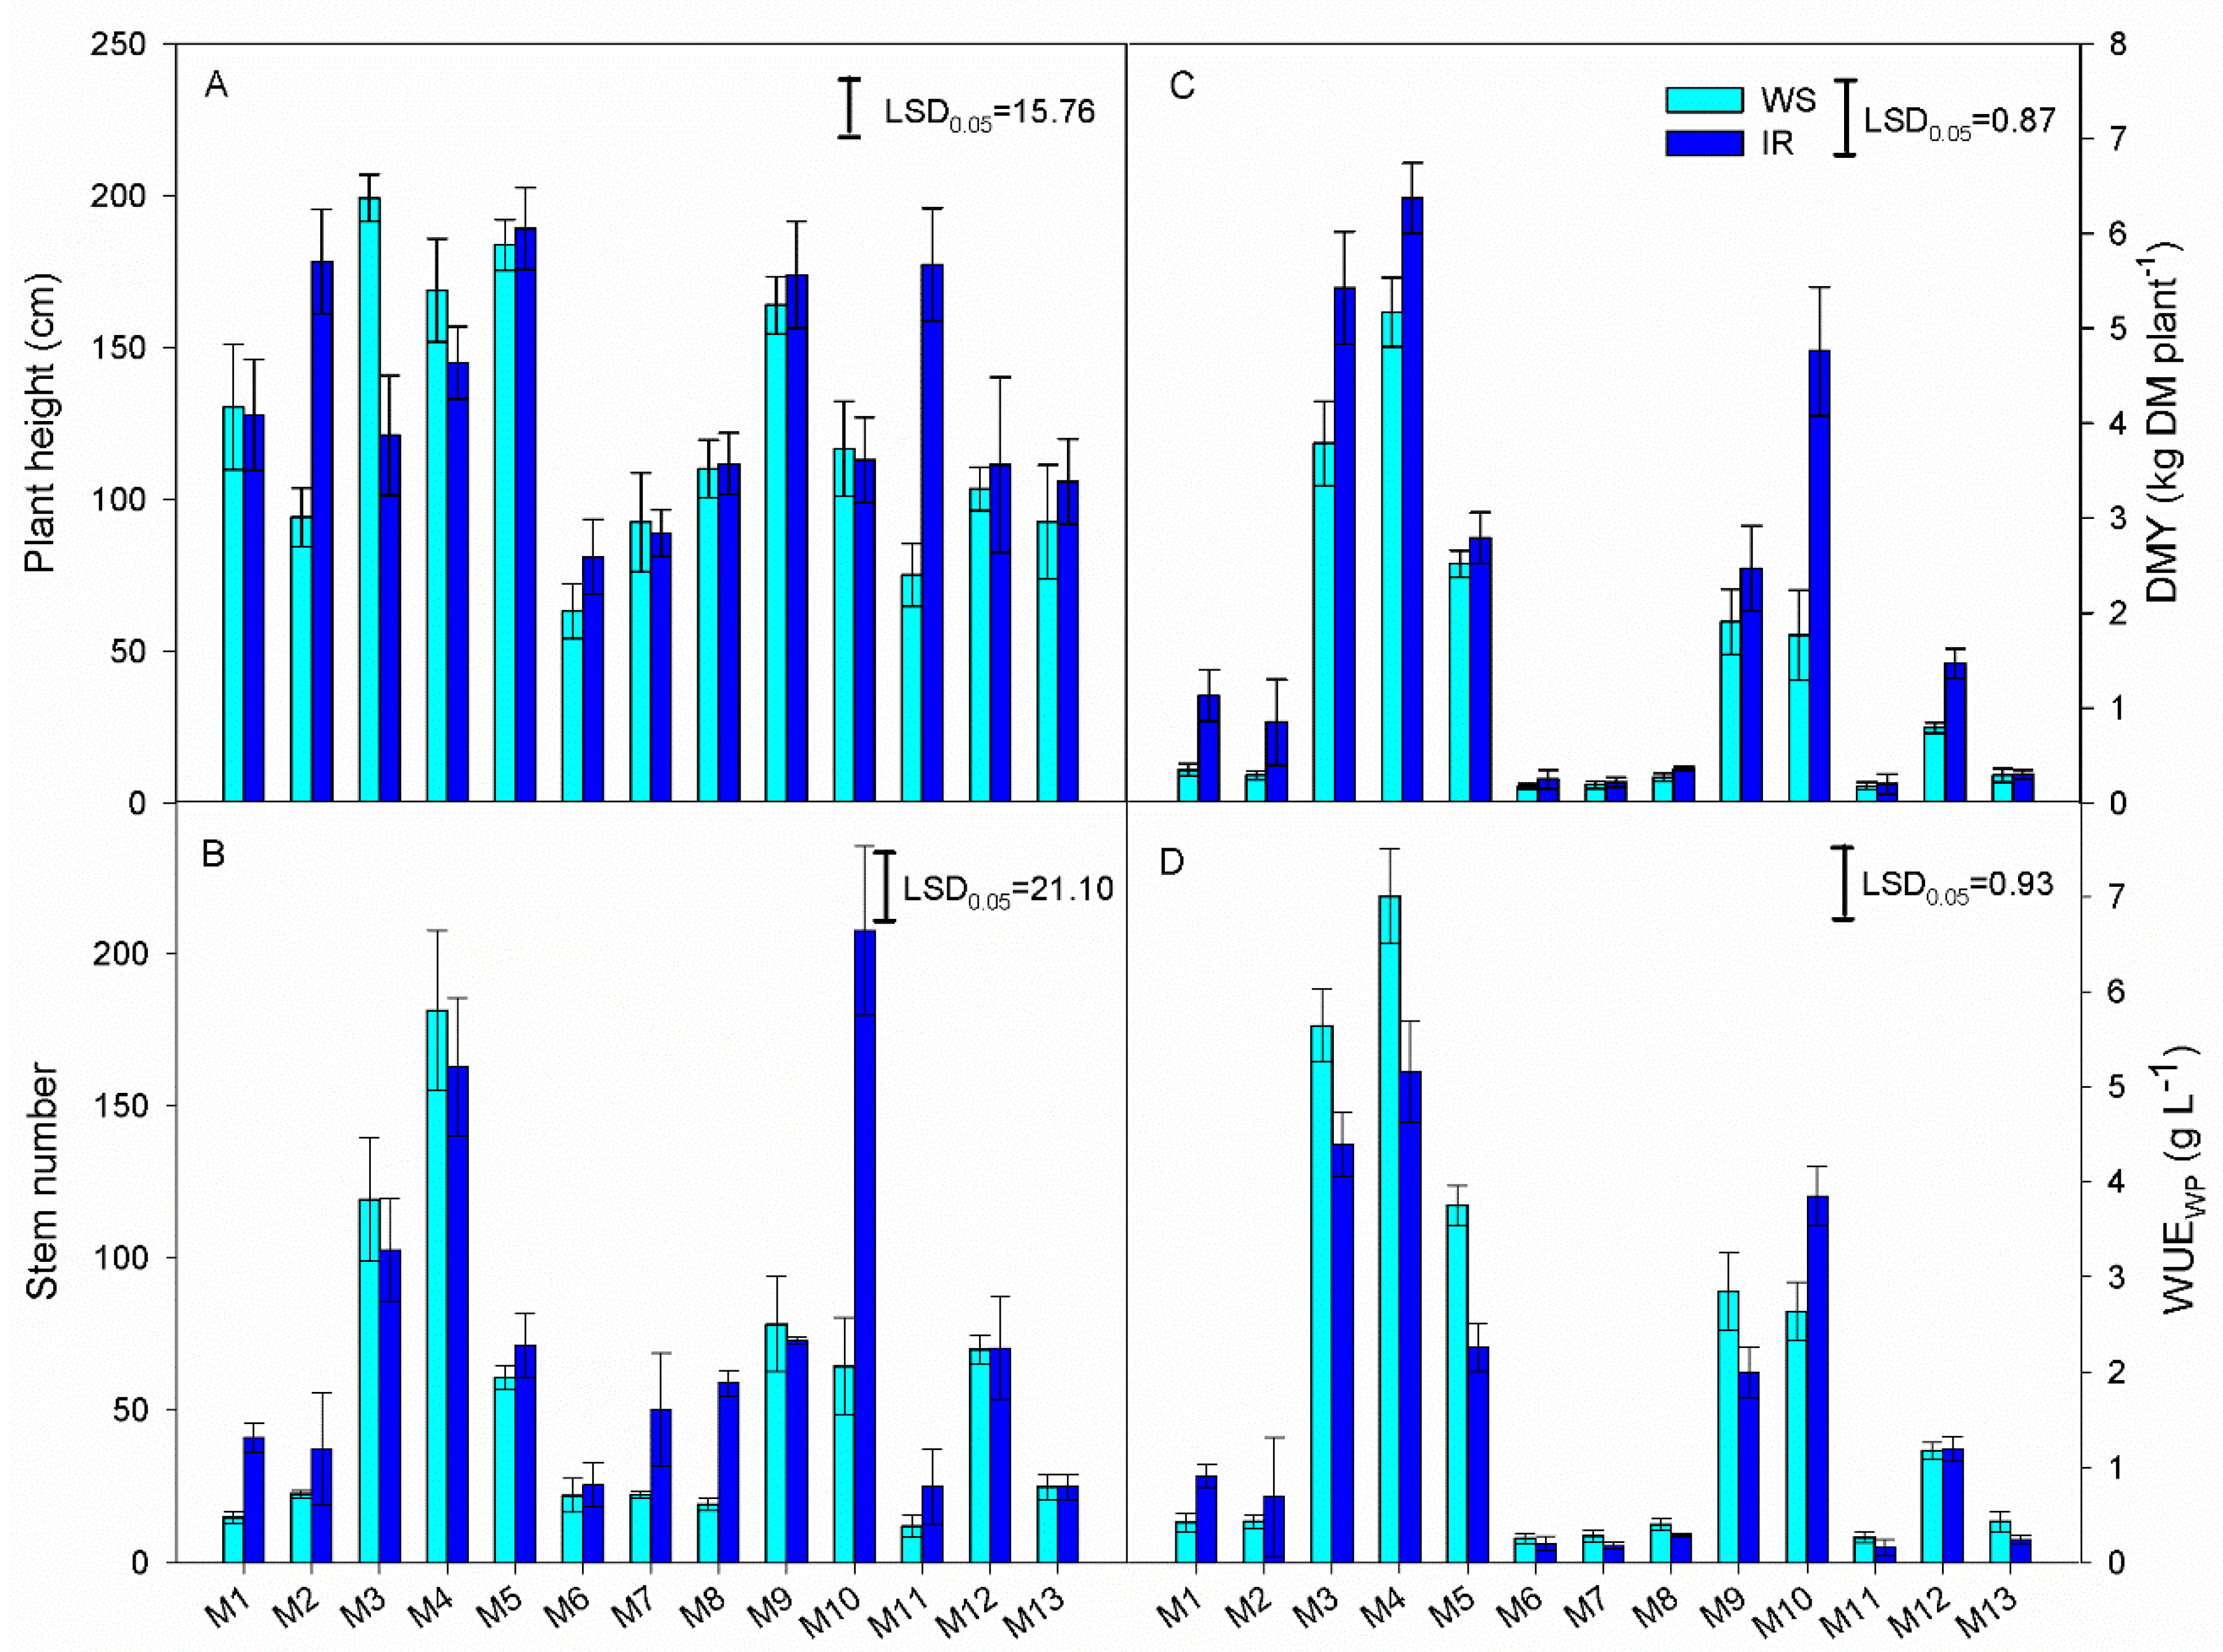
ANOVA showed a significant effect of genotype and irrigation, and the interactions between these factors on morphological and productive traits (Table 2). The significant genotype × irrigation interactions suggested a variable genotypic response to changing available soil water content on plant height, stem number, biomass yield and whole crop water use efficiency (Figure 2A–D).
In the rainfed treatment, plant height varied from 63 cm in genotype M6 to 199 cm in genotype M3. In the irrigated treatment plant height varied from 81 cm in genotype M6 to 185 cm in genotype M5. Plant height did not significantly increase between irrigated and rainfed treatments in genotypes M1, M4, M5, M6, M7, M8, M9, M10, M12 and M13. Irrigation significantly increased plant height in genotypes M2 and M11; but plant height in genotype M3 was higher in the rainfed than in the irrigated treatment (Figure 2A).
Stem number varied from 12 stems plant−1 in genotype M11 to 181 stems plant−1 in genotype M4 in rainfed plants, and from 25 stems plant−1 in genotypes M6, M11 and M13 to 208 stems plant−1 in M10 in irrigated plants. Stem density was not statistically different between irrigated and rainfed treatments in genotypes M2, M3, M4, M5, M6, M9, M11, M12 and M13, while genotypes M1, M7, M8 and particularly M10 produced more stems per plant when irrigated (Figure 2B).
Biomass dry matter yield (DMY) varied from 0.17 kg DM plant−1 in genotype M6 to 5.1 kg DM plant−1 in M4, and from 0.20 kg DM plant−1 in genotype M11 to 6.4 kg DM plant−1 in M4, in rainfed and irrigated treatments, respectively. Irrigation improved DMY of genotypes M1, M2, M3, M4, M10 and M12 when compared with the rainfed conditions. However, DMY did not change between irrigated and rainfed conditions in genotypes M5, M6, M7, M8, M9, M11 and M13 (Figure 2C).
Whole plant WUE (WUEWP) varied from 0.25 g L−1 in genotypes M6 to 7.0 g L−1 in M4 in the rainfed conditions. In the irrigated plants, WUEWP varied from 0.11 g L−1 in genotype M11 to 5.15 g L−1 in M4. WUEWP was generally higher in rainfed than irrigated plants, and particularly in genotypes M3, M4 and M5. The remaining Miscanthus genotypes did not show appreciable differences between treatments (Figure 2D).

3.3. Gas Exchange

ANOVA showed a significant effect of genotype, irrigation (except for iWUE) and date of measurement on the gas exchange parameters evaluated. The interactions within and between factor-effects were also significant (Table 3).
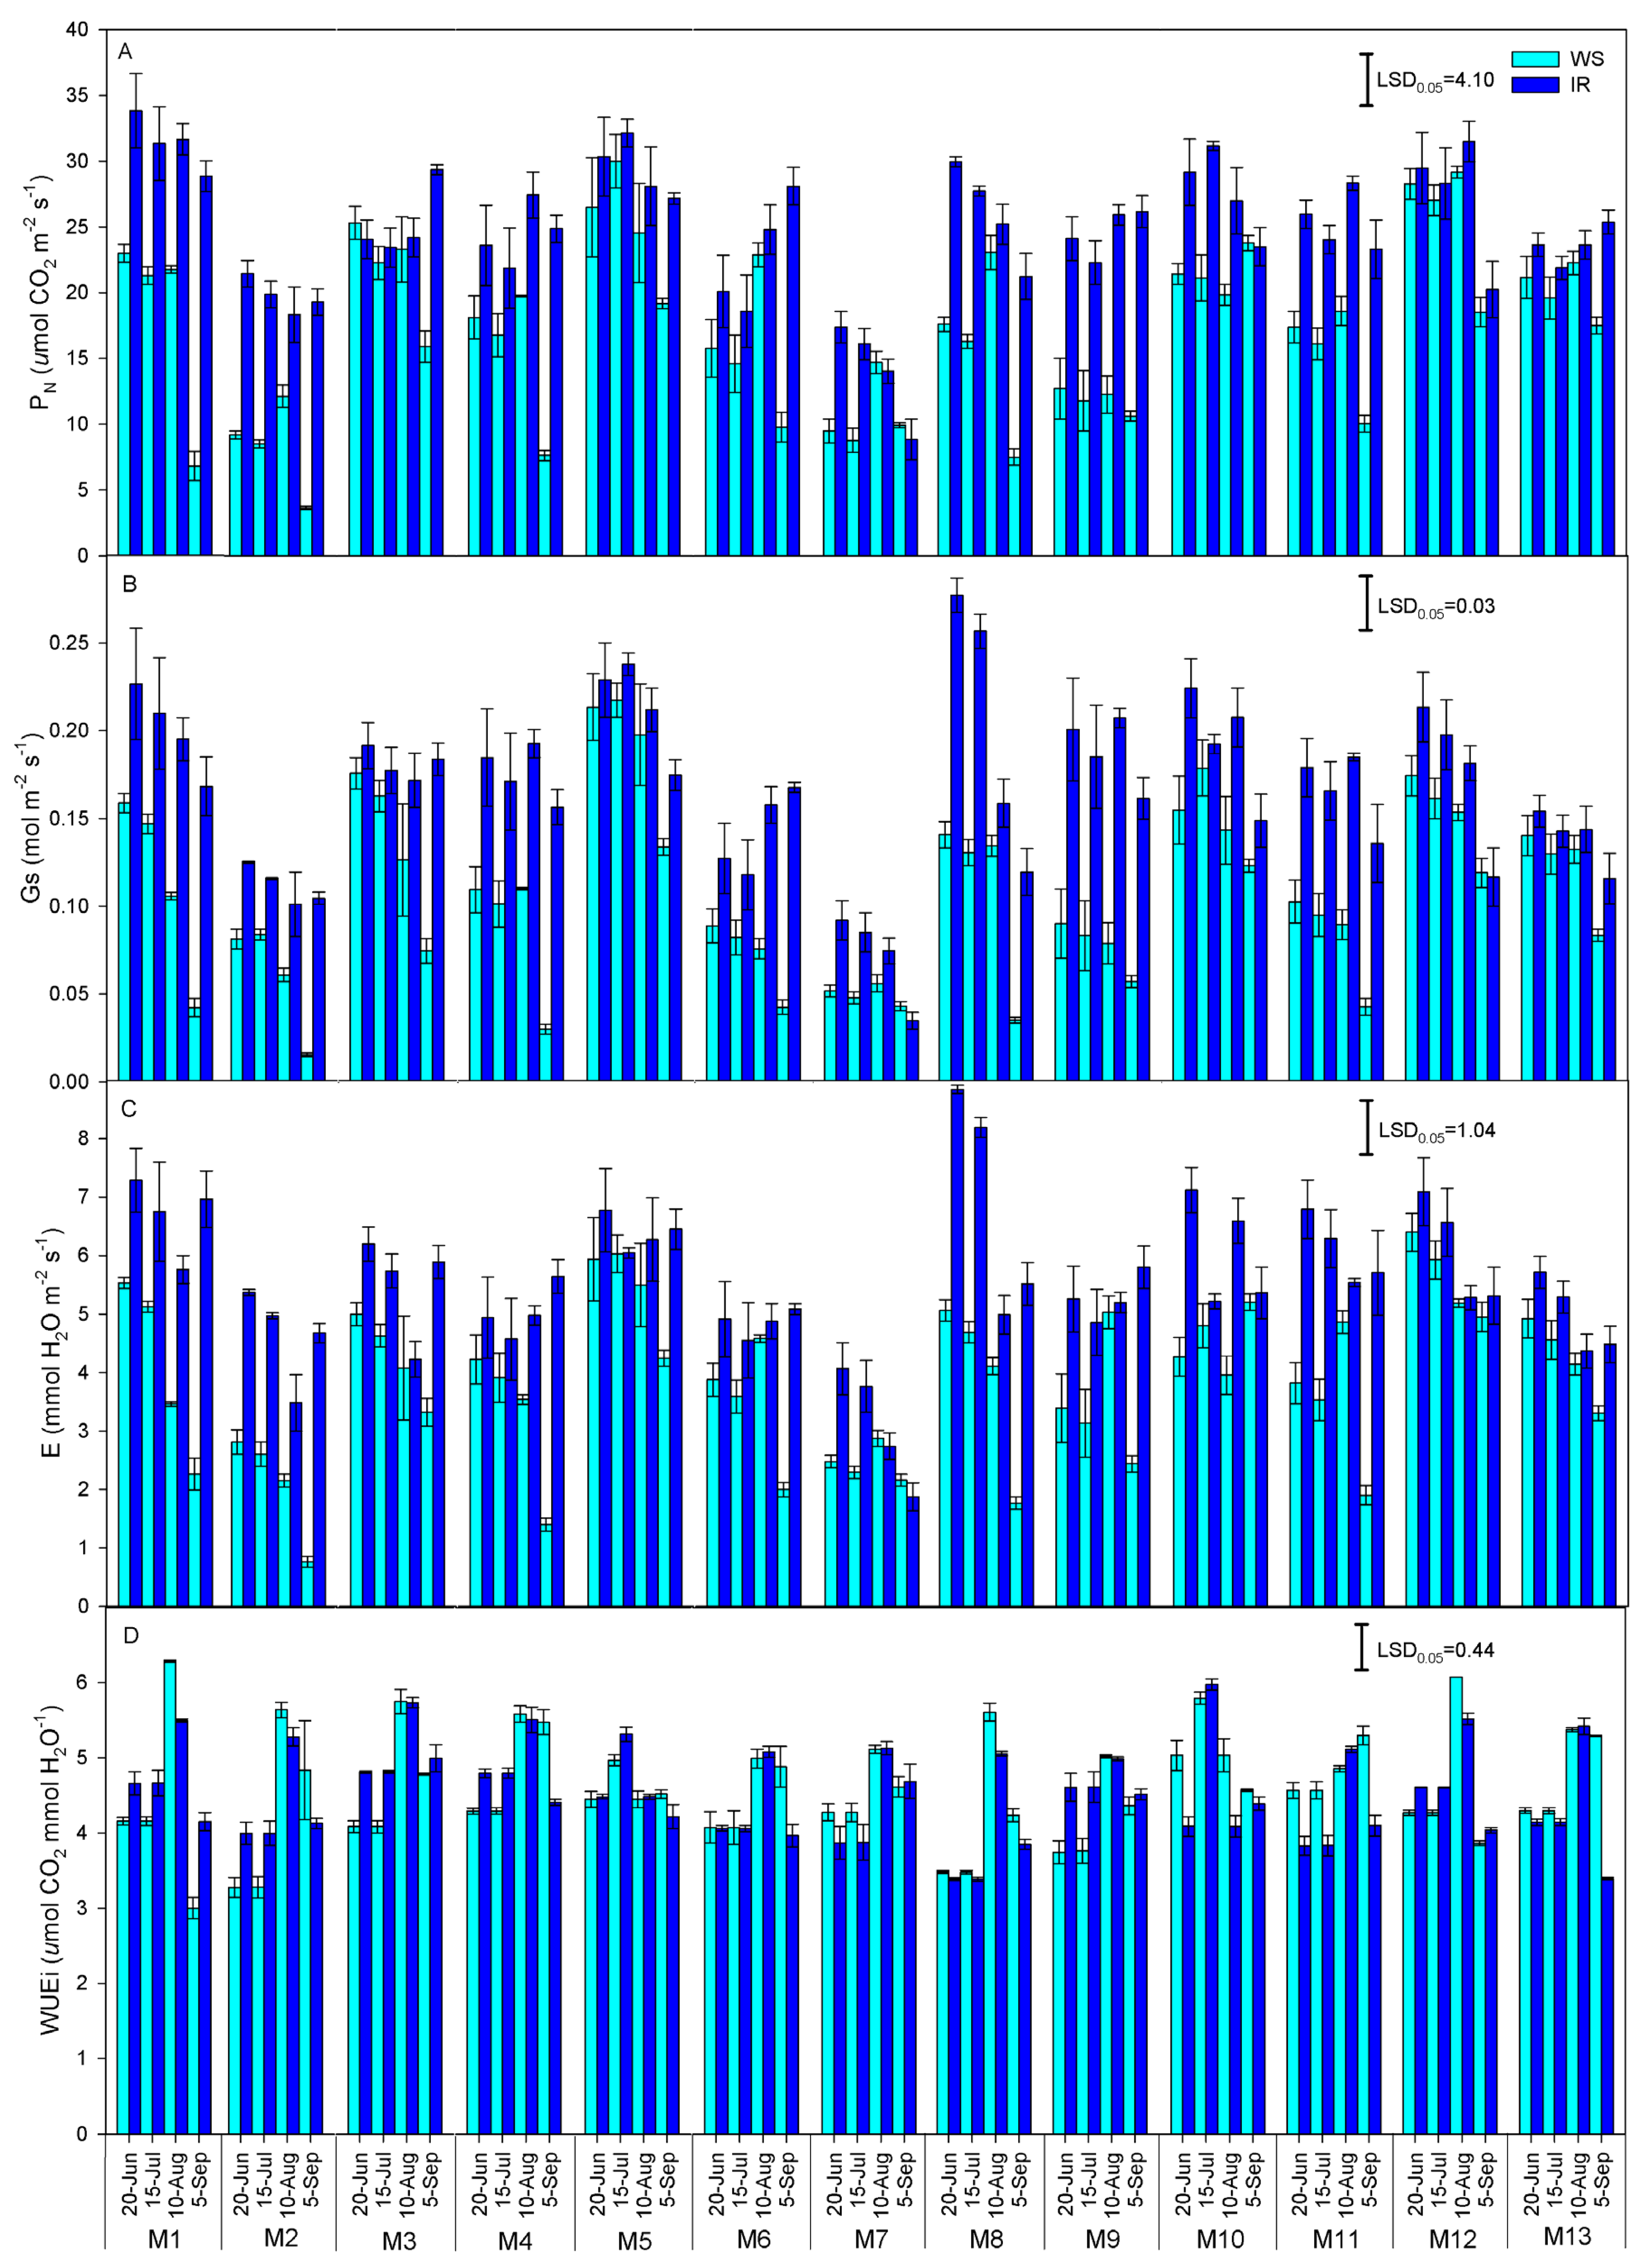
The significant interaction of genotype × irrigation × date of measurement on net photosynthesis (PN), stomatal conductance (Gs), transpiration rate (E) and instantaneous water use efficiency (iWUE) suggested a large genotypic variation in gas exchange when plants were exposed to changing available soil water content throughout the growing season (Figure 3A–D).
When the mean separation of experimental factors was performed, PN reached 23.8 and 19.2 μmol CO2 m−2 s−1 in the irrigated and rainfed treatment, respectively. Genotypic means, combining dates and irrigation treatments, showed genotypes M5 and M12 had the highest PN (27.6 μmol CO2 m−2 s−1 on average), while M2 and M7 the lowest PN (13.2 μmol CO2 m−2 s−1 on average). Combining genotype and irrigation data, the highest and the lowest PN were observed in June and September (24.5 and 18.3 μmol CO2 m−2 s−1, respectively).
Genotypic means were calculated by combining data from different dates and irrigation treatments. Comparing genotypic means, Gs was the highest in genotype M5 and the difference was statistically significant (0.20 mol m−2 s−1). Gs was the lowest in genotypes M2 and M7 (0.10 mol m−2 s−1 on average). Treatment means were calculated by combining data from different dates and genotypes. Comparing treatment means Gs was higher in the irrigated (0.16 mol m−2 s−1) than in rainfed conditions (0.13 mol m−2 s−1). Comparing means from different dates, Gs was higher in June, July and August (0.15 mol m−2 s−1 on average) than September (0.10 mol m−2 s−1).
Comparing genotypic means, E was significantly higher in genotypes M5, M12, M8, M1 and M10 (5.6 mmol H2O m−2 s−1 on average) and lower in genotypes M2 and M7 (3.1 mmol H2O m−2 s−1 on average). Comparing treatment means, E was higher in the irrigated (5.3 mmol H2O m−2 s−1) than the rainfed treatment (4.2 mmol H2O m−2 s−1). Comparing means from different dates, the highest E was measured in June (5.3 mmol H2O m−2 s−1) and the lowest in August and September (4.4 mmol H2O m−2 s−1 on average).
Comparing genotypic means, iWUE was the highest in genotypes M4, M3 and M10 (4.9 μmol CO2 mmol H2O−1 on average), but not statistically different than genotypes M5 and M12 (4.7 μmol CO2 mmol H2O−1 on average). The lowest iWUE was measured from genotype M8 (4.1 μmol CO2 mmol H2O−1). Irrigation and rainfed treatments were not significantly different (4.5 μmol CO2 mmol H2O−1 on average). Measurements of iWUE were higher in August (5.4 μmol CO2 mmol H2O−1) than September (4.6 μmol CO2 mmol H2O−1), and were different to June and July (4.2 μmol CO2 mmol H2O−1 on average).

3.4. Correlations and Relationships

Pearson’s correlation test showed some significant correlations among physiological, morphological and productive traits (Table 4). PN was positively correlated with physiological parameters (Gs, E and iWUE) and stem height. Gs was positively correlated with E, plant height and DMY. The iWUE was positively correlated with stem number, DMY and WUEWP. Morphological and productive traits positively correlated with each other.
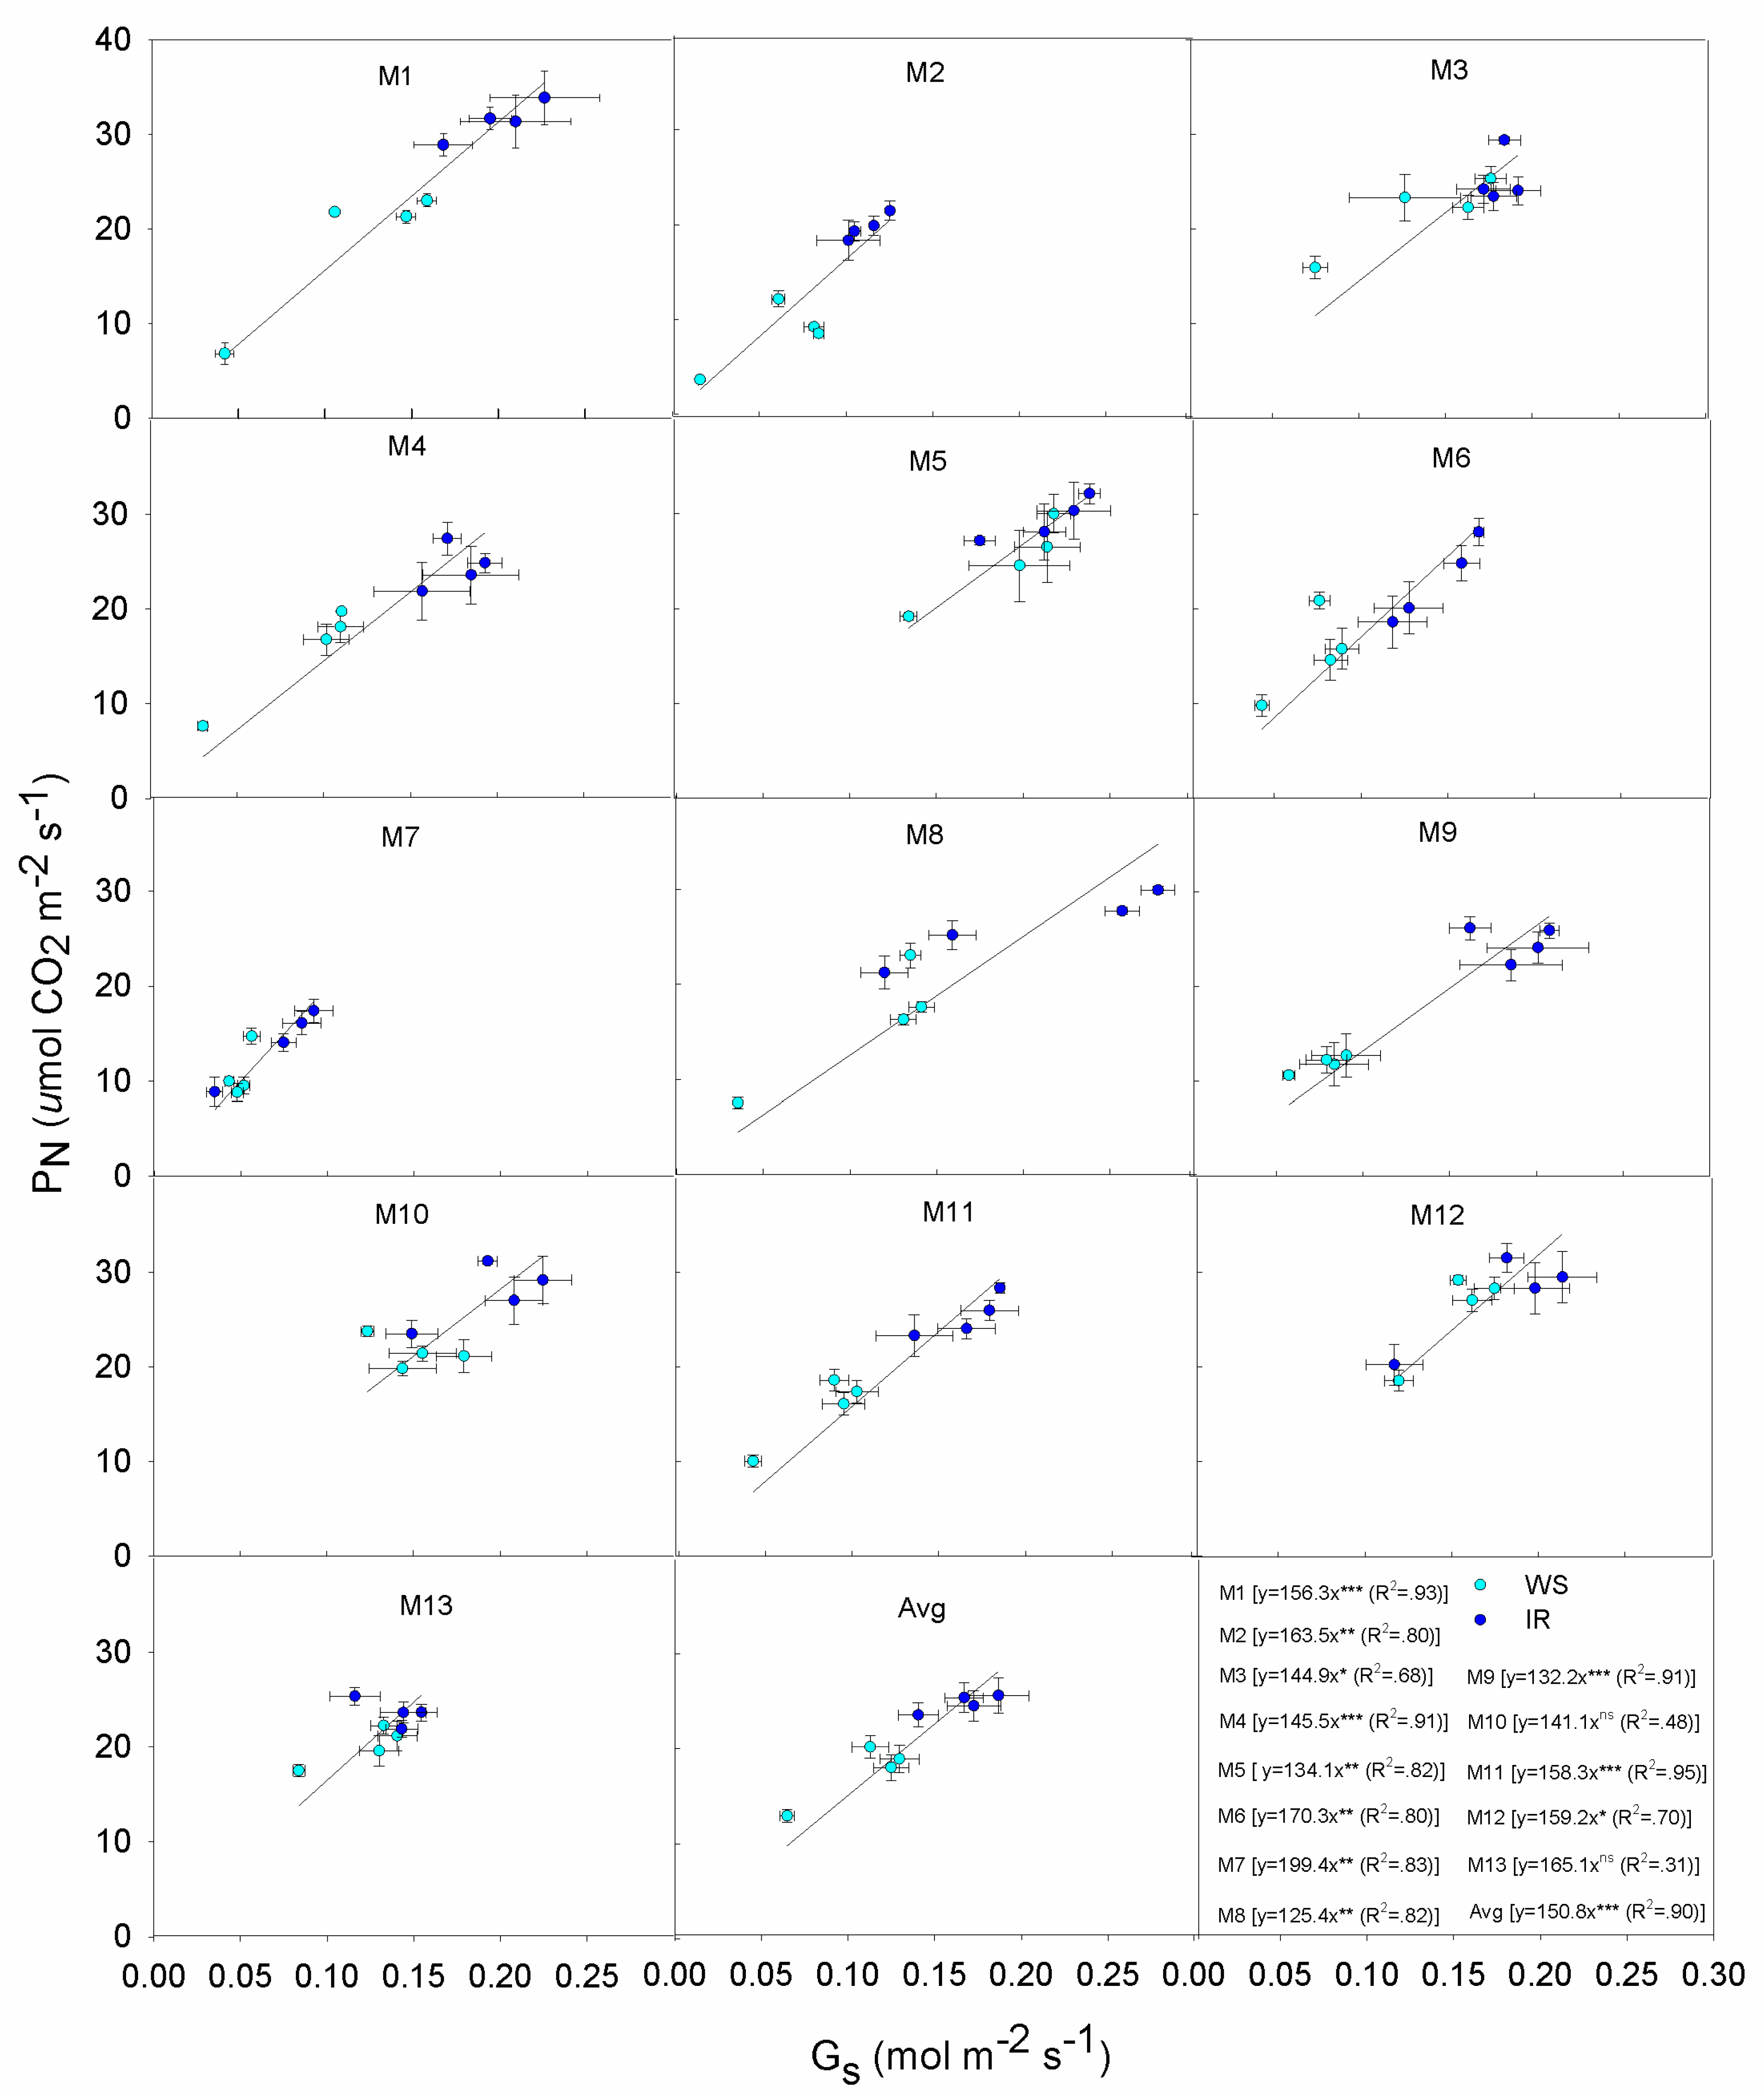
Relationships among physiological traits (Gs and PN, Gs and E, and E and PN) were fitted by linear models with most of them showing high accuracy (significant slopes) and goodness of fit (R2 ≥ 0.70). Across the average of genotypes, the slope in the Gs and PN relationship predicted an average rate of change of 15.82 μmol CO2 m−2 s−1 increase for every 0.1 mol m−2 s−1 of Gs (Figure 4). Non-significant slopes and low R2 (≤0.42) were observed for genotypes M10 and M13, while remaining genotypes showed high accuracy and R2 ranging from 0.68 (M3) to 0.95 (M11). The highest rate of change was found in genotype M7 (19.94 μmol CO2 m−2 s−1), although both irrigated and rainfed data were distributed in a narrow and lower range of the independent variable (Gs from 0.03 to 0.09 mol m−2 s−1). A narrow distribution of observed data was also found for genotype M5; however, the rate of change was lower (13.41 μmol CO2 m−2 s−1) and data were clustered in the upper range of Gs (from 0.14 to 0.24 mol m−2 s−1). On the contrary, the wider distribution of both irrigated and rainfed observed data was found for genotype M8, which produced the lowest slope value (12.54 μmol CO2 m−2 s−1 and Gs varied from 0.12–0.28 mol m−2 s−1).
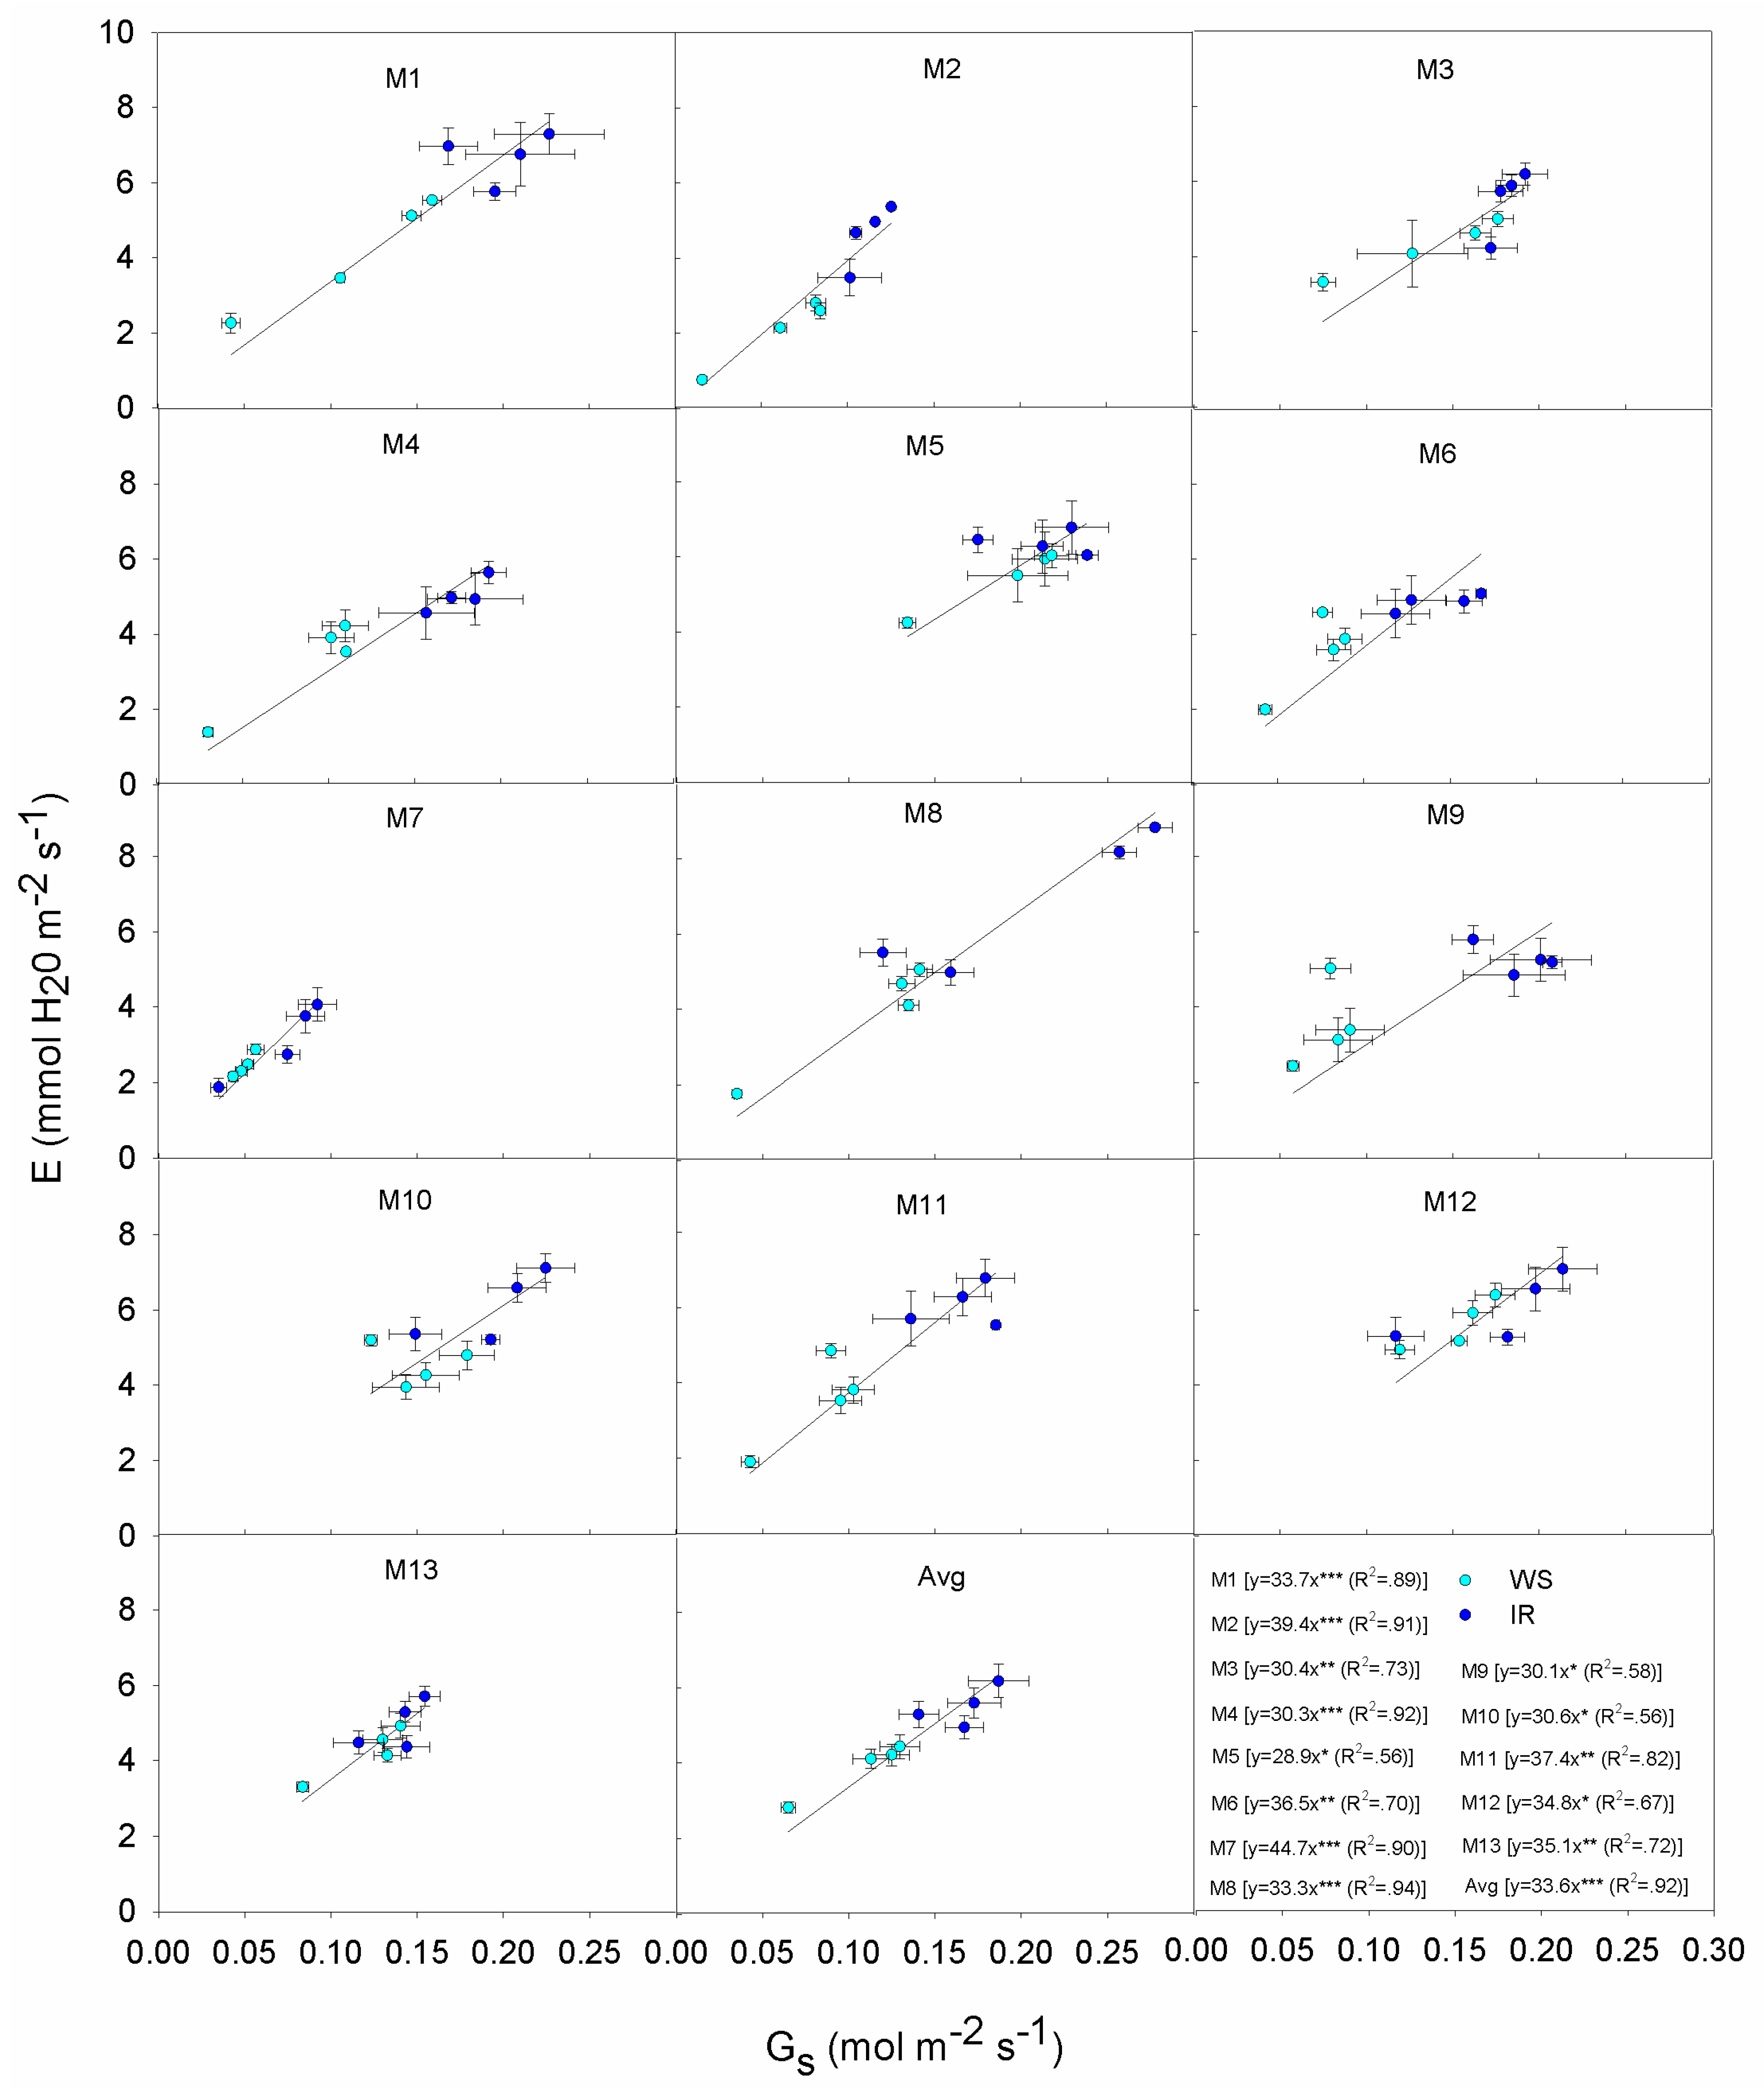
The slope of the genotypic averages in Gs and E indicated an average rate of change of 3.64 mmol H2O m−2 s−1 for every 0.1 mol m−2 s−1 of Gs (Figure 5). All genotypes showed significant positive slopes, although the goodness of fit was variable (R2 varied from 0.54 in genotypes M5 and M10 to 0.94 in genotype M8). Genotype M7 produced the steepest slope (3.64 mmol H2O m−2 s−1) but the narrowest distribution of data clustered in the lowest range of Gs values, and genotype M5 the narrowest distribution but clustered in the upper range of Gs values. Genotype M5 also had the lowest rate of change overall (2.89 mmol H2O m−2 s−1 increase for every 0.1 mol m−2 s−1 of Gs). The widest distribution of both irrigated and rainfed data was found for genotype M8, with a similar trend to the previous Gs-PN relationship.
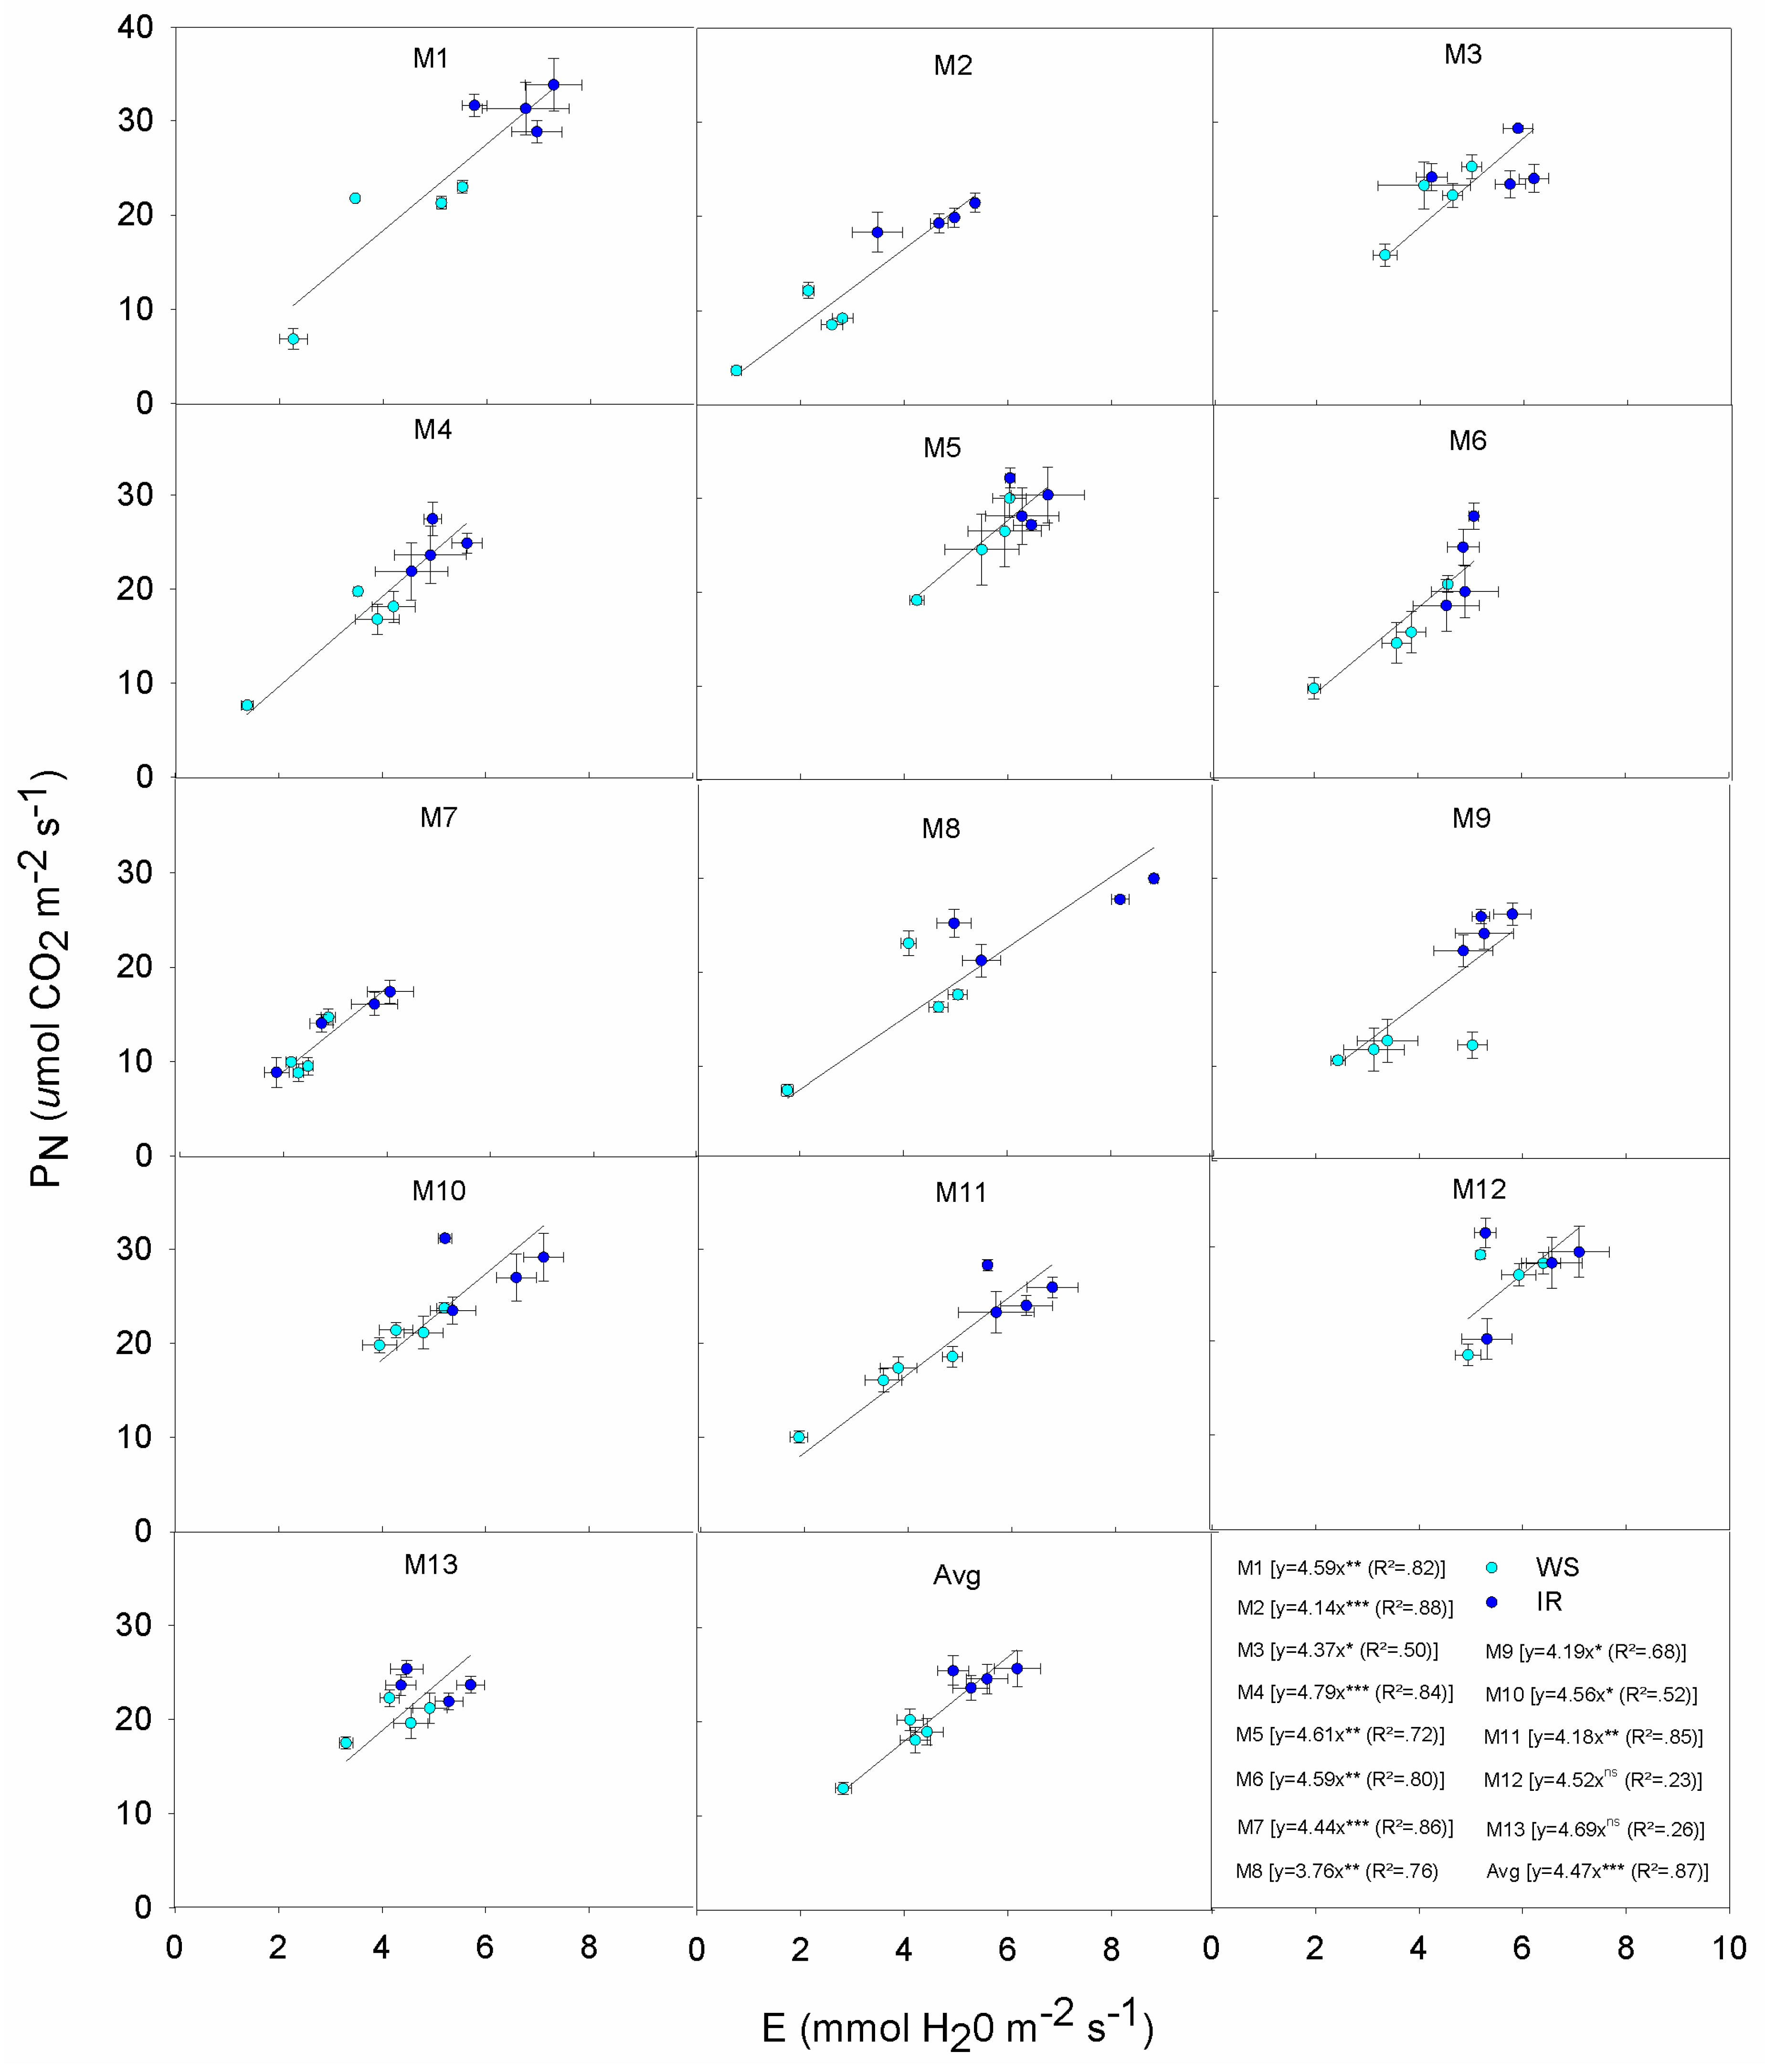
The slope of the genotypic averages in E and PN indicated a rate of change of 4.47 μmol CO2 m−2 s−1 increase for every 1.0 mmol H2O m−2 s−1 of E (Figure 6). All genotypes, except M12 and M13, had significant slopes and R2 varied from 0.50 in genotype M3 to 0.88 in genotype M2. Genotypes M5 and M7 had the narrowest data distribution but clustered at the upper and lower range of E values, respectively. The greatest slope was from genotype M4 (4.79 μmol CO2 m−2 s−1), and the lowest slope from genotype M8 (3.76 μmol CO2 m−2 s−1) which also showed the widest data distribution.

4. Discussion

Miscanthus are high-yielding species, however their biomass potential can be limited by insufficient water supply and plant survival is endangered under extreme summer drought [17]. In the context of increasing drought and rapid climate change, it is of paramount importance to screen wild germplasm for physiological, morphological and productive drought-resilient traits to be used in breeding programs. This study was performed for only one growing season in 2014, however, the meteorological trend was typical of the historical trend previously observed at the experimental farm [9,12]. The dryness index of the whole growing season, expressed by the ratio of annual precipitation to the annual potential evapotranspiration (P/PET), was 0.5, similar to the threshold of ≤0.5 set in the Joint Research Center (JRC) study for the delineation of agricultural areas affected by dryness [37]. Furthermore, P and PET were conversely distributed, and the dryness index was estimated to be as low as 0.1 in the period encompassing the early to middle growth stages of Miscanthus (i.e., from re-sprouting in spring to flowering in summer) or ≈ 0.3 including also later stages (from flowering to senescence in autumn). The study area can therefore be assumed affected by dryness during the growth cycle of Miscanthus. The modelled soil moisture confirmed the long dry period from late spring to the end of summer, when other environmental factors, such as air temperature were adequate to support growth of C4 crops [34,38,39]. Despite the prolonged drought stress Miscanthus genotypes produced higher rates of CO2 fixation and lower levels of stomatal conductance compared to Arundo donax, a fast-growing perennial grass with C3 photosynthetic pathway, tested in the same area [40,41]. Generally, stomatal regulation induced by limited soil moisture resulted in an almost proportional reduction of PN and E; however, the iWUE, across genotypes and date of measurements, was not affected by soil water availability. Adjustment of stomatal physiological behavior to optimize water use efficiency under a range of growth conditions is a noteworthy trait to select for genotypes that are resilient to drought [15,42,43].
The interaction of measurement date and genotypes on physiological parameters was likely significant due to a combination of genetic, phenology and climatic variation throughout the growing season. Generally, an early time of measurement (June) led to higher values of PN and E, since genotypes were undergoing rapid vegetative development, the time of exposure to stress was not long and incoming solar radiation is usually at the highest levels in this environment [39]. As the seasons progressed (July and August) the onset of flowering was triggered by daylength in most genotypes (except in M. floridulus and the high yielding M. sinensis), and PN and E were significantly reduced. At the latest measurement date (September), physiological parameters further declined as almost all genotypes were at full flowering stage (or at beginning of flowering in the late-flowering M. floridulus and M. sinensis genotypes) (data not shown). While in rainfed conditions the severe drought stress induced a sharp decline of physiological parameters from mid stages, the steady decrease in physiological parameters under irrigated conditions can be ascribed to developmental maturity and other climatic variations as the season progressed. For instance, the vapor pressure deficit (VPD) reached high values of 4.0 kPa in summertime (data not shown) making it impossible for even irrigated plants to supply enough water to prevent decreasing plant water potential (the sum of turgor and osmotic pressure). In a previous study with a C4 perennial grass (Saccharum spontaneum spp. aegyptiacum) grown at the same location, Scordia et al. [39] showed that crops, even under full irrigation, significantly reduced carbon assimilation rates and increased water loss by transpiration at high VPD levels. In M. x giganteus, Foti et al. [44] showed an increase in leaf transpiration from 56 to 171 mg m−2 s−1 as the VPD increased from 1.67 to 3.41 kPa. In other C4 annual crops (maize and sorghum), CO2 assimilation rate at VPD of 4.0 kPa were 59% and 70% of that at a VPD of 1.25 kPa [45]. Thus, VPD cannot be ruled out in contributing to the declining trend in PN, Gs and E in midsummer of 2014.
The present study confirmed the phenotypic diversity and variable physiological responses of Miscanthus, even within the same species [15,16,19,32]. The four M. floridulus genotypes (M3, M4, M5 and M6), across different measurement dates and irrigation regimes, showed 31% variability in PN, 45% in Gs, 32% in E, and 10% variability in iWUE. In the seven M. sinensis genotypes (M7, M8, M9, M10, M11, M12 and M13) the variability was still higher, reaching 54% in PN, 63% in Gs, 52% in E, and 16% in iWUE. Both M. floridulus and M. sinensis genotypes under water stress increased iWUE by 0.6 and 2%, respectively; in contrast, iWUE decreased in M. sacchariflorus (M2) and M. x giganteus (M1) by 2% and 7%, respectively. This suggests that M. sinensis and secondarily M. floridulus genotypes possess traits, such as stomatal regulation to control water loss while maintaining photosynthetic rates, allowing better adaptation to drought compared with M. sacchariflorus and M. x giganteus. This is in agreement with Stavridou et al. [30], who showed that a genotype of M. sinensis used a slow-growing conservative strategy and low stomatal conductance to tolerate prolonged drought conditions; in contrast, both M. x giganteus and M. floridulus which used a non-conservative growth strategy in favorable growing conditions; however, the latter, responded to drought stress more severely in adjusting leaf senescence, stomatal control and biochemistry [30].
Biomass yield is the main trait to select for candidate germplasm in PBCs. Nevertheless, yield is a complex trait, that involves several morphological, physiological and biochemical mechanisms that interact with abiotic and biotic factors. Robson et al. [19] demonstrated that tallest stem, stem count and stem diameter measurements in Miscanthus predicted approximately 60% of yield. This was confirmed by Huang et al. [32] using RandomForest modelling explaining >60% of yield based on these three traits. In this study, correlations between yield and stem number (r = 0.88) and yield and stem height (r = 0.45) were both positive and significant. In the present environment and field conditions, M. x giganteus was outperformed by several genotypes, both in rainfed and irrigated treatments. The M. floridulus genotypes M3 and M4, and the M. sinensis (M10, mainly under irrigation), produced the highest stem number, the tallest stems, and the highest biomass yield overall. Furthermore, they were the most efficient in utilizing the available water (WUEWP), particularly under rainfed conditions (M3 and M4). Other genotypes, such as the M. floridulus M5 and the M. sinensis M9, demonstrated improved WUEWP in rainfed conditions. Both M. x giganteus and M. sinensis (M10) demonstrated a decreased WUEWP in rainfed conditions, suggesting that they used a non-conservative strategy for growth [30]. The remaining genotypes, including M. sacchariflorus (M2), were characterized by low biomass yield; however, the WUEWP was similar between irrigation regimes suggesting a conservative slow-growth strategy to cope with stress conditions. Relationships among physiological traits allowed improved knowledge of genotype responses to favorable and water stress conditions, as summarized in Table 5.

5. Conclusions

This study increased our knowledge of different mechanistic responses to drought for development of genotypes that are more resilient to climate change and for sustainable development of biomass crops for the bioeconomy.
Although the study was conducted only for one growing season, information on the physiology, morphology and yield of wild Miscanthus germplasm grown under irrigation and prolonged water stress conditions in the field significantly contributes toward our ability to select appropriate genotypes expressing useful variation in target traits for crossing to produce novel drought-tolerant plants. Nonetheless, further insights into traits that effect seed production such as flowering time and synchronization, panicle amount, flower fertility and pollination, seed setting, ripening and production, need careful evaluation for successful seed-based varieties.
The Miscanthus genotypes studied showed a good range of adaptability to semi-arid Mediterranean conditions, expressing the main physiological traits associated with C4 crops, such as high photosynthetic rates, biomass yields and water use efficiencies. However, the diversity found among the germplasm tested here, the temporal variation in net photosynthesis, stomatal conductance, transpiration rate and instantaneous water use efficiency demonstrated the presence of different strategies between genotypes.
Selections from M. floridulus and M. sinensis were better adapted to rainfed conditions and could produce six times more biomass than the M. x giganteus. In terms of water use efficiency (WUEWP) three different groups were identified: (i) the genotypes M3, M4, M5 and M9, although biomass yield decreased under stress as compared with favorable conditions, these genotypes improved water use when under drought stress due to efficient stomata regulation. In particular, genotype M4 was the most efficient in both treatment conditions, and good stomatal control allowed M4 to maintain relatively high PN and moderate water loss by transpiration; (ii) the responses of genotypes M2, M6, M7, M8, M11, M12 and M13 were similar between irrigation and rainfed conditions, suggesting a conservative growth strategy. Worthy of further investigation genotype M12 produced higher DMY compared with the other genotypes belonging to the same “conservative” group; (iii) genotypes M1 and M10 produced high biomass yield under favorable conditions (mainly M10); however, water use efficiency declined under drought stress mainly due to high transpiration rates and a non-conservative growth strategy.
Selections from M. floridulus and M. sinensis are being used as parents in experimental breeding aimed at producing future seed-based drought resilient hybrids.

Author Contributions

Authors contributed equally to this work. All authors have read and agreed to the published version of the manuscript.

Funding

This research was funded by the European Union, Seventh Framework Programme (FP7/2007-2013), through the project “Optimization of Perennial Grasses for Biomass Production (OPTIMA, Grant Agreement No. 289642)”, and by the UK’s Biotechnology and Biological Sciences Research Council (BBSRC) Core Strategic Programme grant on Resilient Crops (http://www.resilientcrops.org/) (BBS/E/W/10963A01) and with DEFRA with Ceres, Terravesta, EoN, NFU and Blankney Estates collaborating on GIANT LINK (LK0863, 2012-16).

Acknowledgments

Authors gratefully acknowledge Carmelo Maugeri, Matteo Maugeri and Dario Maugeri of the University of Catania for field trial set-up and maintenance. We also thank Kai-Uwe Schwarz and Lin Huang for assistance with the germplasm collections: in Japan with Toshihiko Yamada; in Taiwan with Tsai-Wen Hsu and Yu-Chung Chiang, and in China with Qingguo Xi. We thank Astley Hastings for computing rainfall for the accessions from global gridded climate data, and Richard Webster for assisting with germplasm selections from breeding nurseries in Catania.

Conflicts of Interest

The authors declare no conflict of interest.

References

  1. Scarlat, N.; Dallemand, J.F.; Monforti-Ferrario, F.; Nita, V. The role of biomass and bioenergy in a future bioeconomy: Policies and facts. Environ. Dev. 2015, 15, 3–34. [Google Scholar] [CrossRef]
  2. Tilman, D.; Socolow, R.; Foley, J.A.; Hill, J.; Larson, E.; Lynd, L.; Pacala, S.; Reilly, J.; Searchinger, T.; Somerville, C.; et al. Beneficial biofuels—The food, energy, and environment trilemma. Science 2009, 325, 270–271. [Google Scholar] [CrossRef] [PubMed] [Green Version]
  3. Dauber, J.; Brown, C.; Fernando, A.L.; Finnan, J.; Krasuska, E.; Ponitka, J.; Styles, D.; Thrän, D.; Van Groenigen, K.J.; Weih, M.; et al. Bioenergy from “surplus” land: Environmental and socio-economic implications. BioRisk 2012, 7, 5–50. [Google Scholar] [CrossRef]
  4. Von Cossel, M.; Wagner, M.; Lask, J.; Magenau, E.; Bauerle, A.; Cossel, V.V.; Warrach-Sagi, K.; Elbersen, B.; Staritsky, I.; van Eupen, M.; et al. Prospects of bioenergy cropping systems for a more social-ecologically sound bioeconomy. Agronomy 2019, 9, 605. [Google Scholar] [CrossRef] [Green Version]
  5. Von Cossel, M.; Lewandowski, I.; Elbersen, B.; Staritsky, I.; Van Eupen, M.; Iqbal, Y.; Mantel, S.; Scordia, D.; Testa, G.; Cosentino, S.L.; et al. Marginal agricultural land low-input systems for biomass production. Energies 2019, 12, 3123. [Google Scholar] [CrossRef] [Green Version]
  6. Robson, P.R.H.; Hastings, A.; Clifton-Brown, J.C.; McAlmont, J.P. Sustainable use of Miscanthus for biofuel. In Achieving Carbon-Negative Bioenergy Systems from Plant Materials; Saffron, C., Ed.; Burleigh Dodds Science Publishing: Cambridge, UK, 2019; Chapter 7; ISBN 9781786762528. [Google Scholar]
  7. Lewandowski, I.; Scurlock, J.M.; Lindvall, E.; Christou, M. The development and current status of perennial rhizomatous grasses as energy crops in the US and Europe. Biomass Bioenergy 2003, 25, 335–361. [Google Scholar] [CrossRef]
  8. Schmidt, T.; Fernando, A.L.; Monti, A.; Rettenmaier, N. Life Cycle Assessment of Bioenergy and Bio-Based Products from Perennial Grasses Cultivated on Marginal Land in the Mediterranean Region. Bioenergy Res. 2015, 8, 1548–1561. [Google Scholar] [CrossRef]
  9. Alexopoulou, E.; Zanetti, F.; Scordia, D.; Zegada-Lizarazu, W.; Christou, M.; Testa, G.; Cosentino, S.L.; Monti, A. Long-Term Yields of Switchgrass, Giant Reed, and Miscanthus in the Mediterranean Basin. Bioenergy Res. 2015, 8, 1492–1499. [Google Scholar] [CrossRef]
  10. Fernando, A.L.; Boléo, S.; Barbosa, B.; Costa, J.; Duarte, M.P.; Monti, A. Perennial Grass Production Opportunities on Marginal Mediterranean Land. Bioenergy Res. 2015, 8, 1523–1537. [Google Scholar] [CrossRef]
  11. Scordia, D.; Cosentino, S.L. Perennial Energy Grasses: Resilient Crops in a Changing European Agriculture. Agriculture 2019, 9, 169. [Google Scholar] [CrossRef] [Green Version]
  12. Zanetti, F.; Scordia, D.; Calcagno, S.; Acciai, M.; Grasso, A.; Cosentino, S.L.; Monti, A. Trade-off between harvest date and lignocellulosic crop choice for advanced biofuel production in the Mediterranean area. Ind. Crop. Prod. 2019, 138, 111439. [Google Scholar] [CrossRef]
  13. Clifton-Brown, J.C.; Lewandowski, I.; Andersson, B.; Basch, G.; Christian, D.G.; Bonderup Kjeldsene, J.; Jorgensen, U.; Mortensene, J.V.; Riched, A.B.; Schwarz, K.U.; et al. Performance of 15 Miscanthus genotypes at five sites in Europe. Agron. J. 2001, 93, 1013–1019. [Google Scholar] [CrossRef] [Green Version]
  14. Clifton-Brown, J.C.; Robson, P.R.H.; Allison, G.G.; Lister, S.; Sanderson, R.; Morris, C.; Hodgson, E.; Farrar, K.; Hawkins, S.; Jensen, E.; et al. Miscanthus: Breeding our way to a better future. Asp. Appl. Biol. 2008, 90, 199–206. [Google Scholar]
  15. Clifton-Brown, J.; Harfouche, A.; Casler, M.D.; Jones, H.D.; Macalpine, W.J.; Murphy-Bokern, D.; Smart, L.B.; Adler, A.; Ashman, C.; Awty-Carroll, D.; et al. Breeding progress and preparedness for mass-scale deployment of perennial lignocellulosic biomass crops switchgrass, miscanthus, willow and poplar. Glob. Chang. Biol. Bioenergy 2019, 11, 118–151. [Google Scholar] [CrossRef] [PubMed] [Green Version]
  16. Clifton-Brown, J.; Schwarz, K.U.; Awty-Carroll, D.; Iurato, A.; Meyer, H.; Greef, J.; Gwyn, J.; Mos, M.; Ashman, C.; Hayes, C.; et al. Breeding strategies to improve Miscanthus as a sustainable source of biomass for bioenergy and biorenewable products. Agronomy 2019, 9, 673. [Google Scholar] [CrossRef] [Green Version]
  17. Clifton-Brown, J.C.; Lewandowski, I. Water use efficiency and biomass partitioning of three different Miscanthus genotypes with limited and unlimited water supply. Ann. Bot. 2000, 86, 191–200. [Google Scholar] [CrossRef]
  18. Cosentino, S.L.; Patane, C.; Sanzone, E.; Copani, V.; Foti, S. Effect of soil water content and nitrogen supply on the productivity of Miscanthus × giganteus Greef and Deu. in Mediterranean environment. Ind. Crop. Prod. 2007, 25, 75–88. [Google Scholar] [CrossRef]
  19. Robson, P.; Jensen, E.; Hawkins, S.; White, S.R.; Kenobi, K.; Clifton-Brown, J.; Donnison, I.; Farrar, K. Accelerating the domestication of a bioenergy crop: Identifying and modelling morphological targets for sustainable yield increase in Miscanthus. J. Exp. Bot. 2013, 64, 4143–4415. [Google Scholar] [CrossRef] [Green Version]
  20. Allison, G.G.; Morris, C.; Clifton-Brown, J.; Lister, S.J.; Donnison, I.S. Genotypic variation in cell wall composition in a diverse set of 244 accessions of Miscanthus. Biomass Bioenergy 2011, 35, 4740–4747. [Google Scholar] [CrossRef]
  21. Scordia, D.; van den Berg, D.; van Sleen, P.; Alexopoulou, E.; Cosentino, S.L. Are herbaceous perennial grasses suitable feedstock for thermochemical conversion pathways? Ind. Crop. Prod. 2016, 91, 350–357. [Google Scholar] [CrossRef]
  22. Zhao, H.; Wang, B.; He, J.; Yang, J.; Pan, L.; Sun, D.; Peng, J. Genetic diversity and population structure of Miscanthus sinensis germplasm in China. PLoS ONE 2013, 8, e75672. [Google Scholar] [CrossRef] [Green Version]
  23. Clark, L.V.; Dzyubenko, E.; Dzyubenko, N.; Bagmet, L.; Sabitov, A.; Chebukin, P.; Johnson, D.A.; Kjeldsen, J.B.; Petersen, K.K.; Jørgensen, U.; et al. Ecological characteristics and in situ genetic associations for yield-component traits of wild Miscanthus from eastern Russia. Ann. Bot. 2016, 118, 941–955. [Google Scholar] [CrossRef] [PubMed] [Green Version]
  24. Cosentino, S.L.; Testa, G.; Scordia, D.; Alexopoulou, E. Future yields assessment of bioenergy crops in relation to climate change and technological development in Europe. Ital. J. Agron. 2012, 7, 22. [Google Scholar] [CrossRef]
  25. Cramer, W.; Guiot, J.; Fader, M.; Garrabou, J.; Gattuso, J.P.; Iglesias, A.; Lange, M.A.; Llasat, M.C.; Paz, S.; Penuelas, J.; et al. Climate change and interconnected risks to sustainable development in the Mediterranean. Nat. Clim. Chang. 2018, 8, 972–980. [Google Scholar] [CrossRef] [Green Version]
  26. Vicente-Serrano, S.M.; Lopez-Moreno, J.I.; Beguería, S.; Lorenzo-Lacruz, J.; Sanchez-Lorenzo, A.; García-Ruiz, J.M.; Azorin-Molina, C.; Morán-Tejeda, E.; Revuelto, J.; Trigo, R.; et al. Evidence of increasing drought severity caused by temperature rise in southern Europe. Environ. Res. Lett. 2014, 9, 044001. [Google Scholar] [CrossRef]
  27. Flexas, J.; Diaz-Espejo, A.; Galmés, J.; Kaldenhoff, R.; Medrano, H.; Ribas-Carbo, M. Rapid variations of mesophyll conductance in response to changes in CO2 concentration around leaves. Plant Cell Environ. 2007, 30, 1284–1298. [Google Scholar] [CrossRef] [PubMed]
  28. Gulías, J.; Melis, R.; Scordia, D.; Cifre, J.; Testa, G.; Cosentino, S.L.; Porqueddu, C. Exploring the potential of wild perennial grasses as a biomass source in semi-arid Mediterranean environments. Ital. J. Agron. 2018, 13, 937. [Google Scholar] [CrossRef]
  29. Fader, M.; Shi, S.; Von Bloh, W.; Bondeau, A.; Cramer, W. Mediterranean irrigation under climate change: More efficient irrigation needed to compensate increases in irrigation water requirements. Hydrol. Earth Syst. Sci. 2016, 20, 953–973. [Google Scholar] [CrossRef] [Green Version]
  30. Stavridou, E.; Webster, R.J.; Robson, P.R.H. Novel Miscanthus genotypes selected for different drought tolerance phenotypes show enhanced tolerance across combinations of salinity and drought treatments. Ann. Bot. 2019, 124, 653–674. [Google Scholar] [CrossRef]
  31. Chaves, M.M.; Maroco, J.P.; Pereira, J.S. Understanding plant responses to drought—From genes to the whole plant. Func. Plant Biol. 2003, 30, 239–264. [Google Scholar] [CrossRef]
  32. Huang, L.S.; Flavell, R.; Donnison, I.S.; Chiang, Y.C.; Hastings, A.; Hayes, C.; Heidt, C.; Hong, H.; Hsu, T.W.; Humphreys, M.; et al. Collecting wild Miscanthus germplasm in Asia for crop improvement and conservation in Europe whilst adhering to the guidelines of the United Nations’ Convention on Biological Diversity. Ann. Bot. 2019, 124, 591–604. [Google Scholar] [CrossRef] [PubMed]
  33. Nunn, C.; Hastings, A.F.S.J.; Kalinina, O.; Özgüven, M.; Schüle, H.; Tarakanov, I.; van Der Weijde, T.; Anisimov, A.A.; Iqbal, Y.; Kiesel, A.; et al. Environmental influences on the growing season duration and ripening of diverse Miscanthus germplasm grown in six countries. Front. Plant Sci. 2017, 8, 907. [Google Scholar] [CrossRef] [PubMed] [Green Version]
  34. Scordia, D.; Testa, G.; Copani, V.; Patanè, C.; Cosentino, S.L. Lignocellulosic biomass production of Mediterranean wild accessions (Oryzopsis miliacea, Cymbopogon hirtus, Sorghum halepense and Saccharum spontaneum) in a semi-arid environment. Field Crop. Res. 2017, 214, 56–65. [Google Scholar] [CrossRef]
  35. Hastings, A.; Tallis, M.; Casella, E.; Matthews, R.W.; Henshall, P.A.; Milner, S.; Smith, P.; Taylor, G. The technical potential of Great Britain to produce lignocellulosic biomass for bioenergy in current and future climates. Glob. Chang. Biol. Bioenergy 2014, 6, 108–122. [Google Scholar] [CrossRef] [Green Version]
  36. Cosentino, S.L.; Scordia, D.; Sanzone, E.; Testa, G.; Copani, V. Response of giant reed (Arundo donax L.) to nitrogen fertilization and soil water availability in semi-arid Mediterranean environment. Eur. J. Agron. 2014, 60, 22–32. [Google Scholar] [CrossRef]
  37. Confalonieri, R.; Jones, B.; Van Diepen, K.; Van Orshoven, J. Scientific contribution on combining biophysical criteria underpinning the delineation of agricultural areas affected by specific constraints. In RC Science and Policy Reports; Terres, J.M., Hagyo, A., Wania, A., Eds.; European Commission, Joint Research Centre, Institute for Environment and Sustainability: Brussels, Belgium, 2014; ISBN 978-92-79-44340-4. [Google Scholar]
  38. Cosentino, S.L.; Copani, V.; Testa, G.; Scordia, D. Saccharum spontaneum L. ssp. aegyptiacum (Willd.) Hack. A potential perennial grass for biomass production in marginal land in semi-arid Mediterranean environment. Ind. Crops Prod. 2015, 75, 93–102. [Google Scholar]
  39. Scordia, D.; Testa, G.; Cosentino, S.L.; Copani, V.; Patanè, C. Soil water effect on crop growth, leaf gas exchange, water and radiation use efficiency of Saccharum spontaneum L. ssp. aegyptiacum (Willd.) Hackel in semi-arid Mediterranean environment. Ital. J. Agron. 2015, 10, 185. [Google Scholar]
  40. Cosentino, S.L.; Patanè, C.; Sanzone, E.; Testa, G.; Scordia, D. Leaf gas exchange, water status and radiation use efficiency of giant reed (Arundo donax L.) in a changing soil nitrogen fertilization and soil water availability in a semi-arid Mediterranean area. Eur. J. Agron. 2016, 72, 56–69. [Google Scholar] [CrossRef]
  41. Haworth, M.; Cosentino, S.L.; Marino, G.; Brunetti, C.; Scordia, D.; Testa, G.; Riggi, E.; Avola, G.; Loreto, F.; Centritto, M. Physiological responses of Arundo donax ecotypes to drought: A common garden study. GCB Bioenergy 2017, 9, 132–143. [Google Scholar] [CrossRef] [Green Version]
  42. Jones, M.B.; Finnan, J.; Hodkinson, T.R. Morphological and physiological traits for higher biomass production in perennial rhizomatous grasses grown on marginal land. Glob. Chang. Biol. Bioenergy 2015, 7, 375–385. [Google Scholar] [CrossRef] [Green Version]
  43. Haworth, M.; Marino, G.; Riggi, E.; Avola, G.; Brunetti, C.; Scordia, D.; Testa, G.; Gomes, M.T.G.; Loreto, F.; Cosentino, S.L.; et al. The effect of summer drought on the yield of Arundo donax is reduced by the retention of photosynthetic capacity and leaf growth later in the growing season. Ann. Bot. 2019, 124, 567–579. [Google Scholar] [CrossRef] [PubMed]
  44. Foti, S.; Cosentino, S.L.; Patanè, C.; Copani, V.; Sanzone, E. Plant indicators of available soil water in Miscanthus × giganteus Greef and Deu. Agronomie 2003, 23, 29–36. [Google Scholar] [CrossRef]
  45. El-Sharkawy, A.M.; Cock, J.H.; Del Pilar Hernandez, A. Stomatal response to air humidity and its relation to stomatal density in a wide range of warm climate species. Photosyn. Res. 1985, 7, 137–149. [Google Scholar] [CrossRef] [PubMed]
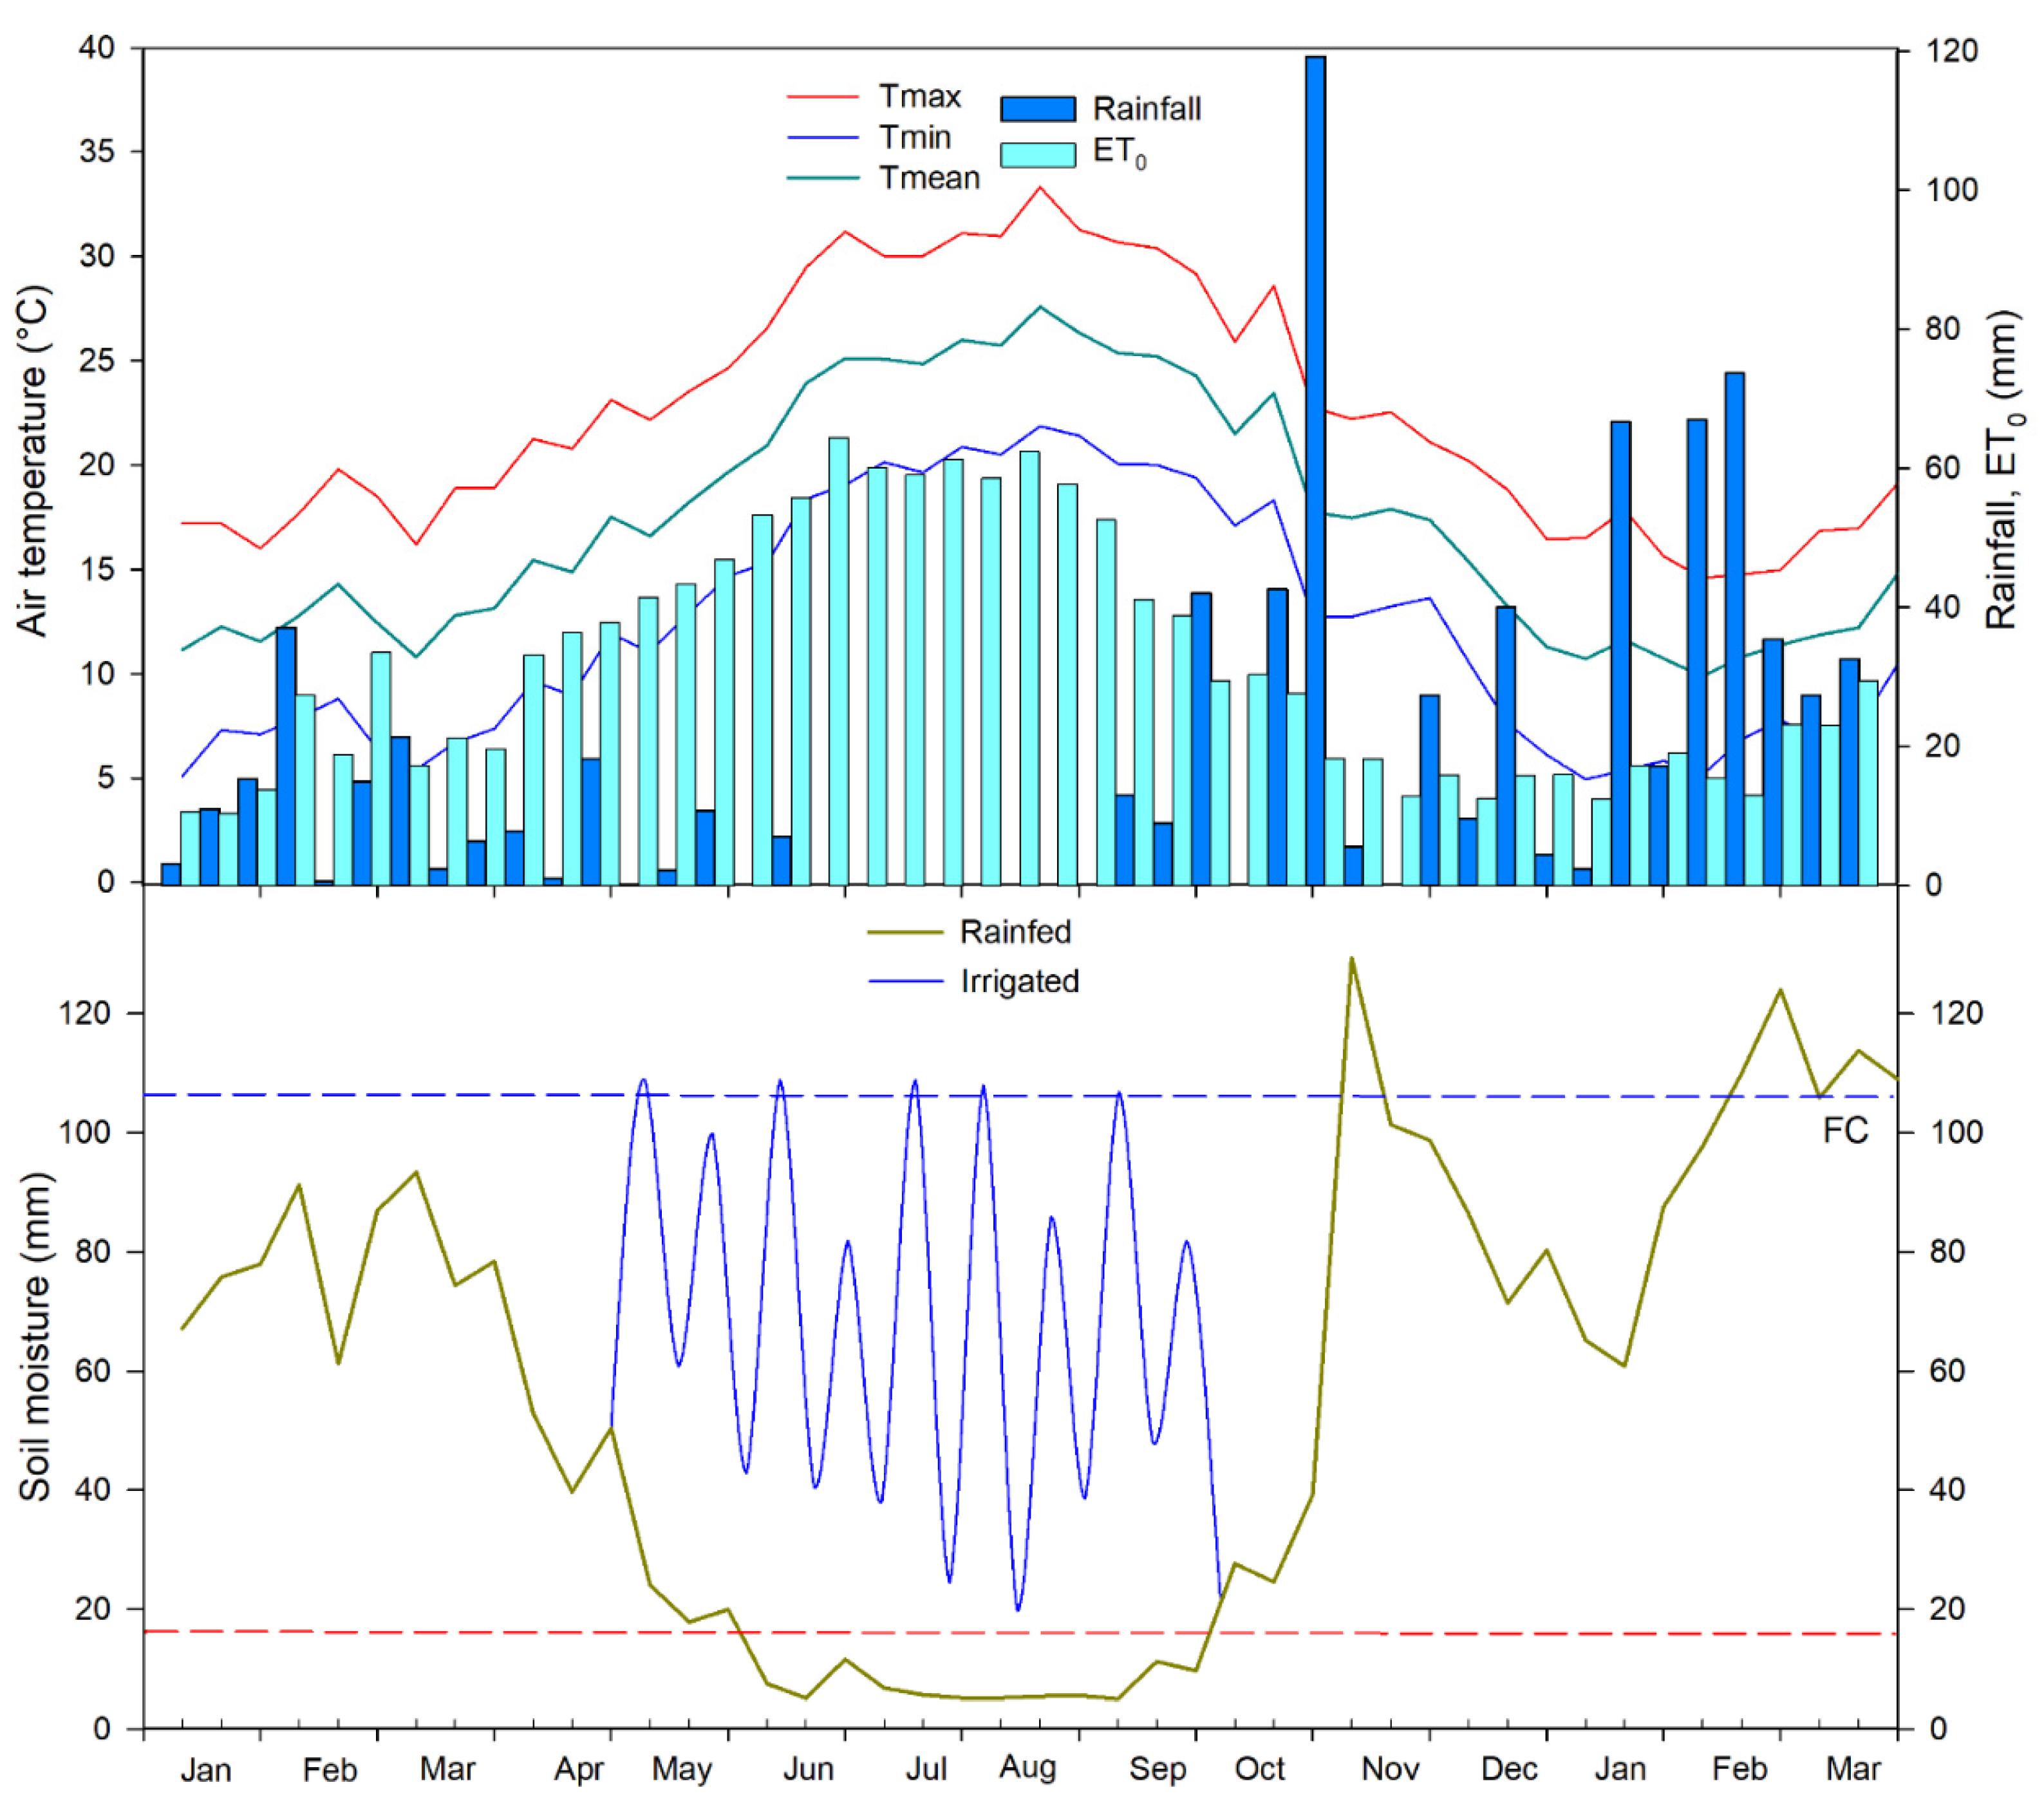
Figure 1. Meteorological trend [maximum, mean and minimum air temperatures (°C), rainfall and reference evapotranspiration (mm)], and modelled soil moisture (mm) in rainfed and irrigated plots through the growing season (February 2014 to February 2015) at the Experimental Farm of the University of Catania (10 m a.s.l., 37°25′ N lat., 15°03′ E long.). The blue dashed line shows the field capacity (FC), while the red dashed line the 20% maximum plant available water below which the crop is considered to be water stressed.
Agronomy 10 00679 g001
Figure 2. (A) Plant height (cm), (B) stem number, (C) biomass dry matter yield (DMY, kg DM plant−1) and (D) whole plant water use efficiency (WUEWP, g L−1) of Miscanthus genotypes (M1—Mxg, M2—M. sacchariflorus, M3–M6—M. floridulus, M7–M13—M. sinensis) under rainfed (WS) and irrigation regimes (IR). LSD0.05 indicates a significant “genotype × irrigation” interaction at p ≤ 0.05.
Agronomy 10 00679 g002
Figure 3. (A) Net photosynthesis (PN, μmol CO2 m−2 s−1); (B) Stomatal conductance (Gs, mol m−2 s−1); (C) Transpiration rate (E, mmol H2O m−2 s−1); (D) Instantaneous water use efficiency (iWUE, μmol CO2 mmol H2O−1) of Miscanthus genotypes (M1—Mxg, M2—M. sacchariflorus, M3–M6—M. floridulus, M7–M13—M. sinensis) under rainfed (WS) and irrigated (IR) conditions. LSD0.05 indicates a significant “genotype × irrigation × date of measurement” interaction at p ≤ 0.05.
Agronomy 10 00679 g003
Figure 4. Relationships between stomatal conductance (Gs) and net photosynthesis (PN) of Miscanthus genotypes under rainfed (WS) and irrigated (IR) conditions in 2014 (the second year following planting). Significant slopes per p ≤ 0.05 (*), p ≤ 0.01 (**), p ≤ 0.001 (***), and not significant (ns).
Agronomy 10 00679 g004
Figure 5. Relationships between stomatal conductance (Gs) and transpiration rate (E) of Miscanthus genotypes under rainfed (WS) and irrigated (IR) conditions in 2014 (the second year following planting). Significant slopes per p ≤ 0.05 (*), p ≤ 0.01 (**), p ≤ 0.001 (***), and not significant (ns).
Agronomy 10 00679 g005
Figure 6. Relationships between transpiration rate (E) and net photosynthesis (PN) of Miscanthus genotypes under rainfed (WS) and irrigated (IR) conditions in 2014 (the second year following planting). Significant slopes per p ≤ 0.05 (*), p ≤ 0.01 (**), p ≤ 0.001 (***), and not significant (ns).
Agronomy 10 00679 g006
Table 1. Latitude and summer rainfall (from Equinox to Equinox) for wild collected Miscanthus spp. genotypes used in this study.
SpeciesAcronymOrigin (Latitude)Summer Rain (mm)
M. x giganteusM1
M. sacchariflorusM2China (29°03′ N)922.5
M. floridulusM3Taiwan (23°56′ N)1509.5
M4Taiwan (23°56′ N)1509.5
M5Taiwan (24°60′ N1461.5
M6Taiwan (24°03′ N)1468.7
M. sinensisM7Japan (35°47′ N)1203.9
M8Japan (37°85′ N)1166.2
M9Taiwan (24°62′ N)1461.6
M10China (18°50′ N)1260.5
M11Japan (35°41′ N)1295.6
M12Taiwan (22°01′ N)1495.6
M13Japan (37°85′ N)1166.2
Table 2. Two-way ANOVA for main effects and interactions on morphological traits (stem number and plant height), biomass yield (DMY) and crop water use efficiency (WUEWP). Degree of freedom (DF); adjusted mean square (Adj MS); Significance indicated by * at p ≤ 0.05.
SourceDFStem NumberPlant HeightDMYWUEWP
Adj MS
Genotype (G)1214,162.79 *6629.21 *35.82 *44.72 *
Irrigation (I)16587.21 *1968.04 *8.69 *6.36 *
G × I122538.06 *2955.89 *1.05 *2.76 *
Error50235.53131.510.420.45
Table 3. Repeated measures ANOVA for main effects and interactions on gas exchange parameters (net photosynthesis—PN, stomatal conductance—Gs, transpiration rate—E, and instantaneous water use efficiency—iWUE). Degree of freedom (DF); Adjusted mean square (Adj MS); Significance indicated by * at p ≤ 0.05; (ns) not significant.
SourceDFPNGsEWUEi
Adj MS
Genotype (G)12514.32 *0.032 *21.166 *1.388 *
Irrigation (I)11650.09 *0.128 *89.401 *0.041 ns
Time (T)3535.84 *0.046 *16.501 *25.768 *
G × T3626.00 *0.002 *1.844 *0.532 *
I × T3302.53 *0.014 *25.930 *2.034 *
G × I12219.57 *0.012 *12.853 *0.816 *
G × I × T3621.38 *0.002 *1.637 *0.365 *
Error(T)1560.9000.00050.0540.020
Error5213.310.010.6980.042
Table 4. Pearson’s correlation test among physiological, morphological and productive traits. Significant per p ≤ 0.05 (*), p ≤ 0.01 (**), p ≤ 0.001 (***), not significant (ns).
PNGsEWUEiPlant HeightStem NumberDMY
Gs0.95 ***
E0.96 ***0.94 ***
WUEi0.26 *0.15 ns−0.00 ns
Plant Height0.24 *0.28 *0.22 ns0.07 ns
Stem Number0.16 ns0.20 ns0.04 ns0.54 ***0.38 **
DMY0.25 ns0.30 *0.10 ns0.62 ***0.45 **0.88 ***
WUEWP0.15 ns0.17 ns0.02 ns0.56 ***0.53 ***0.84 ***0.92 ***
Table 5. Genotypic response (M1—Mxg, M2—M. sacchariflorus, M3–M6—M. floridulus, M7–M13—M. sinensis) under rainfed (WS) and favorable (IR) conditions.
GenotypeResponse
M1Exhibits a wide variation in PN from 36 down to 7 μmol m−2 s−1: high PN is associated with high Gs even under WS. This displays the typical Mxg ‘optimistic’ strategy, with profligate water use even during the onset of mild to severe drought. Overall M1 produced lower DMY relative to other genotypes both IR and WS treatments. This indicates that more assimilates are being partitioned to the below ground roots and rhizomes.
M2Maintains PN under WS and IR, low Gs also under IR; contains E under WS and IR; low E but low increase of PN per unit of E; low DMY in IR and lower in WS.
M3Medium-high PN under moderate Gs, increase slightly PN under IR; moderate E due to moderate Gs under both WS and IR; moderate PN due to moderate E under both conditions; high DMY in IR, significantly reduces in WS.
M4High PN under IR, reduces Gs under WS but PN is still at high levels; moderate E due to limited Gs, even under IR; high PN under little increases of E; high DMY in both IR and WS.
M5High PN but high Gs in both IR and WS; high E due to low Gs control; high PN but at high water expenses; medium-high DMY in both IR and WS.
M6Moderate PN due to limited Gs, increases PN quickly but it remains still low per unit of Gs; moderate E but reaches its maximum even under low Gs; low PN under moderate E; low DMY in IR and lower in WS.
M7Low PN at low Gs, little differences between IR and WS; low E due to low Gs; low E but low PN; low DMY in IR and lower in WS.
M8High PN under IR due to high Gs, but moderate PN in WS; high E under IR due to high Gs, reduces Gs and E under WS; moderate PN under quite high E; low DMY in IR and lower in WS.
M9Low PN and E under WS due to very low Gs; low PN under moderate E, but increases PN in small ranges of E; medium-high DMY in both IR and WS.
M10High PN and E under moderate Gs, increase slightly PN and E under IR; high PN but at high water expenses; high DMY in IR, significantly reduces in WS.
M11Medium-high PN and E under moderate Gs, increase PN and E under IR; quite high E under moderate Gs, and high PN at high E; low DMY and similar in both conditions.
M12High PN but high Gs in both IR and WS; high E due to low Gs regulation; high PN but high water losses; medium-high DMY in IR, reduces in WS.
M13Moderate Gs to support moderate PN and E in both IR and WS; low DMY and similar in both IR and WS conditions.