Article

The Effect of Soil Volume Availability on Opuntia ficus-indica Canopy and Root Growth

1
Department of Agricultural, Food and Forest Sciences, University of Palermo, Viale delle Scienze, ed. 4, 90128 Palermo, Italy
2
International Center for Agricultural Research in the Dry Areas (ICARDA), P.O. Box 950764, Amman 11195, Jordan
3
International Center for Agricultural Research in the Dry Areas (ICARDA), P.O. Box 435, Tunis 1004, Tunisia
*
Author to whom correspondence should be addressed.
Agronomy 2020, 10(5), 635; https://doi.org/10.3390/agronomy10050635
Submission received: 10 March 2020 / Revised: 20 April 2020 / Accepted: 21 April 2020 / Published: 30 April 2020

Abstract

:
The study investigated the effect of soil volume restriction on the below- and above-ground growth of Opuntia ficus-indica through understanding the limit imposed by root confinement via different soil volumes on root and canopy architecture and growth. In 2014, one-year-old O. ficus-indica cladodes were planted in five different soil volumes (50, 33, 18, 9 and 5 L). The cladode and roots of each sampled plants were measured and weighed every six months; a starch content estimation was performed using the perchloric acid method. The restricted soil volume had limiting effects on overall plant growth and influenced plant development. The largest canopy surface area and dry mass were measured in 50 L potted plants. Root system growth was inhibited by soil volume restriction: the total root length, surface area, dry mass and volume decreased due to this restriction. During the whole period, the starch content in cladodes and in roots grown on a 5 L soil volume was twice as much as in the largest, 50 L soil volume. Our results confirmed the importance of O. ficus-indica as a potential plant that can survive under low soil volume conditions. This plant has the ability to balance its growth and stay alive under harsh environments.

1. Introduction

The relative growth of roots and canopy, in terms of the root/canopy ratio, changes greatly with plant age and environmental conditions, since the growth rates of roots and canopy continually adjust to resource availability and sink demand [1]. Functional balance theory [2] suggests that plants reallocate carbon and other nutrients among active tissues to obtain the resources that most limit growth. Another theory suggests that plants assign resources among organs to optimize whole-plant growth [3]. These theories suggest plants adapt to produce a specific root/canopy ratio, but this ratio will move with a degree of flexibility to balance the occurrence of resources-based growth limitations [4]. Along with the shoot reaction to above-ground conditions, the root biomass is influenced by below-ground conditions where a low availability of nutrients and water resources usually leads to a greater root/canopy ratio, as is the case in rain-fed grown grapes, almonds and olives [5]. The root distribution can also be significantly affected by the neighboring trees and the soil characteristics such as soil texture and depth [6]. Eventually, soil volume restriction usually results in a significant reduction of the canopy growth of the trees [7,8].
Globally, drylands occupy 41 percent of the earth’s land surface [9]. These lands are described as very sensitive systems since they are vulnerable to various forms of degradation [10]. They are a challenge to conventional cropping systems because of limited or erratic rainfall, poor soils and high temperatures [11]. Productivity in these areas can be increased by the cultivation of adapted crops such as Opuntia species, especially cactus pear [12]. Cactus pear (Opuntia ficus-indica. (L.) Mill) is a member of the Cactaceae family [13] that has more than 1500 known species worldwide [14]. It is a shrubby or tree-like plant up to 6 m high, usually with well-developed trunks. Opuntia species are Crassulacean acid metabolism (CAM) plants that convert water to biomass four-fold more efficiently than either C4 or C3 plants. Opuntias have developed phenological, physiological and structural adaptations to the arid areas characterized by drought, erratic rainfall and poor soils. They have the capacity to still extract water, coming from the night dew that covers the upper part of the soil, due to their shallow root systems [15]. These traits enable this crop to survive in areas with 200 to 300 mm rainfall [16]. Cladodes are stem-like photosynthetically active segments, responsible for the reproductive and vegetative growth in Platiopuntiae, i.e., O. ficus-indica; for a mature plant, most (80–90%) one-year-old cladodes bear fruits accounting for 90% of the annual yield [16]. Cladode growth, in terms of surface area, is almost entirely completed at the end of their first growing season, but actual growth very much depends on light, soil volume, temperature and basal cladode dry weight. During the next years, cladodes develop only marginally, in terms of surface area, but continue to accumulate dry weight in their inner, parenchyma, tissue. Cladodes become productive when their estimated dry weight (EDW) exceeds the minimum dry weight for a particular surface area by at least 33 g. Eventually, cladodes lose most of their photosynthetic capacity four years after their formation [16].
Roots vs. canopy ratios have been poorly investigated in cactus pear and, on a dry mass basis, may range from 0.14 [17] to 0.25 [16], depending on tree age, planting density and soil fertility. The effect of root restriction on cactus pear growth and CO2 uptake is clear when young plantlets develop in a limited soil volume, and, apparently, the effect of the soil volume persists even after field transfer [18,19]. On the other hand, cactus pear plants’ growth in rocky areas or under soil volume-limited conditions, which occurs very commonly in arid areas, can be very limited (personal observations). This study investigated the effect of soil volume restriction on the below- and above-ground growth of Opuntia ficus-indica through understanding the limit imposed by root confinement via different soil volumes on root and canopy architecture and growth.

2. Materials and Methods

2.1. Cultivation of Opuntia ficus-indica Cladodes and Experimental Design

The study was conducted during the period of May 2014–June 2016 in the open field of the Department of Agricultural, Food and Forest Sciences, University of Palermo (38° 7′ N 13° 2′ E, 29 m a.s.l). The climate is typically Mediterranean, with an average annual rainfall of approximately 630 mm. The dry period of the year can extend up to seven months (April–October).
One-year-old cactus pear cladodes of the cultivar “Gialla” obtained from Palermo University (36.5 ± 0.5 cm long, 19 ± 0.2 cm wide) were cut and dried for two weeks in the shade to allow healing of the wounded areas. At the end of May 2014, cladodes were planted with half of their length in the soil, in five different pots with different soil volumes (50, 33, 18, 9 and 5 L). Pots were filled with dry fine, sandy loam soil (clay = 9.9%, silt = 13.0% and sand = 77.2% mass). The field capacity of this soil was 35% and wilting point 20% Vol. The soil had a pH of 6.8 and contained about 8.0 g kg−1 organic matter and 1.32 g kg−1 total Nitrogen. Plants were watered regularly throughout the dry season to maintain the soil water content at 75% of field capacity to avoid water stress. No fertilization was applied during the trial period, and the total N content in the soil never dropped below 1.04 g kg−1. For each sampling date (6, 12, 18 and 24 months since cladode planting), a total of 25 pots (5 replicates × 5 soil volumes) were sampled [20].
The experimental design was a completely randomized design with possible combinations of the two factors, the soil volume and month of the sampling, with five replications.

2.2. Canopy Measurements

2.2.1. Number of Cladodes Per Plant

At any sampling date, cladodes of every sampled plant were counted and numbered according to their age. Cladodes were clustered into three groups sorted by age: mother cladodes, first-generation cladodes and second-generation cladodes. The total number of cladodes in each group was recorded. For each cladode in each group, the following measurements were taken: cladode surface area, cladode thickness, and cladode fresh and dry weight.

2.2.2. Cladodes’ Surface Area (cm2)

The width and length of each cladode were measured. The maximum cladode width (W) was the widest point perpendicular to the half part of the cladode, and the length (L) was the distance from one end to the other end along the longest axis of the cladode.
These values were used to estimate the area of the cladode using the formula of the ellipse:
X = (W/2) × (L/2) × π
where: X = estimated area; W = width, minor axis; L = length, major axis; and π = 3.14

2.2.3. Cladode Measurements: Fresh and Dry Weight, Thickness

The fresh weight of each cladode was taken, and three subsamples of each cladode were cut, weighed and dried in a forced-draft oven at 75 °C for 72 h to estimate the dry weight. To estimate the starch content, two samples were taken from each mother cladode, one from the below-soil and one from the above-soil part, weighed and dried in an oven at 50 °C.
The cladodes’ thickness was measured in mm with a digital caliper (mod. 20040, TR Turoni, Forlì, Italy).

2.2.4. Starch Content Analysis

The starch content was measured, in cladodes and roots, using the perchloric acid method. The prepared tissue was extracted with boiling ethanol to remove interfering sugars and to gelatinize the starch granule. Then, the starch was solubilized by extracting the tissue in perchloric acid. This was accomplished in several ways, which included soaking or immersing the sample in acid (PA1), percolating acid through the sample (PA2), or percolating the sample and then precipitating starch with potassium iodide (KI) (PA3) [21,22,23]. The solubilized starch solution was then reacted with a mixture of concentrated sulfuric acid and anthrone to hydrolyze starch to glucose and to produce a color product that was quantified colorimetrically on a spectrophotometer [24,25].

2.3. Root Measurements

2.3.1. Root Surface Area

The root surface area was measured using VegMeasure software® (Developed by Icarda in collaboration with Oregon State Univerisity, Corvallis, USA). VegMeasure is a Digital Vegetation Charting Technique (DVCT) developed based on a computerized vegetation measurement program tested in a previous study [26]. The three spectral reflectance bands (RGBs) of the digital color camera are rationed by the software to create meaningful classes. This technique allows for the customization of the images. Vertical roots images were taken using a COOLPIX AW110 digital camera (Nikon, Tokyo, Japan) equipped with a 28 mm lens. The camera was mounted to a camera stand that was designed for mounting the camera for laboratory testing. The baseboard has a non-reflective dull black surface. The column is 760 mm in height, marked with scales for height determination. A hand-operated camera armed conveniently adjusts the camera up and down horizontally. To minimize the overlapping, roots from each category were divided into small portions and were spread carefully on a blackboard to minimize the overlaps then pictured. The dimension of each image was 4608 × 3456 pixels, and the size was about 6 Mb in JPG format. The camera lens was 35 cm from the blackboard surface. One pixel in the digital image represented 0.013 mm2 at the board surface. Estimates of yellowness (% yellow root surface cover) were calculated from the digital camera images using the supervised classification technique in VegMeasure software® [27,28]. The colors from the obtained digital camera picture were interpreted by the software to create two meaningful classes. In this case, the manual classification of the root surface area and the blackboard surface area were set up for the images. After uploading all images, a few images were selected to set the threshold for each class. The pixels for each category in the image having the same value would be displayed instantly with a pre-defined color. The ”statistics” button would estimate the percent cover for each category while unclassified pixels remain black. By adding more colors to each category, the number of unclassified pixels would decrease until all pixels are housed in a category. In this study this value was 0%, which means that all the colors in the original picture were added to its category. At this stage, these classifications were applied to all images.
Figure 1 shows the original and processed pictures for one of the root images. The output folder contains the processed images and a summary excel file that illustrates the name of each image and the values (%) of the classification for each category. The total surface area of yellow roots from the image classification was calculated by summing the total area occupied by pixels classified as the root surface area. These values were multiplied by π “3.14”, assuming the roots have cylindrical shapes.
The classification accuracy was assessed using the accuracy assessment tool in VegMeasure© through computing the error matrix and the Kappa Index of Agreement. The latter is commonly used in remote sensing classifications to assess the degree of success of a classification technique. The error matrix permits the measurement of overall accuracy, category accuracy, producer’s accuracy and user’s accuracy [29].

2.3.2. Root Volume

The root volumes were calculated from the surface area and root length (or) by assuming that the roots were cylindrical. After finishing the root measurements, three random subsamples from each pot root were weighed and dried in a forced-draft oven at 75 °C for 72 h and the dry weight for each group was calculated.

2.4. Statistical Analysis

The effect of the soil volume and sampling date on canopy and root growth was examined in terms of variability. Data were submitted to a one-way analysis of variance (ANOVA), and means were separated with Tukey’s test at p ≤ 0.05. The mean values of these factors were obtained along with their standard errors. All analyses were carried out using GenStat v.18 (VSN International, London, UK). Means were analyzed by soil volumes (5, 9, 18, 33 and 50 L) within the sampling date and among sampling dates (6, 12, 18 and 24 months after planting) for the same soil volume.

3. Results

3.1. Canopy Growth and Surface Area

The number of the first generation cladodes was affected by the soil volume restriction, but not by the sampling date. The first generation cladodes appeared from mother cladodes at the same time for all the plants. If there is any new growth, this will be produced from the areoles of the first-generation cladodes. The effect of the soil volume on the number of the first generation cladodes did not have any clear trend. However, the soil volume affected the number of second-generation cladodes and the total cladode number. The lower the soil volume, the lower the number of cladodes produced, which was 50% lower in the smallest (5 L) soil volume than in the largest one (50 L) (Table 1). Indeed, six months after being planted in a pot, all cuttings produced an average of 3.3 ± 0.4 new cladodes (1st generation cladodes), with no significant influence of the treatment (soil volume) (data not shown). The mother cladode still produced a marginal number of new cladodes 12 months after being planted, with no further budding in the next sampling dates (18 and 24 months after planting) (data not shown). At the end of the first year, the number of new cladodes grown on the mother cladodes was highest in the largest, 50 L, soil volume (6.2 ± 0.8) and lowest in the smallest, 5 L, one (3.1 ± 0.6) (data not shown).
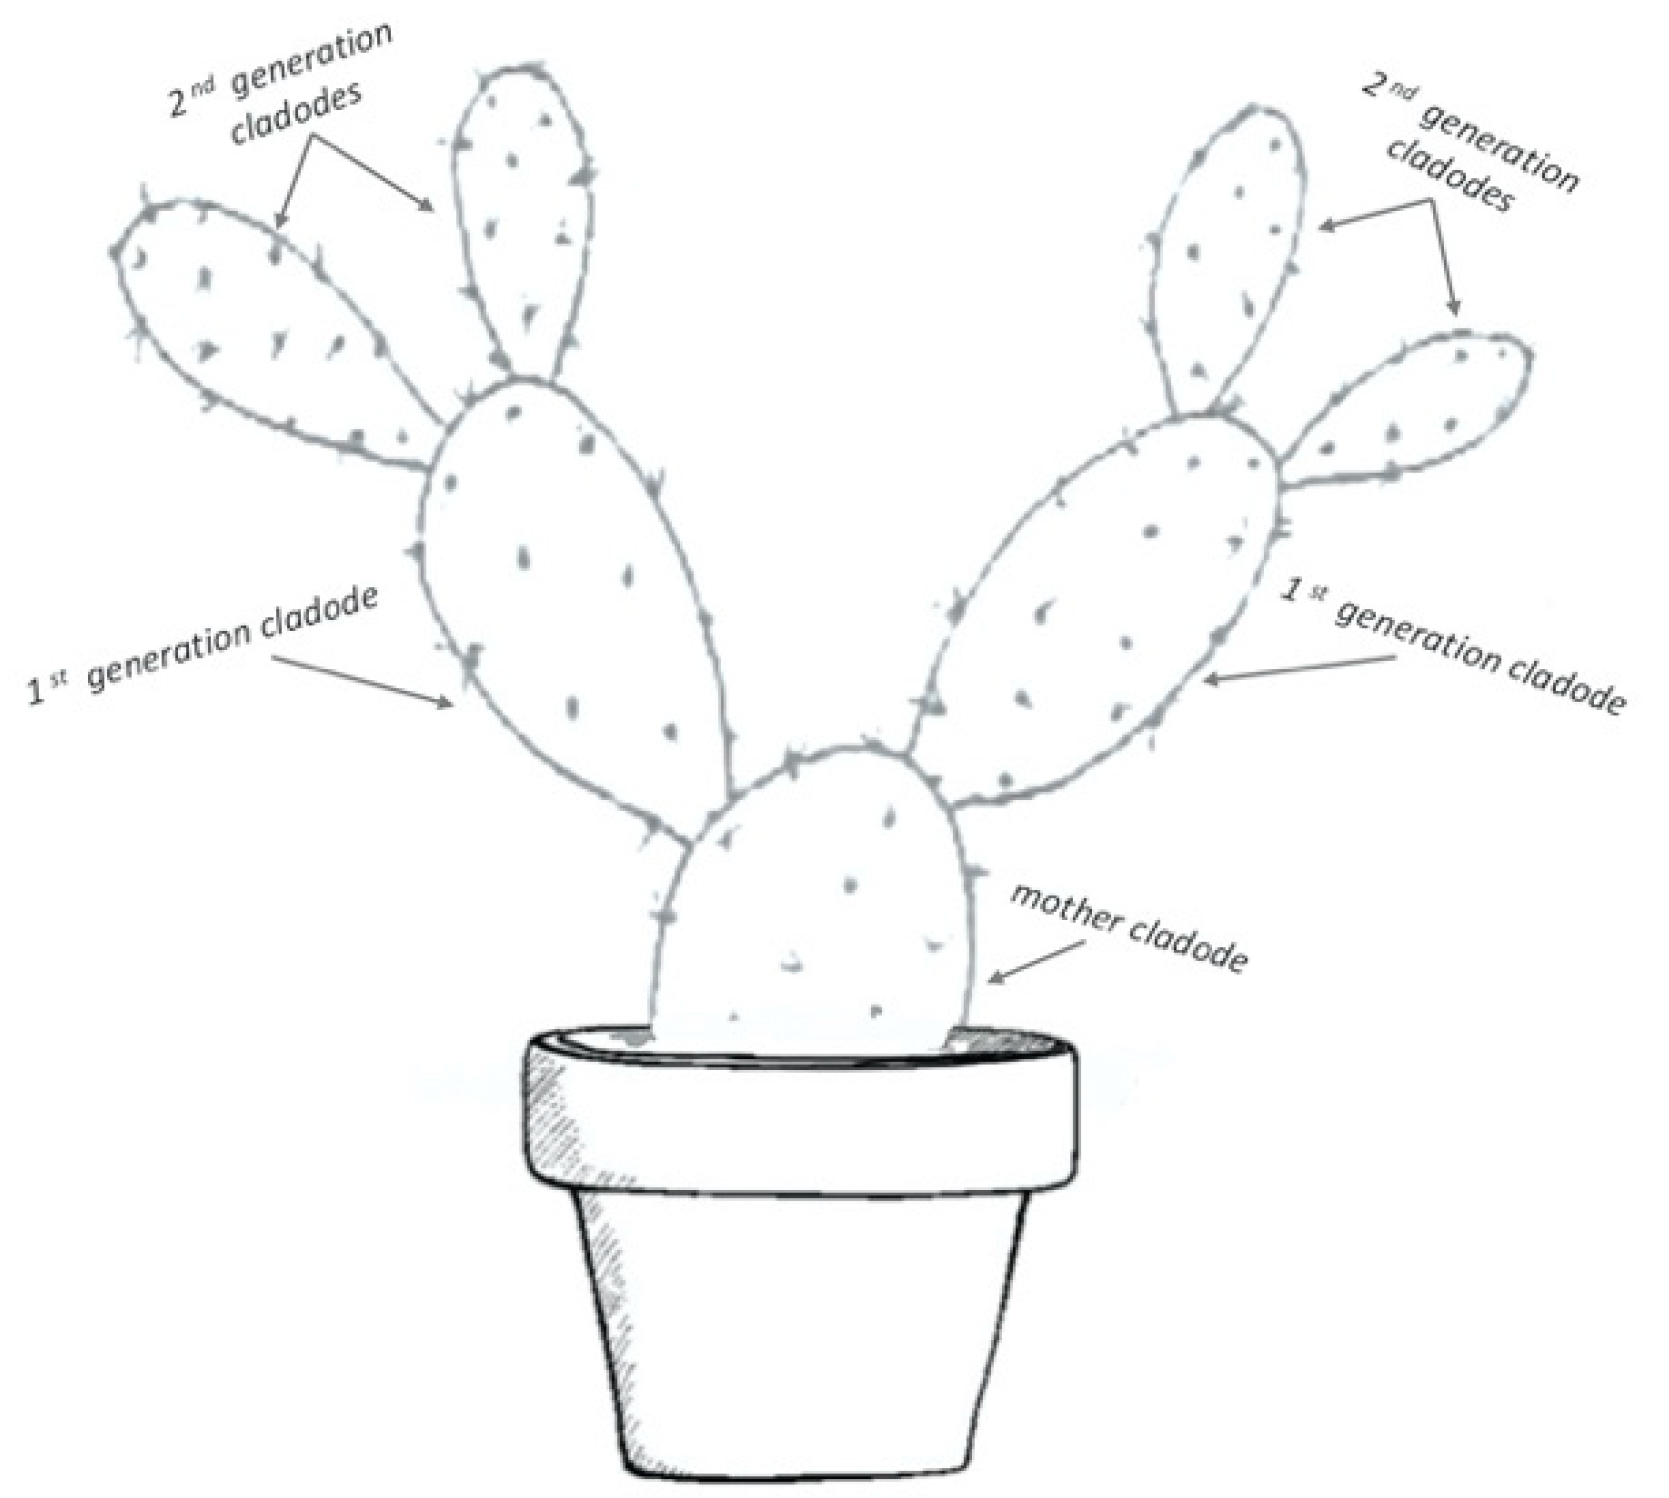
Six months after planting, all the 1st generation cladodes produced new cladodes (2nd generation cladodes (Figure 2) along with their growth, with a significant effect of the soil volume (Figure 1).
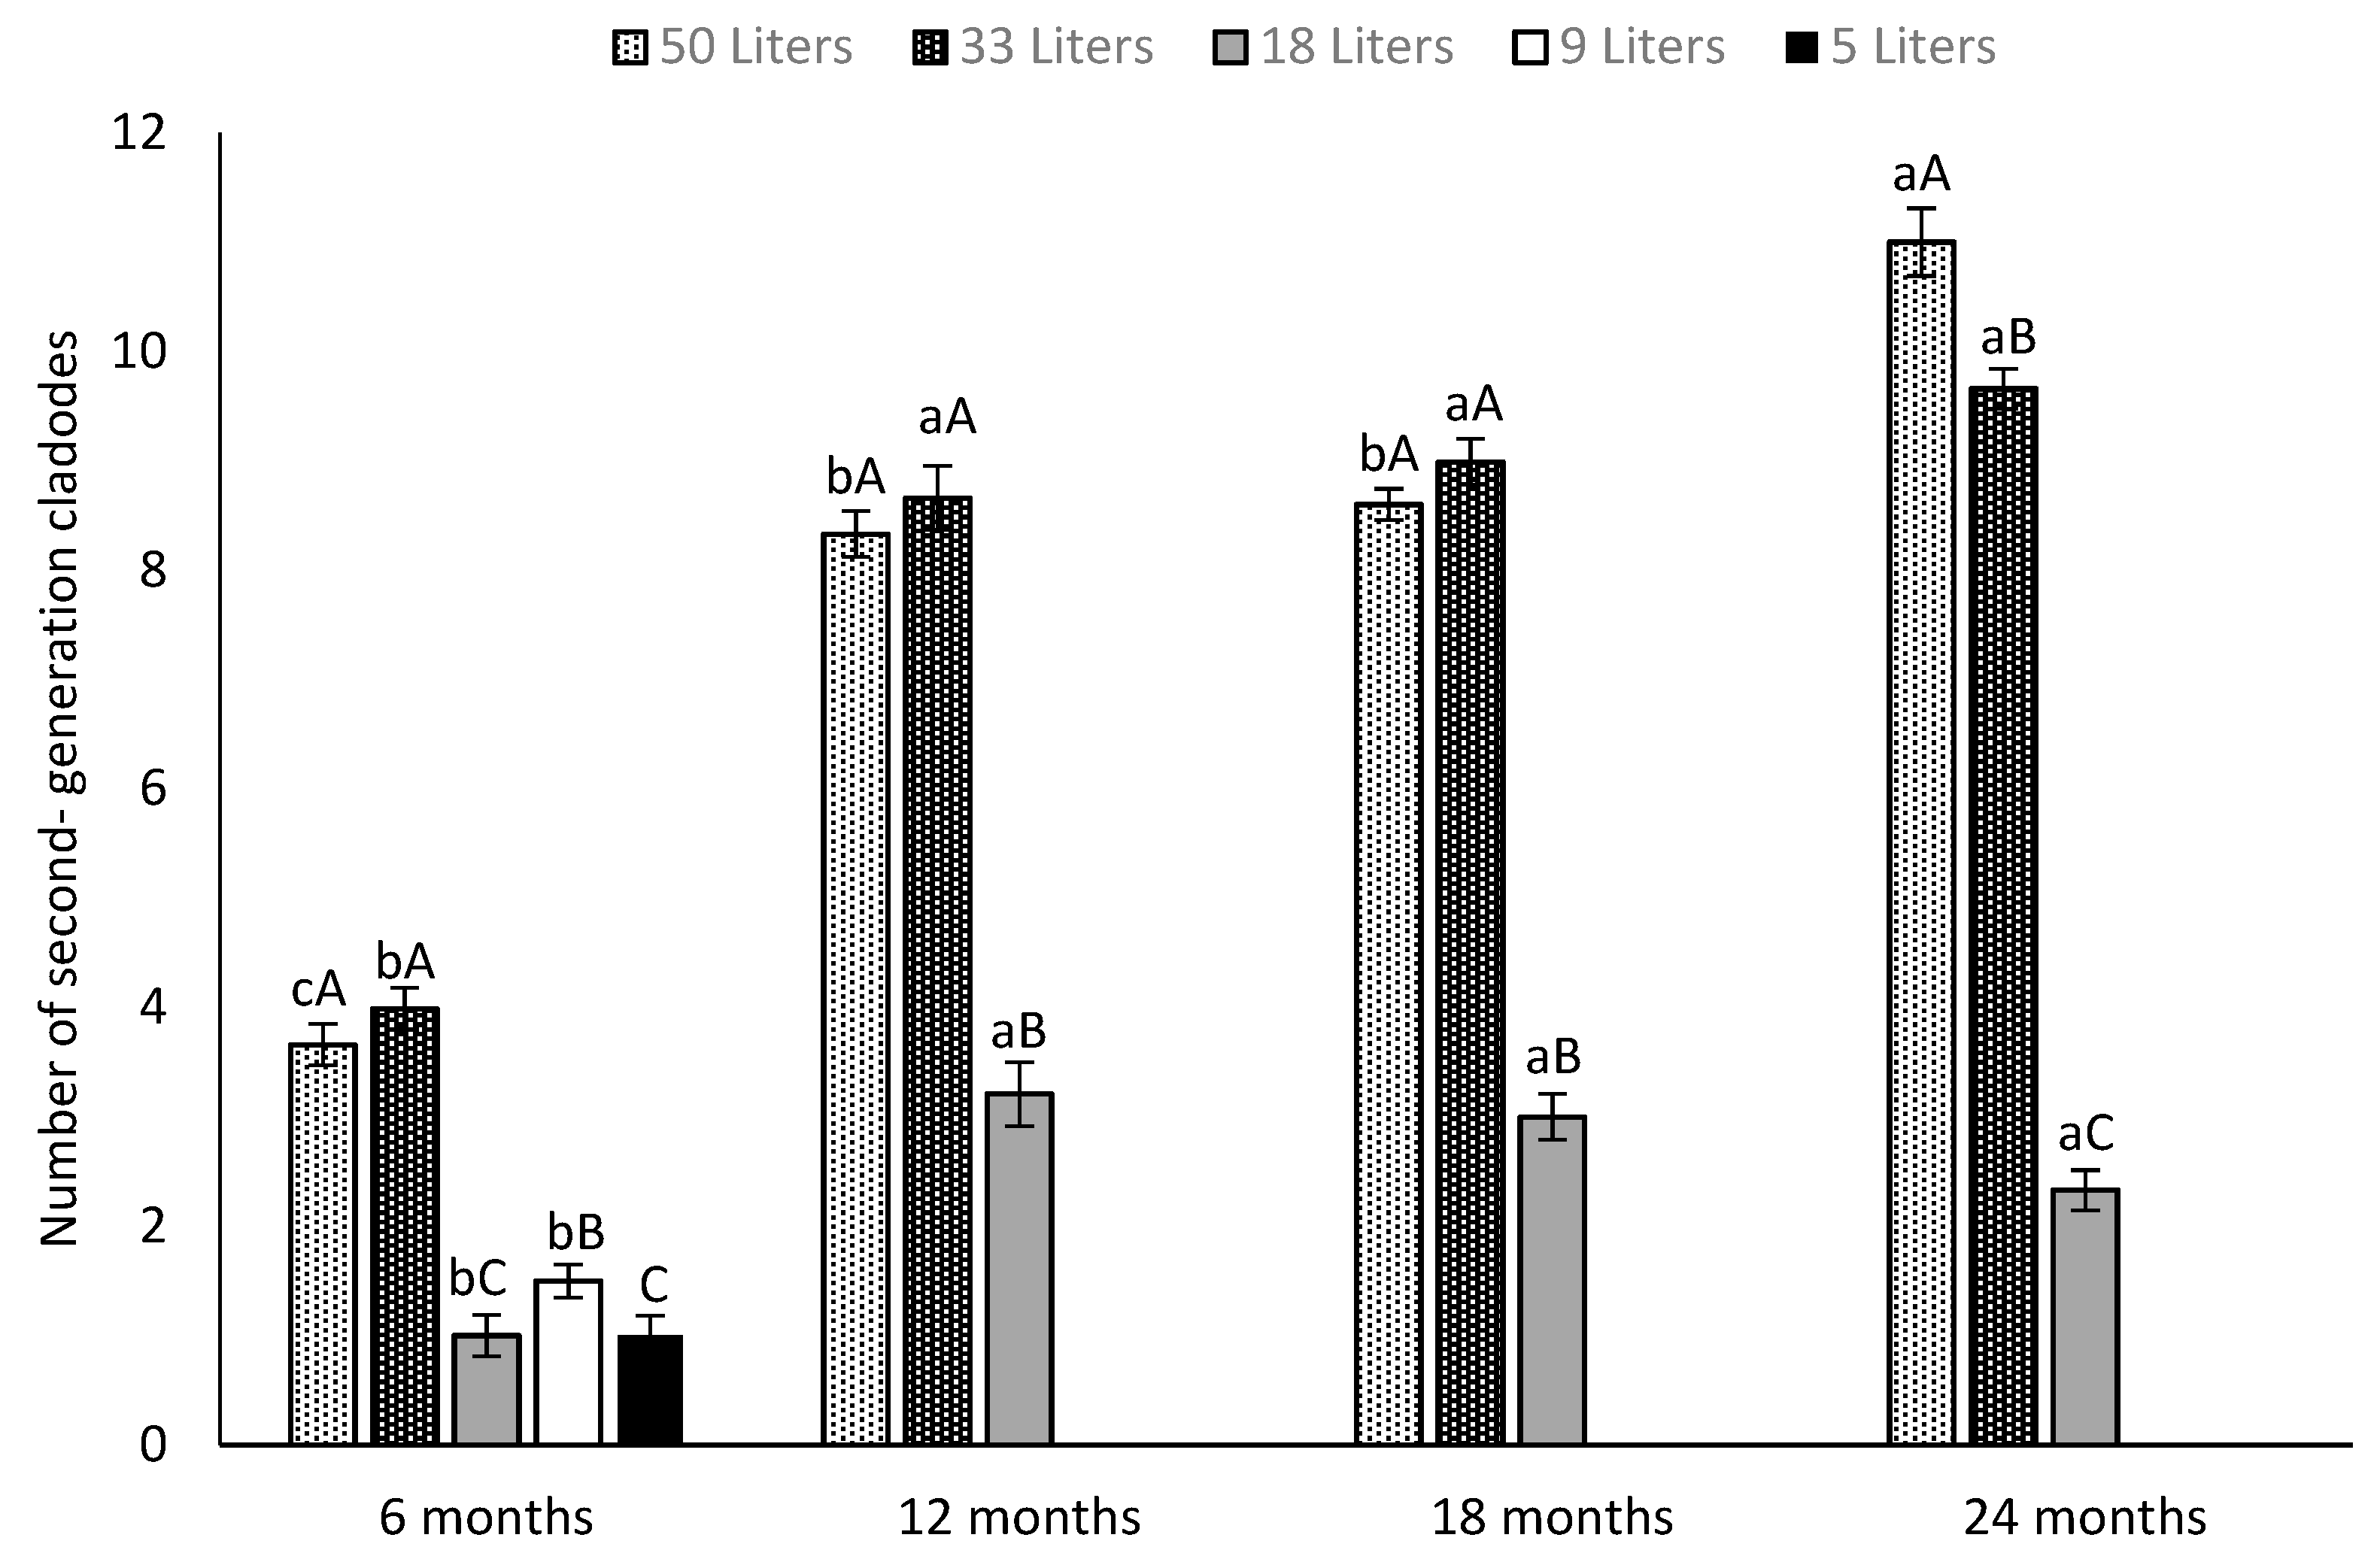
At this stage, 50 and 33 L pots had the highest number of new growths, and no differences occurred in smaller, 18, 9 and 5 L, soil volume pots (Figure 3). Plants placed in the smaller soil volumes (5 and 9 L) did not produce any 2nd generation cladode after the first sampling date. This resulted in a final (24 months after planting) number of 2nd generation cladodes which was 10–11 times lower than in the largest soil volumes (33 and 50 L), and only half of that in the 18 L soil volume pots. Plants placed in 18 and 33 L pots doubled the number of 2nd generation cladodes from 6 to 12 months after planting, with no further growth afterward. However, significant differences between the two largest soil volumes (50 and 33 L) in terms of the 2nd generation cladodes number were recorded only on the last sampling date (24 months) (Figure 4), when the number of 2nd generation cladodes in 18 L pots was more than four times lower than in the 50 and 33 L ones (Figure 4). The highest number of 2nd generation cladodes was recorded in plants placed in the largest soil volume (50 L) 24 months after planting; at this stage, the number of 2nd generation cladodes was three times higher than at 6 months after planting (Figure 4).
On the whole, the combined production of new cladodes indicated that the largest growth, in terms of new cladodes, occurred only during the first six months after planting in plants grown in 5 L pots, while plants grown in 9 L pots had a further growth only in terms of 1st generation cladodes, which lasted until 12 months after planting (Figure 4). Larger soil volumes resulted in an increase of both the 1st and 2nd cladodes number during the first 12 months after planting. From then onwards, only plants grown in the largest, 33 and 50 L, pots showed a further growth, but with the highest number of both 1st and 2nd generation cladodes produced in the largest, 50 L, soil volume pot (Figure 4). Eventually, the number of new cladodes produced was the highest in the largest, 50 L, pot and the lowest in the smallest, 5 L, one, at any sampling date. A significant difference between the other treatments (33 L vs. 18 and 9 L soil volume) occurred at any sampling time, as well (Figure 2). The plant canopy reached its maximum surface area (data not shown) 12 months after planting, with no further growth, consistent with the cladode number. The largest canopy surface area, 9300 cm2, was measured in 50 L potted plants and was, respectively, 7.1-, 4.5-, 2.0- and 1.3-folds higher than for 5 L, 9 L, 18 L and 33 L potted plants.

3.2. Canopy Dry Mass

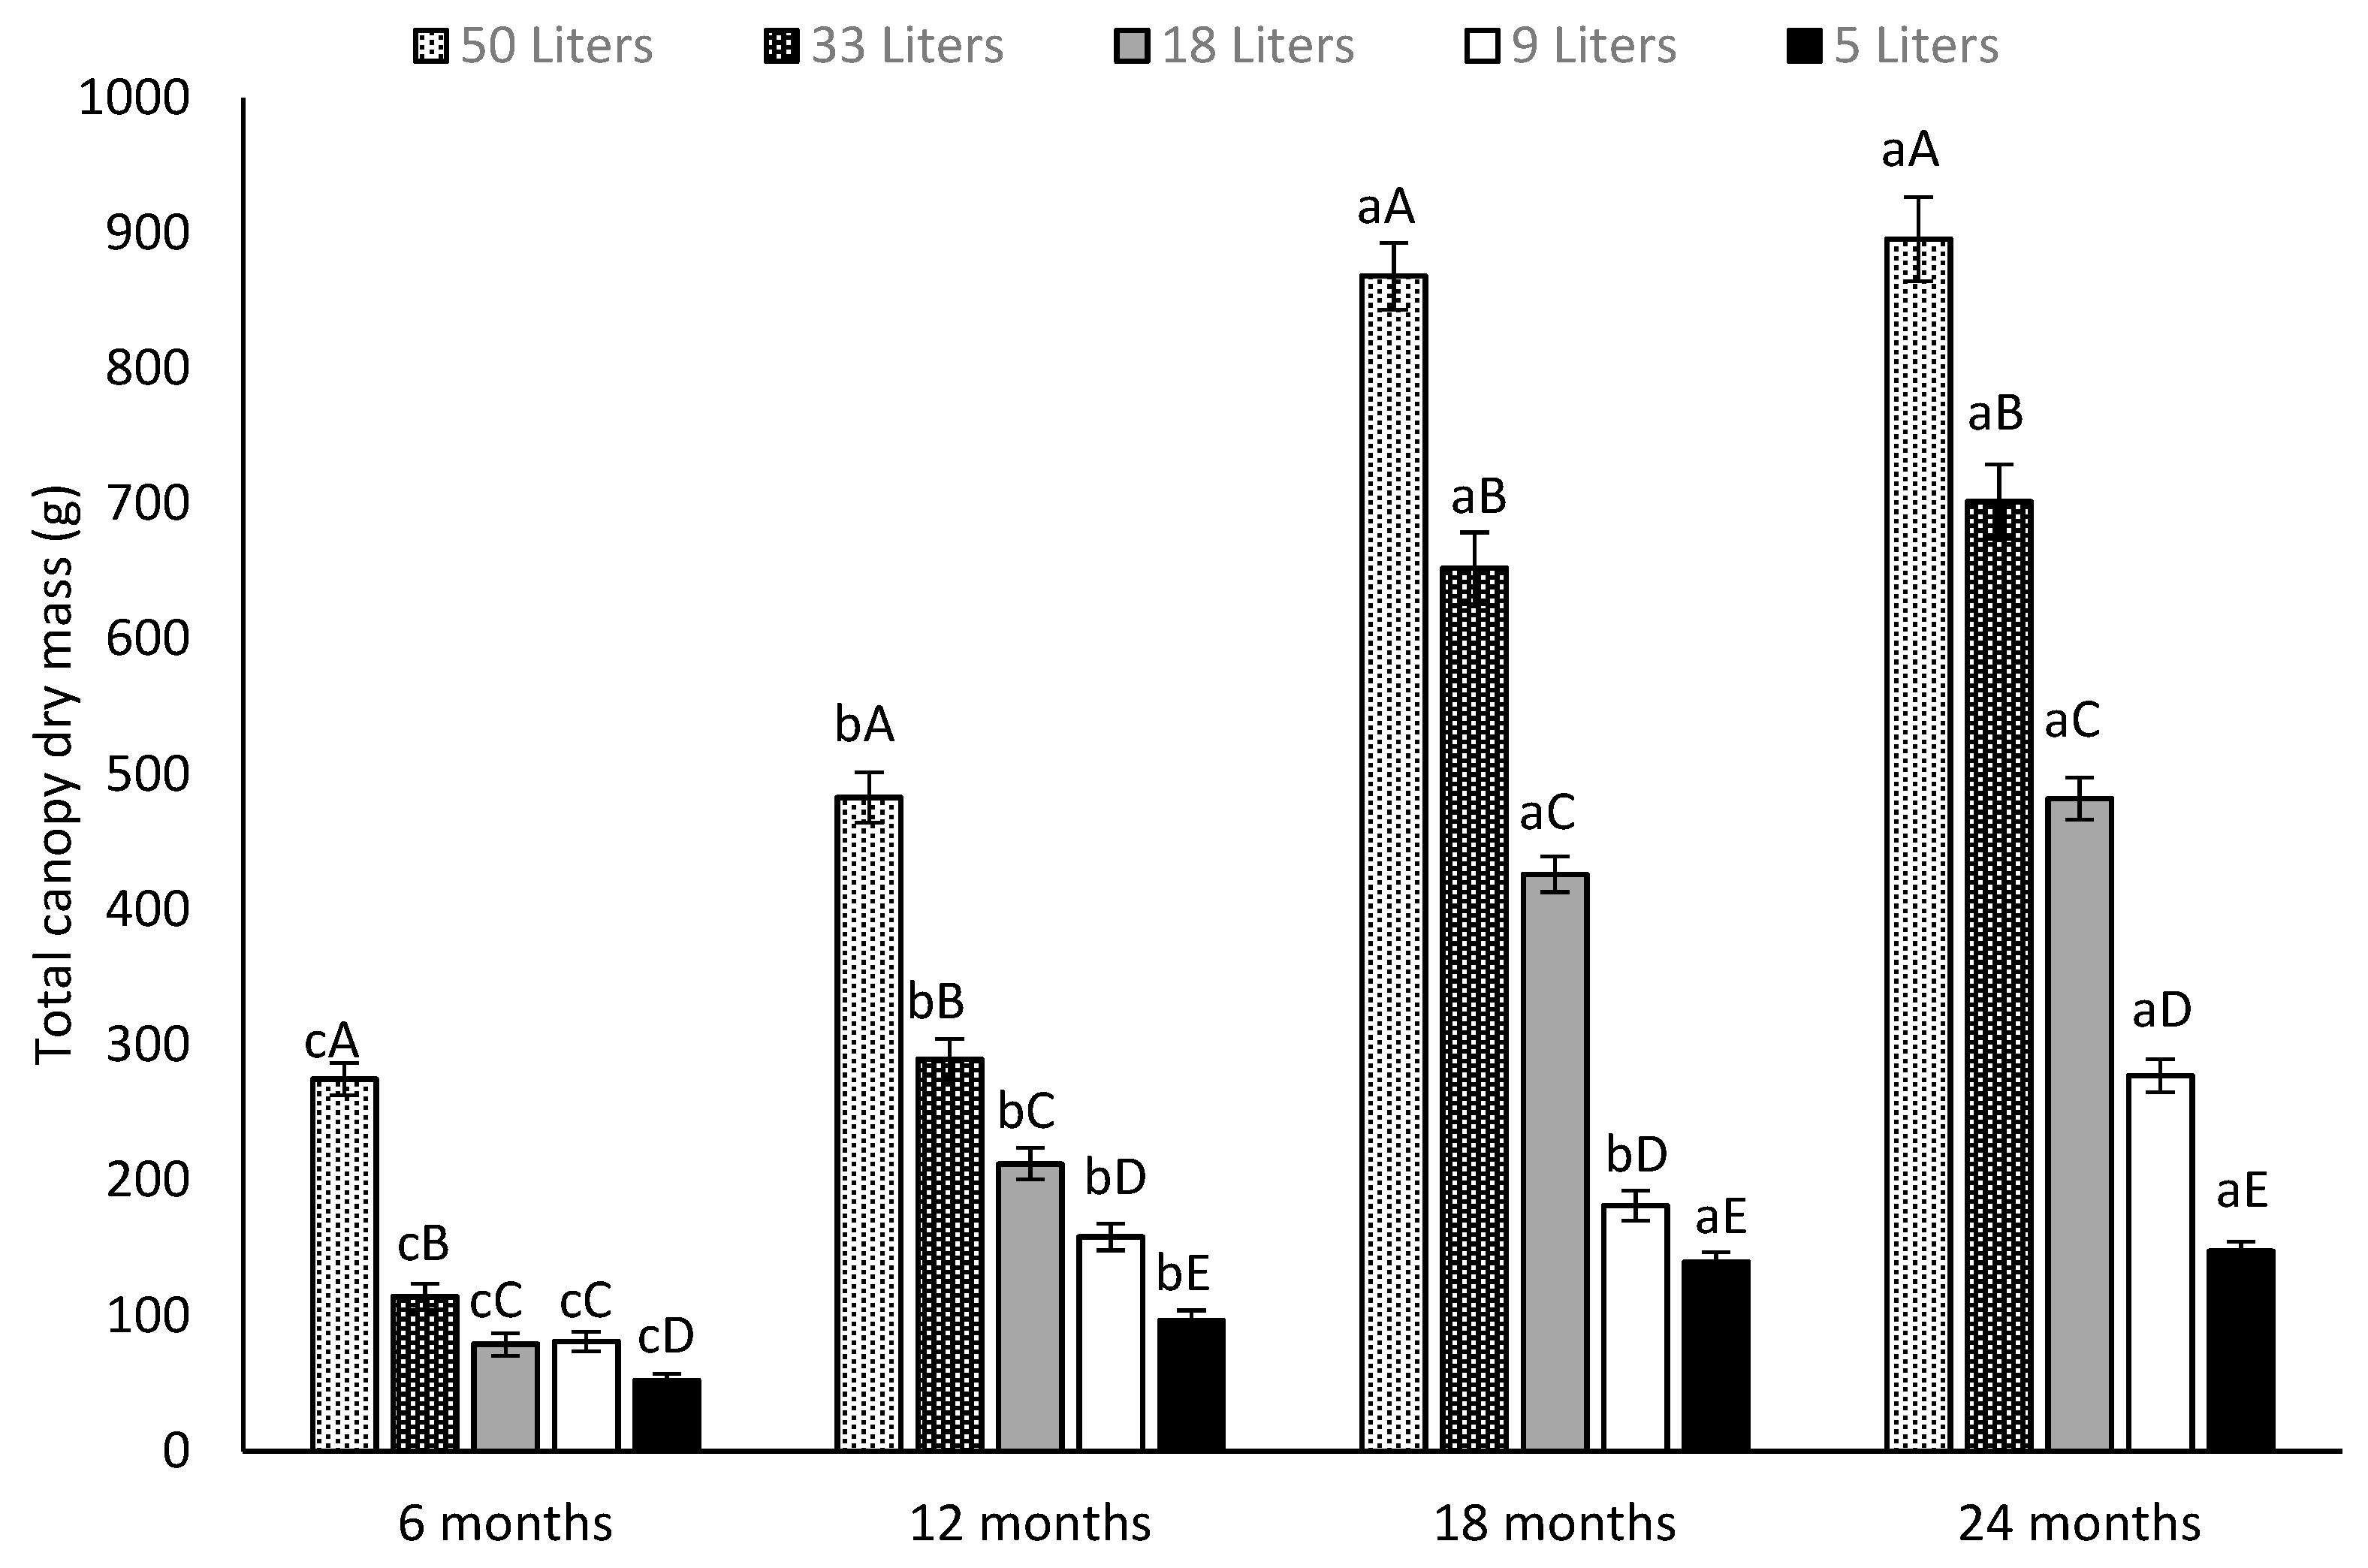
The canopy dry mass (Figure 5) increased over time, and the significantly highest absolute values were recorded 18 and 24 months after planting for 50 L, 33 L, 18 L and 5 L potted plants, whilst 9 L potted plants showed the highest values 24 months after planting. Soil volume had a significant effect on the canopy dry mass at each sampling date, as well as in terms of the relative dry mass accumulation (Figure 5). Indeed, plants placed in the highest soil volume (50 L) always showed the highest dry mass value, whilst plant placed in the lowest soil volume (5 L) showed the lowest one. Considering the different soil volumes, 50 L potted plants showed the highest dry mass growth rate during the first 12 months after planting, but the highest growth rate in terms of dry mass occurred from 12 to 18 months after planting. At this stage, plants grown in 50 L, 33 L and 18 L almost doubled their dry mass (Figure 5). No differences in the dry mass growth rate over the sampling dates occurred in plants grown in 9 L and 5 L pots, and the latter had the lowest growth rate out of all the sampling dates (Figure 5). This is consistent with the lack of new cladodes being produced in 9 L and 5 L potted plants from 12 months after planting onwards (Figure 4). 33 L and 18 L potted plants showed the highest absolute dry mass gain (6.1 times more), whilst 5 L showed the lowest one (2.8 times more) from the first to the last sampling date (Figure 5).
Several studies reported that pot size effects start when the total plant biomass in the soil volume ratio (g L−1) (BVR) exceeds 2 g L−1 [30,31]. In our experiment, the BVR values for all the treatments in the four sampling dates were more than 2 g L−1 (data not shown). Indeed, the BVR values ranged from the lowest value of 3.1 g L−1 in the 33 L pot size at the first sampling date to 28.0 g L−1 in 5 L and 9 L pot sizes at the last sampling date. Plants grown in 9 L and 5 L soil volumes showed the highest BVR values at each sampling date, until the end of the experiment, while plants grown in 50 L and 33 L showed the lowest (data not shown).

3.3. Roots Measurements

3.3.1. Root Surface Area

The large (roots with diameter >5 mm), medium (roots with diameter between 2 and 5 mm) and total root surface area significantly changed with the soil volume and sampling date, while the fine roots surface area was affected significantly only by the soil volume (Table 1).
Roots of the plants grown in the 50 L pots showed a higher surface area than that observed by the plants in 5 L ones. Plants grown in 50 L and 33 L showed the highest increase from the first to the last sampling date in each root category (fine, medium and large) (Table 1). During the first six months, no significant differences between 50 L and 33 L soil volumes occurred in terms of the fine, medium and total root surface area, while the large root surface area was significantly different (Table 1). Plants grown in 18 L and 9 L soil volumes showed significant differences for all sampling dates in terms of the fine, large and total root surface area, while the medium root surface area showed significant differences only in the third and last sampling date (18 and 24 months) (Table 1).
Plants grown in 9 L and 5 L were significantly different for almost all sampling dates in terms of the fine, medium, large and total root surface area; only in the first six months were there no significant differences in terms of the large root surface area (Table 1). The total root surface area in the 50 liters soil volume doubled over the time of the experiment, while a lower increase occurred in 33 L, 18 L and 5 L soil volumes (1.4, 1.4 and 1.2 times, respectively) (Table 1). Plants grown in a 5 L soil volume showed a decrease from the second to the last sampling date (12 and 24 months) and from the third to the last sampling date (18 and 4 months) in terms of the total root surface area, while the total root surface area in plants grown in a 9 L soil volume did not show any increase from the first to the last sampling date (Table 1). The surface area of large roots increased during the experiment regardless of the soil volume, showing increments of 9.3, 11.6, 7.4, 7.0 and 4.4 times, respectively, from the first to the last sampling date, in 50 L, 33 L, 18 L, 9 L and 5 L pots (Table 1).
At the beginning of the experiment, the fine root surface area averaged 74% of the total root surface area, the medium root surface area averaged 23% of the total root surface area and the large root surface area averaged 3% of the total root surface area (Table 1). The incidence of the fine root surface area has decreased by 21% from 6 to 24 months after planting, averaging all soil volumes. Meanwhile, the medium and large root surface areas increased by 8% and 13%, respectively, from 6 to 24 months after planting, in all soil volumes (Table 1).

3.3.2. Total Root Volume and Root Density

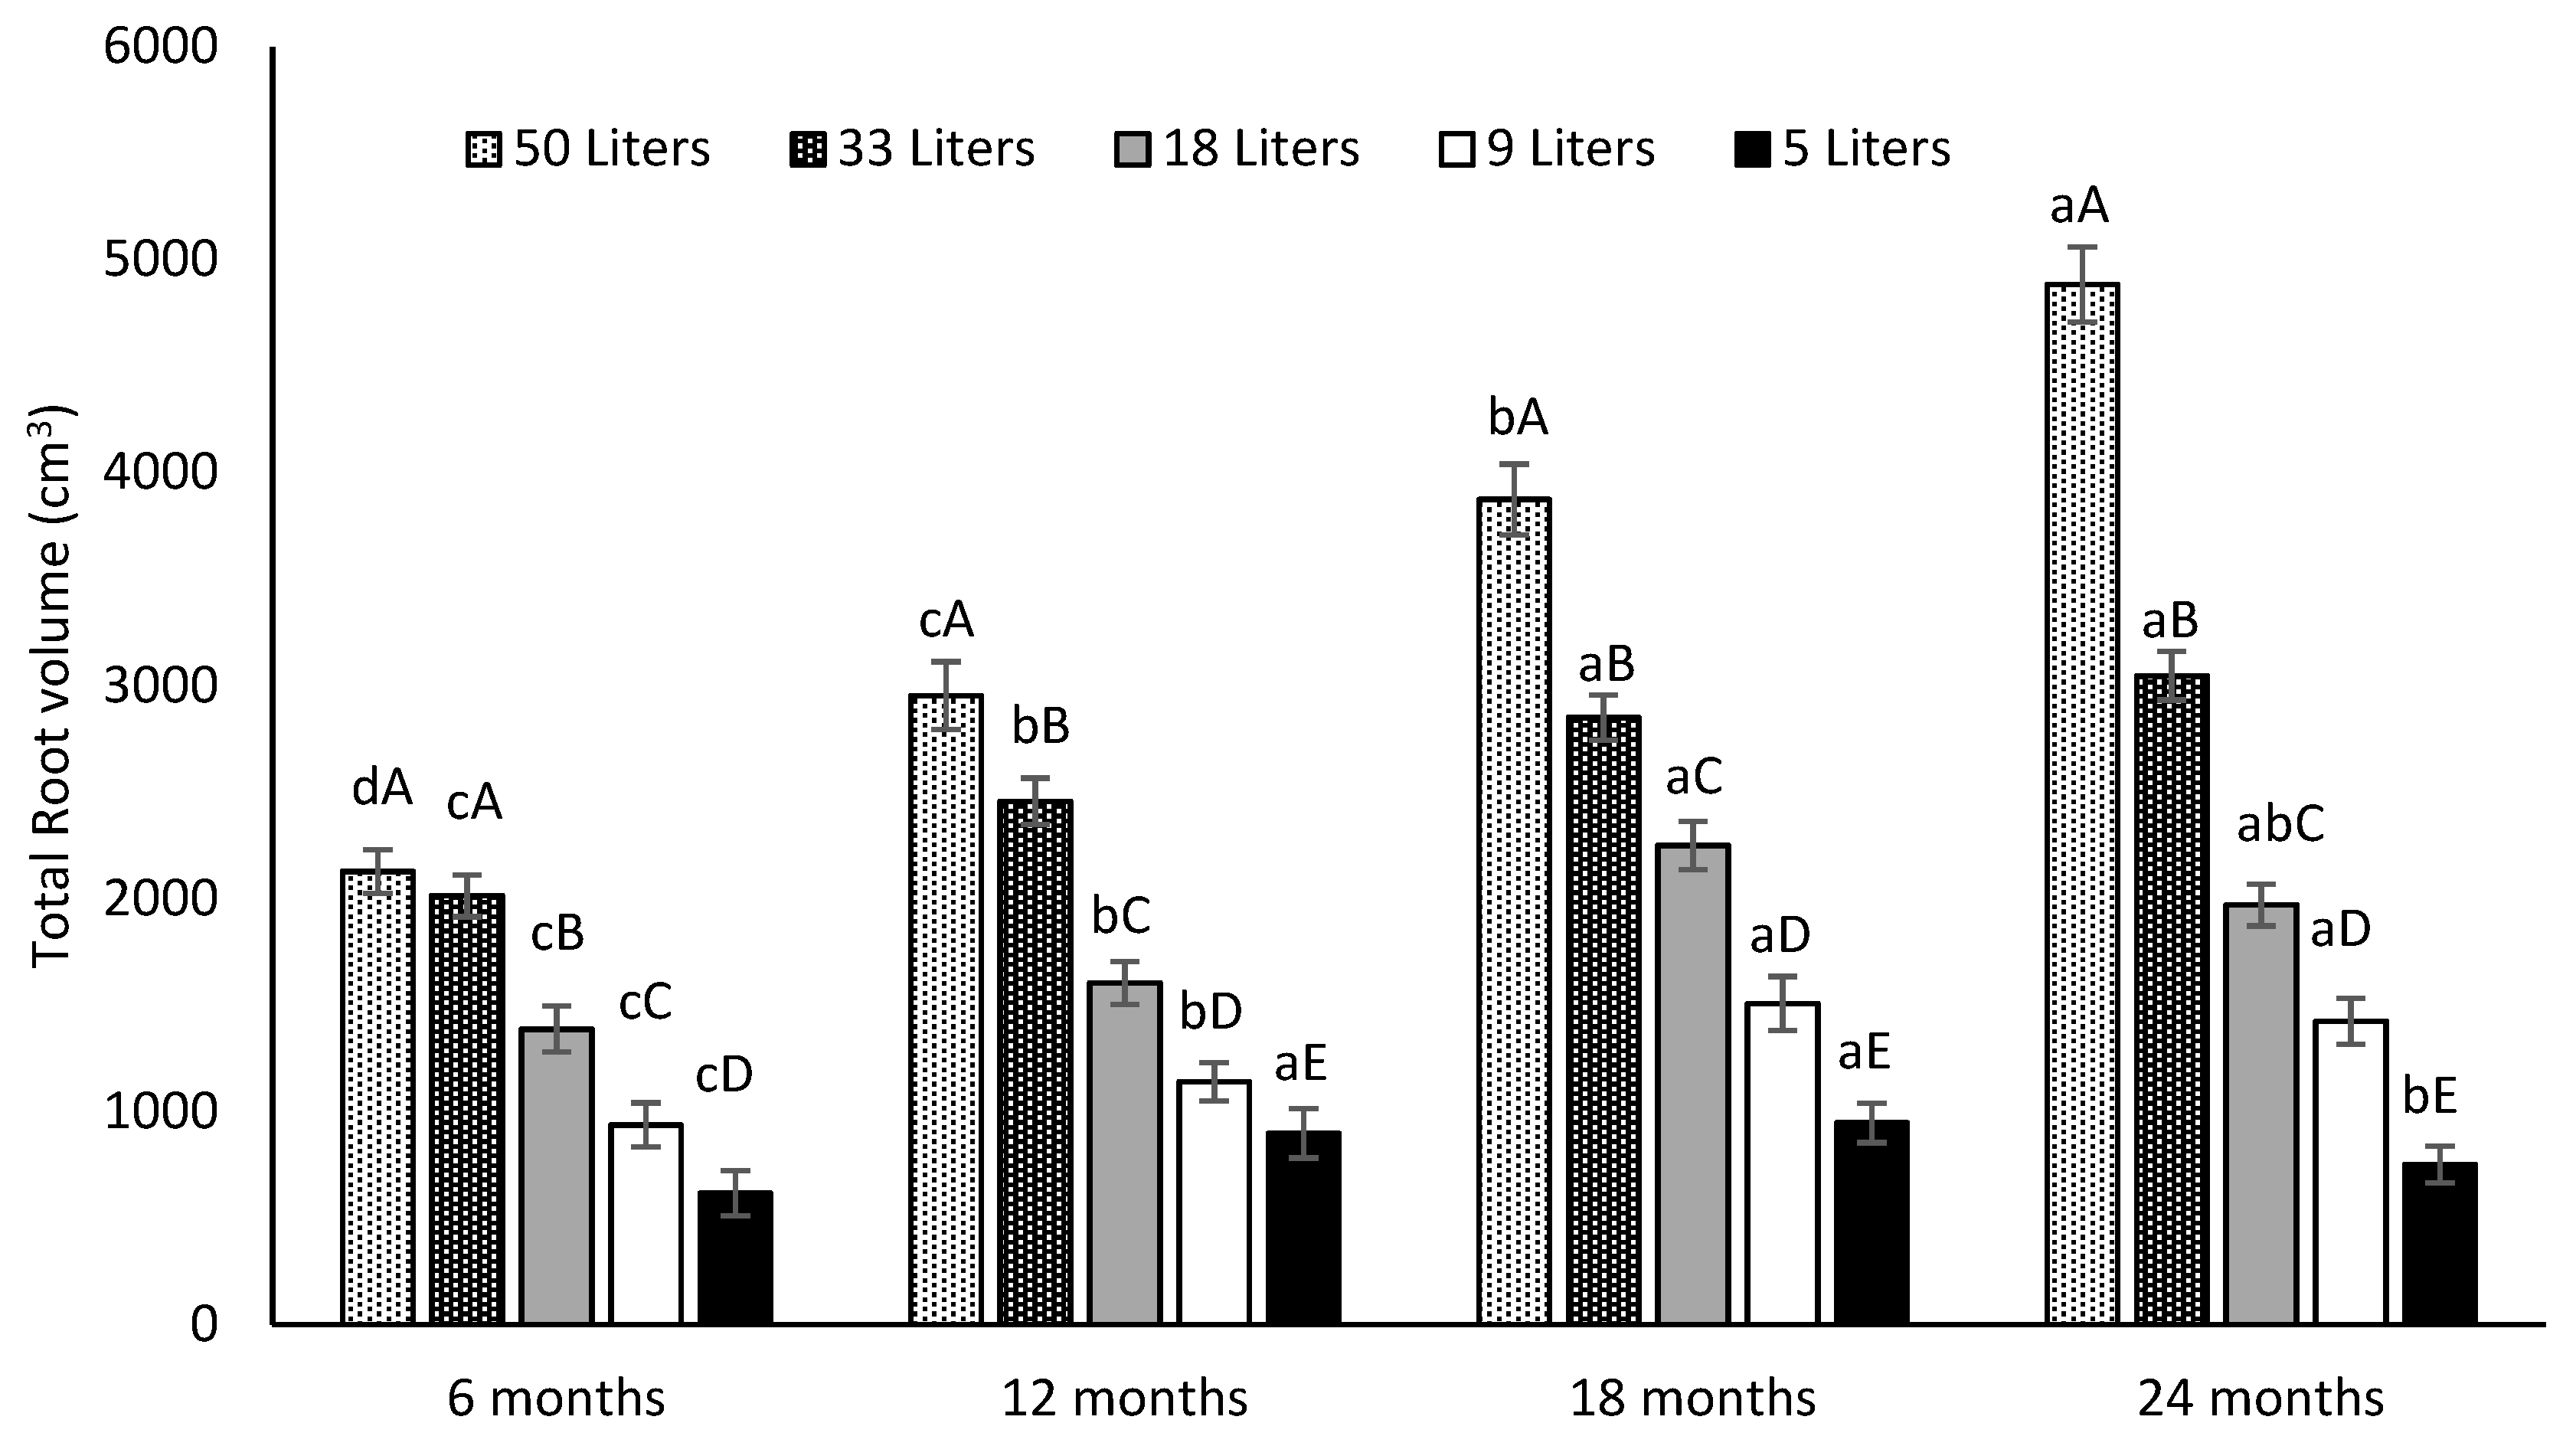
The total root volume was significantly related to the soil volume on all sampling dates, but six months after planting for 50 L and 33 L pots (Figure 6). A significant increase in root volume occurred from the first to the last sampling date in plants grown in 50 L; at this stage, the root volume was 2.3 times higher than at the first sampling date. In 33 L, 18 L and 9 L pots, the root system reached its maximum volume 18 months after planting when the root volume was 1.5 times higher than at six months after planting (Figure 6). In the smallest 5 L pot, the root volume reached its maximum size 12 months after planting and showed a significant decrease at the last sampling date (Figure 6).
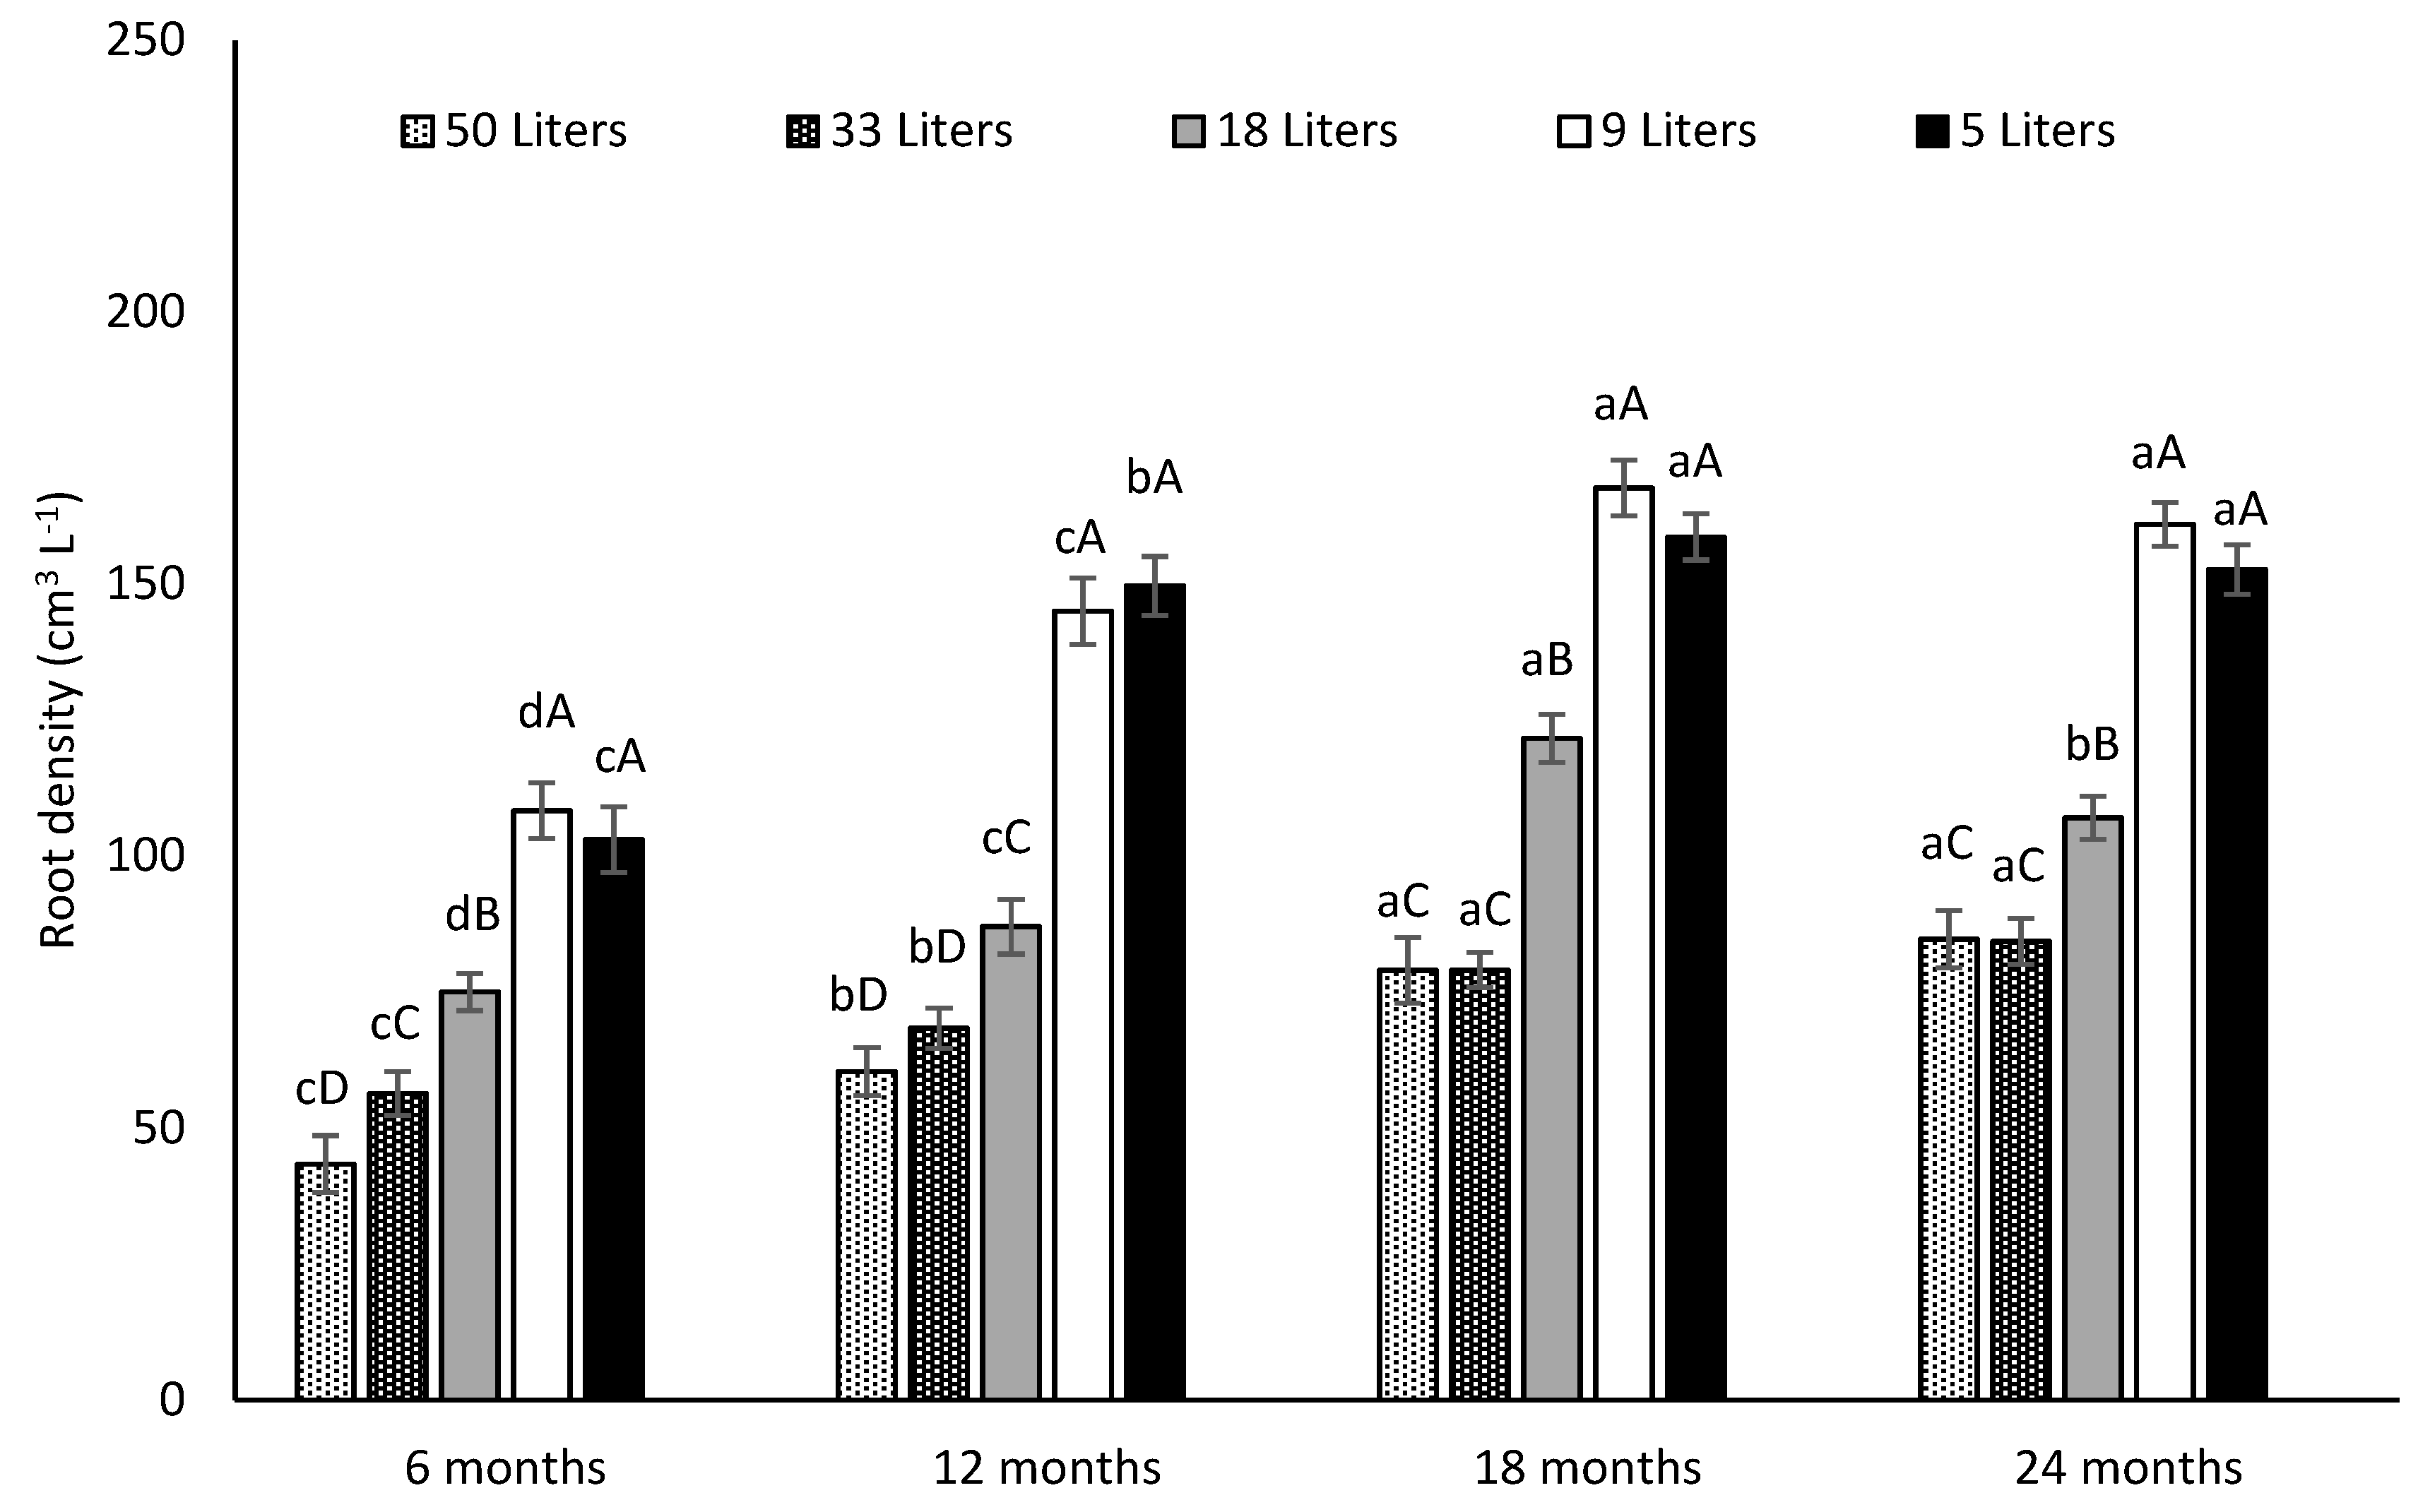
On the other hand, the highest root density was always measured in the smallest, 9 L and 5 L, pots, and the lowest one was measured in the largest, 50 L and 33 L, ones (Figure 7). The highest root density was measured at 18 months after planting in all treatments (Figure 7).

3.4. Root/Canopy Ratios

The root mass/canopy ratio (dry mass-based) was the largest six months after planting in all soil volumes, indicating a faster development of the root system when compared to the canopy. On the whole, the root mass/canopy ratio decreased by 45% and 65%, respectively, 12 months and 18–24 months after planting. No significant effect of the soil volume occurred 18 and 24 months after planting. The largest, significant differences among treatments occurred only 6–12 months after planting when the soil volume deeply affected both the canopy and root growth (Table 2).

3.5. Canopy and Cladodes Starch Content

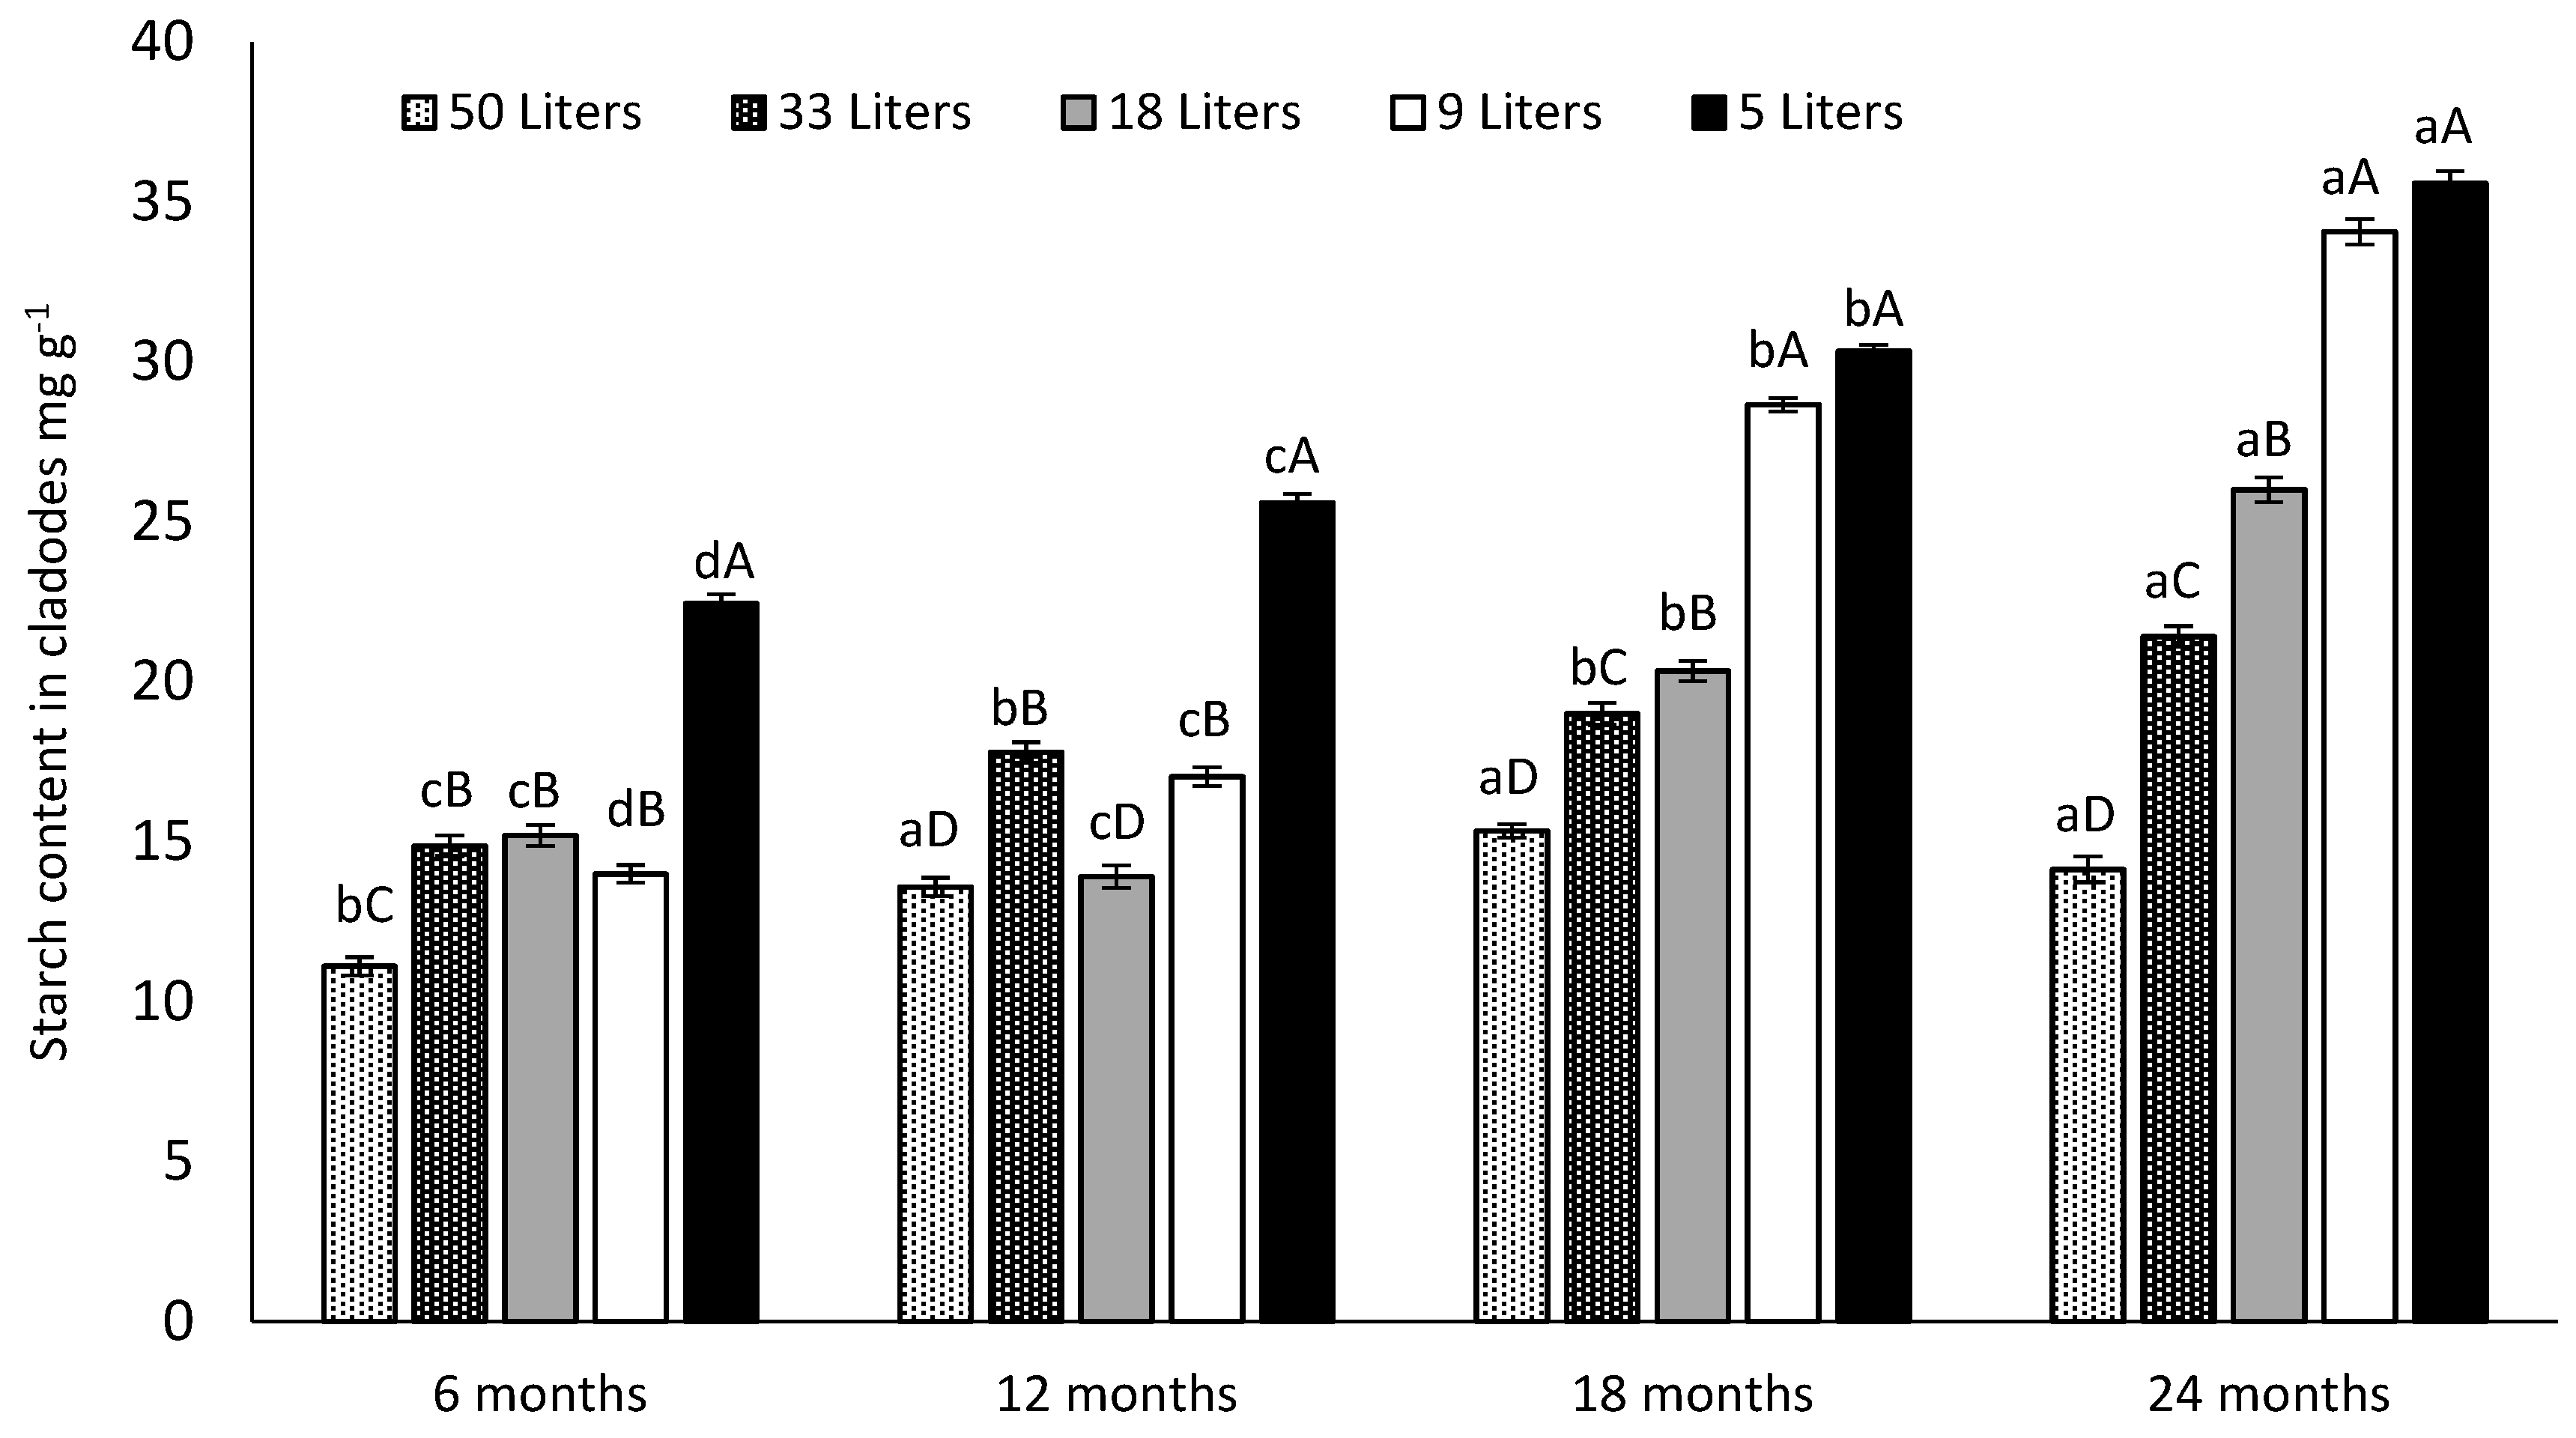
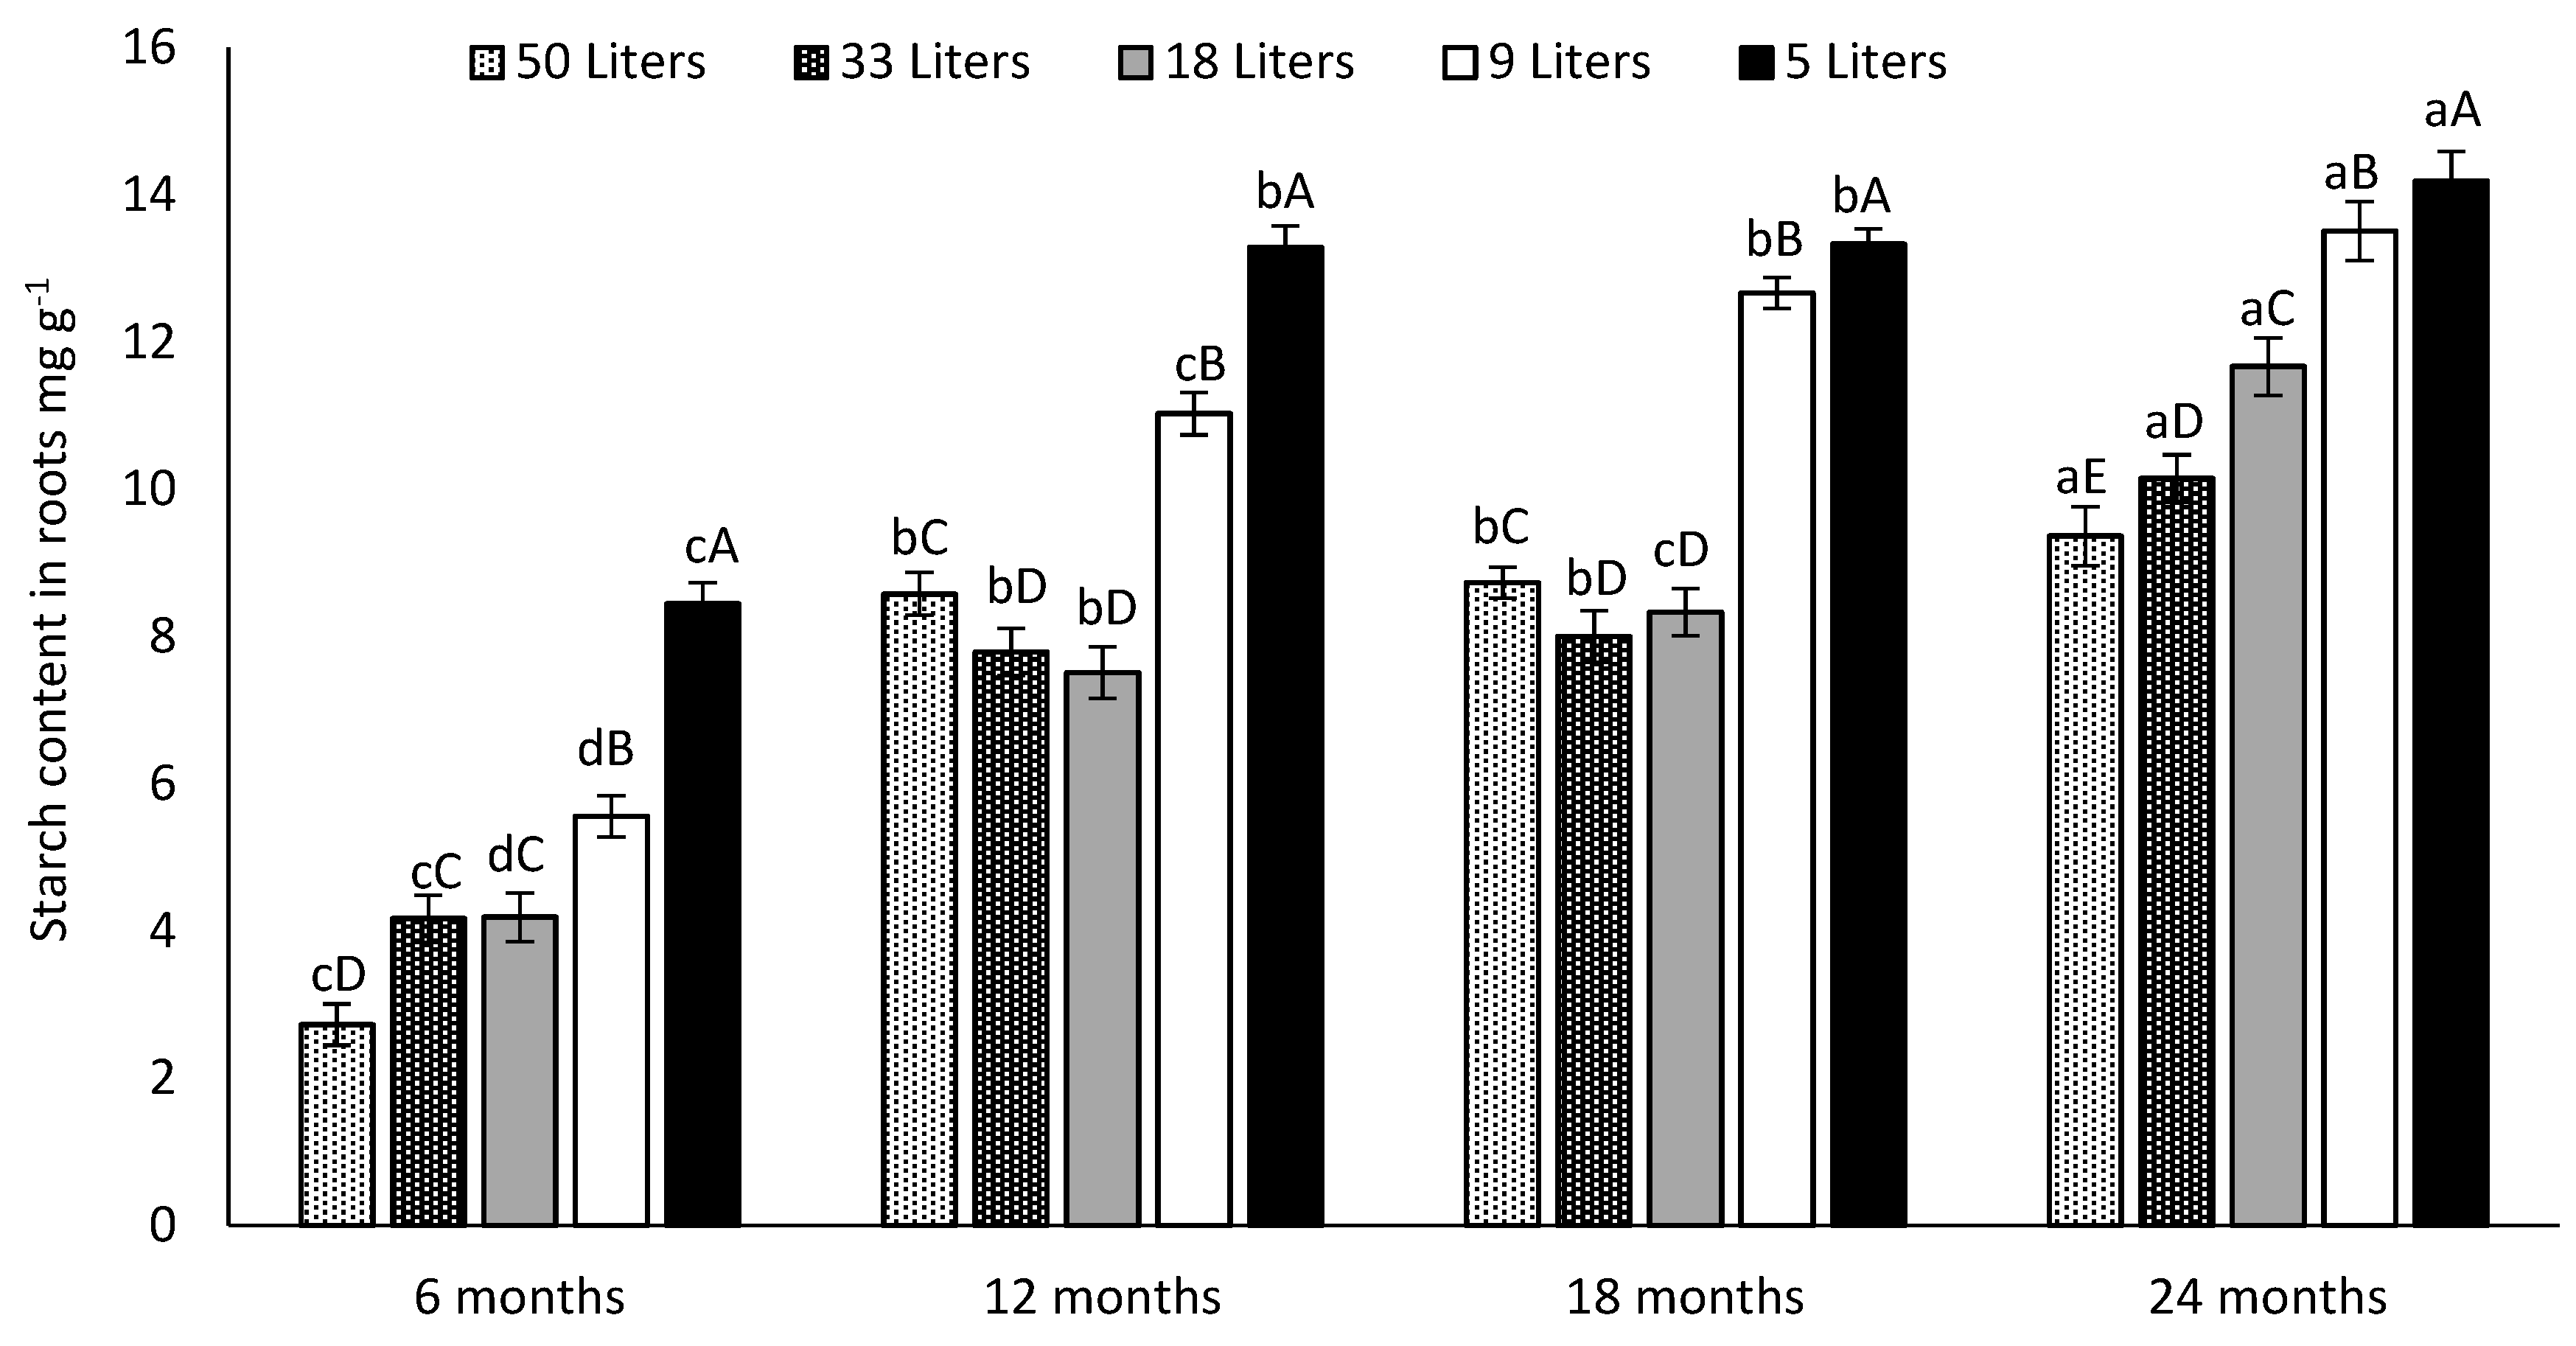
The starch content changed with the soil volume and sampling date. The highest starch content was measured, at any sampling date, in the cladodes and roots of cactus pear plants grown in the lowest soil volume (5 L). The starch content in cladodes was the lowest, at any sampling date, in plants grown in the largest soil volume (50 L). The starch content in cladodes and roots increased, over time, from 6 to 24 months after planting, in all soil volumes except for the cladodes of plants grown in a 50 L soil volume, for which the starch reached the highest level already 12 months after planting (Figure 8 and Figure 9). Eventually, the starch content was much higher in the cladodes than in the roots at any sampling date in all soil volumes. During the whole period, from 6 to 24 months after planting, the starch content in the cladodes and roots of cactus pear plants grown in a 5 L soil volume was twice as much as in the largest, 50 L, soil volume.

4. Discussion

The common thought is that cactus pear need low inputs to give high yields. However, this statement is not entirely true, despite the fact that cactus pear can survive where many other crops cannot. Therefore, the importance of appropriate inputs regarding soil volume, water, light and temperature are vital to get a high yield or at least to understand the performance of this plant under any of the previous factors’ limitations. Plants in the smallest soil volume stopped producing new second-generation cladodes six months after planting. At this stage, cactus pear plants grown in the smallest soil volume (5 L) had already accumulated the highest starch content in the cladodes and in the roots, indicating an apparently different allocation of resources than in plants with a larger soil volume availability that dedicated their resources to vegetative and root growth (fresh and dry biomass and root surface area) rather than to starch accumulation.
Dry matter partitioning between the root system and the canopy (vegetative growth) indicated different plant behavior in relation to different soil volumes from 6 to 12 months after planting, while showing a similar behavior from 18 to 24 months after planting (Table 2). It is relevant to consider that we planted similar cuttings, with no roots, and our data indicate that soil volume availability became critical very soon after planting. Indeed, six months after planting we had clear effects on the canopy and root growth as well as on the starch content in above-ground and below-ground components and in the root vs. canopy ratio. This means that the soil volume effect should have appeared at the earliest stages of the plant growth, when a minimum root volume growth is essential to allow a regular canopy growth. Root vs. canopy ratios in O. ficus-indica may, indeed, greatly change according to plant age, soil volume and water resources.
Nobel [32] reports a 0.12 root/canopy ratio (g g−1 DW) on adult trees, while Inglese et al. [16] report 0.25 (g g−1 DW) and 0.48 in terms of the root/canopy surface area (g DW m−2) measured on 15-year-old trees. This underlines the relevance of planting methods and systems and of soil care in commercial plantations. Indeed, young cuttings often show a large variability in plant development and fruiting precocity at the earliest stages of the orchard development and this could be related to differences in soil care and soil type at the planting site which may account for discrepancies in the root development and, thus, in plant growth [33].
The canopy dry mass ranged between 52–895 g plant−1 from the smallest to the largest soil volume availability, and indeed the canopy dry mass increased linearly with the soil volume. This agrees with Nobel [32]. Plants grown in 50 L, 33 L and 18 L almost doubled their dry mass from 12 to 18 months after planting, which does not depend on an increase in the cladode number during this period but is likely to be related to an increase of the cladode weight, which usually occurs when cladodes have reached their maximum surface area [34]. The soil volume increment led to an increase in the root surface area and canopy surface area as well, which could lead to a greater water and nutrients uptake that would enhance the canopy growth and development [33].
A restricted soil volume had limiting effects on the overall plant growth and influenced plant development. Root system growth was inhibited by soil volume restriction: the total root length, surface area, dry mass and volume were affected and decreased due to this restriction. This is consistent with previous studies for several plant species growing under restriction of rooting space [35,36,37]. Previous reports explained this reduction in the root system as a result of a lower resources supply like nutrient acquisition [31], low carbohydrate resources [38] and a soil temperature increase due to a small pot size [35].
The influence of the soil volume restriction on the root growth seems to change over time. In this study, this influence became relevant six months after planting and increased over time in the largest soil volume, in agreement with Endean and Carlson [39]. Nevertheless, the smallest soil volume showed a stable root growth in terms of the total root length, total surface area, total root volume and total dry mass. In contrast, soil volume restriction enhanced root density as well as root length density.
Generally, these two parameters have been used as potential indicators of mineral nutrition [40]. These results agreed with Inglese and Pace, 2000, who claimed a significant increase of the Opuntia ficus-indica root density with a soil volume restriction increase. Under environmental stresses, trees must use an adaptive strategy in order to sustain and increase soil exploration in order to improve nutrition [41].
The large roots were essentially the main roots that developed from the areoles. Generally, these roots are thick and without root hairs [42,43]. The root surface area increased with the soil volume during the experimental period (24 months). The higher root surface area values related to the soil volume increase might be linked to the large root length increase as well as to the thickness [20].
Under our experimental conditions, the bloom (flowering) stage took place in June, which is the end of the rapid shoot growth where the maximum fine root growth was reached (the samplings in spring were made in May 2015 and 2016, that is 12 and 24 months after planting) (data not shown). Previous research has shown that the peak in root growth in trees may occur before the rapid growth of the shoot in the spring, during the vegetative termination stage in the summer or after the shoot stops growing in the fall [44,45]. The fine root surface area was affected by the soil volume restriction. The fine root production was affected positively by the soil volume.
Our data were in agreement with the findings of Nobel et al. [46] regarding the effect of the soil volume on the surface area of the main and lateral roots (medium and fine roots), and with Bauhus and Messier [47] and Rewald et al. [48], who claimed that the length, surface area and volume of the root systems were affected positively with a soil volume increase. Eventually, only few fruit appeared, in the following season, only in plants with the largest soil volume (2017, data not shown), indicating once more the relevance of an appropriate root volume availability to support vegetative and reproductive growth.

5. Conclusions

Based on the simple observation of cactus pear plants not showing any apparent growth, even for years, when grown in a small vase or under a very reduced soil volume availability, we investigated the effect of reduced soil volume availability on plant behavior. The main findings presented in this research study suggest that soil volume restriction can substantially reduce the root and canopy growth of Opuntia ficus-indica, in terms of surface area and dry matter accumulation, as well as total root length and volume. This reduction was associated with a lower cladode number but an increased root turnover.
The soil volume decrease impacted the growth and the surface area of the main roots negatively, while there was an increase in the fine lateral root growth in the soil volume unit, specific root length, root density, as well as root length density. The more lateral roots and finer root system per soil volume of Opuntia ficus-indica seem to be a kind of adaptive strategy in order to enable the plants to sustain and increase the root surface area in order to increase, improve and explore new nutritive resources. Eventually, it seems that cactus pear plants growing in soil volumes lower than a critical point for optimum plant development may shift their resources allocation from vegetative growth to starch accumulation in the cladodes and in the roots, to enhance the root turnover rate.
This conservative behavior may allow the plant to survive, although with no apparent canopy growth and fruiting. This behavior is quite common in rocky and poor soils with a low nutrient availability, which usually reduce cactus pear growth. Considering that under the experimental prevailing conditions cactus pear plants did not suffer any water stress, further experiments are needed to investigate the role of plant nutrition and particularly the role of organic nutrition (manuring) on plant growth and development under conditions of limited soil resources.
Our results confirmed the importance of Opuntia ficus-indica as a potential plant that can survive under a low soil volume. This plant has the ability to balance its growth and stay alive under harsh environments. Eventually, the use of the cactus pear as an ornamental potted plant will also depend on a better understanding of plant management under restricted soil volumes.

Author Contributions

For research articles with several authors, a short paragraph specifying their individual contributions must be provided. The following statements should be used “Conceptualization, P.I. and M.L.; methodology, P.I., G.L., G.S.; software, S.H. and M.L.; validation, S.H. and G.L.; formal analysis, S.H., G.L. and G.S.; investigation, S.H., G.L. and G.S.; resources, S.H., P.I. and M.L.; data curation, P.I., G.S. and G.L.; writing—original draft preparation, P.I., S.H., G.L. and G.S.; writing—review and editing, P.I., G.L. and G.S.; visualization, G.L. and G.S.; supervision, P.I. and M.L.; project administration, M.L.; funding acquisition, S.H., M.L. and P.I. All authors have read and agreed to the published version of the manuscript.

Funding

This research was funded by the International Center for Agricultural Research in the Dry Areas (ICARDA), the Arab Fund for Economic and Social Development (AFSED), the University of Palermo and the CGIAR Research Program on Livestock (CRP Livestock).

Acknowledgments

This work was supported by the International Center for Agricultural Research in the Dry Areas (ICARDA), the Arab Fund for Economic and Social Development (AFSED), the University of Palermo and the CGIAR Research Program on Livestock (CRP Livestock).

Conflicts of Interest

The authors declare no conflict of interest.

References

  1. Faust, M. Physiology of Temperate Zone Fruit Trees; Wiley: New York, NY, USA, 1989. [Google Scholar]
  2. Brouwer, R. Functional equilibrium: Sense or nonsense? Neth. J. Agri. Sci. 1983, 31, 335–348. [Google Scholar]
  3. Bloom, A.J.; Chapin, F.S.; Mooney, H.A. Resource limitation in plants–An economic analogy. Annu. Rev. Ecol. 1985, 16, 363–392. [Google Scholar] [CrossRef]
  4. Shipley, B.; Meziane, D. The balanced-growth hypothesis and the allometry of leaf and root biomass allocation. Funct. Ecol. 2002, 16, 326–331. [Google Scholar] [CrossRef]
  5. Maib, K.M.; Andrews, P.K.; Lang, G.A.; Mullinix, K. (Eds.) Tree Fruit Physiology: Growth and Development; Good Fruit Grower: Yakima, WA, USA, 1996; pp. 69–80. [Google Scholar]
  6. Fernandez, J.E.; Moreno, F.; Martin-Aranda, J.; Fereres, E. Olive-tree root dynamics under different soil water regimes. Agric. Mediterr. 1992, 122, 225–235. [Google Scholar]
  7. Bravdo, B.A.; Levin, I.; Assaf, R. Control of root size and root environment of fruit trees for optimal fruit production. J. Plant Nutr. 1992, 15, 699–712. [Google Scholar] [CrossRef]
  8. Myers, S.C. Root restriction of apple and peach with in-ground fabric containers. Acta Hort. 1992, 322, 215–219. [Google Scholar] [CrossRef]
  9. International Union for Conservation of Nature (IUCN). The Nature of Drylands: Diverse Ecosystems, Diverse Solutions; Eastern and Southern Africa Regional Office: Nairobi, Kenya, 2008. [Google Scholar]
  10. Ferrol, N.; Calvente, R.; Cano, C.; Barea, T.M.; Azcon-Aguilar, C. Analysing arbuscular mycorrhizal fungal diversity in shrub-associated resource islands from a desertification threatened semiarid Mediterranean ecosystem. Appl. Soil Ecol. 2004, 25, 123–133. [Google Scholar] [CrossRef]
  11. Le Houérou, H.N. The role of cacti (Opuntia spp.) in erosion control, land reclamation, rehabilitation and agricultural development in the Mediterranean Basin. J. Arid Environ. 1996, 33, 135–159. [Google Scholar] [CrossRef] [Green Version]
  12. Pimienta-Barrios, E.; Muñoz-Urias, A.; González del Castillo-Aranda, M.E.; Nobel, P.S. Effects of benomyl and drought on the mycorrhizal development and daily net CO2 uptake of a wild plats Opuntia in a rocky semiarid environment. Ann. Bot. 2003, 92, 1–7. [Google Scholar] [CrossRef] [Green Version]
  13. Reyes-Agüero, J.A.; Aguirre-Rivera, J.R.; Hernandez, M.H. Systematic notes and detailed description of Opuntia ficus-indica (L.) MILL. (Cactacea). Agrociencia 2005, 39, 395–408. [Google Scholar]
  14. Hegwood, D.A. Human health discoveries with Opuntia sp. (Prickly pear). Sci. Hortic. 1990, 25, 1515–1516. [Google Scholar] [CrossRef] [Green Version]
  15. Snyman, H.A. Effect of various water applications on root development of Opuntia ficus-indica and O. robusta under greenhouse growth conditions. J. Prof. Assoc. Cactus Dev. 2004, 6, 35–61. [Google Scholar]
  16. Inglese, P.; Inglese, G.; Liguori, G. Fruit productivity and carbon gain of Opuntia ficus-indica (L.) Mill. trees. Isr. J. Plant Sci. 2012, 60, 283–290. [Google Scholar]
  17. Nobel, P.S.; Huang, B. Hydraulic and structural changes for lateral roots of two desert succulents in response to soil drying and rewetting. Int. J. Plant Sci. 1992, 153, S163–S170. [Google Scholar] [CrossRef]
  18. Inglese, P.; Pace, L.S. Root confinement affects canopy growth, dry matter partitioning, carbon assimilation and field behavior of Opuntia ficus-indica potted plants. Acta Hort. 2000, 516, 97–105. [Google Scholar] [CrossRef]
  19. Liguori, G.; Inglese, G.; Pernice, F.; Sortino, G.; Inglese, P. CO2 uptake of Opuntia ficus-indica (L.) Mill. whole trees and single cladodes, in relation to plant water status and cladode age. Ital. J. Agron. 2013, 8, e3. [Google Scholar] [CrossRef] [Green Version]
  20. Hassan, S.; Inglese, P.; Gristina, L.; Liguori, G.; Novara, A.; Louhaichi, M.; Sortino, G. Root growth and soil carbon turnover in Opuntia ficus-indica as affected by soil volume availability. Eur. J. Agron. 2019, 105, 104–110. [Google Scholar] [CrossRef]
  21. Hassid, W.; Neufeld, E. Quantitative determination of starch in plant tissue. In Methods in Carbohydrate Chemistry; Academic Press: New York, NY, USA, 1964; Volume 4, pp. 33–36. [Google Scholar]
  22. Hoffpauir, C. Report on starch in plants. J. Assoc. Off. Anal. Chem. 1959, 39, 423–442. [Google Scholar]
  23. McCready, R.; Guggolz, J.; Silviera, V.; Owens, H. Determination of starch and amylose in vegetables, application to peas. Anal. Chem. 1950, 22, 1156–1158. [Google Scholar] [CrossRef]
  24. Yemm, E.; Willis, A. The estimation of carbohydrates in plant extracts by anthrone. Biochem. J. 1954, 57, 508–514. [Google Scholar] [CrossRef] [Green Version]
  25. Viles, F.; Silverman, L. Determination of starch and cellulose with anthrone. Anal. Chem. 1949, 21, 950–953. [Google Scholar] [CrossRef]
  26. Louhaichi, M.; Johnson, M.D.; Woerz, A.L.; Jasra, A.W.; Johnson, D.E. Digital charting technique for monitoring rangeland vegetation cover at local scale. Int. J. Agric. Biol. 2010, 12, 406–410. [Google Scholar]
  27. Louhaichi, M.; Clifton, K.; Hassan, S.; Johnson, D.E. A reliable and non-destructive method for estimating forage shrub cover and biomass in arid environments using digital vegetation charting technique. Agrofor. Syst. 2018, 92, 1341–1352. [Google Scholar] [CrossRef] [Green Version]
  28. Louhaichi, M.; Hassan, S.; Johnson, D.E. VegMeasure. Volume 2: Image Processing Manual; ICARDA: Amman, Jordan, 2018; p. 28. [Google Scholar]
  29. Congalton, R.G. A review of assessing the accuracy of classification of remotely sensed data. Remote. Sens Environ. 1991, 37, 35–46. [Google Scholar] [CrossRef]
  30. Poorter, H.; Niklas, K.J.; Reich, P.B.; Oleksyn, J.; Poot, P.; Mommer, L. Biomass allocation to leaves, stems and roots: Meta-analyses of interspecific variation and environmental control. New Phytol. 2012, 193, 30–50. [Google Scholar] [CrossRef]
  31. Poorter, H.; Bühler, J.; Van Dusschoten, D.; Climent, J.; Postma, J.A. Pot size matters: A meta-analysis of the effects of rooting volume on plant growth. Funct. Plant Biol. 2012, 39, 839. [Google Scholar] [CrossRef] [Green Version]
  32. Nobel, P.S. Environmental Biology of Agaves and Cacti; Cambridge University Press: Cambidge, NY, USA, 1988; p. 270. [Google Scholar]
  33. Potgieter, J.; D’Aquino, S. Fruit production and psot-harvest management. In Crop Ecology, Cultivation and Uses of Cactus Pear; Inglese, P., Ed.; Food and Agriculture Organization of the United Nations: Rome, Italy, 2017; pp. 51–72. [Google Scholar]
  34. Inglese, P.; Barbera, G.; La Mantia, T. Seasonal reproductive and vegetative growth patterns and resource al-location during cactus pear Opuntia ficus-indica (L.) Mill. Fruit growth. HortScience 1999, 34, 69–72. [Google Scholar] [CrossRef] [Green Version]
  35. Hess, L.; De Kroon, H. Effects of rooting volume and nutrient availability as an alternative explanation for root self/non-self-discrimination. J. Ecol. 2007, 95, 241–251. [Google Scholar] [CrossRef]
  36. Ronchi, C.P.; DaMatta, F.M.; Batista, K.D.; Moraes, G.; Loureiro, M.E.; Ducatti, C. Growth and photosynthetic down-regulation in Coffea arabica in response to restricted root volume. Funct. Plant Biol. 2006, 33, 1013–1023. [Google Scholar] [CrossRef]
  37. Zhu, L.N.; Wang, S.P.; Yang, T.Y.; Zhang, C.X.; Xu, W.P. Vine growth and nitrogen metabolism of ‘Fujiminori’ grapevines in response to root restriction. Sci. Hortic. 2006, 107, 143–149. [Google Scholar] [CrossRef]
  38. Dichio, B.; Romano, M.; Nuzzo, V.; Xiloyannis, C. Soil water availability and relationship between canopy and roots in young olive trees (cv Coratina). Acta Hort. 2002, 586, 255–258. [Google Scholar] [CrossRef]
  39. Endean, F.; Carlson, L. The effect of rooting volume on the early growth of lodgepole pine seedlings. Can. J. For. Res. 1975, 5, 55–60. [Google Scholar] [CrossRef]
  40. Majdi, H. Changes in fine root production and longevity in relation to water and nutrient availability in a Norway spruce stand in northern Sweden. Tree Physiol. 2001, 21, 1057–1061. [Google Scholar] [CrossRef] [PubMed] [Green Version]
  41. Lõhmus, K.; Truu, J.; Truu, M.; Kaar, E.; Ostonen, I.; Alama, S. Black alder as a perspective deciduous species for reclaiming of oil shale mining areas. In Brownfields III Prevention, Assessment, Rehabilitation and Development of Brownfield Sites; Brebbia, C.A., Mander, U., Eds.; WIT Press: Southampton, UK, 2006; pp. 87–97. [Google Scholar]
  42. Snyman, H.A. Effect of water stress on root growth of Opuntia ficus-indica and O. robusta. Proc. S. Afr. J. Anim. Sci. 2004, 34, 101–103. [Google Scholar]
  43. Snyman, H.A. A case study on in situ rooting profiles and water-use efficiency of cactus pears, Opuntia ficus-indica and O. robusta. J. Prof. Assoc. Cactus Dev. 2005, 7, 1–21. [Google Scholar]
  44. Wang, C.Q. Growth rule of year-on and year-off apple trees and recommended cultivation practices. J. Shanxi Agric. Sci. 2005, 33, 35–39. [Google Scholar]
  45. Wang, L.Q.; Wei, Q.P.; Tang, F.; Shu, H.R. Annual dynamic pattern of new roots of apple trees. J. Shandong Agric. Univ. 1997, 28, 8–14. [Google Scholar]
  46. Nobel, P.S.; Cui, M.Y.; Miller, P.M.; Luo, Y.Q. Influences of soil volume and an elevated CO2 level on growth and CO2 exchange for exchange for the crassulacean acid metabolism plant Opuntia ficus indica. Physiol. Plant. 1994, 90, 173–180. [Google Scholar] [CrossRef]
  47. Bauhus, J.; Messier, C. Soil exploitation strategies of fine roots in different tree species of the southern boreal forest of eastern Canada. Can. J. For. Res. 1999, 29, 260–273. [Google Scholar] [CrossRef]
  48. Rewald, B.; Ephrath, J.E.; Rachmilevitch, S. A root is a root is a root? Water uptake rates of Citrus root orders. Plant Cell Environ. 2011, 34, 33–42. [Google Scholar] [CrossRef]
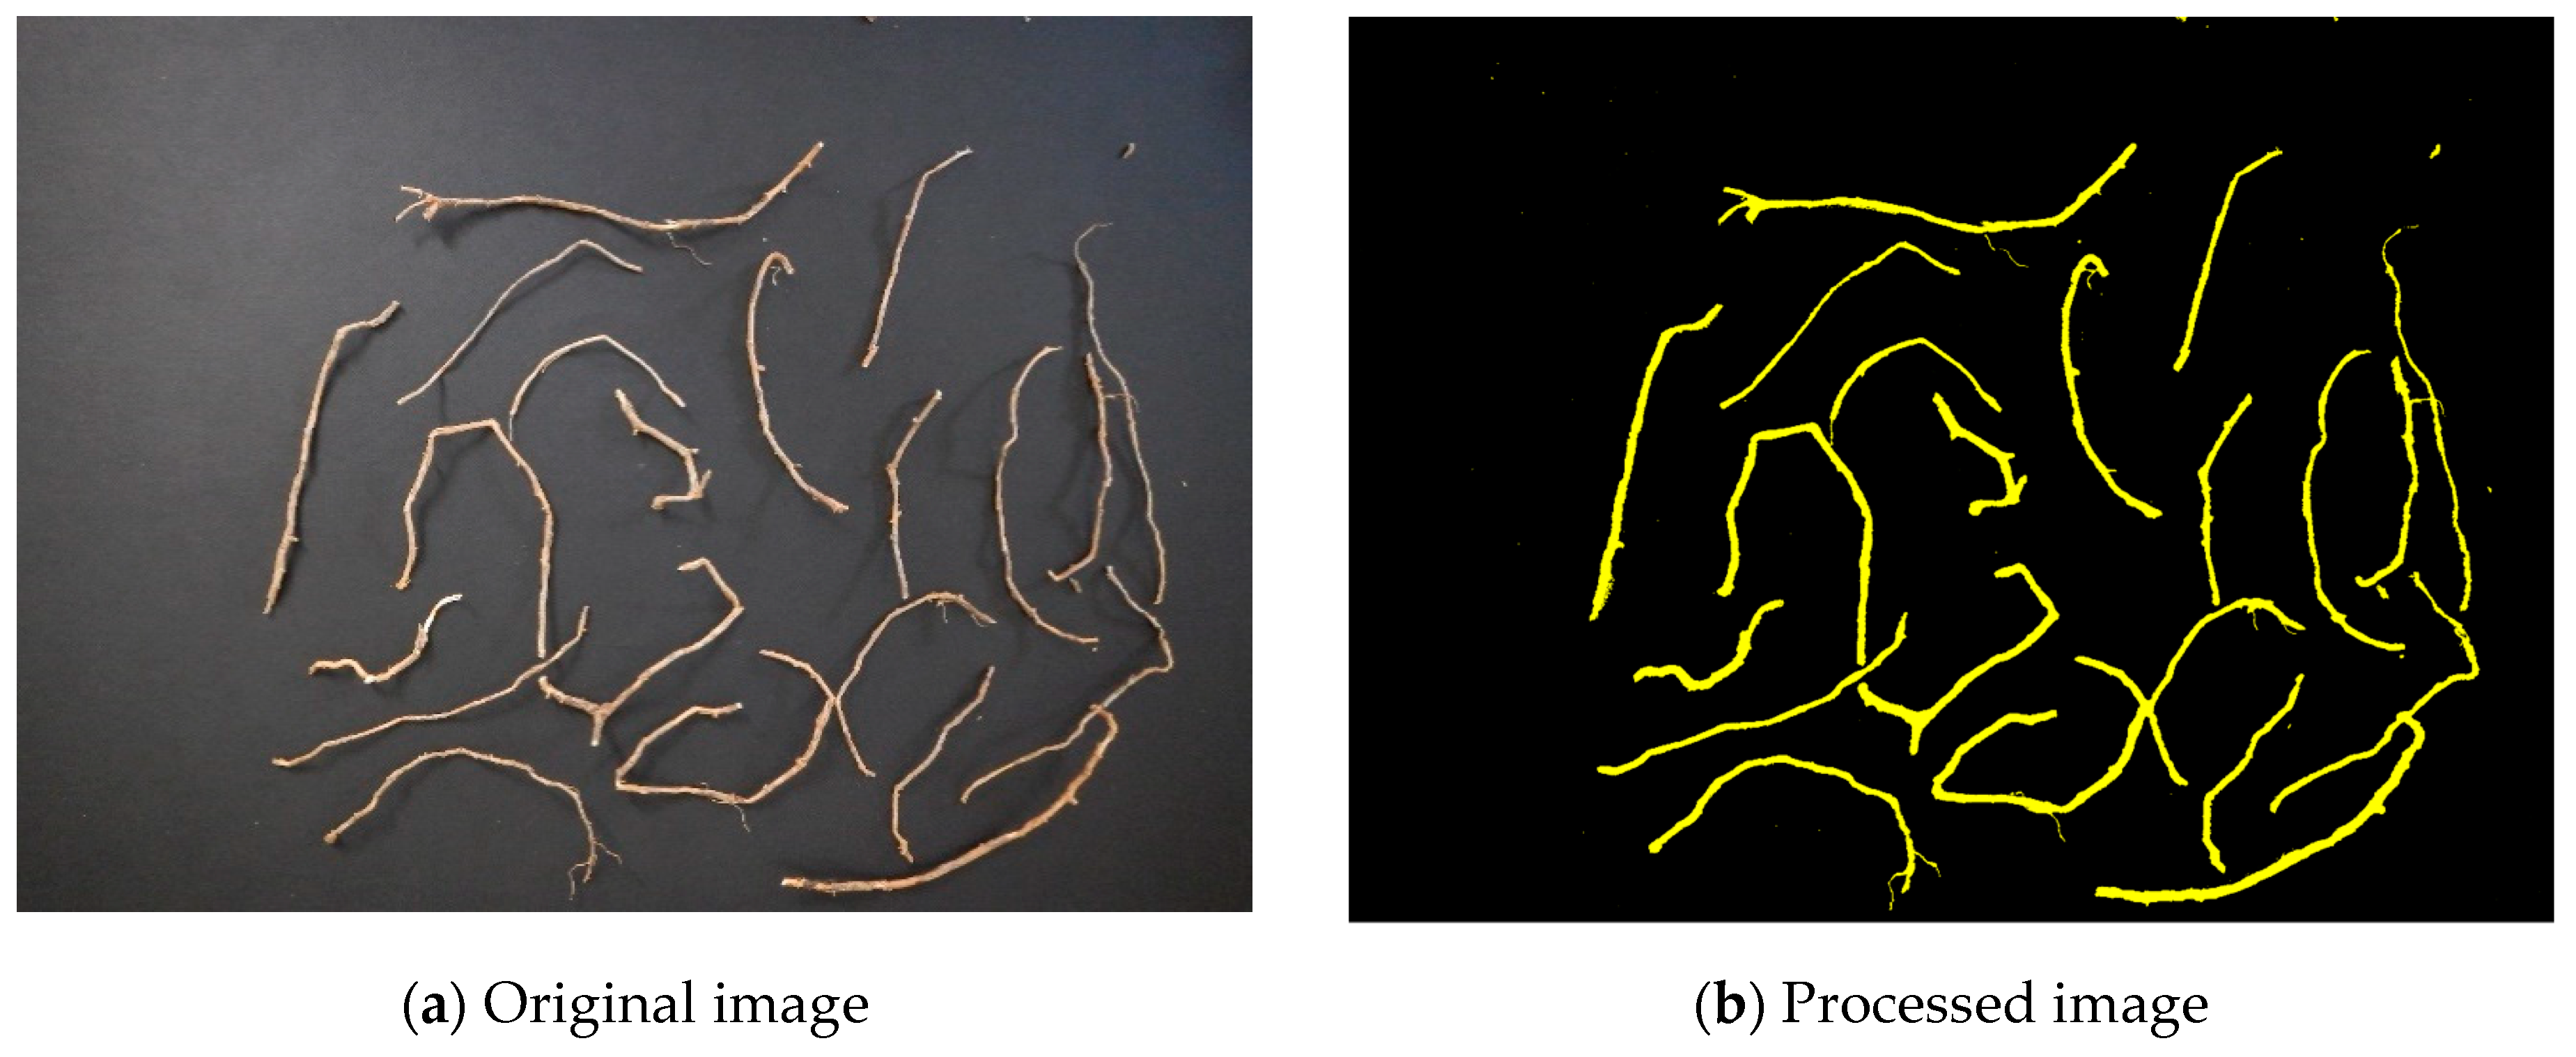
Figure 1. Estimation of the root surface area using a digital camera mounted on a monopod 35 cm above the surface: (a) original image captured with the equipment, (b) extracted image of the roots from the digital image using the VegMeasure© image processing program.
Agronomy 10 00635 g001
Figure 2. Opuntia ficus-indica potted tree scheme.
Agronomy 10 00635 g002
Figure 3. Absolute number of second-generation cladodes in potted plants of Opuntia ficus-indica at four sampling dates (6, 12, 18 and 24 months) and at different soil volumes (50, 33, 18, 9 and 5 L). Different lowercase letters indicate significant differences (Tukey’s test at p ≤ 0.05) in the second-generation cladodes number within the sampling dates for the same pot size. Different capital letters indicate differences (Tukey’s test at p ≤ 0.05) in the second-generation cladodes number according to pot size on the same sampling date. Vertical bars represent the standard error (n = 5 plants).
Agronomy 10 00635 g003
Figure 4. Effect of five different soil volumes (50, 33, 18, 9 and 5 L) and four different sampling dates (6, 12, 18 and 24 months) on the total number of cladodes per Opuntia ficus-indica plant. Different lowercase letters indicate significant differences (Tukey’s test at p ≤ 0.05) in the total cladodes number between sampling dates for the same pot size. Different capital letters indicate significant differences (Tukey’s test at p ≤ 0.05) in the total cladodes number between different pot sizes at the same sampling date. Vertical bars represent the standard error. The data are presented as means ± SE (n = 5 plants).
Agronomy 10 00635 g004
Figure 5. Effect of five different soil volumes (50, 33, 18, 9 and 5 L) and four different sampling dates (6, 12, 18 and 24 months) on the dry mass of the canopy (g) of Opuntia ficus-indica. Different lowercase letters indicate significant differences (Tukey’s test at p ≤ 0.05) in the total canopy dry mass between sampling dates for the same pot size. Different capital letters indicate significant differences (Tukey’s test at p ≤ 0.05) in the total canopy dry mass between different pot sizes at the same sampling date. Vertical bars represent the standard error (n = 5 plants).
Agronomy 10 00635 g005
Figure 6. Effect of five different soil volumes (50, 33, 18, 9 and 5 L) and four different sampling dates (6, 12, 18 and 24 months) on the total root volume (cm3) per Opuntia ficus-indica plant. Different lowercase letters indicate significant differences (Tukey’s test at p ≤ 0.05) in the total root volume (cm3) between sampling dates for the same pot size. Different capital letters indicate significant differences (Tukey’s test at p ≤ 0.05) in the total root volume (cm3) between different pot sizes at the same sampling date. Vertical bars represent the standard error. Data are presented as means ± SE (n = 5 plants).
Agronomy 10 00635 g006
Figure 7. Effect of five different soil volumes (50, 33, 18, 9 and 5 L) and four different sampling dates (6, 12, 18 and 24 months) on the total root density (cm3 L−1) of Opuntia ficus-indica. Different lowercase letters indicate significant differences (Tukey’s test at p ≤ 0.05) in the total root density (cm3 L−1) between different sampling dates for the same pot size. Different capital letters indicate significant differences (Tukey’s test at p ≤ 0.05) in the total root density (cm3 L−1) between different pot sizes at the same sampling date. Vertical bars represent the standard error. Data are presented as means ± SE (n = 5 plants).
Agronomy 10 00635 g007
Figure 8. Effect of five different soil volumes (50, 33, 18, 9 and 5 L) and four different sampling dates (6, 12, 18 and 24 months) on the cladodes starch content of Opuntia ficus-indica. Different lowercase letters indicate significant differences (Tukey’s test at p ≤ 0.05) between different sampling dates for the same pot size. Different capital letters indicate significant differences (Tukey’s test at p ≤ 0.05) between different pot sizes at the same sampling date. Vertical bars represent the standard error. Data are presented as means ± SE (n = 5 plants).
Agronomy 10 00635 g008
Figure 9. Effect of five different soil volumes (50, 33, 18, 9 and 5 L) and four different sampling dates (6, 12, 18 and 24 months) on the roots starch content of Opuntia ficus-indica. Different lowercase letters indicate significant differences (Tukey’s test at p ≤ 0.05) in the total root density (cm3 L−1) between different sampling dates for the same pot size. Different capital letters indicate significant differences (Tukey’s test at p ≤ 0.05) in the total root density (cm3 L−1) between different pot sizes at the same sampling date. Vertical bars represent the standard error. Data are presented as means ± SE (n = 5 plants).
Agronomy 10 00635 g009
Table 1. Effect of five different soil volumes (50, 33, 18, 9 and 5 L) and four different sampling dates (6, 12, 18 and 24 months) on the fine, medium, large and total root surface area (cm2) per Opuntia ficus-indica plant. Data are presented as means ± SE (n = 5 plants). Different lowercase letters indicate significant differences (Tukey’s test at p ≤ 0.05) in the fine, medium, large and total root surface area (cm2) within the sampling dates for the same pot size. Different capital letters indicate differences (Tukey’s test at p ≤ 0.05) in the fine, medium, large and total root surface area (cm2) according to pot size on the same sampling date.
6 Months12 Months18 Months24 Months
fine root surface area (<2 mm)
50 L2043.95 cA± 27.802766.48 bA± 27.412942.97 aA±43.022995.08 aA±51.89
33 L2049.02 bA±35.802587.38 aB±33-301991.56 bB±39.212082.59 bB±43.03
18 L1354.66 bB±47.891706.53 bC±50.591899.62 aC±21.171285.41 cC±31.06
9 L1263.04 bC±36.901495.34 aD±47.421081.74 bD±40.07876.25 cD±21.09
5 L522.17 cD±41.921024.29 aE±41.96 856.02 bE±18.01524.11 cE±15.32
medium root surface area (2–5 mm)
50 L528.34 dA±34.54696.74 cA±35.601377.36 bA±20.431730.44 aA±25.01
33 L516.74 cA±21.35545.94 cB±30.221072.1 aB±18.87 957.86 bB±18.03
18 L380.65 bB±40.06371.34 bC±39.67768.67 aC±31.08 747.14 aC±21.05
9 L325.21 dB±15.71370.32 cC±18.21679.49 aD±25.01 543.87 bD±32.08
5 L271.24 cC±14.40237.01 dD±8.43401.81 aE±40.13 316.31 bE±17.22
large root surface area (>5 mm)
50 L98.38 dA±10.73141.60 cA±4.01311.71 bA±10.23913.03 aA±31.08
33 L61.70 dB±5.80117.69 cB±7.23317.22 bA±24.01718.10 aB±20.01
18 L52.50 cB±6.2162.52 cC±5.07184.81 bB±18.05388.93 aC±11.04
9 L33.97 dC±4.7249.65 cD±6.1283.67 bC±4.21238.14 aD±19.01
5 L29.90 cC±3.5125.69 cE±2.8954.25 bD±6.04131.92 aE±7.02
total root surface area
50 L2670.67 dA± 32.093604.82 cA± 34.214632.03 bA± 42.045638.55 aA± 61.03
33 L2627.46 cA± 44.623251.01 bB± 43.263380.88 bB± 50.233758.55 aB± 48.07
18 L1787.81 cB± 47.212140.39 cC± 51.032853.12 aB± 28.712421.48 bC± 33.01
9 L1622.22 bC± 38.211915.31 aD± 35.161844.90 aC± 42.051658.26 bD± 26.05
5 L823.31 cD± 25.041286.99 aE± 28.081312.08 aD± 35.01972.32 bE± 35.02
Table 2. Effect of five different soil volumes (50, 33, 18, 9 and 5 L) and four different sampling dates (6, 12, 18 and 24 months after planting) on the root/canopy dry mass (g/g DW) of Opuntia ficus-indica. Data are presented as means ± SE (n = 5 plants). Different lowercase letters indicate significant differences (Tukey’s test at p ≤ 0.05) in the root /canopy dry mass (g/g DW) between different sampling dates for the same pot size. Different capital letters indicate significant differences (Tukey’s test at p ≤ 0.05) in the root/canopy dry mass (g/g DW) between different pot sizes at the same sampling date.
6 Months12 Months18 Months24 Months
50 Liters0.28 ± 0.03 aD0.22 ± 0.03 aC0.18 ± 0.02 bA0.19 ± 0.02 abA
33 Liters0.74 ± 0.05 aA0.32 ± 0.05 bA0.18 ± 0.02 cA0.16 ± 0.02 cA
18 Liters0.53 ± 0.06 aB0.28 ± 0.03 bAb0.17 ± 0.06 cA0.15 ± 0.03 cA
9 Liters0.42 ± 0.04 aC0.26 ± 0.02 bB0.19 ± 0.05 cA0.17 ± 0.02 cA
5 Liters0.45 ± 0.03 aC0.27 ± 0.03 bB 0.17 ± 0.03 cA0.17 ± 0.05 cA