Article

Bee Pollen as Oenological Tool to Carry out Red Winemaking in Warm Climate Conditions

by
Antonio Amores-Arrocha
*,
Pau Sancho-Galán
,
Ana Jiménez-Cantizano
and
Víctor Palacios
Department of Chemical Engineering and Food Technology, Vegetal Production Area, Faculty of Sciences, University of Cadiz, Agrifood Campus of International Excellence (ceiA3), IVAGRO, 11510 Puerto Real, Cadiz, Spain
*
Author to whom correspondence should be addressed.
Agronomy 2020, 10(5), 634; https://doi.org/10.3390/agronomy10050634
Submission received: 8 April 2020 / Revised: 24 April 2020 / Accepted: 27 April 2020 / Published: 30 April 2020

Abstract

:
Easily assimilated nitrogen, vitamins, fatty acids, and some minerals are some of the yeast nutrients that foster vinification processes. Additionally, some climatic, biological or cultural factors may induce variations in grape-must nutrient contents. The lack of easily assimilated nitrogen by Saccharomyces cereivisiae yeast has been proven to be the main cause of poor or inadequate alcoholic fermentation. On the other hand, the use of bee pollen during the alcoholic fermentation of white grape-musts has shown a positive effect on both the fermentation kinetics and the quality of final wines. Thus, it has been proposed as a nutrient-activator for the vinification of Tintilla de Rota grape-musts. In this study, the kinetics of the alcoholic and malolactic fermentation of grapes-musts/wines, yeast populations, and assimilable nitrogen consumption and physicochemical properties of the wines were monitored. The results showed an improvement in fermentation kinetics when bee pollen was present, in comparison to the control samples. Bee pollen is associated with an increment in easily assimilated nitrogen grape-must content. It was also been noticed that lower pollen doses (0.1 and 0.25 g/L) did not alter the physicochemical and color parameters of the grape-musts and the final wines. All of these facts suggest that bee pollen could be used as a beneficial activator-nutrient for some of the processes involved in the production of red wines.

1. Introduction

A nutrient deficiency, the presence of residues, and the presence of undesirable substances originating from the treatment of vineyards with pesticides [1,2,3] are some of the main factors that may slow down or even stop the alcoholic fermentation (AF) of grape-musts that winemakers have to face [1,4]. Furthermore, temperature increments due to the current global warming is affecting grape ripening processes and resulting in unbalanced musts [5,6,7]. Many of the problems that are associated with poor compound compensation in grape-musts are triggered by a content deficiency with regard to yeast easily assimilated nitrogen, vitamins, and other micronutrients [8,9,10]. This may eventually lead to cell viability problems [11] that could impact the sensory profile of the final wines [12,13].
Yeast assimilable nitrogen (YAN) must content is a crucial factor for the development of yeast populations. Depending on its potential alcoholic strength and fermentation conditions, inorganic and organic nitrogen, as well as ammonium salts and amino acids [14], should be found in grape-musts at over 140 mg/L [4,14,15,16,17,18,19,20]. However, such a concentration level and other compound concentrations may vary depending on the geographical location of the vineyard [21], the cultivar [22] or the rootstock used [23,24], and viticulture techniques that are implemented [23,25,26]. Since wine making yeasts metabolize both YAN and other nutrients while growing and developing biomass [27] as part of the vinification process, a proper YAN level is essential both for indigenous yeasts and commercial strains of active dry yeast [18,28,29,30].
When Saccharomyces cerevisiae yeast is used to ferment wine, it consumes YAN through several molecular mechanisms [31]. If grape-must presents a poor YAN content, wine makers add fermentation activators to induce an increment of biomass content and enhance their metabolization to enhance the oenological characteristics of final wines [18,32,33]. There are many and diverse products used by wine makers to compensate for nutritional deficiencies. The purpose of such products is to boost fermentation kinetics and cell multiplication, as well as to improve the anaerobic conditions of the fermentation medium [33,34,35,36].
This research work proposes using multiflora bee pollen as a fermentation promoter to improve fermentation kinetics in red wine production. Previous studies have used bee pollen as a fermentation activator for the production of white wines [37,38] and for the biological ageing of white wines [39]. Bee pollen contains a wide range of sugars, proteins, minerals, vitamins, essential amino acids, essential fatty acids, sterols, phospholipids, carotenoids, and polyphenols [40,41,42,43,44,45,46]. It has already been proven that when bee pollen is used in high doses, it can significantly increase YAN concentrations, shorten the dormancy phase, and increase cell multiplication in both white grape-must [37] and in the honey-must use to produce mead [47]. Nevertheless, such high doses of pollen could have a negative effect on the sensory profile of the resulting white wines when compared to those obtained with lower doses [38]. This research aims to determine the effect of multiflora bee pollen as an activator-nutrient for Tintilla de Rota variety red winemaking. This is an autochthonous Andalusian grape variety and was first cited in 1807 by Rojas Clemente [48]. Cadiz is a warm climate area where this grape variety is grown for the production of premium red wines.
This study intends to determine the effect of Saccharomyces cerevisiae yeast population kinetics along with the evolution of YAN on the oenological and color characteristics of the final wines when multiflora bee pollen is added as a nutrient activator at the very beginning of the wine making process. This research work’s results could be useful to enhance the use of bee pollen in the oenological industry as an activator-nutrient to elaborate red wines.

2. Materials and Methods

2.1. Winemaking Conditions

Tintilla de Rota red grapes were obtained from a private winery in Jerez de la Frontera (Cadiz, Spain). All the cultivars were planted and grown at the same date and in the same plot (latitude 36°42′00.6″N; longitude 6°11′34.0″W; 100 m above sea-level) in Jerez de la Frontera (Cadiz, Spain). The vineyard plot soil is a variety of limestone locally known as “albariza.” The vines were trained following the Guyot system, and no fertirgation treatments in the vineyard were applied. For the control of pest and possible diseases, conventional phytosanitary products were applied. The handmade harvested grapes were transported from the winery cellar to our laboratory, where grapes were destalked and crushed. The resulting mixture was sulfited with 25 mg/kg of potassium metabisulfite (Sigma-Aldrich Chemical S.A., Madrid, Spain) without any pH correction and tempered at 20 °C. Then, in order to carry out the laboratory essays, the homogenized paste was distributed into glass fermenters (V = 5 L) fitted with refrigeration chambers for temperature control during AF.

2.2. Commercial Multiflora Bee Pollen, Yeast (Saccharomyces cerevisiae) and Lactic Acid Bacteria (Oenococcus oeni)

Commercial multiflora bee pollen (6% humidity; 99.8% dry-weight purity) from Valencia, Spain, at six different dosages was added: control (0), 0.1, 0.25, 1, 5, 10, and 20 g/L into each glass fermenter, and the grape paste-mixture was homogenized. Before being added to the fermenting paste, the bee pollen was mill ground (Vorwerk’s Thermomix TM31, Wuppertal, Germany) and stocked in a dark glass container under desiccation conditions (low humidity and vacuum).
An inoculum (10 g/hL) of freeze-dried commercial yeasts was used to induce the AF. Specifically, a strain of Saccharomyces cerevisiae Lalvin 71B® from Lallemand, Barcelona, Spain with a high requirement for easily assimilable nitrogen and resistance to high alcohol contents. Yeast population counting was done using a Neubauer chamber (Brand®, Merck, Madrid, Spain) and the methylene blue staining method to discriminate between viable and non-viable cells. A 40× Nikon microscope (Tokyo, Japan) was used for counting monitoring. After the AF phase (22 days), the resulting wines were subjected to malolactic fermentation by adding an inoculum of lactic acid bacteria, namely Oenococcus oeni S11B P2 Instant (1 g/hL), provided by Laffort, Bordeaux, France.

2.3. Analytical Measurements

The following measurements were carried out: sugar (g/L), total acidity (TA) (g/L TH2); pH and YAN content in the initial red grape-musts; and, finally, alcoholic level (%), pH, total acidity (TA), volatile acidity (VA), residual sugars (RS) glucose and fructose, total polyphenols index (TPI) anthocyanin’s content (mg/L), and tannin concentrations (g/L) in the final red wines. During alcoholic fermentation, sample density was determined by direct measurement with a DMA 48 density meter (ANTOM-PAAR, Net InterLab SAL, Madrid, Spain). The relative density of the samples was carried out as the ratio of the sample’s density to the initial sample’s density. Additionally, the chromatic characters of wines were also evaluated according to CIELab (L*, a*, b* and C*), tone (N) and color intensity (CI). Sugar content, alcohol content, total acidity, and volatile acidity were also determined following the officially approved methods of wine analysis [49]. A CRISON-2001® digital pH meter (Crison, Barcelona, Spain) equipped with a combined electrode with automatic temperature compensation was used for pH measurements. YAN content was determined according to Aerny’s formaldehyde method [50]. Residual sugar (RS) content (glucose and fructose) in final wines was determined by ion chromatography (930 Compact IC Flex, Metrohm, Herisau, Switzerland) equipped with a pulse-amperemeter detector and a gold electrode as the working electrode. The elution was carried out isocratically at a 0.5 mL/min flow rate with 300 mM sodium hydroxide (NaOH) and 1 mM sodium acetate (NaOAc). The separation was achieved by means of a Metrosep Carb 2–150/4.0 column (Metrohm). Color was determined by following the recommendations of the International Commission of L’Eclairage, which establishes the CIELAB parameters that better define the color of wine and allow for more precise differentiation [51,52,53]. Color intensity was measured using the quick test method of the International Vine and Wine Office, the same method proposed by Sudraud based on the sum of absorbances at 420 and 520 nm [49]. Wine tonalities were also determined by the rapid method recommended by the Office International de la Vigne et du Vin, which is defined as the ratio between the absorbances at 420 and 520 nm expressed in the degree of angle (OIV; 2014) [49]. Previously to the corresponding measurements, all the samples were filtered by means of 0.45 µm nylon syringe membrane filters (HAWP Millipore Co., Bedford, MA, USA).

2.4. Statistics Analysis

Significant differences in means and standard deviations were calculated and assessed by a two-way ANOVA and a Bonferroni’s multi-range test (BSD); p < 0.05 was established as the significant reference (GraphPad Prism version 6.01 for Windows, GraphPad Software, San Diego, CA, USA). All the trials were performed in triplicate (n = 3) to ensure statistical significance.

3. Results and Discussion

3.1. Effects of Bee Pollen on the Physicochemical Properties of Tintilla de Rota Red Grape Must

The physicochemical properties of Tintilla de Rota grape-must samples after adding bee pollen, as well as the control samples, are displayed in Table 1. As shown, sugar content was not significantly affected by the lower bee pollen additions. Nevertheless, when high doses were added (10 or 20 g/L), an increment between 7% and 6.5%, respectively, was observed in comparison to the control samples. Such an effect, which has already been observed in white grape-musts AF [37], could be attributed to the considerable pollen sugar content, especially when high pollen doses are used [44]. Bee pollen additions did not seem to affect the total acidity of the must samples, except when the largest doses (20 g/L) were added (Table 1). On the other hand, 10 g/L doses seemed to have a significant effect on the must samples’ pH levels, which reached values above 3.75. A similar effect was also observed on Palomino fino and Riesling white wines [37], which could have been due to the potassium content in the pollen added to the musts [54,55].
Regarding to YAN content, significant increases were observed with respect to the control (140 mg/L) starting at doses from 0.25 g/L. A linear correlation was established between the pollen dose and YAN (R2 = 0.85) measured increments, similarly to what had already been observed in white grape-musts [37]. Actually, YAN increases (between 3.5% and 48.5%) in Tintilla de Rota grape-musts were slightly higher than those determined in musts from white grape varieties, which were between 3% and 44% for Palomino fino and between 2% and 30% in the case of Riesling [37]. As the bee pollen doses were increased, the YAN increments per gram of added bee pollen decreased (Figure 1). The same effect was also detected in white-musts [37]. This change of trend may corroborate that musts become YAN-saturated at 0.25 g/L doses and above, which would leave a significant YAN reserve from bee pollen that would be extracted during the AF phase in those cases where larger pollen doses have been added.

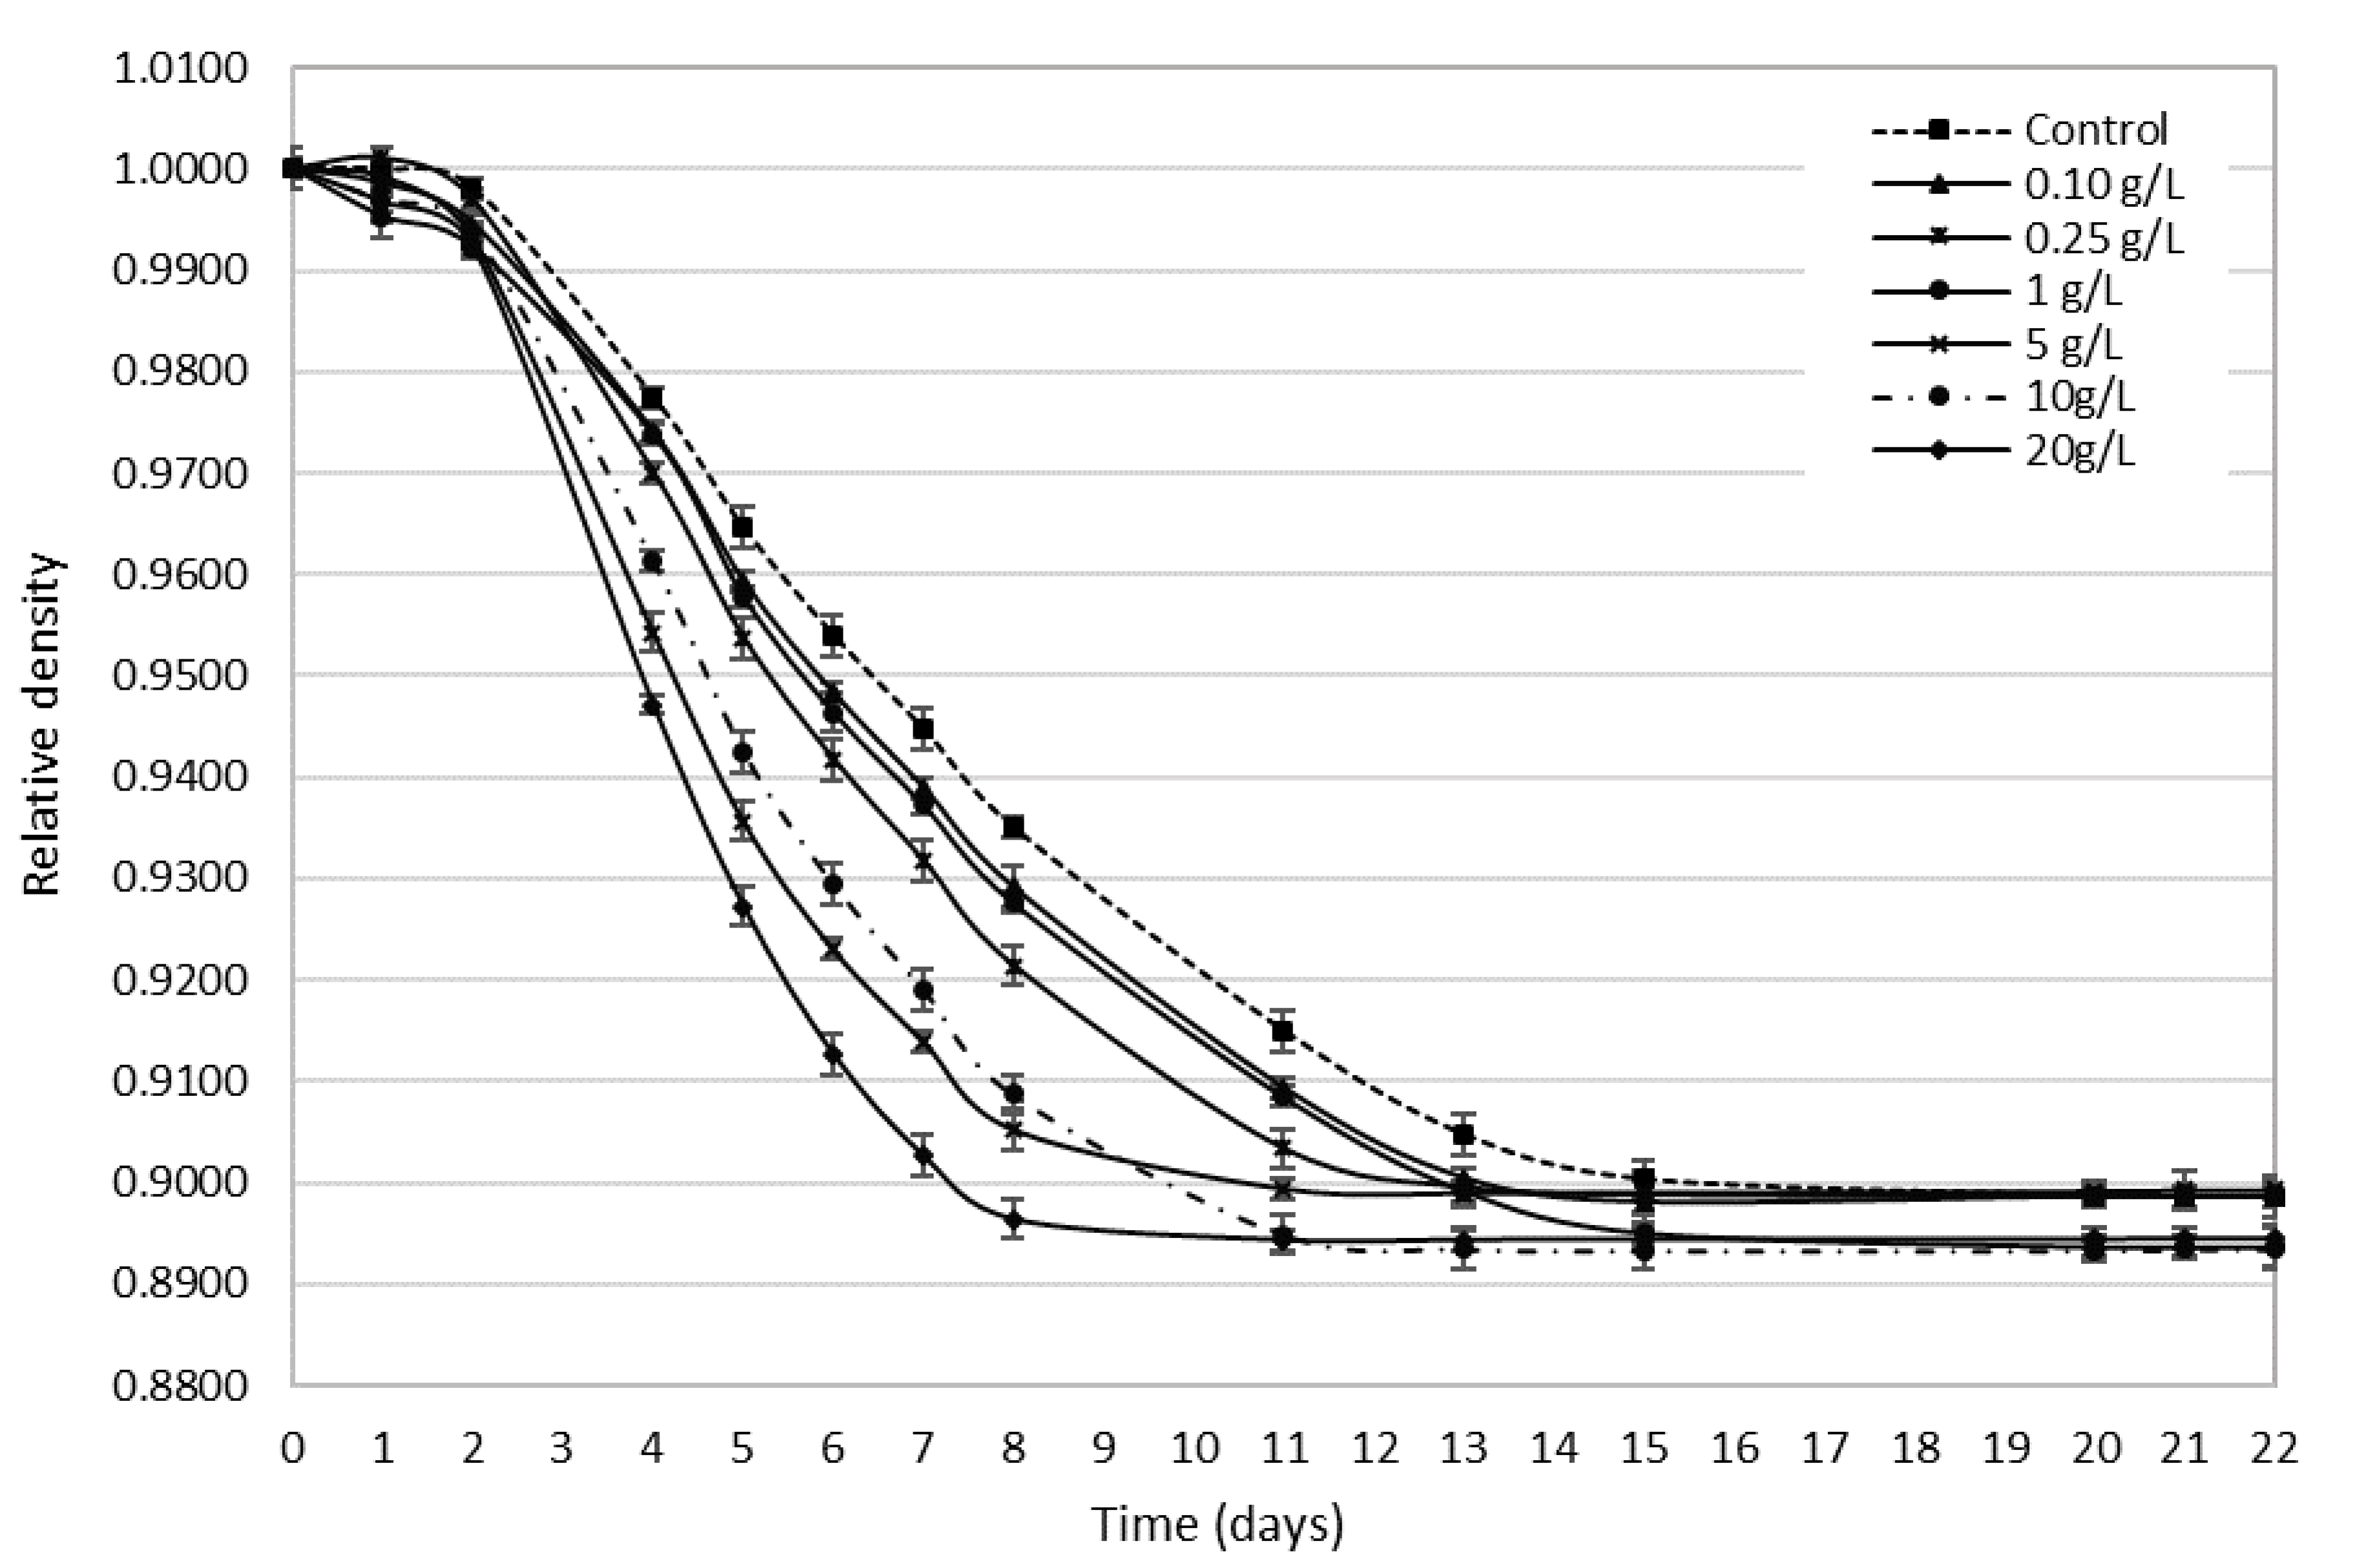
3.2. Bee Pollen’s Influence on Alcohol Fermentation Kinetics

The influence of the bee pollen addition on the fermentation kinetics during the vatting of Tintilla de Rota red grape-musts is shown in Figure 2. As can be seen, the higher the dose of pollen added, the more pronounced the density fall over time, especially during the tumultuous phase.
According to the ANOVA (p < 0.05), there were significant differences between the 1, 5, 10, and 20 g/L bee pollen dosed samples and the control sample from the second day after pollen addition, while differences were significant from the 4th day until the 13th day regardless of the pollen dose applied. Therefore, unlike what happened with white grape-musts [37], with hardly any variations unless large pollen doses were applied, Tintilla de Rota-must fermentation speed significantly increased and improved fermentation kinetics at any pollen doses. It should also be noted that pollen addition had a greater impact on fermentation rate than on the dormancy phase duration. It could also be observed that pollen addition, even at high doses, did not significantly favor the onset of the tumultuous phase (Figure 2). In any case, this improvement of the musts’ fermentative kinetics was probably due, as above mentioned, to the enrichment in YAN and other fermentative activators resulting from the pollen addition. It should be kept in mind that some authors have found that the supplementation of grape-musts with YAN [18,29,36], and with pollen in the case of meads, Roldán [56] produces a similar and significant effect on their fermentative kinetics.

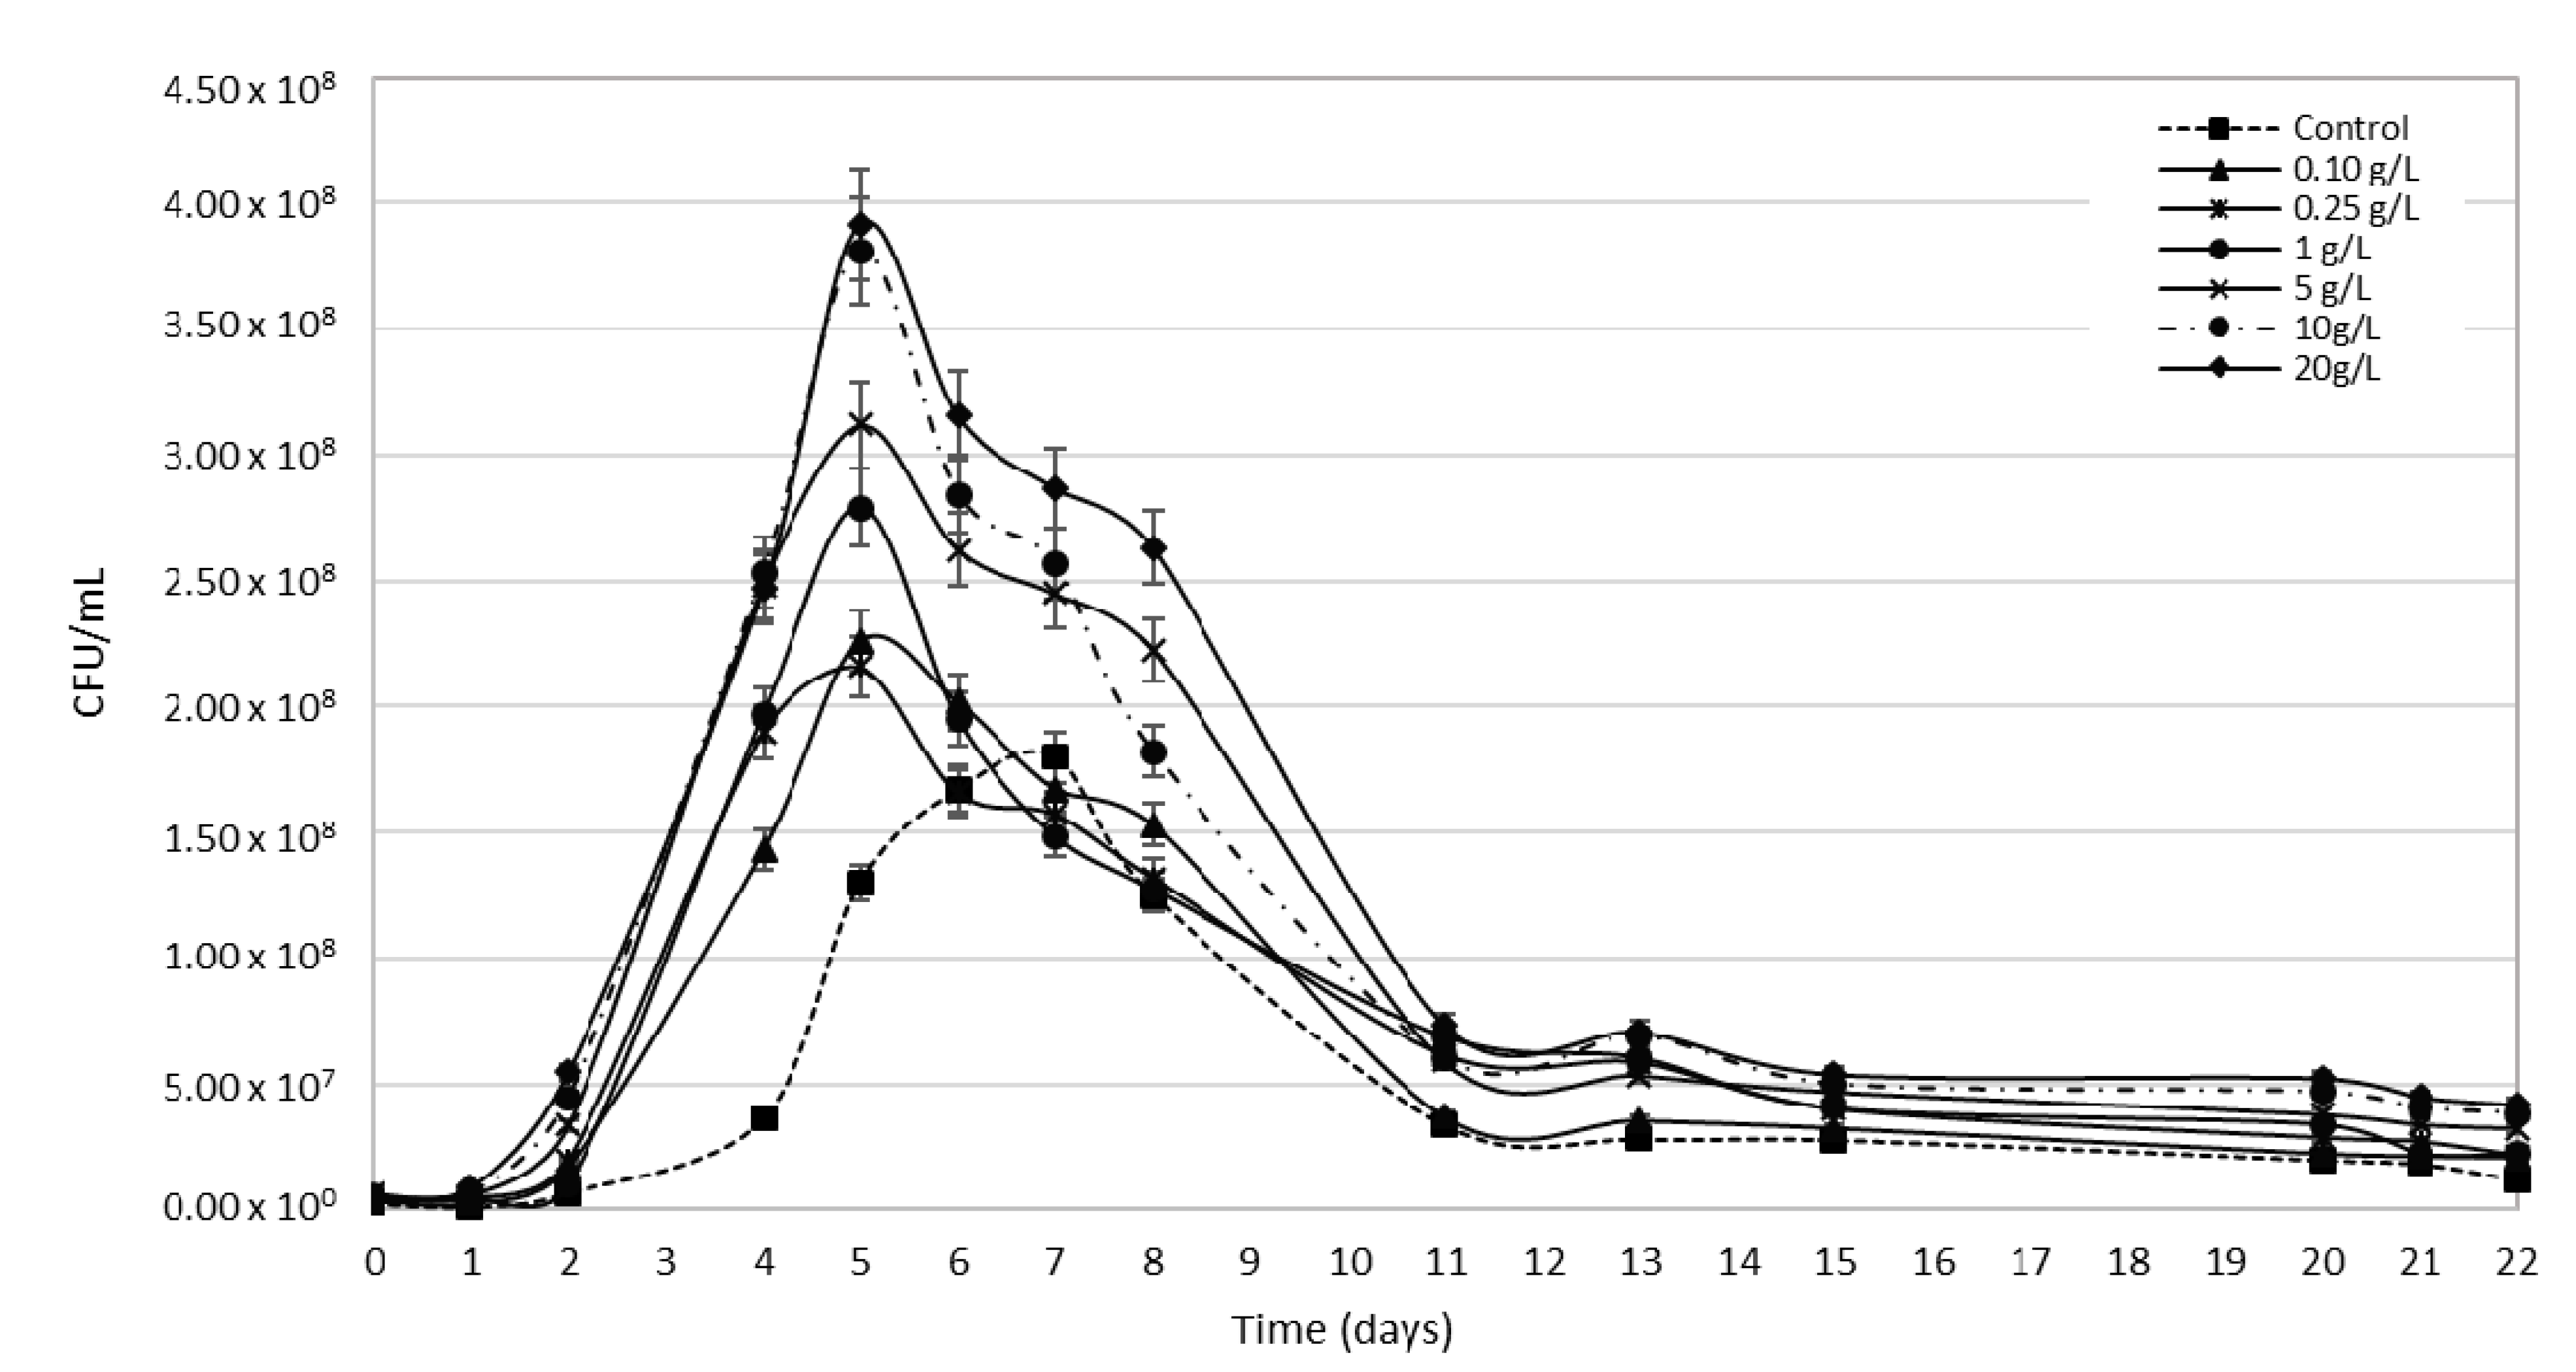
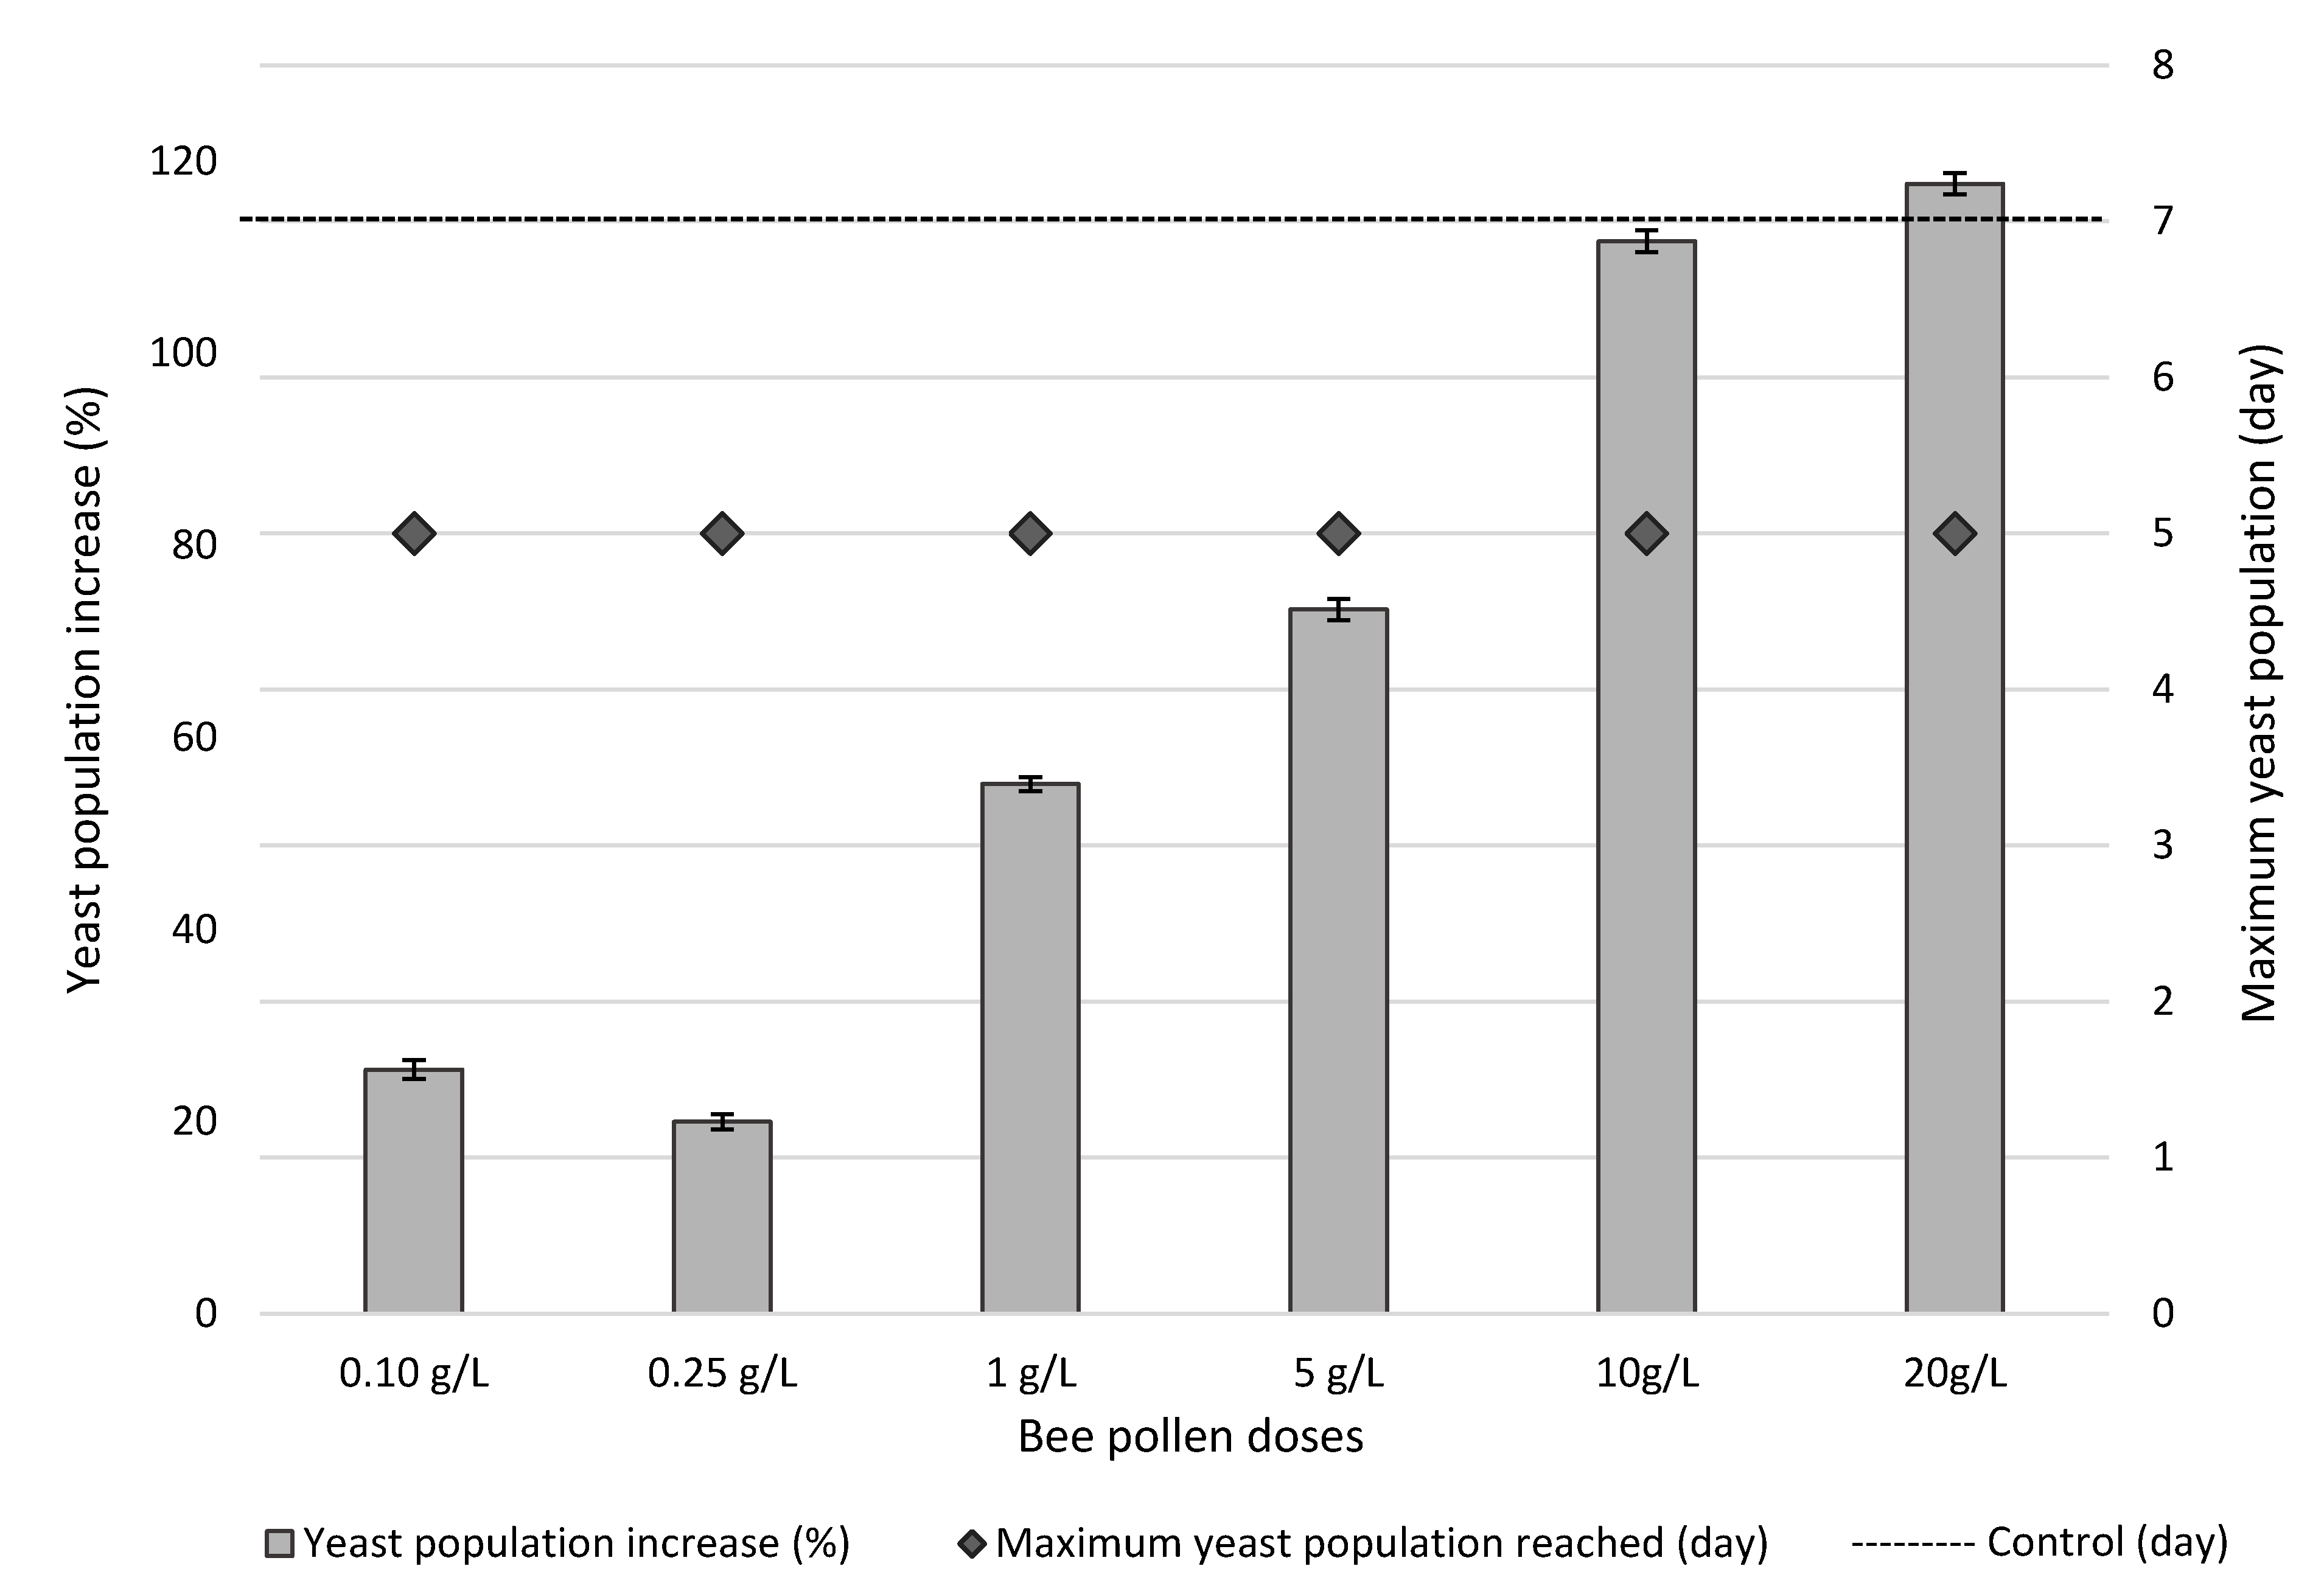
3.3. Bee Pollen Influence on Yeast Growth Kinetics of Alcoholic Fermentation

The evolution of viable Saccharomyces cerevisiae yeast populations during AF in Tintilla de Rota grape-must after the addition of different pollen doses is shown in Figure 3. As can be seen, in all the cases, the use of bee pollen brought forward the exponential growth phase of the yeast cells by 48 h in comparison to the control. YAN contribution and other activating substances provides yeast cells with nutrients as well as with other growth factors that decrease their medium adaptation time [8,29,36,57].
Multiflora bee pollen favored and increased viable yeast populations at the beginning of the exponential growth phase in a range between 39% and 67% compared to the control samples, a significant and linear increment according to the pollen dose used (R2 = 0.70). The addition of pollen favored the survival of yeasts during the latency phase, which, in turn, increased the reliability of the strain implantation and the fermenting probabilities of the must.
In all the samples where pollen was added, the maximum yeast population levels were higher than in the control sample (1.80 × 10⁸ CFU/mL). Actual increments reached between 20% and 55% with pollen doses between 0.1 and 1 g/L (2.26 × 10⁸, 2.16 × 10⁸, and 2.79 × 10⁸ CFU/mL, for 0.1, 0.25, and 1 g/L, respectively) and between 73.33% and 117.64% with pollen doses between 5 and 20 g/L (3.12 × 10⁸, 3.81 × 10⁸, and 3.92 × 10⁸ CFU/mL, for 5, 10, and 20 g/L respectively) (Figure 4). In every case, the addition of pollen reduced, by two, the number of days required by the samples to reach their maximum yeast population (5 days), compared to the control sample (7 days) (Figure 4).
It was, again, observed that pollen also had an impact on the death phase of yeasts. Thus, the higher the pollen dose, the higher the number of viable yeast populations at the end of the fermentation process (R2 = 0.78) (ANOVA, p < 0.05). Thus, yeast populations increased between 42% and 71% with respect to the control samples (Figure 4). From the oenological point of view, this is any extremely interesting characteristic—even more so in the case of wines with high alcoholic potential that require an improved and complete AF.

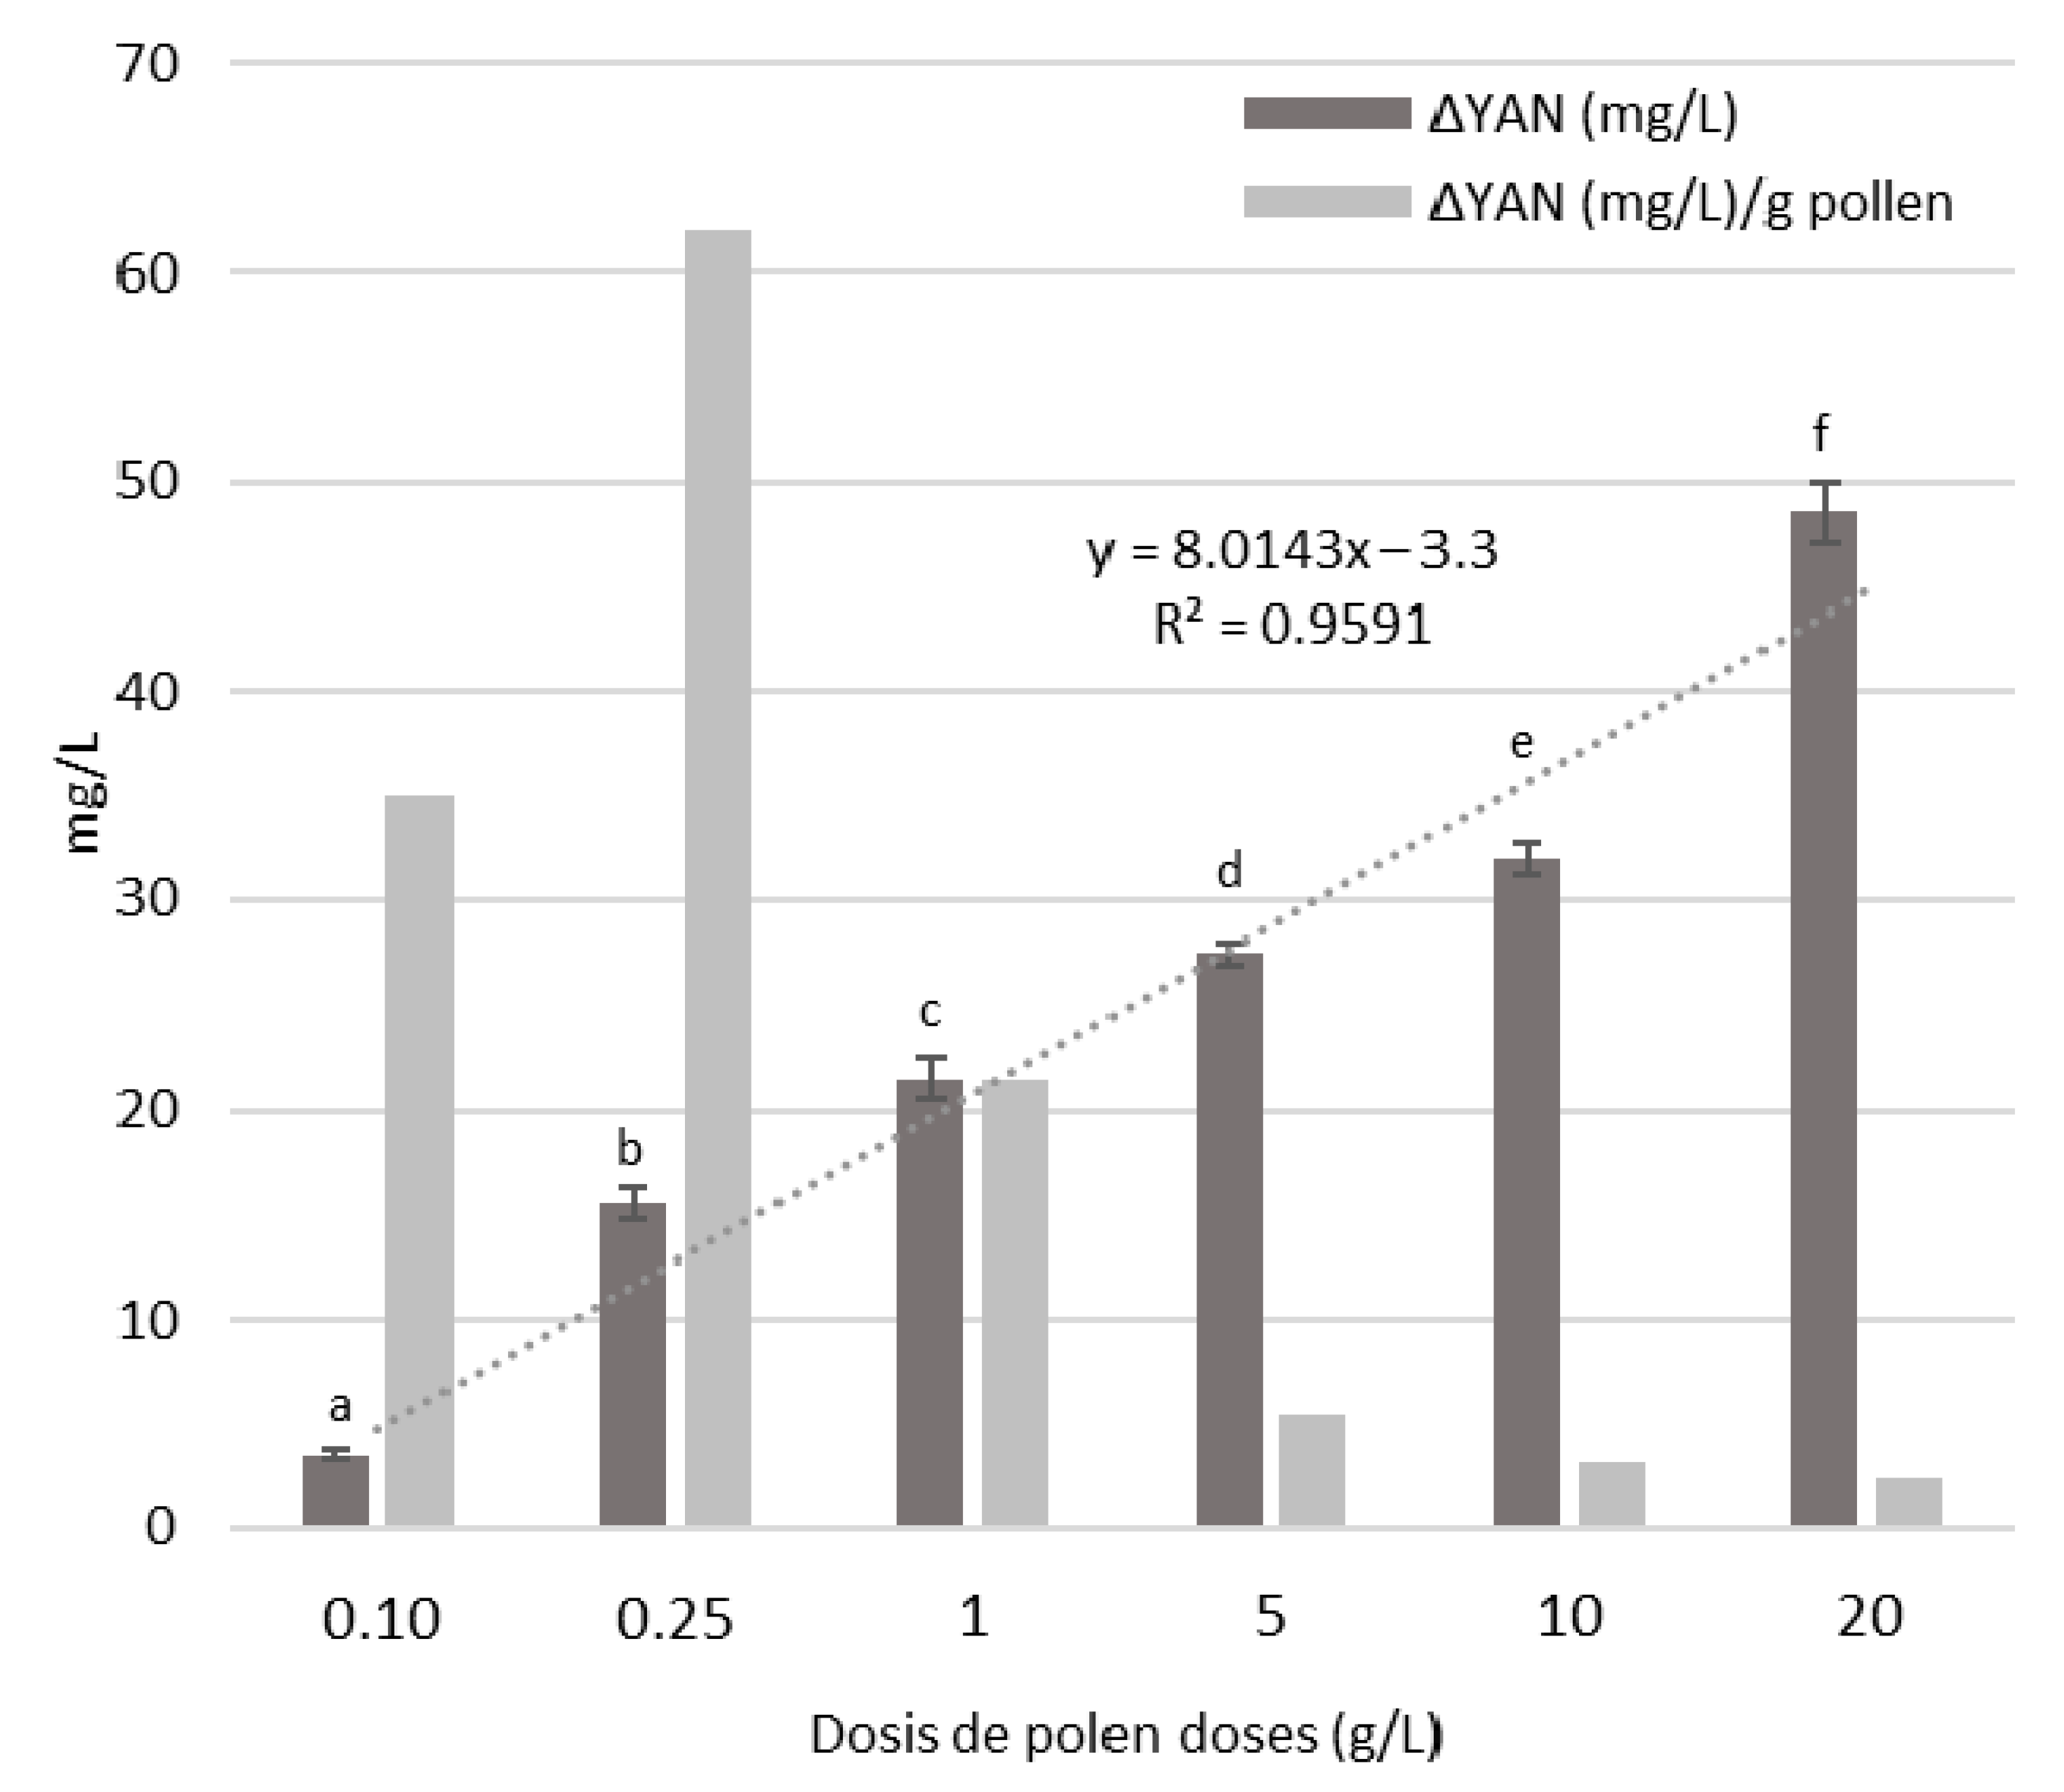
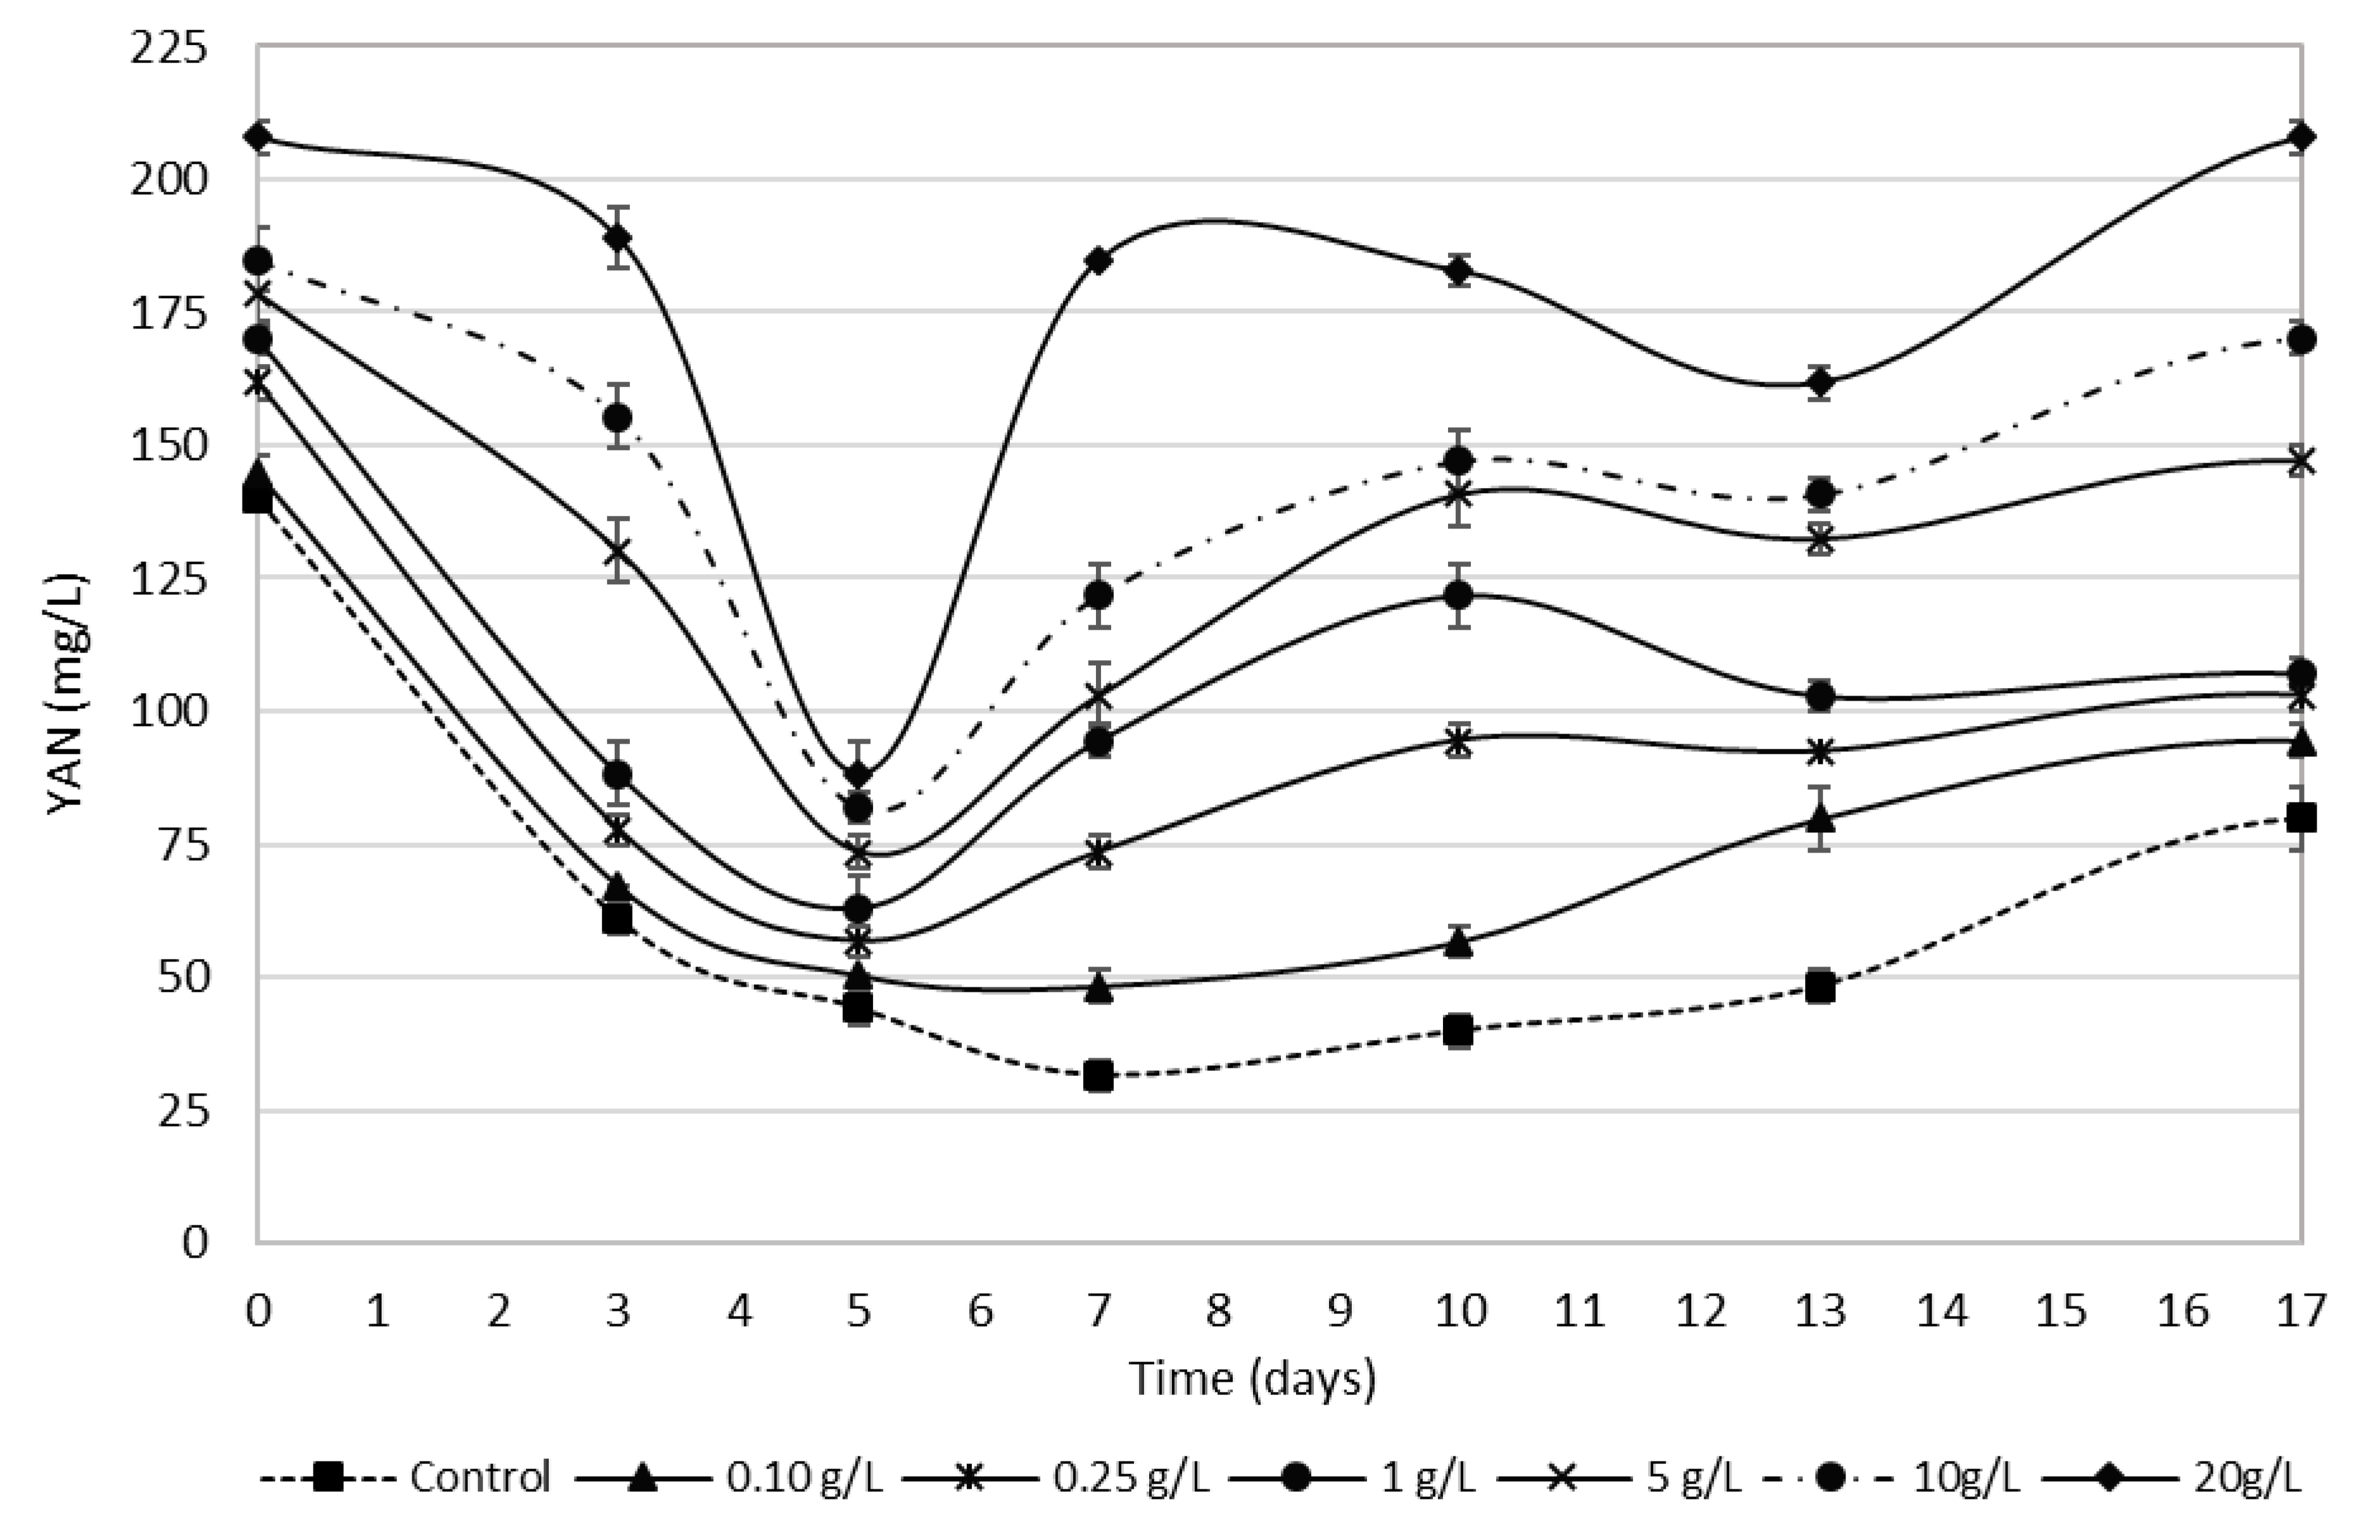
3.4. Bee Pollen Influence on YAN Evolution during Alcoholic Fermentation

The YAN content evolution during the AF of Tintilla de Rota grape-musts after the addition of bee pollen is shown in Figure 5. As can be seen, the addition of pollen in high doses (5, 10, and 20 g/L) significantly reduced the consumption of YAN during the latency or adaptation phase to the medium (3 days). This might be an indication that pollen not only contributes by providing YAN but also other substances that favor the yeast’s adaptation to the medium. However, as pollen doses were increased, YAN consumption also increased when the exponential growth phase began (Figure 5). Higher YAN consumption was directly related to the number of yeast populations, which exhibited an increment at greater pollen doses. In fact, all the pollen doses below 0.1 g/L reached their minimum YAN content on the 5th day, which roughly matched the maximum number of yeast populations (Figure 4). On the other hand, the control and the 0.1 g/L dosed samples reached their minimum YAN content on the 7th day.
The addition of bee pollen could also be noted to lead to a decrease in the demand for YAN per CFU on day 4 (Figure 6), which made us think, once again, that pollen may provide a medium with some beneficial substances, other than YAN, that boost yeasts growth [9,15,33,44,58,59].
It should particularly be noted that once the minimum YAN content is reached, it grew back significantly, and such growth was directly related to the amount of pollen added to the medium. This phenomenon had also been observed in white wine vinification processes, although at a lesser extent [37]. It is, therefore, clear that pollen has an important YAN reserve, especially when using high doses (where, proportionally, not so much was extracted before the start of fermentation) that can be released during the course of AF, probably as a reaction to ethanol presence. Another factor that might contribute to the extraction of YAN is the implementation of agitation during the daily punching. When the mixture of skins, must, and pollen is stirred during the punching, the renewal of the must–wine boundary layer in contact with the pollen is favored, which would contribute to keep YAN concentration gradients at a high level. This phenomenon would favor the diffusion and solubilization of the compounds present in pollen, similarly to what happens with polyphenols during pump-over procedures [60,61]. At the end of the fermentation (between days 13 and 17), an increase in the YAN content was observed in all the cases, even in the control sample. This effect may also have been related to cell lysis and to the diffusion of the internal YAN in yeasts into the medium (Figure 3).
Finally, both the control and the low dosed samples presented higher YAN net consumption levels (difference between the initial and the final values) when compared to higher dosed samples (5, 10, and 20 g/L), where practically no variations were observed. These high levels may be either potentially beneficial and favor other fermentations, such as malolactic fermentation (MLF), or result in an unstable medium that might allow for the development of microbial contaminations.

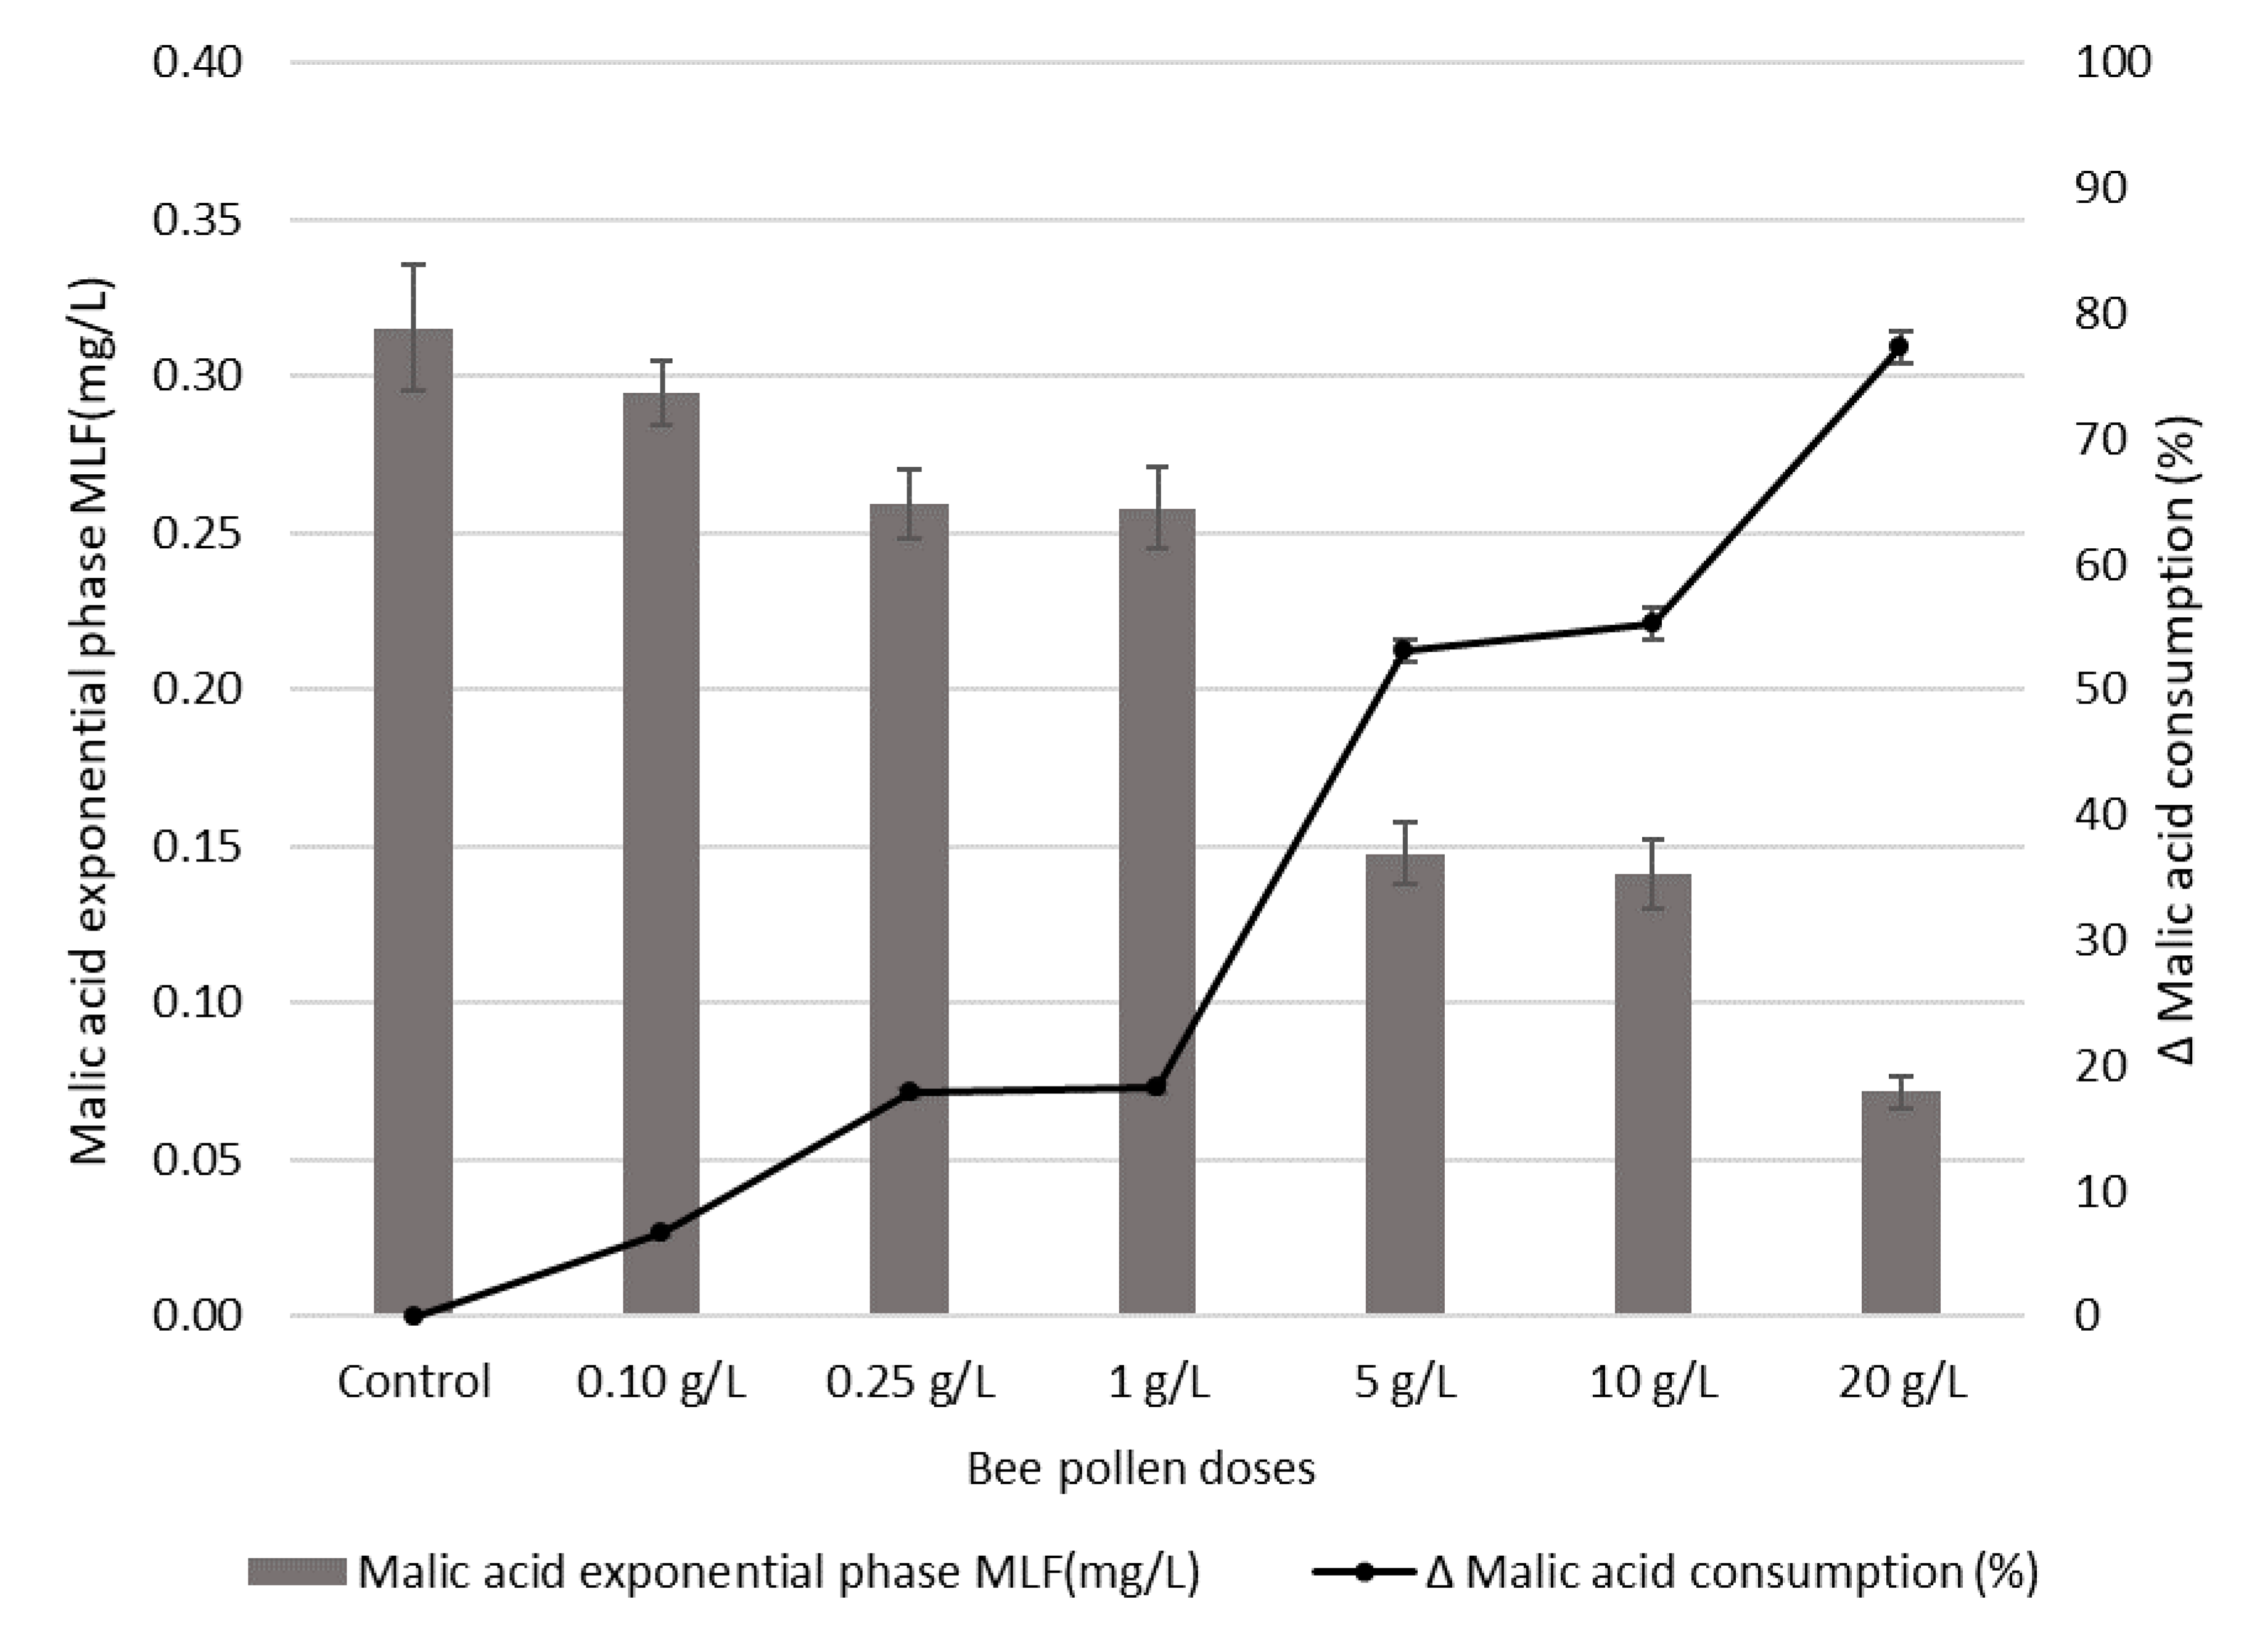
3.5. Influence of Bee Pollen Dose on Malic Acid Content during Malolactic Fermentation

After the alcoholic fermentation of the wines (<2 g/L residual sugar), they were prepared for the MLF phase by adding an inoculum of the commercial lactic bacteria Oenococcus oeni S11B P2 Instant (Laffort, France). The MLF evolution was controlled by quantifying the malic acid content in each one of the fermented and control samples after receiving their corresponding pollen doses. As can be seen in Figure 7, the use of pollen had some effect on MLF. During the exponential growth phase, the malic acid content in most of the samples decreased significantly with the pollen dose following a roughly linear correlation (R2 = 0.84), except for the 0.1 g/L dosed sample. This relationship was much more evident when the significant increase in malic acid consumption rate was observed. In this sense, two differentiated response groups could be established according to the pollen dose received. On the one hand, the low and intermediate dosed samples showed moderate increments in malic consumption rates (6.57%, 17.79% and 18.18%, for 0.1, 0.25, and 1 g/L, respectively), while the higher dosed samples presented the greatest increments (53.14% and 55.25% for 5 and 10 g/L, respectively)—particularly the 20 g/L dosed sample, with an increment of 77.31%. Pollen, therefore, has a positive effect on lactic acid bacteria growth and favors the consumption of malic acid. From the oenological point of view, this effect may be of great interest, particularly when malolactic fermentation is to be promoted in tricky wines or in those with developmental difficulties [62,63].

3.6. Evaluation of the Pollen Dose on the Physicochemical Properties and Color Parameters of the Final Wines.

Table 2 shows the effect of bee pollen on the physicochemical composition and color of Tintilla de Rota final red wines. First of all, it should be noted that no effect on their alcoholic strength was observed after the addition of pollen. However, with respect to pH, a slight increase of up to 0.1 was observed when large doses were added, compared to white wines [38]. This increment in pH at high pollen doses may foster the release of potassium, given that pollen is rich in this mineral [54,55,64] because of its high ash content (between 2% and 6% dry weight) [44,54].
In comparison to the control sample, in all the pollen added samples, there was a slight decrease in volatile acidity, and the lowest levels (0.2 units lower) were reached in 1 and 5 g/L dosed samples. The same behavior was observed in white wines when large pollen doses were used during their vinification processes [37]. Some authors have already verified that when the medium is rich in nitrogen, the production of acetic acid during the alcoholic fermentation is reduced [35,65,66]. Therefore, it is very likely that the YAN enrichment caused by the addition of pollen was also responsible for the reduction of the volatile acidity in the final wines. On the other hand, no effect from the addition of pollen was on observed on the final wines’ residual sugar contents (glucose and fructose). As expected, residual sugar contents were within the normal levels for dry wines (<2 g/L), which seemed to indicate that all the fermenters, including the control one, had completed their fermentation (Table 2).
With regards to the wines’ YAN content, it should be noted that the values in Table 2 correspond to wines that had completed their MLF. As can be seen, YAN levels generally increased (both control and pollen dosed samples) between 5% and 15% after the alcoholic fermentation had been completed (Figure 5). This observed YAN increment may have been due to the hydrolytic action exerted by lactic acid bacteria on the yeasts cell walls, thus favoring the release of nitrogen compounds (YAN) into the wines [61,67]. Thus, YAN content levels remained relatively high after completing the malolactic fermentation when large doses of pollen had been added. In the case of red wines, this could have some negative consequences, since it may favor the development of contaminating microorganisms.
With respect to the effect of pollen addition on anthocyanin’s and tannins, it did not seem to affect their contents, and only marginal fluctuations were observed. Such fluctuations in the results could be attributed to wine handling conditions and/or measurement errors. Nevertheless, IPT increased proportionally as pollen doses were greater (ANOVA, p < 0.05). Thus, 20 g/L dosed samples reached up to 45% more than the control sample’s level. This led us to think that bee pollen may have contributed to the final wine with polyphenols and other pigments [44,68,69,70] that were being quantified in IPT measurements (Abs 280 nm). Similarly, to what happened with YAN content, the extraction of polyphenols per gram of pollen was higher at low pollen doses. This polyphenol saturation effect when large doses were added has been already reported for white wines, and a similar phenomenon had been observed with regards to YAN content [37].
It can be said that this IPT increment was not quantitatively reflected in the wines’ chromatic coordinates. When the red-green color plane a* was examined, the wines that had been added pollen presented slightly lower values than the control samples, which in some cases (0.1, 0.25, and 1 g/L dosed samples) might be considered as relevant. On the other hand, an IPT increment was observed in the yellow-blue plane b* (yellow-blue) representing some of the pollen dosed samples (ANOVA, p < 0.05) (Table 2). This means that pollen may cause a minor loss of the red component (a*) and a slight increase of the yellow component (b*). Both L* (luminosity) and C* (Chroma) decreased slightly with the addition of bee pollen. All of this would imply that the pollen-added wines would have had a slightly darker color that the control wines, which could have compensated for the slight increase in b*. No correlation between these values and pollen dose amounts was observed.
The color intensity (CI) of wines showed an increase with the dose of bee pollen without any correlation. Unlike the IPT increments, which were directly associated with pollen dose amounts, the greatest CI increments were obtained when lower pollen doses had been added (0.1 and 1 g/L). A significant increase in the CI in all the cases (ANOVA, p < 0.05) and an increment of the yellow component in 0.25 g/L pollen dosed wines was reflected in their tonality (N). Again, there was no correlation between CI and IPT, so it could be affirmed that the compounds released by pollen (quantified together with IPT) did not have significant effects on the color of the wines, except for the marginal increment of the yellow component as opposed to the red (N) component.

4. Conclusions

Bee pollen is a direct source and reserve of easily assimilable nitrogen that can be used to enrich white and red grape-musts before and during alcoholic fermentation. From the kinetic point of view, pollen contributes to reducing latency times, increasing the number of yeast populations and their growth speed, and improving their survival during the final stages of alcoholic fermentation. The addition of bee pollen at low doses (0.1 and 0.25 g/L) did not alter the physicochemical composition, nor the color parameters, of the red wine. According to the experiment results, bee pollen should be considered as a valid nutrient activator with beneficial effects on red wine vinification processes.

Author Contributions

A.A.-A., P.S.-G., A.J.-C., and V.P. conceived and designed the experiments. A.A.-A. performed the experiments. All the authors analyzed the data and wrote the paper. All authors have read and agreed to the published version of the manuscript.

Funding

This research was funded by the University of Cadiz for a Ph.D. student assistantship under the program 2013-023/PU/EPIF-FPI-CT/CP.

Acknowledgments

A.A.A. gratefully thanks the University of Cadiz for a Ph.D. student assistantship under the program 2013-023/PU/EPIF-FPI-CT/CP. The authors thank the private winery from Jerez de la Frontera, Cádiz, for grape supporting.

Conflicts of Interest

The authors declare no conflict of interest.

References

  1. Suárez-Lepe, J.A. Levaduras Vínicas. Funcionalidad y Uso en Bodega; Madrid Mundi-Prensa: Madrid, Spain, 1997. [Google Scholar]
  2. Fleet, G.H. Wine Microbiology and Biotechnology; CRC Press: Boca Raton, FL, USA, 1993. [Google Scholar]
  3. Webb, L.B.; Whetton, P.H.; Barlow, E.W.R. Modelled impact of future climate change on the phenology of winegrapes in Australia. Aust. J. Grape Wine Res. 2007, 13, 165–175. [Google Scholar] [CrossRef]
  4. Bisson, L.F. Stuck and sluggish fermentations. Am. J. Enol. Vitic. 1999, 50, 107–119. [Google Scholar]
  5. Briche, E.; Beltrando, G.; Somot, S.; Quénol, H. Critical analysis of simulated daily temperature data from the ARPEGE-climate model: Application to climate change in the Champagne wine-producing region. Clim. Chang. 2014, 123, 241–254. [Google Scholar] [CrossRef]
  6. Sacchelli, S.; Fabbrizzi, S.; Menghini, S. Climate change effects and adaptation strategies in the wine sector: A quantitative literature review. Wine Econ. Policy 2016, 5, 114–126. [Google Scholar] [CrossRef] [Green Version]
  7. Jones, G.V.; White, M.A.; Cooper, O.R.; Storchmann, K. Climate change and global wine quality. Clim. Chang. 2005, 73, 319–343. [Google Scholar] [CrossRef]
  8. Ough, C.; Davenport, M.; Joseph, K. Effects of Certain Vitamins on Growth and Fermentation Rate of Several Commercial Active Dry Wine Yeasts. Am. J. Enol. Vitic. 1989, 40, 208–213. [Google Scholar]
  9. Bely, M.; Sablayrolles, J.M.; Barre, P. Description of alcoholic fermentation kinetics: Its variability and significance. Am. J. Enol. Vitic. 1990, 41, 319–324. [Google Scholar]
  10. Bataillon, M.; Rico, A.; Sablayrolles, J.M.; Salmon, J.M.; Barre, P. Early thiamin assimilation by yeasts under enological conditions: Impact on alcoholic fermentation kinetics. J. Ferment. Bioeng. 1996, 82, 145–150. [Google Scholar] [CrossRef]
  11. Reboredo-Rodríguez, P.; González-Barreiro, C.; Rial-Otero, R.; Cancho-Grande, B.; Simal-Gándara, J. Effects of Sugar Concentration Processes in Grapes and Wine Aging on Aroma Compounds of Sweet Wines—A Review. Crit. Rev. Food Sci. Nutr. 2015, 55, 1051–1071. [Google Scholar] [CrossRef]
  12. Mira de Orduña Heidinger, R. Climate change associated effects on grape and wine quality and production. Food Res. Int. 2010, 7, 1844–1855. [Google Scholar] [CrossRef]
  13. González-Barreiro, C.; Rial-Otero, R.; Cancho-Grande, B.; Simal-Gándara, J. Wine aroma compounds in grapes: A critical review. Crit. Rev. Food Sci. Nutr. 2015, 55, 202–218. [Google Scholar] [CrossRef] [PubMed]
  14. Henschke, P.A.; Jiranek, V. Yeast: Metabolism of nitrogen compounds. In Wine Microbiology and Biotechnology; CRC Press: Boca Raton, FL, USA, 1993; pp. 77–164. [Google Scholar]
  15. Bely, M.; Sablayrolles, J.-M.; Barre, P. Automatic detection of assimilable nitogen deficiencies during alcoholic fermentation in enological conditions. J. Ferment. Bioeng. 1990, 70, 246–252. [Google Scholar] [CrossRef]
  16. Barre, P.; Blondin, P.; Dequin, S.; Feuillat, M.; Sablayrolles, J.-M.; Salmon, J.-M. La levure de fermentation alcoolique. In Oenologie: Fondements Scientifiques et Technologiques; TEC and DOC Lavoisier: Paris, France, 1998; pp. 414–495. [Google Scholar]
  17. Ribéreau-Gayon, P.; Dubourdieu, D.; Donéche, B.; Lonvaud, A.; Ribéreau-Gayon, P.; Dubourdieu, D.; Donéche, B.; Lonvaud, A. Tratado de Enologia: Microbiología del Vino. Vinificaciones; Mundi Prensa: Madrid, Spain, 2003. [Google Scholar]
  18. Bell, S.-J.J.; Henschke, P. Implications of nitrogen nutrition for grapes, fermentation and wine. Aust. J. Grape Wine Res. 2005, 11, 242–295. [Google Scholar] [CrossRef]
  19. Beltran, G.; Esteve-Zarzoso, B.; Rozès, N.; Mas, A.; Guillamón, J.M. Influence of the timing of nitrogen additions during synthetic grape must fermentations on fermentation kinetics and nitrogen consumption. J. Agric. Food Chem. 2005, 53, 996–1002. [Google Scholar] [CrossRef]
  20. Kemsawasd, V.; Viana, T.; Ardö, Y.; Arneborg, N. Influence of nitrogen sources on growth and fermentation performance of different wine yeast species during alcoholic fermentation. Appl. Microbiol. Biotechnol. 2015, 99, 10191–10207. [Google Scholar] [CrossRef]
  21. Rapp, A.; Versini, G.; Rapp, A.; Versini, G. Influence of nitrogen compounds in grapes on aroma compounds of wines. Dev. Food Sci. 1995, 37, 1659–1694. [Google Scholar]
  22. Coldea, T.E.; Mudura, E.; Rotar, A.M.; Rodica, C.; Salanță, L.; Cornea, A. Chemical composition, total phenolic content and colour of red wine obtained from grapes autochthonous to Romania. J. Agroaliment. Process. Technol. 2015, 21, 181–185. [Google Scholar]
  23. Paul Schreiner, R.; Osborne, J.; Skinkis, P.A. Nitrogen requirements of pinot noir based on growth parameters, must composition, and fermentation behavior. Am. J. Enol. Vitic. 2018, 69, 45–58. [Google Scholar] [CrossRef]
  24. Stines, A.P.; Grubb, J.; Gockowiak, H.; Henschke, P.A.; Høj, P.B.; Heeswijck, R. Van Proline and arginine accumulation in developing berries of Vitis vinifera L. in Australian vineyards: Influence of vine cultivar, berry maturity and tissue type. Aust. J. Grape Wine Res. 2000, 6, 150–158. [Google Scholar] [CrossRef]
  25. Spayd, S.E.; Wample, R.L.; Evans, R.G.; Stevens, R.G.; Seymour, B.J.; Nagel, C.W. Nitrogen fertilization of white Riesling grapes in Washington. Must and wine composition. Am. J. Enol. Vitic. 1994, 45, 34–42. [Google Scholar]
  26. Wample, R.L.; Spayd, S.E.; Evans, R.G.; Stevens, R.G. Nitrogen fertilization of White Riesling grapes in Washington: Nitrogen seasonal effects on bud cold hardiness and carbohydrate reserves. Am. J. Enol. Vitic. 1993, 44, 159–167. [Google Scholar]
  27. Vilanova, M.; Siebert, T.E.; Varela, C.; Pretorius, I.S.; Henschke, P.A. Effect of ammonium nitrogen supplementation of grape juice on wine volatiles and non-volatiles composition of the aromatic grape variety Albariño. Food Chem. 2012, 133, 124–131. [Google Scholar] [CrossRef]
  28. Gutiérrez, A.; Chiva, R.; Guillamón, J.M. Arginine addition in the stationary phase influences the fermentation rate and synthesis of aroma compounds in a synthetic must fermented by three commercial wine strains. Lwt Food Sci. Technol. 2015, 60, 1009–1016. [Google Scholar] [CrossRef]
  29. Gutiérrez, A.; Chiva, R.; Sancho, M.; Beltran, G.; Arroyo-López, F.N.; Guillamon, J.M. Nitrogen requirements of commercial wine yeast strains during fermentation of a synthetic grape must. Food Microbiol. 2012, 31, 25–32. [Google Scholar] [CrossRef] [PubMed]
  30. Gutiérrez, P.; Roldán, A.; Caro, I.; Pérez, L. Kinetic study of the velum formation by Saccharomyces cerevisiae (beticus ssp.) during the biological aging of wines. Process. Biochem. 2010, 45, 493–499. [Google Scholar] [CrossRef]
  31. Gobert, A.; Tourdot-Maréchal, R.; Sparrow, C.; Morge, C.; Alexandre, H. Influence of nitrogen status in wine alcoholic fermentation. Food Microbiol. 2019, 83, 71–85. [Google Scholar] [CrossRef]
  32. Albers, E.; Larsson, C.; Lidén, G.; Niklasson, C.; Gustafsson, L. Influence of the nitrogen source on Saccharomyces cerevisiae anaerobic growth and product formation. Appl. Env. Microbiol. 1996, 62, 3187–3195. [Google Scholar] [CrossRef] [Green Version]
  33. Garde-Cerdán, T.; Ancín-Azpilicueta, C. Effect of the addition of different quantities of amino acids to nitrogen-deficient must on the formation of esters, alcohols, and acids during wine alcoholic fermentation. Lwt Food Sci. Technol. 2008, 41, 501–510. [Google Scholar] [CrossRef]
  34. Hernández-Orte, P.; Ibarz, M.J.; Cacho, J.; Ferreira, V. Effect of the addition of ammonium and amino acids to musts of Airen variety on aromatic composition and sensory properties of the obtained wine. Food Chem. 2005, 89, 163–174. [Google Scholar] [CrossRef]
  35. Arias-Gil, M.; Garde-Cerdán, T.; Ancín-Azpilicueta, C. Influence of addition of ammonium and different amino acid concentrations on nitrogen metabolism in spontaneous must fermentation. Food Chem. 2007, 103, 1312–1318. [Google Scholar] [CrossRef]
  36. Kotarska, K.; Czupryński, B.; Kłosowski, G. Effect of various activators on the course of alcoholic fermentation. J. Food Eng. 2006, 77, 965–971. [Google Scholar] [CrossRef]
  37. Amores-Arrocha, A.; Roldán, A.; Jiménez-Cantizano, A.; Caro, I.; Palacios, V. Effect on white grape must of multiflora bee pollen addition during the alcoholic fermentation process. Molecules 2018, 23, 1321. [Google Scholar] [CrossRef] [PubMed] [Green Version]
  38. Amores-Arrocha, A.; Roldán, A.; Jiménez-Cantizano, A.; Caro, I.; Palacios, V. Evaluation of the use of multiflora bee pollen on the volatile compounds and sensorial profile of Palomino fino and Riesling white young wines. Food Res. Int. 2018, 105, 197–209. [Google Scholar] [CrossRef]
  39. Sancho-Galán, P.; Amores-Arrocha, A.; Jiménez-Cantizano, A.; Palacios, V. Use of multiflora bee pollen as a flor velum yeast growth activator in biological aging wines. Molecules 2019, 24, 1763. [Google Scholar] [CrossRef] [Green Version]
  40. Human, H.; Nicolson, S.W. Nutritional content of fresh, bee-collected and stored pollen of Aloe greatheadii var. davyana (Asphodelaceae). Phytochemistry 2006, 67, 1486–1492. [Google Scholar] [CrossRef] [PubMed] [Green Version]
  41. Barth, O.M.; Almeida-Muradian, L.B.; Pamplona, L.C.; Coimbra, S.; Barth, O.M. Chemical composition and botanical evaluation of dried bee pollen pellets. J. Food Compos. Anal. 2005, 18, 105–111. [Google Scholar]
  42. Paramás, A.M.G.G.; Bárez, J.A.G.; Marcos, C.C.; García-Villanova, R.J.; Sánchez, J.S.; Gonzalez-Paramas, A.M.; Garcia-Villanova, R.J.; Gonza, A.M.; Paramás, A.M.G.G.; Bárez, J.A.G.; et al. HPLC-fluorimetric method for analysis of amino acids in products of the hive (honey and bee-pollen). Food Chem. 2006, 95, 148–156. [Google Scholar] [CrossRef]
  43. Xu, X.; Sun, L.; Dong, J.; Zhang, H. Breaking the cells of rape bee pollen and consecutive extraction of functional oil with supercritical carbon dioxide. Innov. Food Sci. Emerg. Technol. 2009, 10, 42–46. [Google Scholar] [CrossRef]
  44. Campos, M.G.R.; Bogdanov, S.; de Almeida-Muradian, L.B.; Szczesna, T.; Mancebo, Y.; Frigerio, C.; Ferreira, F. Pollen composition and standardisation of analytical methods. J. Apic. Res. 2008, 47, 154–161. [Google Scholar] [CrossRef]
  45. Mayda, N.; Özkök, A.; Ecem, N.; Yusuf, B.; Gerçek, C.; Sorkun, K. Bee bread and bee pollen of different plant sources: Determination of phenolic content, antioxidant activity, fatty acid and element profiles. J. Food Meas. Charact. 2020, 14, 1–15. [Google Scholar] [CrossRef]
  46. Salanţă, L.; Borza, N.E.; Tofană, M.; Pop, C.R.; Mudura, E.; Mihai, M. Comparison of Ferments in the Process of Functional Beverage Making. Bull. Univ. Agric. Sci. Vet. Med. Cluj Napoca Food Sci. Technol. 2018, 75, 90–92. [Google Scholar] [CrossRef]
  47. Roldán, A.; van Muiswinkel, G.C.J.; Lasanta, C.; Caro, I. Effect of the Addition of Fermentative Activators on Honey-Wine (Mead) Fermentation. In Proceedings of the 18th International Congress of Chemical and Process Engineering, Praha, Czech Republic, 24–28 August 2008; pp. 1875–2108. [Google Scholar]
  48. Roxas Clemente y Rubio, S. Ensayo Sobre las Variedades de la Vid Comun que Vegetan en Andalucía: Con un Índice Etimológico y Tres Listas de Plantas en Que se Caracterizan Varias Especies Nuevas; Imprenta de Villapando: Madrid, Spain, 1807. [Google Scholar]
  49. OIV. Office International de la Vigne et du Vin. Recl. Des. Méthodes Int. D’analyse Des. Vins Des. Moûts Édition Off. 2014, 1, 1–16. [Google Scholar]
  50. Aerny, J. Composés azotés des moûts et des vins. Rev. Suisse Vitic. Arboric. Hortic. 1997, 28, 161–168. [Google Scholar]
  51. Almela, L.; Javaloy, S.; Fernández-López, J.A.; López-Roca, J.M. Varietal classification of young red wines in terms of chemical and colour parameters. J. Sci. Food Agric. 1996, 70, 173–180. [Google Scholar] [CrossRef]
  52. Heredia, F.J.; Troncoso, A.M.; Guzmán-Chozas, M. Multivariate characterization of aging status in red wines based on chromatic parameters. Food Chem. 1997, 60, 103–108. [Google Scholar] [CrossRef]
  53. Pérez-Magariño, S.; González-San José, M.L. Polyphenols and colour variability of red wines made from grapes harvested at different ripeness grade. Food Chem. 2006, 96, 197–208. [Google Scholar] [CrossRef]
  54. Campos, M.G.; Cunha, A.; Markham, K.R. Bee-pollen: Composition, properties, and applications. In Bee products (Properties, Applications, and Apitherapy); Mizrahi, A., Lensky, Y., Eds.; Springer: Boston, MA, USA, 1997; pp. 93–100. ISBN 0-306-45502-1. [Google Scholar]
  55. Da Silva, G.R.; da Natividade, T.B.; Camara, C.A.; da Silva, E.M.S.; dos Santos, F.D.; Silva, T.M.S. Identification of Sugar, Amino Acids and Minerals from the Pollen of Jandaíra Stingless Bees (Melipona subnitida). Food Nutr. Sci. 2014, 5, 1015–1021. [Google Scholar]
  56. Roldán, A.; Van Muiswinkel, G.C.J.; Lasanta, C.; Palacios, V.; Caro, I. Influence of pollen addition on mead elaboration: Physicochemical and sensory characteristics. Food Chem. 2011, 126, 574–582. [Google Scholar] [CrossRef]
  57. Stanley, G.A.; Douglas, N.G.; Every, E.J.; Tzanatos, T.; Pamment, N.B. Inhibition and stimulation of yeast growth by acetaldehyde. Biotechnol. Lett. 1993, 15, 1199–1204. [Google Scholar] [CrossRef]
  58. De-Melo, A.A.M.; Estevinho, L.M.; Moreira, M.M.; Delerue-Matos, C.; Freitas, A.D.S.D.; Barth, O.M.; Almeida-Muradian, L.B.D. Phenolic profile by HPLC-MS, biological potential, and nutritional value of a promising food: Monofloral bee pollen. J. Food Biochem. 2018, 42, e12536. [Google Scholar] [CrossRef] [Green Version]
  59. Matei, F.; Toma, A.; Filofteia, C.; Moraru, A.; Constantinescu-aruxandei, D. Bee Collected Pollen with Enhanced Health Benefits, Produced by Fermentation with a Kombucha Consortium. Nutrients 2018, 10, 1365. [Google Scholar]
  60. Togores, J.H. Tratado de Enología I; Ediciones Mundi-Prensa Libros: Madrid, Spain, 2011. [Google Scholar]
  61. Ribéreau-Gayon, P.; Dubourdieu, D.; Donéche, B.; Donéche, B.; Lonvaud, A.; Glories, Y.; Maugean, A. Traité D’oenologie: Microbiologie du Vin. Vinifications, 3rd ed.; Dunod Editions: Paris, France, 2017. [Google Scholar]
  62. Zeeman, W.; Snyman, J.P.; van Wyk, C.J. The influence of yeast strain and malolactic fermentation on some volatile bouquet substances and on quality of table wines. Proc. Univ. Calif. Davis Grape Wine Centen. Symp. 1982, 79–90. [Google Scholar]
  63. Davis, C.R.; Wibowo, D.; Eschenbruch, R.; Lee, T.H.; Fleet, G.H. Practical implications of malolactic fermentation: A review. Am. J. Enol. Vitic. 1985, 36, 290–301. [Google Scholar]
  64. Conrad, R. Bee Pollen—An Overview. The Magazine of the Beekeper. 2017. Available online: https://www.beeculture.com/bee-pollen-overview-2/ (accessed on 17 May 2018).
  65. Barbosa, C.; Falco, V.; Mendes-Faia, A.; Mendes-Ferreira, A. Nitrogen addition influences formation of aroma compounds, volatile acidity and ethanol in nitrogen deficient media fermented by Saccharomyces cerevisiae wine strains. J. Biosci. Bioeng. 2009, 108, 99–104. [Google Scholar] [CrossRef]
  66. Fairbairn, S.; McKinnon, A.; Musarurwa, H.T.; Ferreira, A.C.; Bauer, F.F. The impact of single amino acids on growth and volatile aroma production by Saccharomyces cerevisiae strains. Front. Microbiol. 2017, 8, 2554. [Google Scholar] [CrossRef] [Green Version]
  67. Lonvaud-Funel, A.; Joyeux, A.; Desens, C. Inhibition of malolactic fermentation of wines by products of yeast metabolism. J. Sci. Food Agric. 1988, 44, 183–191. [Google Scholar] [CrossRef]
  68. Silva, T.M.S.; Camara, C.A.; da Silva Lins, A.C.; Maria Barbosa-Filho, J.; da Silva, E.M.S.; Freitas, B.M.; de Assis Ribeiro dos Santos, F. Chemical composition and free radical scavenging activity of pollen loads from stingless bee Melipona subnitida Ducke. J. Food Compos. Anal. 2006, 19, 507–511. [Google Scholar] [CrossRef]
  69. Silva, T.M.S.; Camara, C.A.; Lins, A.C.S.; Agra, M.d.F.; Silva, E.M.S.; Reis, I.T.; Freitas, B.M. Chemical composition, botanical evaluation and screening of radical scavenging activity of collected pollen by the stingless bees Melipona rufiventris (Uruçu-amarela). Acad. Bras. Cienc. 2009, 81, 173–178. [Google Scholar] [CrossRef]
  70. Bogdanov, S. Pollen: Production, Nutrition and Health: A Review. 2017. Available online: https://www.bee-hexagon.net/pollen/ (accessed on 4 May 2018).
Figure 1. Comparison of the increase in yeast assimilable nitrogen (YAN) per pollen dose versus the increase in YAN produced per gram of bee pollen in red Tintilla de Rota grape-must. Different letters mean significant differences between samples (ANOVA, p < 0.05).
Agronomy 10 00634 g001
Figure 2. Relative density evolution during alcoholic fermentation of Tintilla de Rota grape-must with different pollen doses.
Agronomy 10 00634 g002
Figure 3. Development of viable biomass of Saccharomyces cerevisiae yeast during the process of alcoholic fermentation of the Tintilla de Rota-must using different doses of bee pollen and control. CFU: colony forming unit.
Agronomy 10 00634 g003
Figure 4. Increase in yeast populations during alcoholic fermentation of Tintilla de Rota grape-must with different bee pollen doses. Different letters mean significant differences between samples (ANOVA, p < 0.05).
Agronomy 10 00634 g004
Figure 5. Evolution of YAN in Tintilla de Rota red grape-musts with different doses of pollen during alcoholic fermentation.
Agronomy 10 00634 g005
Figure 6. YAN/CFU consumption during the exponential growth phase of fermented Tintilla de Rota grape-must with different doses of multiflora bee pollen. Different letters mean significant differences between samples (ANOVA, p < 0.05).
Agronomy 10 00634 g006
Figure 7. Malic acid concentration during the exponential phase of bacterial growth, as opposed to the increase in consumption speed (%).
Agronomy 10 00634 g007
Table 1. Physicochemical composition of the must of Tintilla de Rota with the addition of pollen (control, 0.1, 0.25, 1, 5, 10, and 20 g/L).
ParametersTintilla de Rota Grape Must Bee Pollen Doses
Control0.1 g/L0.25 g/L1 g/L5 g/L10 g/L20 g/L
Sugar (g/L)240.7 ± 0.8 a240.7 ± 0.8 a244.3 ± 0.6 a243.3 ± 0.6 a241.2 ± 0.8 a257.6 ± 0.5 b256.4 ± 0.0 b
Total acidity (g/L TH2)5.28 ± 0.03 a5.28 ± 0.03 a5.28 ± 0.03 a5.28 ± 0.03 a5.22 ± 0.03 a5.34 ± 0.03 a5.99 ± 0.03 b
pH3.67 ± 0.01 a3.68 ± 0.01 a3.71 ± 0.01 a,b,c3.72 ± 0.01 a,b,c3.73 ± 0.01 a,b,c3.78 ± 0.01 b,c3.80 ± 0.01 c
YAN (mg/L)140 ± 0 a145 ± 4 a162 ± 4 b170 ± 1 c179 ± 4 d185 ± 8 e208 ± 4 f
Different superscript letters mean a significant difference between the samples (p < 0.05), determined by two-way ANOVA, applying the Bonferroni multiple analysis Test (BSD).
Table 2. Physicochemical composition of Tintilla de Rota wines with different doses of pollen (control, 0.1, 0.25, 1, 5, 10, and 20 g/L).
ParametersTintilla de Rota Grape Wines Bee Pollen Doses
Control0.1 g/L0.25 g/L1 g/L5 g/L10 g/L20 g/L
% Alcohol v/v13.97 ± 0.06 a,b13.97 ± 0.14 a,b14.22 ± 0.03 a14.15 ± 0.03 a13.65 ± 0.07 b14.14 ± 0.03 a13.89 ± 0.08 a,b
pH3.79 ± 0.01 a,b3.73 ± 0.02 b3.84 ± 0.01 a,b3.84 ± 0.01 a,b3.81 ± 0.01 a,b3.89 ± 0.01 a3.90 ± 0.01 a
Total Acidity (g/L)4.83 ± 0.04 a4.88 ± 0.01 a4.83 ± 0.04 a4.93 ± 0.04 a4.88 ± 0.01 a4.93 ± 0.04 a4.78 ± 0.04 a
Volatile Acidity (g/L)0.63 ± 0.01 a0.56 ± 0.01 b0.58 ± 0.02 b0.44 ± 0.01 c0.44 ± 0.01 c0.50 ± 0.01 d0.53 ± 0.01 e
Glucose (g/L)0.378 ± 0.002 a0.282 ± 0.002 b,c,d,e0.291 ± 0.000 c,d,e0.384 ± 0.004 a0.375 ± 0.005 a0.282 ± 0.001 d0.294 ± 0.004 e
Fructose (g/L)0.293 ± 0.008 a0.371 ± 0.007 b0.297 ± 0.001 a0.324 ± 0.003 c0.270 ± 0.002 d,f0.254 ± 0.004 e0.273 ± 0.000 f
YAN* (mg/L)92 ± 4 a110 ± 4 b119 ± 6 c127 ± 4 d166 ± 8 e179 ± 4 f226 ± 8 g
Anthocyanin (mg/L)777.13 ± 1.24 a833.13 ± 1.24 b725.50 ± 0.01 c,d,e772.31 ± 0.62 a709.31 ± 0.62 d743.44 ± 0.62 e795.94 ± 0.62 a
Tannins (g/L)2.65 ± 0.01 a2.67 ± 0.01 a2.61 ± 0.01 a2.74 ± 0.01 b2.59 ± 0.01 a2.51 ± 0.01 c2.40 ± 0.01 d
TPI60.48 ± 1.81 a66.38 ± 0.89 b74.36 ± 0.41 c75.48 ± 0.47 c79.53 ± 0.84 d83.56 ± 1.66 e88.72 ± 0.98 f
L*78.092 ± 0.030 a75.999 ± 0.048 a77.810 ± 0.010 a75.593 ± 0.035 a75.593 ± 0.035 a77.721 ± 0.023 a77.984 ± 0.172 a
a*19.959 ± 0.066 a16.297 ± 0.060 b18.332 ± 0.025 c,e14.429 ± 0.025 d18.625 ± 0.023 e18.642 ± 0.014 e18.745 ± 0.079 e
b*5.256 ± 0.095 a6.446 ± 0.160 b7.006 ± 0.041 c5.890 ± 0.066 d,e6.092 ± 0.391 e,f5.434 ± 0.005 a6.158 ± 0.483 f
C*20.64 ± 0.06 a17.53 ± 0.01 b19.63 ± 0.03 c,f15.58 ± 0.05 d,e15.58 ± 0.05 e19.42 ± 0.01 f19.73 ± 0.22 f
Tone (N)0.631 ± 0.001 a0.609 ± 0.001 a0.742 ± 0.001 b,f0.665 ± 0.002 c,d0.682 ± 0.002 d,e0.689 ± 0.001 e0.733 ± 0.002 f
Colorant Intensity (IC)0.795 ± 0.001 a1.226 ± 0.008 b0.935 ± 0.001 c,f,g1.150 ± 0.001 d0.949 ± 0.001 e,f0.922 ± 0.001 f,g0.897 ± 0.001 g
Different superscript letters indicate that there are significant differences between the samples (p < 0.05), obtained by bidirectional ANOVA, applying the Bonferroni multiple analysis test (BSD). YAN*: After MLF. CIELab coordinates: a* (red/ green), b* (yellow/blue), L* (Lightness) and C* (Chroma).

