Article

Phenolic Content, Color Development, and Pigment−Related Gene Expression: A Comparative Analysis in Different Cultivars of Strawberry during the Ripening Process

by
Carolina Parra-Palma
1,2,
Luis Morales-Quintana
3,* and
Patricio Ramos
1,4,*
1
Instituto de Ciencias Biológicas, Universidad de Talca, 2 Norte 685, 3460000 Talca, Chile
2
Programa de Doctorado en Ciencias Mención Ingeniería Genetica Vegetal, Universidad de Talca, 3460000 Talca, Chile
3
Multidisciplinary Agroindustry Research Laboratory, Instituto de Ciencias Biomédicas, Universidad Autónoma de Chile, 3460000 Talca, Chile
4
Núcleo Científico Multisdiciplinario-DI, Universidad de Talca, 3460000 Talca, Chile
*
Authors to whom correspondence should be addressed.
Agronomy 2020, 10(4), 588; https://doi.org/10.3390/agronomy10040588
Submission received: 13 March 2020 / Revised: 14 April 2020 / Accepted: 16 April 2020 / Published: 20 April 2020

Abstract

:
Globally, the strawberry is one of the most widely consumed fruits, but under certain environmental conditions, it exhibits inadequate red color development, causing economic losses due to lower product quality. In order to evaluate if changes in color are cultivar-specific and environmentally dependent, a comparative study of anthocyanin accumulation, total phenolic, total flavonoid content analysis and additionally a transcriptional profile of pigment-related genes in “Camarosa,” “Cristal,” “Monterey,” and “Portola” (four strawberry cultivars) was performed. These showed an increase in their red coloration during fruit development. The anthocyanin accumulation in the four cultivars was related to the particular progress of the transcriptional activity of genes involved in the biosynthesis of flavonoid pigments. The greatest increase was observed in “Monterey” and “Camarosa”; thus, we have found a correlation between fruit color redness and total anthocyanins only in these cultivars. However, a positive correlation between the mRNA abundance of FaF3′H and FaFLS and the total flavonoids content was found in all cultivars at early stages of ripening. Finally, we found correlations between color and other important physiological properties such as SSC/TA, weight, and aroma expressed as total esters. These results could be useful in making decisions in future breeding programs to improve the content of healthy compound content in strawberry fruit.

1. Introduction

Fruit quality has many aspects, including the sensorial qualities of the fruit such as texture, appearance, skin color, sweetness, and aroma [1], as well as shelf life, processing qualities, resistance to pre- and postharvest pathogens [2], and nutritional properties. In recent years, special attention has been given to berries due to their low caloric content and high amount of potential bioactive compounds, such as polyphenols, fiber, minerals, and vitamins [3,4,5]. In this sense, strawberries are a rich source of polyphenolic compounds [5,6] and are among the most widely consumed fruits in the world [7].
The commercial strawberry (Fragaria x ananassa Duch.) fruit emerged in the mid-1700s from two octoploid strawberries (Fragaria chiloensis and Fragaria virginiana) product of an accidental hybridization [8,9]. Thus far more than 1000 different cultivars are preserved in germplasm collections worldwide [8,10].
The coast of the Maule and Metropolitan regions in Chile, with around of 85% of Chilean production, are the two main strawberry producers (http://www.odepa.gob.cl/). “Camarosa” is the most important cultivar planted, followed by the “Cristal,” “Monterey,” and “Portola” [7].
In general, the skin color of the fruits is a key quality attribute required by the consumer. In strawberry skin, the red color is a consequence of anthocyanin biosynthesis and accumulation [5,6,11,12,13,14,15,16]. The major anthocyanins in strawberry have been identified as pelargonidin- and cyanidin- glycosides or their acylated forms [16,17,18,19]. The gene expression and the activation for anthocyanin biosynthesis enzymes are influenced by three main factors: (i) cultural practices, (ii) climatic conditions, and (iii) phenological stages. Regarding the first factor, the application of abscisic acid (ABA) or 2−chloroethylphosphonic acid (ethephon) is used in some countries, such as the USA, Australia, Chile, and Italy [20,21], to obtain homogeneous color. Regarding the second factor, anthocyanin accumulation in grapes is suppressed by high temperature and low light intensity [22]. Regarding the third factor, genetic factors, which depend on the specific cultivar, strongly affect anthocyanin accumulation. For this reason, the transcriptional levels of genes involved in the first part of the phenylpropanoid metabolic pathway have been analyzed, and there are strong differences in expression among species that could explain differences in their phenolic composition [23].
In strawberry and all the Fragaria genus, fruit color is determined by the accumulation of anthocyanins (Figure 1), the second most abundant flavonoid-derived constituents in strawberry fruit [24,25]. Anthocyanins are water-soluble compounds that provide color to plant tissues with color ranging from red, purple, to blue depending on the vacuolar pH and their structural composition [26]. The most important compound, pelargonidin 3−glucoside, is the anthocyanin pigment responsible for the red color of fruit in the genus Fragaria [6,27]. First, during development and ripening, the different strawberry cultivars exhibited differences in the color of the receptacle and achenes, that were previously associated with an increase in anthocyanin synthesis [28].
On the other hand, considering the importance of fruit skin color and nutritional properties, which are traits used to consider fruit quality, information about phenylpropanoid biosynthesis and accumulation and its relationship with culture and climatic conditions is still scarce. In this sense, we hypothesize that different strawberry cultivars grown under the same crop management and edaphoclimatic conditions would present differences in the skin fruit color and nutritional properties only if the expression level of corresponding genes were different. The aim of this work was to compare the anthocyanin, flavonoid, and phenolic accumulation profiles in “Camarosa,” “Crystal,” “Monterey.” and “Portola,” the most important cultivars planted in the Maule region. These cultivars were grown in the same commercial orchard (Figure 2), in order to establish a relationship between compound concentration, transcript abundance of related genes, and skin fruit color evaluated at four stages of fruit from each strawberry cultivar.

2. Materials and Methods

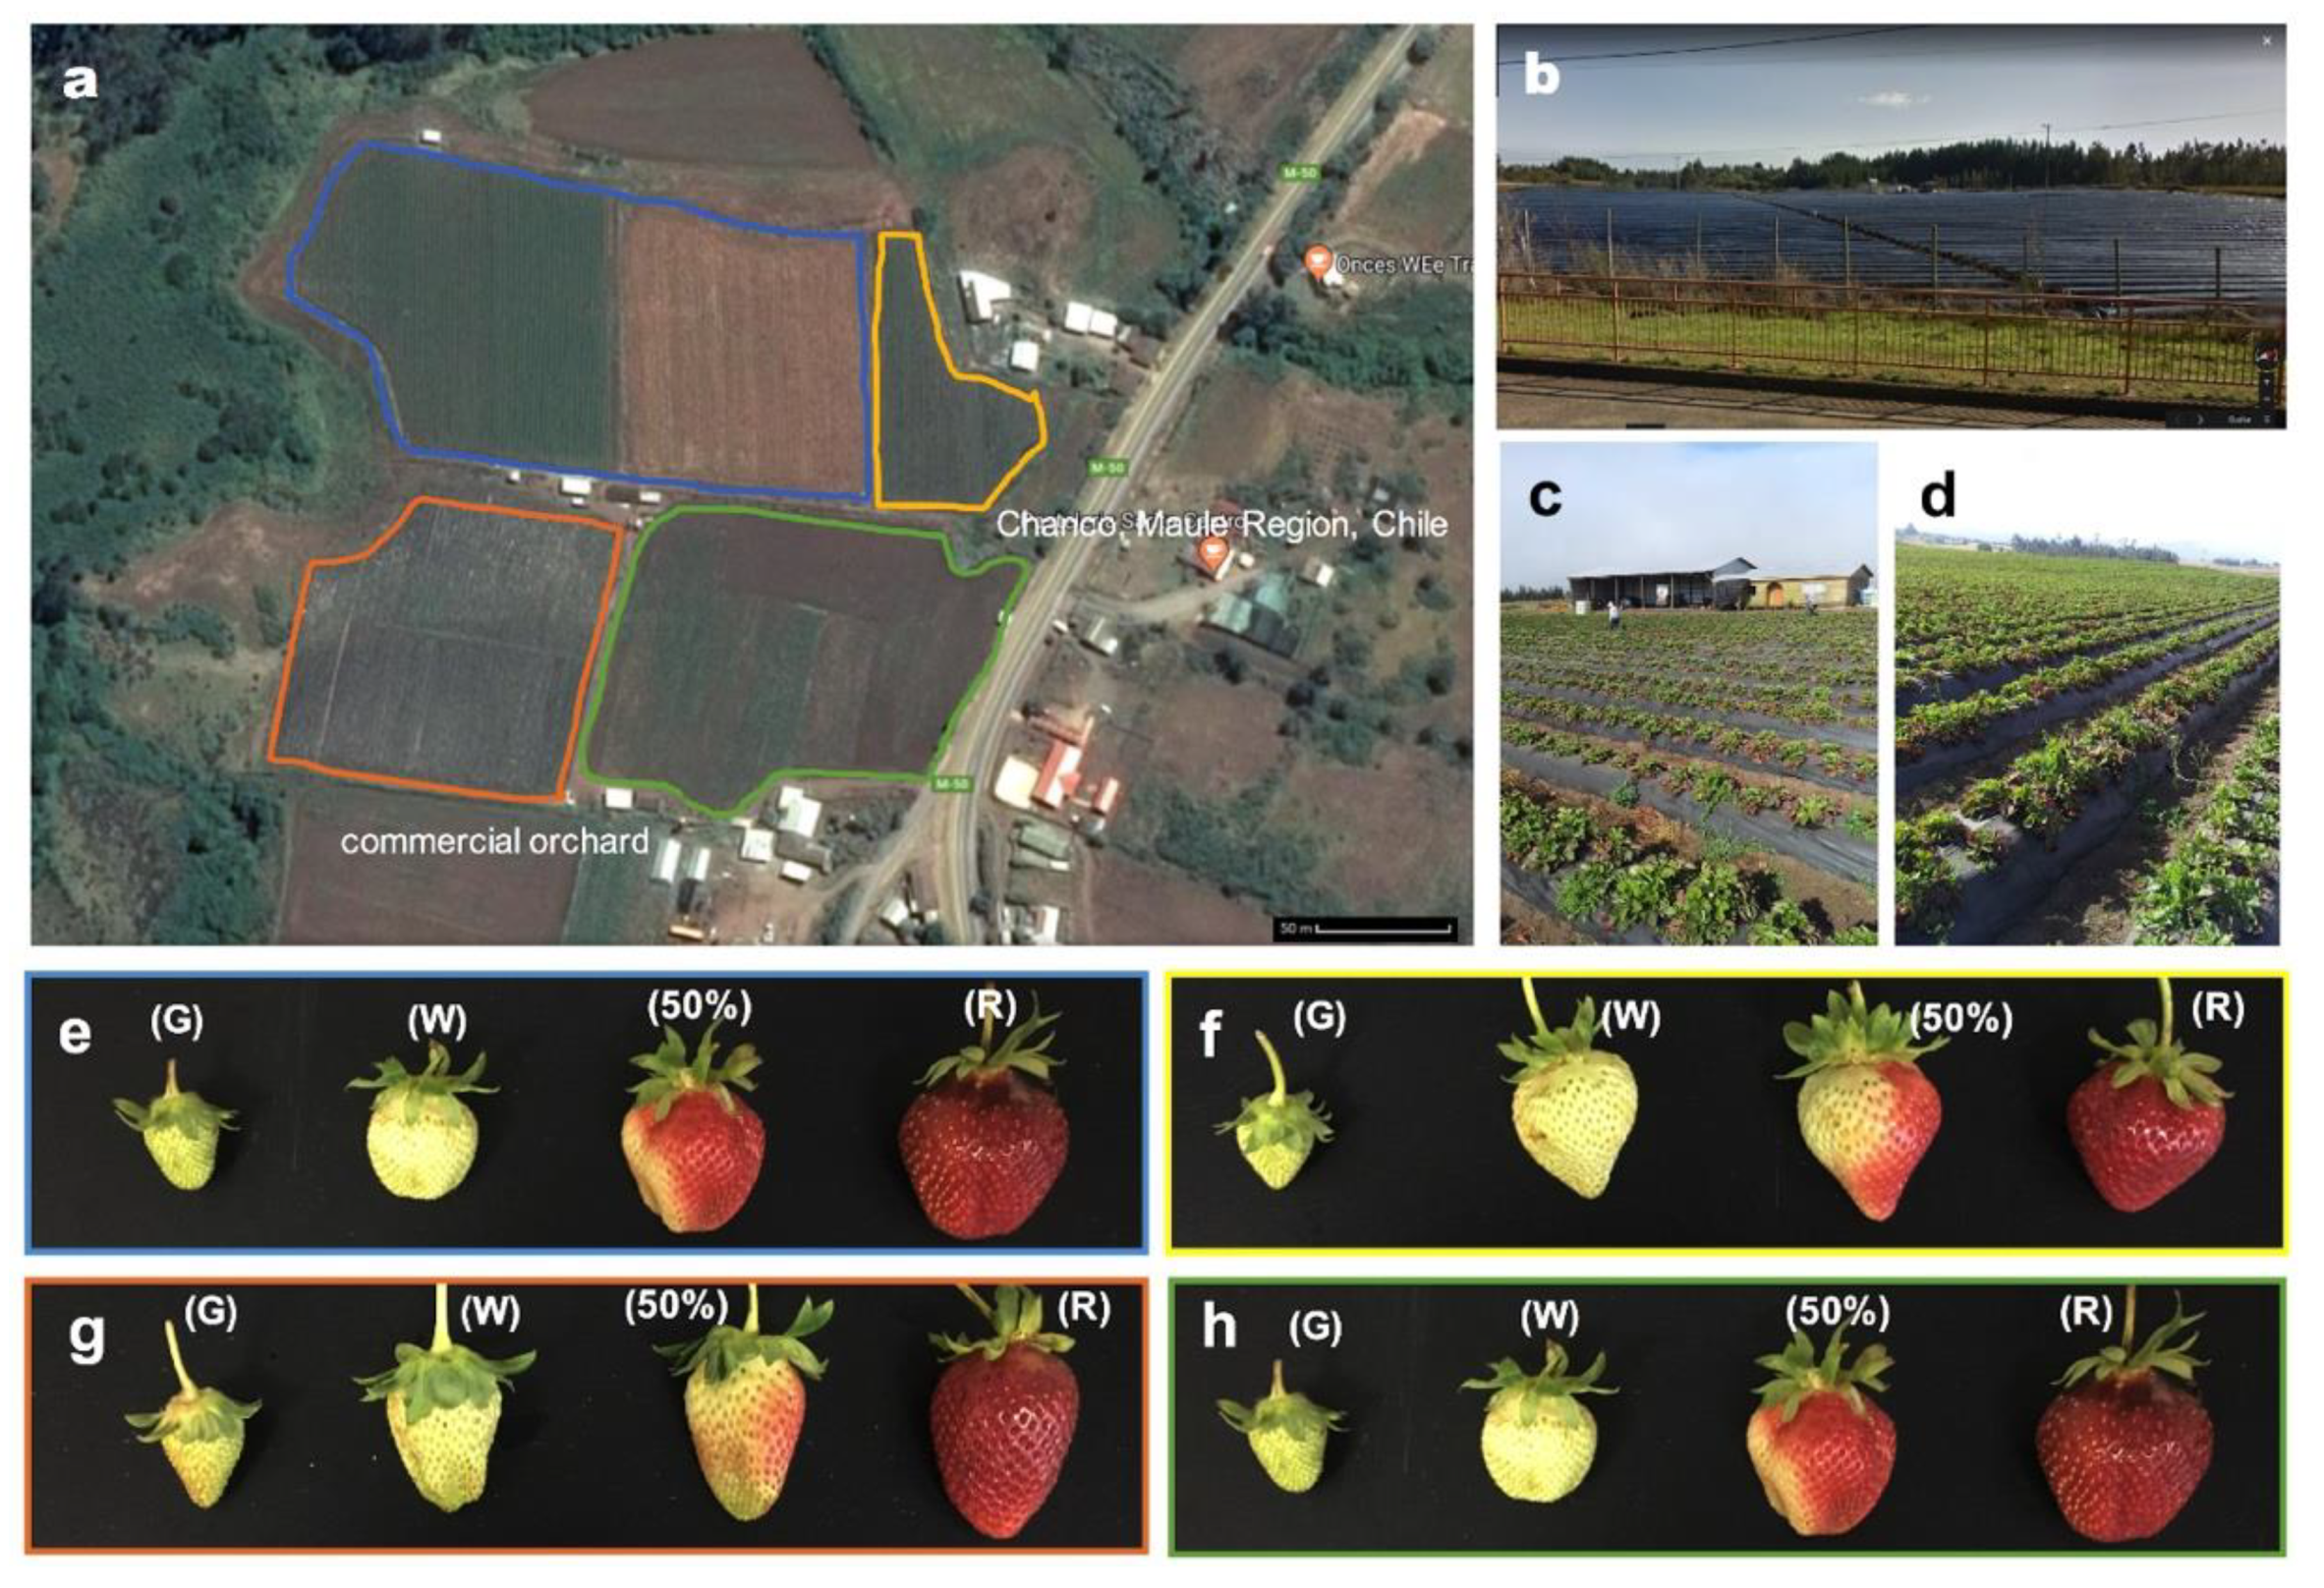
2.1. Vegetal Material

Fruit from “Camarosa,” “Crystal,” “Monterey.” and “Portola” were harvested from plants in their second year of production. All plants were grown in a commercial orchard in Chanco, Maule Region, Chile (latitude 35°44′00′’ S; longitude 72°32′00′’ W) (Figure 1). The fruits of the four cultivars were collected from 50 different plants (one or two fruit of each stage per plants were obtained) at 09:00 with an atmospheric temperature ranging from 15 °C to 17 °C. Fruit were classified into four different developmental stages based on the classification described by Rosli et al. 2004 [29] and implemented in the laboratory in Ramos et al. (2018) [7] (Figure 1). For each developmental stage of each cultivar, a total of 80 fruit were collected from each of two growing seasons (2018 and 2019).

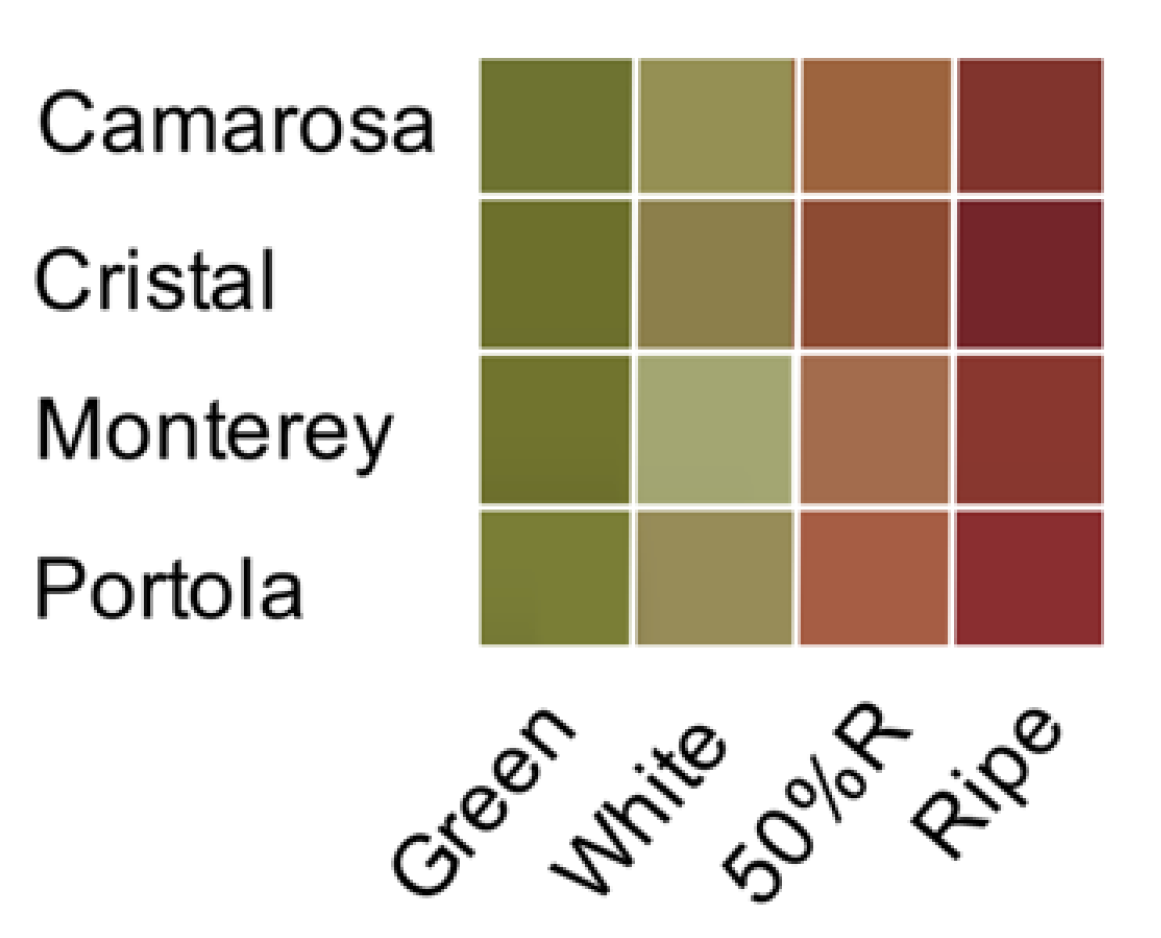
2.2. Skin Color Determination

Twenty fruit from each cultivar and development stages (large green, white, 50%R and ripe stage) without external damage were examined for skin fruit color. The surface color of the different fruits was characterized using a model CR−400 colorimeter (Konica Minolta, Tokyo, Japan) and expressed in terms of the Hunter scale (L*, a*, b*). The schematic representation of the CIELAB color system was obtained by Nix Color converter (https://www.nixsensor.com/free−color−converter/). Each fruit was then cut into pieces, frozen in liquid nitrogen, and stored at −80 °C until further use.

2.3. RNA Isolation, Reverse Transcription, and qRT−PCR Analysis

Total RNA from frozen fruit was isolated using CTAB method based on Ramos et al. (2018) [7]. The TURBO DNA-free™ Kit (Ambion, Carlsbad, California, USA) was used according to the manufacturer’s procedure to remove the contaminant genomic DNA. Three independent RNA extractions were carried out from each frozen pool of samples. The concentration of the RNA and the integrity were determined by Qubit 3 Fluorometer (Invitrogen, Carlsbad, CA, USA) and agarose gel, respectively. Meanwhile, the First−strand cDNA synthesis was performed using a First Strand cDNA Synthesis Kit (Fermentas Life Science, Glen Burnie, MD, USA) following the manufacturer’s instructions.
The mRNA abundance of the FaPAL1, FaCHS1, FaCHS2, FaF3H, FaF3′H, FaFLS, FaANS, and FaANR transcripts was measured by quantitative real-time PCR (qRT-PCR). Reactions and quantifications were performed following the procedure described by Ramos et al. (2018) [7] and Parra-Palma et al. (2019) [30]. The primers used for qRT-PCR analysis were based on Pillet et al. (2015) [31] (see Supplementary Table S1). Amplification reactions were performed using KAPA SYBR® FAST qPCR Kit Master Mix (2x) Universal (Kapa Biosystems, Sigma-Aldrich, Cleveland, OH, USA) in a Step One Real-Time PCR system (Applied Biosystems, Carlsbad, CA, USA) according to the manufacturer’s instructions and using the methodology previously published by Ramos et al. (2018) [7] and Parra-Palma et al. (2019) [30] and normalized against F. x ananassa glyceraldehyde-3-phosphate-dehydrogenase 1 (FaGAPDH1) gene’s expression level [32]. Data obtained from three biological replicates (ten fruit each) were analyzed by two-way ANOVA test using the factors of cultivar and the developmental stage of fruit. Afterward, Tukey’s HSD multiple comparisons analysis was performed. Differences were considered significant at p ≤ 0.05. The analyses were performed with GraphPad Prism 6 (GraphPad Software Inc., San Diego, CA, USA).

2.4. Total Phenolic, Flavonoid and Anthocyanin Content

Complete fruit tissues were homogenized in a 1% HCl solution prepared in methanol (5 L kg−1 of fruit) with the help of a mortar and pestle. The extracts were stirred for 1.5 h at room temperature and then centrifuged at 4200 × g, and the supernatant was recovered. Three independent extractions from 10 g of the fruit tissue were carried out for each strawberry cultivar and each stage. The obtained extracts were used to determine the total phenolic, anthocyanin and flavonoid content based on Parra-Palma et al. (2018) [5].
First, the total phenolic content was determined using the method of Singleton et al. (1999) [33]. In short, a dilute extract was oxidized with the Folin–Ciocalteu reagent and then neutralized with sodium carbonate. The absorbance of the resulting blue color was measured at 700 nm after 30 min using the Epoch 2 microplate spectrophotometer (BioTek Instruments, Inc., Winooski, VT, USA). Quantification was performed based on a standard curve of gallic acid; the results are expressed as g of gallic acid equivalents per kg of fruit (g kg−1 GAE) and correspond to the means ± SEs of three biological replicates with two more technical replicates.
Second, the total flavonoid content of the samples was determined by the aluminum chloride colorimetric method based on Chang et al. (2002) [34]. Quercetin was used as a reference for the calibration curve. In short, quercetin was dissolved in an 80% ethanol solution and then diluted to 25, 50 and 100 mg L−1. The dilute solutions (0.5 mL) were each mixed with 1.5 mL of 95% ethanol, 0.1 mL of 10% aluminum chloride, 0.1 mL of 1 M potassium acetate, and 2.8 mL distilled water and incubated for 30 min at room temperature. The absorbance of each strawberry/methanol extract (0.5 mL) was measured at 415 nm in the Epoch 2 microplate spectrophotometer (BioTek). The results are expressed as g of quercetin equivalents per kg of fruit (g kg−1 quercetin) and correspond to the means ± SEs of three biological replicates and two technical replicates.
Third, the anthocyanin concentration in the extracts was determined by the pH differential method as described by Lee et al. (2008) [35]. The sample (0.15 mL) was separately mixed with 0.75 mL and dissolved in potassium chloride solution (KCl, 0.025 M, pH 1.0) and sodium acetate (CH3CO2Na ∙ 3H2O, 0.4 M, pH 4.5). After incubation at room temperature for 50 min, the absorbance values at 524 nm and 700 nm were measured. The anthocyanin content was expressed as g of cyanidin 3-glucoside equivalents per kg of fruit (g kg−1 Cy3G) using the absorbance value of A = (A524−A700 nm) pH 1.0 - (A524–A700 nm) pH 4.5, with a molar extinction coefficient of 26,900. Data from biological triplicates were analyzed by two-way ANOVA test using the factors of cultivar and the developmental stage of fruit. Then, Tukey’s HSD multiple comparisons analysis was performed. Differences were considered significant at p ≤ 0.05. The analyses were performed with GraphPad Prism 6 (GraphPad Software Inc., San Diego, CA, USA).

2.5. Correlation Analysis

The different experiments were perform using a completely randomized design. A one-way ANOVA was carried out to determine the significances of differences at p = 0.05 according to Fisher’s least significant difference (LSD) test. Using Pearson’s correlation coefficient, the different correlation was evaluated. Prism 6 program (GraphPad software Inc., San Diego, CA, USA) was used to carry out all statistical analysis.

3. Results and Discussion

3.1. Color Development and Color Quality

In the present work, we analyzed the change in color using the CIELAB color system, in which we can evaluate the lightness (L*), redness (a*), and yellowness (b*) of fruit from four different strawberry cultivars. As expected, the color of the receptacles is increasingly red between each stage of development and in the ripe fruit from all cultivars evaluated (Figure 3 and Supplementary Table S2). Thus, differences in fruit color during the development and ripening of fruit from the four cultivars were characterized by a decrease in L* and b* along with an increase in a*, and the highest value of a* was observed in fruit at the ripe stage in each cultivar (Supplementary Table S2). The major differences between the cultivars were observed in the 50%R stage, which can be explained by bicolor peel present in the fruit (including red and yellow parts). This could be related with the greater standard deviation at this stage in all cultivars. In the CIELAB color system, these changes in a* indicate a decrease in the fruit brightness and the acquisition of a red color (Figure 3), this changes of the a* value or acquisition of the red color in the receptacle is caused by the predominance of anthocyanin compounds [5,6,11,12,13,14,15,16,17,19]. Additionally, even when no significant differences were observed among ripe fruit from the four cultivars, there was a higher a* value in “Monterey,” followed by “Portola.” Fruit from “Cristal” exhibited the lowest value of a* (Supplementary Table S2). Our results showed the highest a* values at the ripe stage, while the lightness value decreased in the four cultivars as the fruit ripened (Figure 3 and suppl. Table S2). These results agree with values previously reported in other strawberry cultivars [36,37,38]. For example, Ganhão et al. (2019) [39] described similar result respect to the red color in the ripe stages of three cultivars from western Portugal region (“Primoris,” “Endurance,” and “Portola”). These authors showed that for a* values of whole strawberry fruits, no significant differences were found in any of the cultivars, which revealed a similar redness.

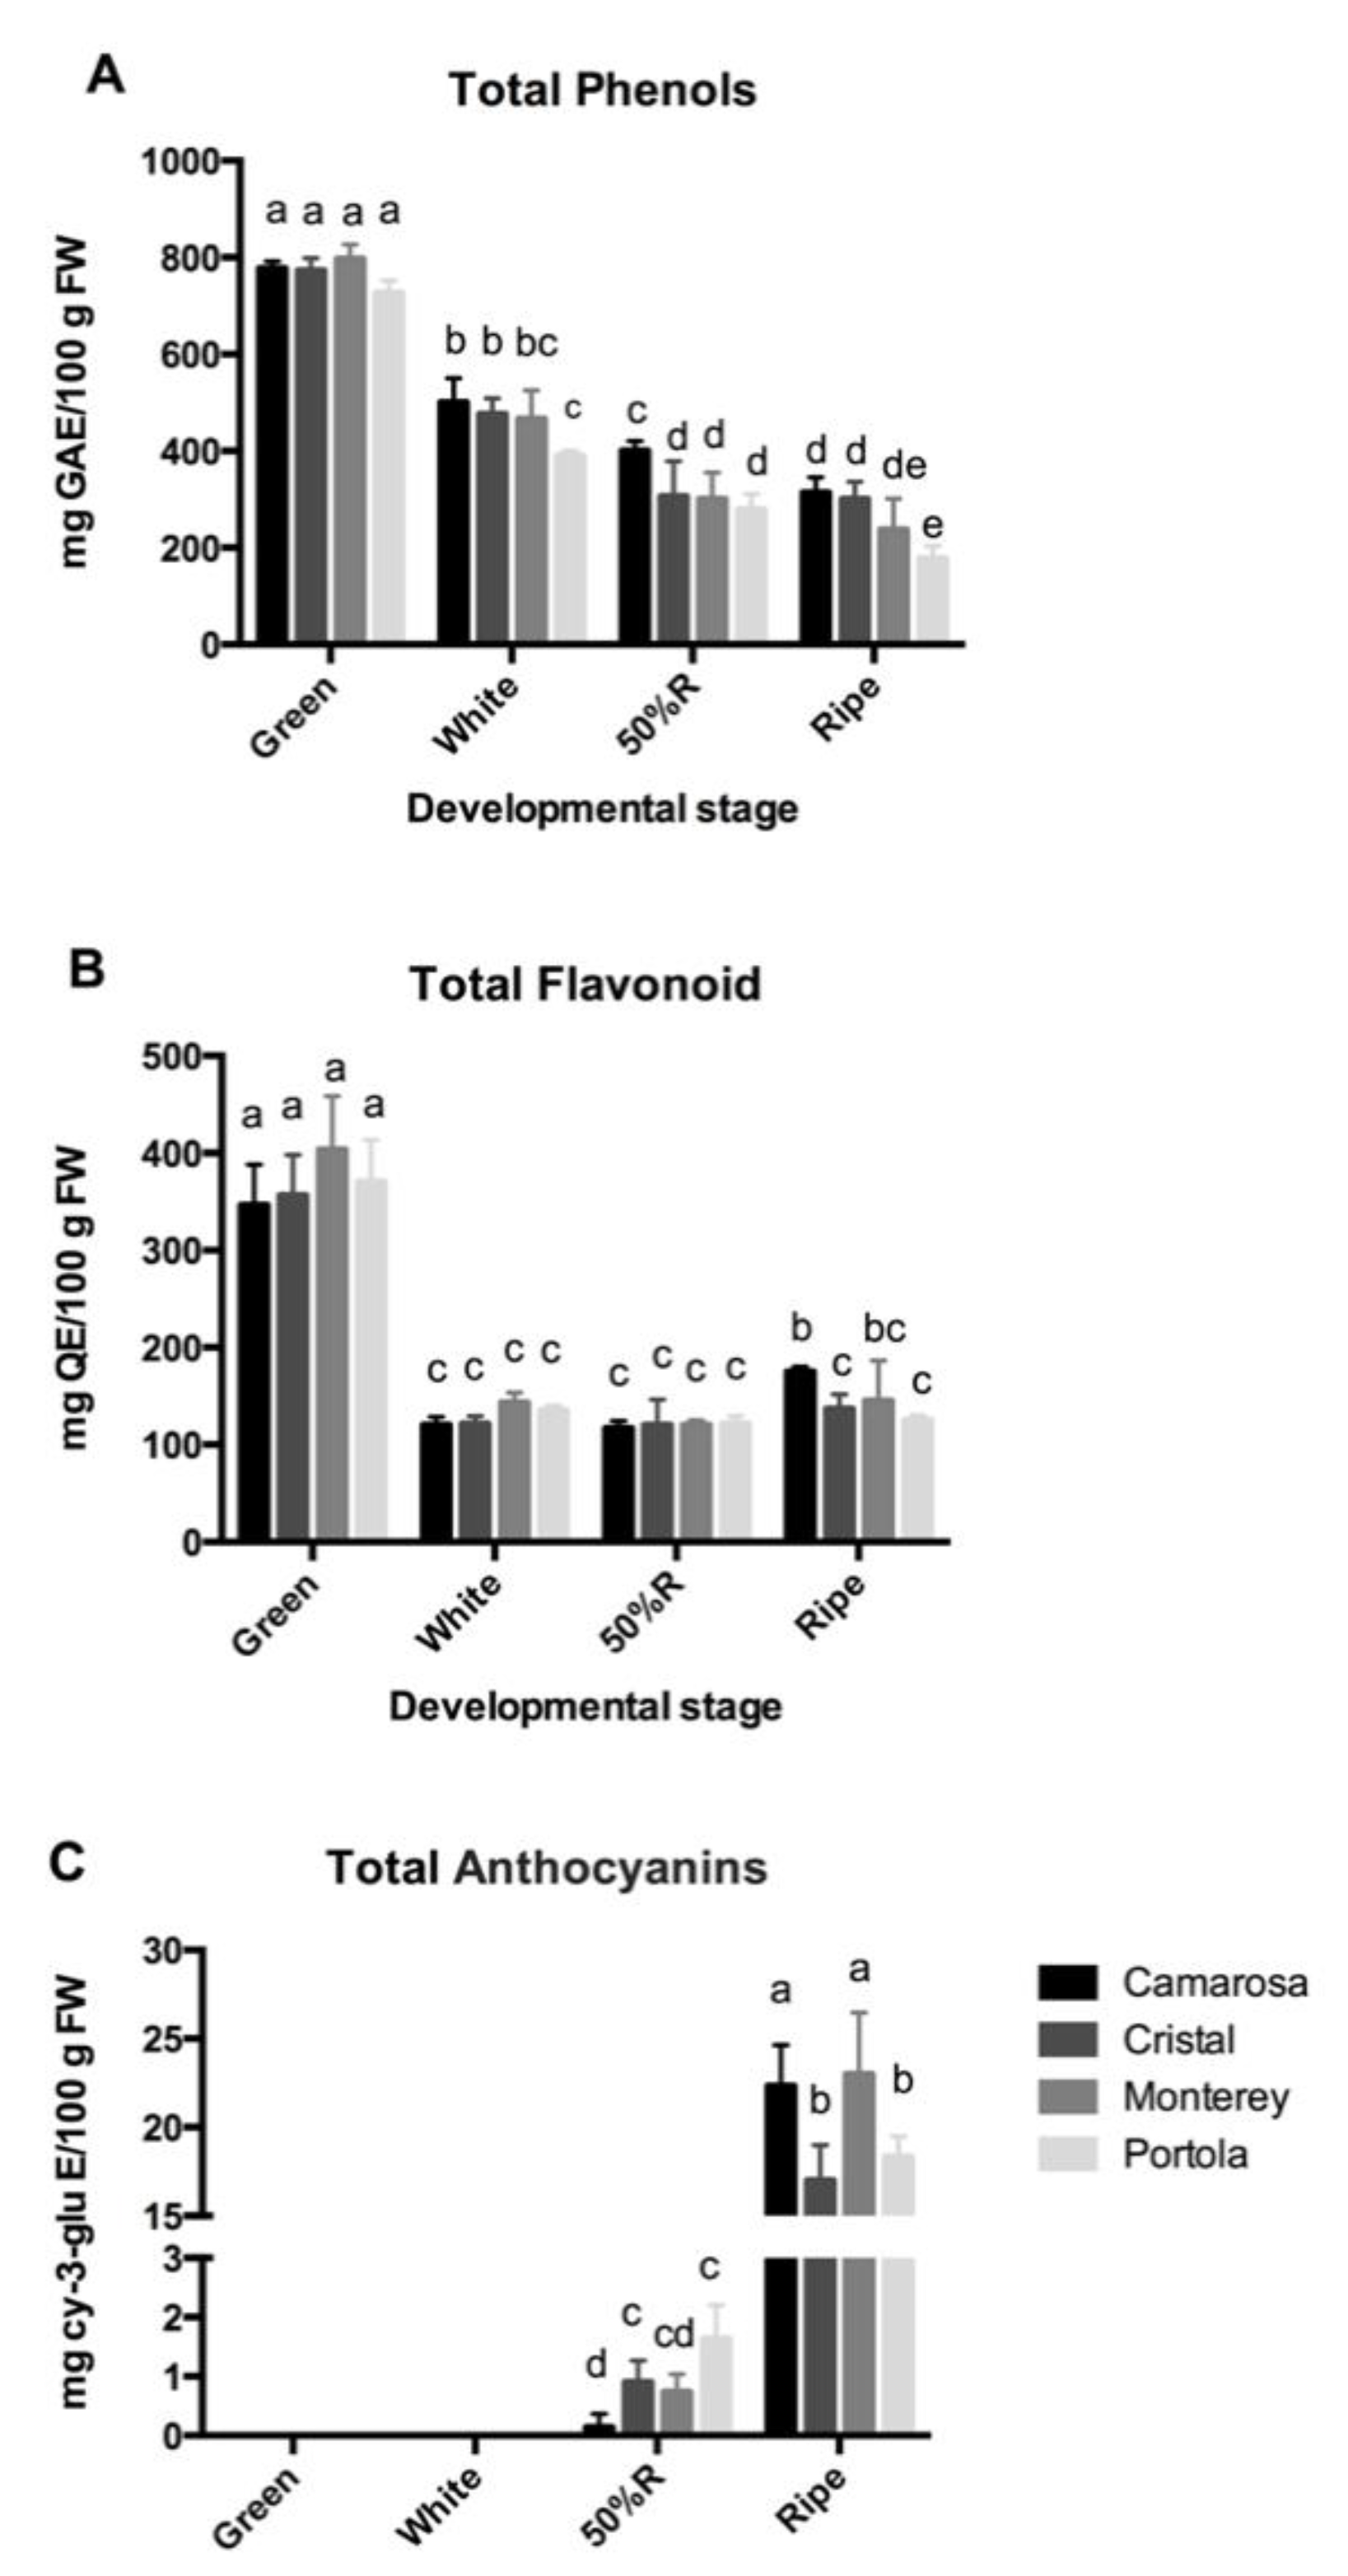
3.2. Total Phenolic, Flavonoid, and Anthocyanin Content

The total phenolic content from strawberry fruit was determined at the four stages of development and in four strawberry cultivars, using Folin−Ciocalteu reagent based on the protocol reported by Singleton et al. (1999) [33]. First, the highest phenolic content was found in the green stage in the four cultivars analyzed, and no significant differences in the phenolic content in this developmental stage were observed among the four cultivars (Figure 4A). In addition, in the white and ripe stages, the lowest phenolic content was found in the “Portola,” while in the other three cultivars, no differences in the phenolic content were found between the two stages (Figure 4A). Consistent with our results, Scalzo et al. (2005) [40] determined the phenolic content of 13 different fruit and vegetables and reported high levels of phenolic compounds in commercial strawberry fruit. In addition, Aaby et al. (2012) [41] in a study involving 27 strawberry cultivars reported that the total phenolic content depended on the cultivar and was also dependent on the growing conditions, which were all different from those used in this study. Additionally, Parra-Palma et al. (2018) [5] evaluated the phenolic content of different strawberry species and showed that the highest phenolic content was observed in F. chiloensis subsp. chiloensis f. patagonica, followed by Fragaria vesca, and the lowest value was observed in F. x ananassa “Chandler.” We studied four new cultivars beyond those described by Parra-Palma et al. (2018) [5] or by Aaby et al. (2012) [41].
Finally, a recent study showed that total phenolic content of three different cultivars from western Portugal region displays significant differences ranging from 607 to 1314 mg GAE/100 g [39]. In the case of the cultivars produced in Portugal, “Portola” showed the lowest value of total phenolic content with 605.698 mg GAE/100 g; meanwhile, “Primoris” and “Endurance” display 942 and 1314 mg GAE/100 g, respectively [39]. Now, and even though the phenolic content of strawberry described depends on location and the time of year production, our results are in accordance with Ganhão et al. (2019) [39], who describe “Portola” as the cultivar with the lowest phenolic content of the three cultivars analyzed.
Similar to the phenolic content described above, the total flavonoid content was highest at green stage, and there were no differences between the flavonoid content in fruit from different cultivars in that stage (Figure 4B). Among the four cultivars, no differences in the flavonoid content were observed in the white and 50%R stages. In the ripe stage, “Portola,” “Cristal,” and “Monterey” contained the lowest total flavonoid content compared to the “Camarosa” cultivar (Figure 4B). Interestingly, no differences in the flavonoid content in fruit from different cultivars in the first three stages of development were found, whereas in the ripe stage, “Camarosa” contained a statistically higher flavonoid content than “Crystal” and “Portola” (Figure 4B). These results of total phenolic and flavonoid high content are in accordance with the early accumulation of proanthocyanidins (PA) and flavonols reported in F. x ananassa [24].
When the total anthocyanin content was analyzed, there was no detection of anthocyanin compounds in fruit at the green and white stages (Figure 4C), while a significant increase in anthocyanin content was observed in fruit at the 50%R stage, and the maximum anthocyanin content was observed in fruit at the ripe stage (Figure 4C). Interestingly, in fruit at the 50%R stage, the “Camarosa” exhibited the significantly lowest levels, while “Monterey” displayed a trend in anthocyanin content; however, these two cultivars accumulated the most anthocyanins in fruit at the ripe stage (Figure 4C). Many studies have determined the total anthocyanin content, reporting values ranging from 0.15 kg−1 to 0.8 g kg−1 of fruit [42,43,44]. In this work, we measured total anthocyanin values between 0.17 kg−1 and 0.22 g kg−1 of fruit (Figure 4C), with the highest values of total anthocyanins content observed in fruit at the ripe stage from the different cultivars and the highest values found in the “Camarosa” and “Monterey.” However, these same cultivars showed less anthocyanin content in fruit at the 50%R stage (Figure 4C). These results suggest that anthocyanin accumulation begins later in fruit development in these cultivars but that it is more efficient than anthocyanin accumulation in fruit from the other two cultivars after the fruit are fully ripe.

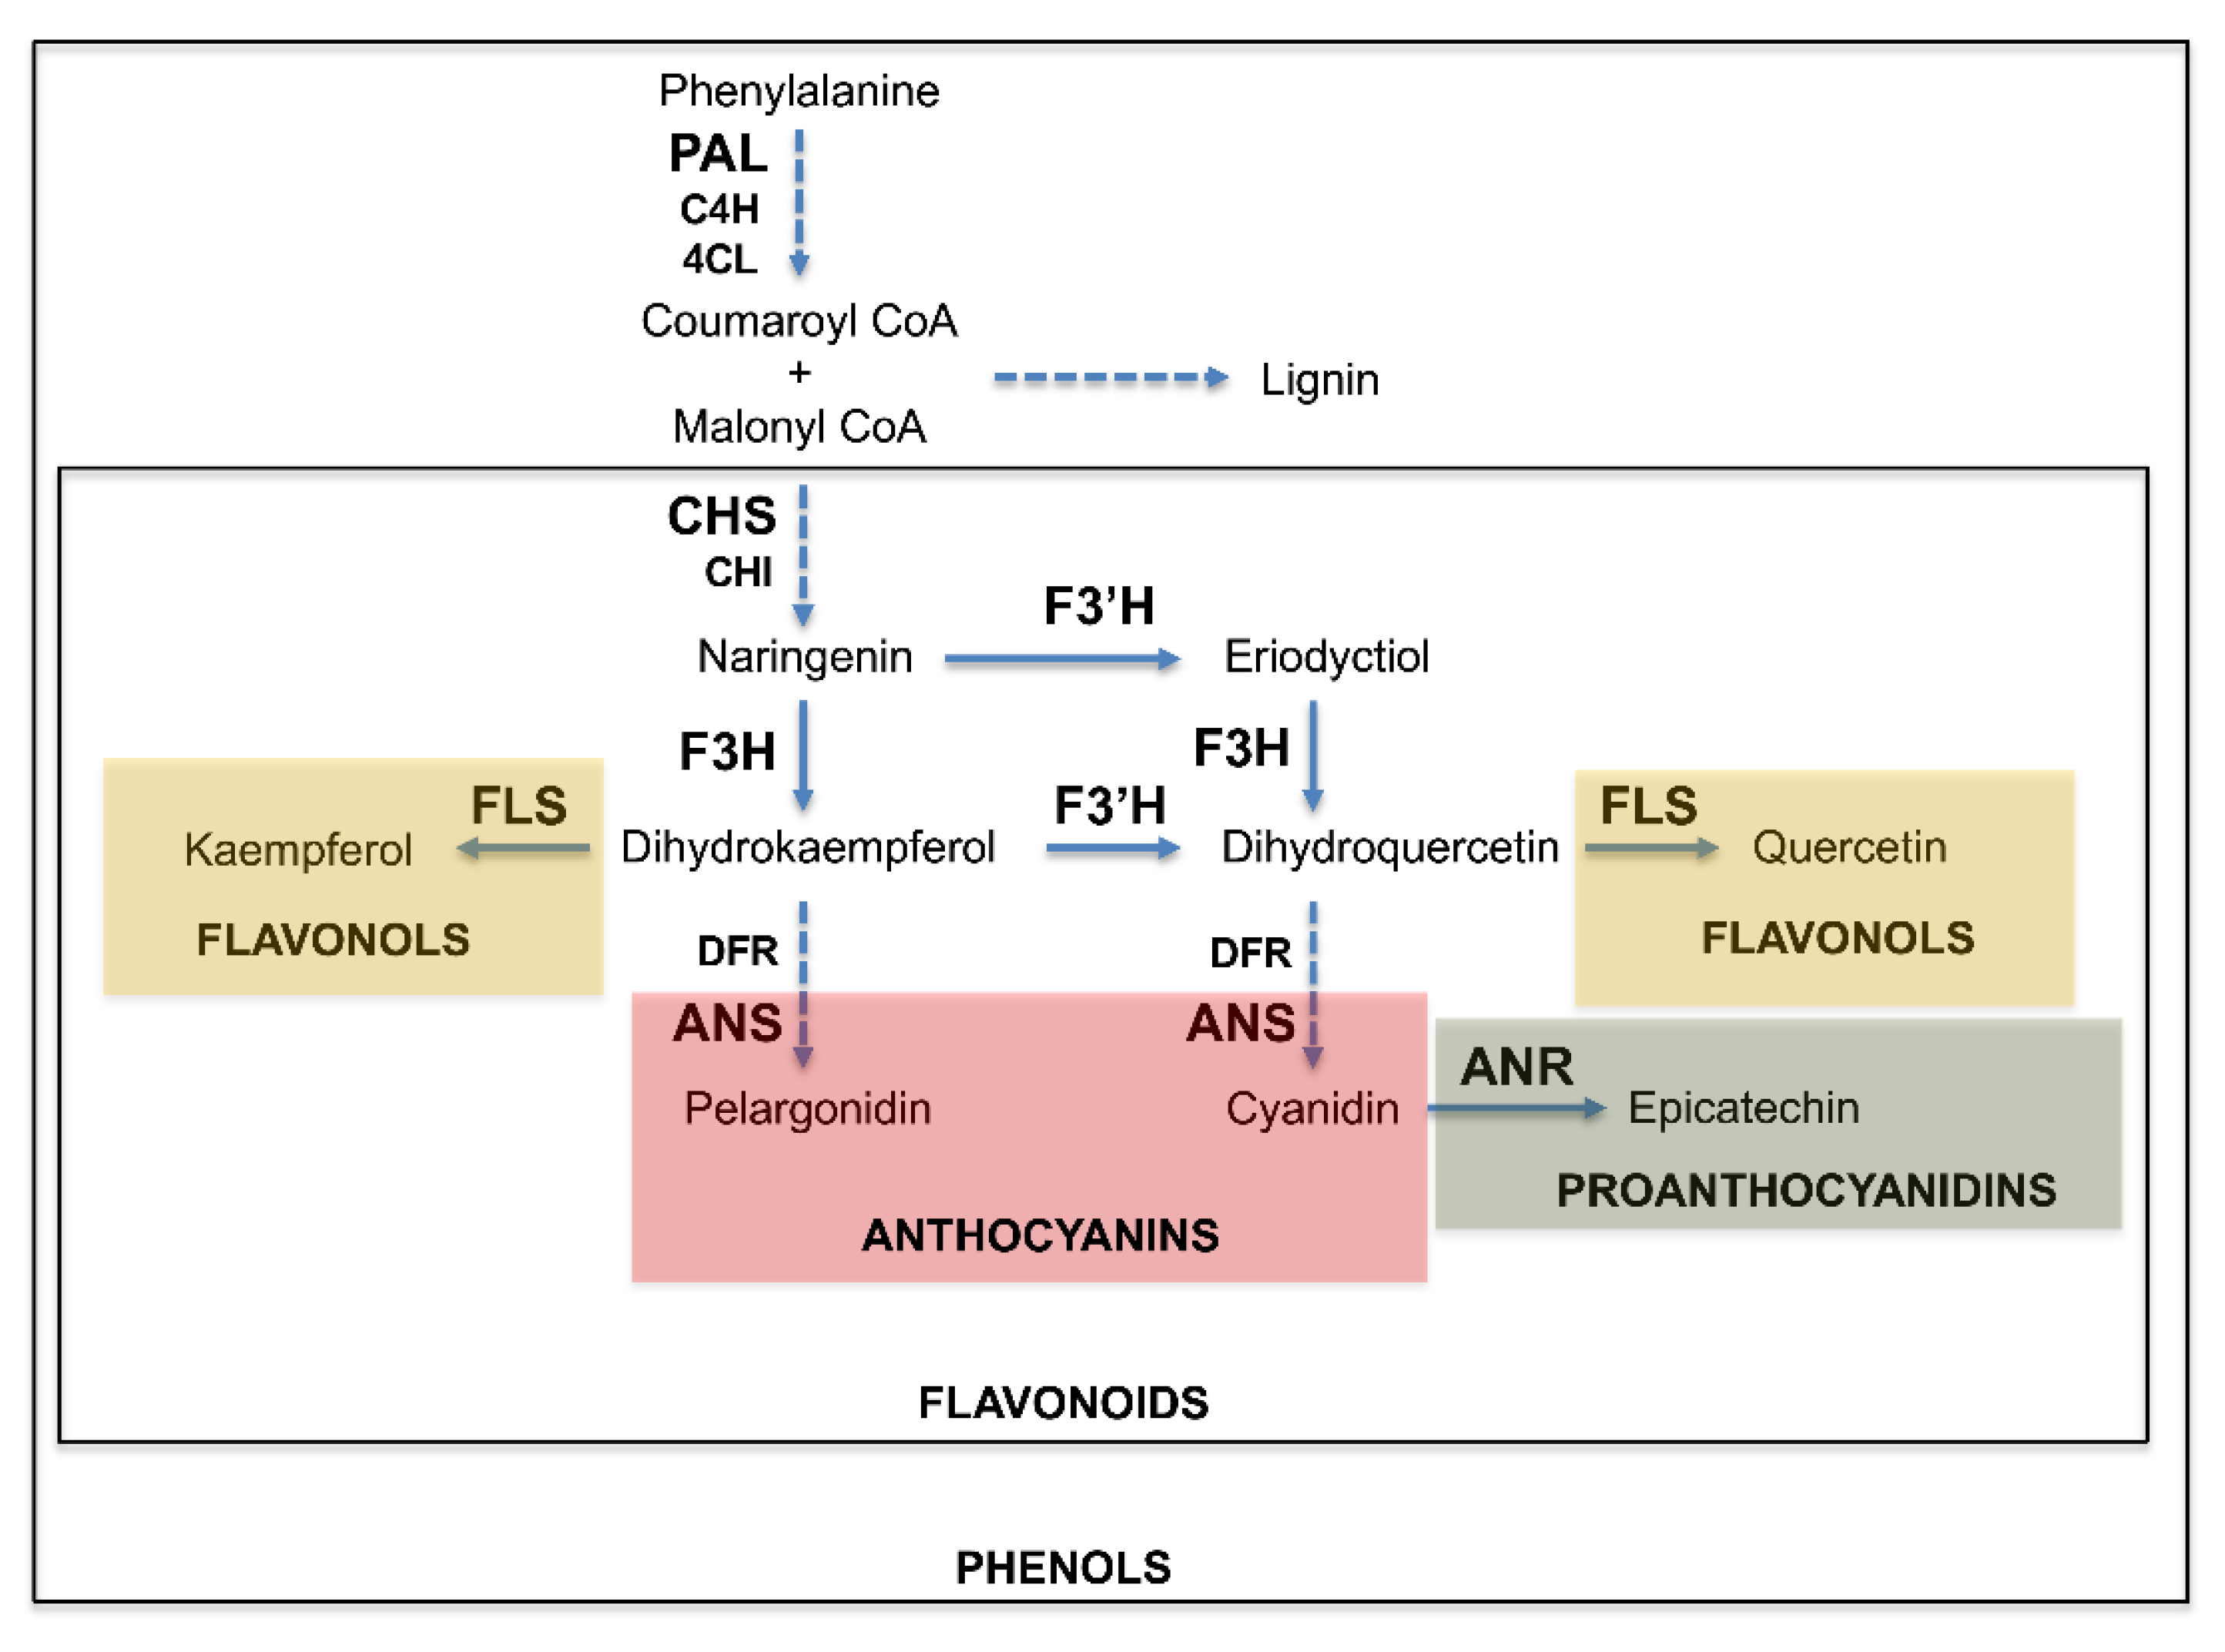
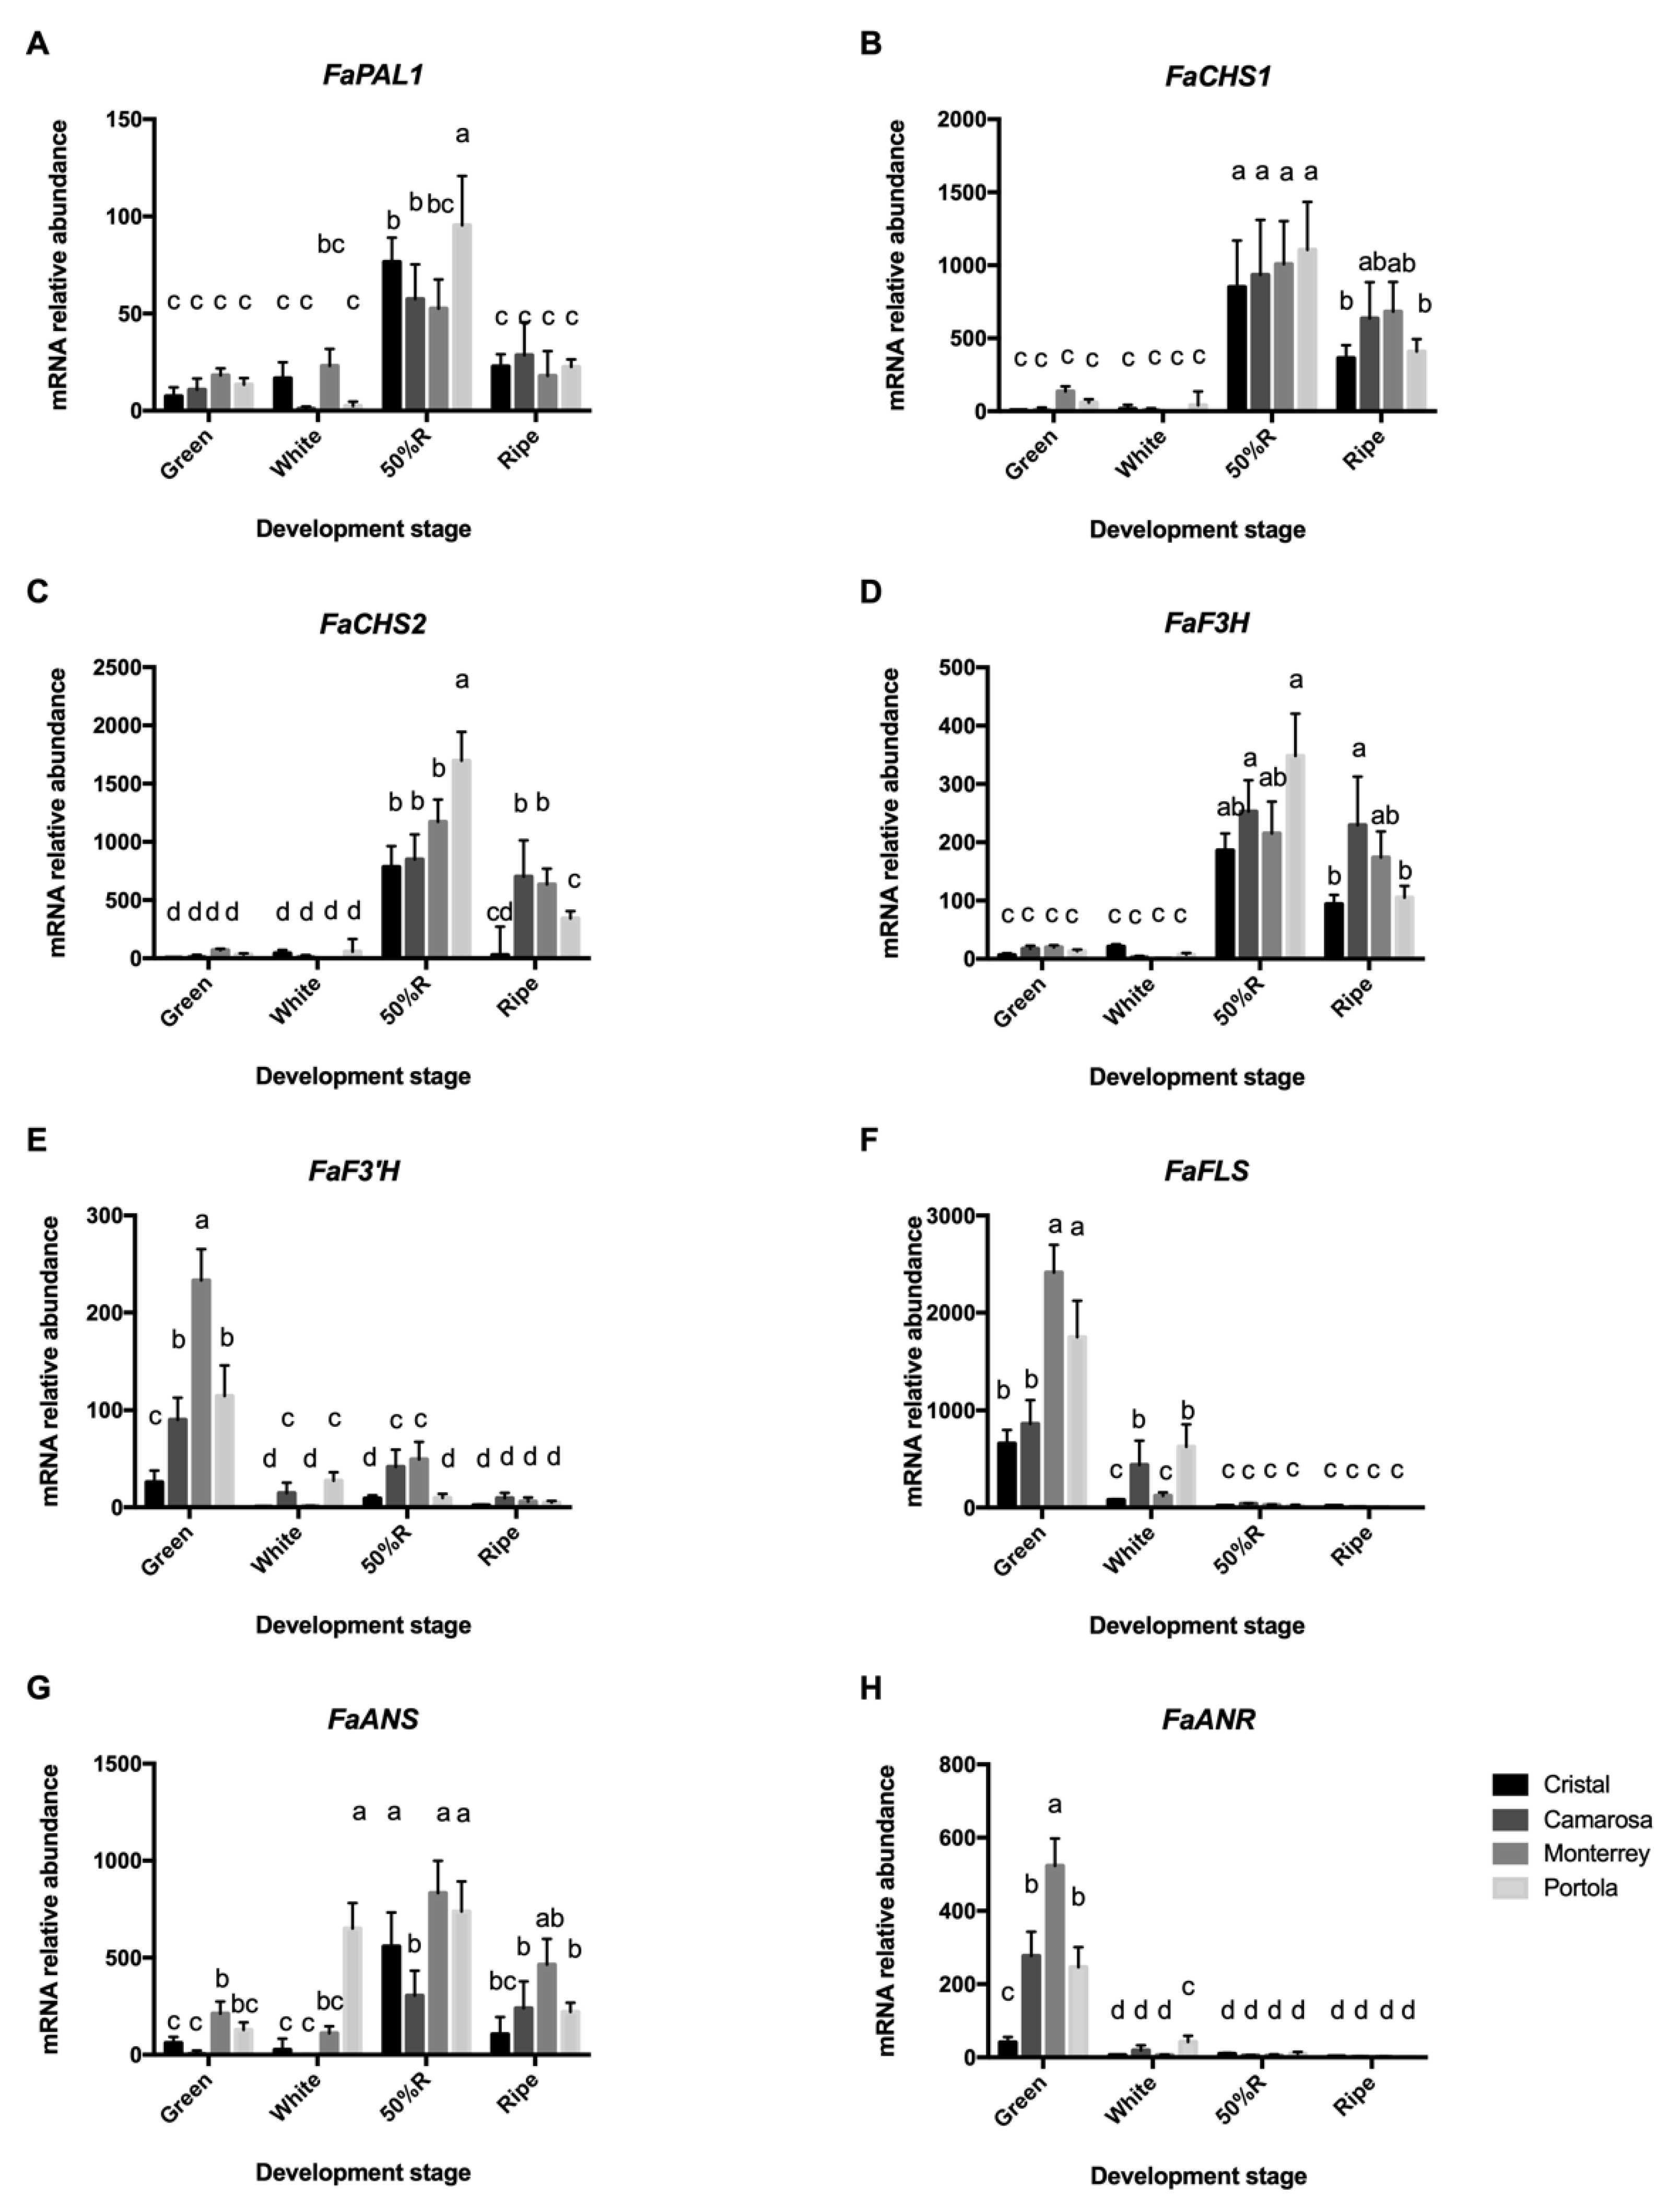
3.3. Expression of Phenylpropanoid Pathway Genes

Based on the analysis of total phenolic, flavonoids, and anthocyanins, the mRNA levels of eight genes encoding key enzymes in the flavonoid biosynthesis pathway in four strawberry cultivars at the four developmental stages were quantified by qRT−PCR. The mRNA levels of the following genes were evaluated: phenylalanine ammonia lyase (FaPAL), which encodes the first enzyme of the phenylpropanoid pathway; chalcone synthase (FaCHS1 and FaCHS2), which encode enzymes involved in the flavanone biosynthesis; flavanone 3−hydroxylase (FaF3H) and flavonoid 3′−hydroxylase (FaF3′H), which catalyze the biosynthesis of dihydroflavonols, flavonol synthase (FaFLS), which is involved in the flavonols biosynthesis; anthocyanidin synthase (FaANS), encoding an enzyme involved in the anthocyanin biosynthesis; and anthocyanidin reductase (FaANR), a gene encoding an enzyme that is involved in the PA biosynthesis (Figure 1). In general, transcriptional analysis showed that different genes exhibited different transcript accumulation profiles (Figure 5). Genes such as FaPAL (Figure 5A), FaCHS1 (Figure 5B), FaCHS2 (Figure 5C), FaF3H (Figure 5D), and FaANS (Figure 5G) showed low levels of transcript accumulation in fruit at the green and white stages, while there was a strong increase in their transcript accumulation in fruit at the 50%R stage, followed by a slight decrease in transcript accumulation in fruit at the ripe stage (Figure 5A–D,G). In contrast, FaF3′H (Figure 5E), FaFLS (Figure 5F) and FaANR (Figure 5H) showed similar transcript accumulation profiles, with higher transcript levels in fruit at the green stage, and then a decrease in transcript levels at the other stages (Figure 5E,F,H). Even though these different genes showed similar expression patterns, differences in the expression levels of each gene were observed at each stage in the different cultivars analyzed (Figure 5). These results are according to previous observations in mature fruit of F. x ananassa in which the most abundant anthocyanin was pelargonidin 3−O−glucoside [5], because the enzymes encoded by FaF3′H and FaFLS are down regulated, allowing to enzymes involved in anthocyanins biosynthesis as FaANS catalyze more substrates available. In agreement with [24], PA content decreases conforming strawberry fruit ripe, in part due by a decrease in the FaANR abundance. These observations are according to the total phenolic and flavonoid content analysis (Figure 4A,B), which suggests that the most abundant compounds at the early stage of ripening could be PA and flavonols.
For the FaPAL gene (the first gene in the biosynthetic pathway), the highest level of transcript accumulation was found in the 50%R stage, and within that stage, the highest value was found in the “Portola.” In the remaining three stages and between the different cultivars, no significant were observed in transcript accumulation (Figure 5A). For FaCHS1 and FaCHS2, the highest transcript accumulation was found at the 50%R stage (Figure 5B,C). In the case of FaCHS1, no differences in transcript accumulation were observed between each cultivar within the same stage (Figure 5B). For FaCHS2, a higher transcript accumulation level was observed in the “Portola,” and no differences were observed among the other three cultivars at the 50%R stage (Figure 5C). In the ripe stage, “Cristal” and “Portola” showed the lowest values of the transcript accumulation level compared to the transcript accumulation in the other two cultivars (Figure 5C). FaF3′H (Figure 5E) and FaANR (Figure 5H) displayed a similar transcript accumulation profile, with higher values in the “Monterey” and lower values in the “Cristal,” while the “Camarosa” and “Portola” showed intermediate expression values (Figure 5E,H). For FaFLS, a higher transcript accumulation level was observed in the green stage in the “Monterey” and “Portola,” followed by the “Camarosa” and “Crystal” at the same stage, while in the white stage, the highest transcript accumulation levels were found in the “Portola” and “Camarosa,” and at the 50%R and ripe stages, no differences were found between the cultivars (Figure 5F).
Finally, an increase in the transcript accumulation of five genes involved in the phenylpropanoid (FaPAL1), flavanones (FaCHS1, FaCHS2), dyhidroflavonols (FaF3H), and anthocyanins (FaANS) biosynthetic pathways was observed. In contrast, transcript accumulation of genes involved in flavonols (FaFLS, FaF3′H) and in PAs FaANR was decreased at the 50%R stage in all cultivars compared to that measured at other stages, suggesting that the anthocyanin content, mainly pelargonidin 3-O-glucoside increases and PA content, decreases as previously reported [5,24].
Future expression analysis of additional different family members of genes involved in this biosynthetic pathway could be evaluated using the genome information recently reported [45]. This information would be useful in future to fill gaps about compounds accumulation during ripening processes.

3.4. Correlation Analysis

The correlational study of the fruit skin color (specifically the “a*” parameter) with the total anthocyanin content, total flavonoid content, total phenolic content, and transcriptional profile of pigment-related genes showed positive correlation coefficients between total anthocyanin accumulation and redness (a*) only in the Monterey and Portola cultivars, and even though a positive trend was observed in the other two cultivars, but this trend is not significant. Additionally, a negative correlation was found between redness (a*) and the total phenolic content in the four cultivars (Table 1). With respect to total anthocyanin content, there was no significant correlation observed between these compounds and the different transcriptional profiles of pigment−related genes in the four cultivars (Table 1). Finally, only the “Camarosa” cultivar showed a negative correlation between the FaFLS gene and redness (Table 1).
Recently, other physiological parameters of quality (firmness, weight, pH, SSC/TA, and aroma expressed as total esters) were described in these same four strawberry cultivars [7,30]. We evaluated a possible correlation between those other physiological parameters of quality with the pigment−related parameters presented here. All the cultivars grow under the same conditions, for this reason no differences in weight were found from different cultivars at each developmental stage (Table 2), similar to previously described [7]. Also, previously we described how the loss of firmness changes throughout the development and ripening of these same four strawberry cultivars and now we found a positive correlation between the loss of firmness and total phenols accumulations in the four cultivars (Table 2). Recently, Castro and Morales-Quintana (2019) [36] performed a comparative study of the changes in physiological properties and cell wall−associated polysaccharide contents during different stages of strawberry “Camarosa,” based on curves of the thermogravimetry (TG) analysis. The authors demonstrated a lower thermal stability in the ripe stage sample than in green stage (initial ripening stage), indicating a greater number of soluble compounds in the ripe stage compared to the green stage [36]. This could explain why the cultivars that undergo the most softening (lowest values of firmness) have a greater number of phenolic compounds showing a positive correlation between them (Table 2). Additionally, the phenols accumulation showed a negative correlation with the fruit weight in three strawberry cultivars (“Portola,” “Monterey,” and “Camarosa”) (Table 2). Finally, positive correlation coefficients between total anthocyanin accumulation, redness (a*), and total esters (related with aroma) were found along the four cultivars (Table 2). This would indicate that when the cell wall loses its firmness (product of the disassembling), the generation of the secondary metabolites and aroma-related compounds are concomitantly activated in fruit showing a good correlation with cultivars in which the softening rates are higher. These observations strongly suggest that cell wall disassembling provides substrates for metabolic pathways associated with quality traits of strawberry fruit.

4. Conclusions

In summary, we showed that each strawberry cultivar has different levels of phenolic compounds in the fully ripened fruit, with fruit in each cultivar at the green stage having the highest phenolic content. Thus, the accumulation of total phenolic compounds was similar in all of the evaluated cultivars at each stage, but in fruit from “Portola” at the ripe stage displayed the lowest phenolic content. Additionally, the total anthocyanin content showed differences in fruit at the ripe stage, with greater anthocyanin accumulation observed in “Camarosa” and “Monterey” (Figure 4). With regard to the pigment-related gene expression, at the 50%R stage, an increase in FaPAL1, FaCHS1, FaCHS2, FaF3H, and FaANS transcript accumulation was observed. In contrast, FaFLS, FaF3′H and FaANR transcript accumulation decreased at the 50%R stage in all cultivars (Figure 5). This increase and/or decrease in the transcript accumulation of pigment-related gene were concomitant with the accumulation of anthocyanins at these same stages. In the correlational analysis, we found a correlation between color and total anthocyanin content only in “Monterey” and “Portola” fruit, while a positive correlation was observed between the mRNA abundance of FaF3′H and FaFLS with the total flavonoid content (mainly flavonols) in the “Cristal,” “Monterey,” and “Portola” cultivars (Table 1). Finally, the results could be useful for making decisions in future breeding programs to improve the healthy compound content in strawberry fruit.

Supplementary Materials

The following are available online at https://www.mdpi.com/2073-4395/10/4/588/s1, Table S1: Primers sequences (5’→3’) used in this study to real time PCR (RT-qPCR), Table S2: Color readings of four F. x ananassa cultivars fruit peel.

Author Contributions

Conceptualization, P.R.; Data curation, P.R.; Formal analysis, P.R. and L.M.-Q.; Funding acquisition, P.R. and L.M.-Q.; Investigation, C.P.-P., P.R. and L.M.-Q.; Methodology, C.P.-P.; Project administration, L.M.-Q.; Supervision, P.R. and L.M.-Q.; Writing—Original draft, C.P.-P. and L.M.-Q.; Writing—Review and editing, C.P.-P., P.R. and L.M.-Q. All authors have read and agreed to the published version of the manuscript.

Funding

The National Commission for Technological and Scientific Research (CONICYT, Chile) supported the work (grants CONICYT: Initiation FONDECYT #11150543 to L.M.-Q; REDES #190078 to P.R; REDES #190093 to L.M.-Q.).

Acknowledgments

C.P.-P. acknowledges CONICYT for a doctoral scholarship #21140812. P.R. acknowledges Dominga.

Conflicts of Interest

The authors declare no conflict of interest.

References

  1. Hoberg, E.; Ulrich, D. Comparison of sensory perception and instrumental analysis. Acta Hortic. 2000, 538, 439–442. [Google Scholar] [CrossRef]
  2. Brummell, D.; Howie, W.J.; Ma, C.; Dunsmuir, P. Postharvest fruit quality of transgenic tomatoes suppressed in expression of a ripening-related expansin. Postharvest Boil. Technol. 2002, 25, 209–220. [Google Scholar] [CrossRef]
  3. Aaby, K.; Wrolstad, R.E.; Ekeberg, D.; Skrede, G. Polyphenol Composition and Antioxidant Activity in Strawberry Purees; Impact of Achene Level and Storage. J. Agric. Food Chem. 2007, 55, 5156–5166. [Google Scholar] [CrossRef] [PubMed]
  4. Álvarez-Suarez, J.M.; Giampieri, F.; Tulipani, S.; Casoli, T.; Di Stefano, G.; González-Paramás, A.M.; Santos-Buelga, C.; Busco, F.; Quiles, J.L.; Cordero, M.D.; et al. One-month strawberry-rich anthocyanin supplementation ameliorates cardiovascular risk, oxidative stress markers and platelet activation in humans. J. Nutr. Biochem. 2014, 25, 289–294. [Google Scholar] [CrossRef] [PubMed]
  5. Parra-Palma, C.; Fuentes, E.; Palomo, I.; Torres, C.A.; Moya-León, M.A.; Ramos, P. Linking the platelet antiaggregation effect of different strawberries species with antioxidants: Metabolomic and transcript profiling of polyphenols. Bol. Latinoam. Caribe Plant Med. Aromat. 2018, 17, 36–52. [Google Scholar]
  6. Kosar, M.; Kafkas, N.E.; Paydas, S.; Baser, K.H.C. Phenolic Composition of Strawberry Genotypes at Different Maturation Stages. J. Agric. Food Chem. 2004, 52, 1586–1589. [Google Scholar] [CrossRef] [PubMed]
  7. Ramos, P.; Parra-Palma, C.; Figueroa, C.R.; Zúñiga, P.E.; Valenzuela-Riffo, F.; Gonzàlez, J.; Gaete, C.; Morales-Quintana, L. Cell wall-related enzymatic activities and transcriptional profiles in four strawberry (Fragaria × ananassa) cultivars during fruit development and ripening. Sci. Hortic. 2018, 238, 325–332. [Google Scholar] [CrossRef]
  8. Morales-Quintana, L.; Ramos, P. Chilean strawberry (Fragaria chiloensis): An integrative and comprenhensive review. Food Res. Int. 2018, 119, 769–776. [Google Scholar] [CrossRef]
  9. Staudt, G. The origin and history of the large-fruited garden strawberry, Fragaria × ananassa. Theor. Appl. Genet. 1961, 31, 212–218. [Google Scholar]
  10. Ulrich, D.; Komes, D.; Olbricht, K.; Hoberg, E. Diversity of aroma patterns in wild and cultivated Fragaria accessions. Genet. Resour. Crop. Evol. 2006, 54, 1185–1196. [Google Scholar] [CrossRef]
  11. Tanaka, Y.; Sasaki, N.; Ohmiya, A. Biosynthesis of plant pigments: Anthocyanins, betalains and carotenoids. Plant J. 2008, 54, 733–749. [Google Scholar] [CrossRef] [PubMed]
  12. Jaakola, L. New insights into the regulation of anthocyanin biosynthesis in fruits. Trends Plant Sci. 2013, 18, 477–483. [Google Scholar] [CrossRef] [PubMed] [Green Version]
  13. Jimenez-Garcia, S.N.; Guevara-González, R.G.; Miranda-López, R.; Feregrino-Pérez, A.; Torres-Pacheco, I.; Vazquez-Cruz, M.A. Functional properties and quality characteristics of bioactive compounds in berries: Biochemistry, biotechnology, and genomics. Food Res. Int. 2013, 54, 1195–1207. [Google Scholar] [CrossRef]
  14. Kayesh, E.; Shangguan, L.; Korir, N.K.; Sun, X.; Bilkish, N.; Zhang, Y.; Han, J.; Song, C.; Cheng, Z.-M.; Fang, J. Fruit skin color and the role of anthocyanin. Acta Physiol. Plant. 2013, 35, 2879–2890. [Google Scholar] [CrossRef]
  15. Lin-Wang, K.; Liu, Y.; Espley, R.; Karunairetnam, S.; McGhie, T.; Hellens, R.P.; Allan, A.C. Regulation of anthocyanin biosynthesis in strawberry (Fragaria sp.) By over-expression of a key transcription factor. Acta Hortic. 2014, 137–142. [Google Scholar] [CrossRef]
  16. Hossain, M.R.; Kim, H.-T.; Shanmugam, A.; Nath, U.K.; Goswami, G.; Song, J.-Y.; Park, J.-I.; Nou, I.-S. Expression Profiling of Regulatory and Biosynthetic Genes in Contrastingly Anthocyanin Rich Strawberry (Fragaria × ananassa) Cultivars Reveals Key Genetic Determinants of Fruit Color. Int. J. Mol. Sci. 2018, 19, 656. [Google Scholar] [CrossRef] [Green Version]
  17. Cheel, J.; Theoduloz, C.; Rodriguez, J.; Caligari, P.D.S.; Schmeda-Hirschmann, G. Free radical scavenging activity and phenolic content in achenes and thalamus from Fragaria chiloensis subsp. chiloensis, F. vesca and F. × ananassa cv. Chandler. Food Chem. 2007, 102, 36–44. [Google Scholar] [CrossRef]
  18. Baldi, P.; Orsucci, S.; Moser, M.; Brilli, M.; Giongo, L.; Si-Ammour, A. Gene expression and metabolite accumulation during strawberry (Fragaria × ananassa) fruit development and ripening. Planta 2018, 248, 1143–1157. [Google Scholar] [CrossRef]
  19. Simirgiotis, M.J.; Theoduloz, C.; Caligari, P.D.; Schmeda-Hirschmann, G. Comparison of phenolic composition and antioxidant properties of two native Chilean and one domestic strawberry genotypes. Food Chem. 2009, 113, 377–385. [Google Scholar] [CrossRef]
  20. Olivares, D.; Contreras, C.; Muñoz, V.; Rivera, S.; González-Agüero, M.; Retamales, J.; Defilippi, B.G. Relationship among color development, anthocyanin and pigment-related gene expression in ‘Crimson Seedless’ grapes treated with abscisic acid and sucrose. Plant Physiol. Biochem. 2017, 115, 286–297. [Google Scholar] [CrossRef]
  21. Ferrara, G.; Mazzeo, A.; Matarrese, A.; Pacucci, C.; Punzi, R.; Faccia, M.; Trani, A.; Gambacorta, G. Application of abscisic acid (S-ABA) and sucrose to improve colour, anthocyanin content and antioxidant activity of cv. Crimson Seedless grape berries. Aust. J. Grape Wine Res. 2014, 21, 18–29. [Google Scholar] [CrossRef]
  22. Spayd, S.E.; Tarara, J.M.; Mee, D.L.; Ferguson, J.C. Separation of sunlight and temperature effects on the composition of Vitis vinifera cv. Merlot berries. Am. J. Enol. Vitic. 2002, 53, 171–182. [Google Scholar]
  23. Muñoz, C.; Sevilla, J.F.S.; Botella, J.R.; Hoffmann, T.; Schwab, W.; Valpuesta, V. Polyphenol Composition in the Ripe Fruits of Fragaria Species and Transcriptional Analyses of Key Genes in the Pathway. J. Agric. Food Chem. 2011, 59, 12598–12604. [Google Scholar] [CrossRef] [PubMed]
  24. Schaart, J.G.; Dubos, C.; De La Fuente, I.R.; van Houwelingen, A.M.M.L.; de Vos, R.C.H.; Jonker, H.H.; Xu, W.; Routaboul, J.M.; Lepiniec, L.; Bovy, A.G. Identification and characterization of MYB-bHLH-WD40 regulatory complexes controlling proanthocyanidin biosynthesis in strawberry (Fragaria × ananassa) fruits. New Phytol. 2013, 197, 454–467. [Google Scholar] [CrossRef] [PubMed]
  25. Hannum, S.M. Potential Impact of Strawberries on Human Health: A Review of the Science. Crit. Rev. Food Sci. Nutr. 2004, 44, 1–17. [Google Scholar] [CrossRef] [PubMed]
  26. Fossen, T.; Andersen, O.M.; Øvstedal, D.O.; Pedersen, A.T.; Raknes, Å. Characteristic Anthocyanin Pattern from Onions and other Allium spp. J. Food Sci. 1996, 61, 703–706. [Google Scholar] [CrossRef]
  27. Tulipani, S.; Mezzetti, B.; Capocasa, F.; Bompadre, S.; Beekwilder, J.; De Vos, C.H.R.; Capanoglu, E.; Bovy, A.; Battino, M. Antioxidants, Phenolic Compounds, and Nutritional Quality of Different Strawberry Genotypes. J. Agric. Food Chem. 2008, 56, 696–704. [Google Scholar] [CrossRef]
  28. Concha, C.M.; Figueroa, N.E.; Poblete, L.A.; Oñate, F.J.; Schwab, W.; Figueroa, C.R. Methyl jasmonate treatment induces changes in fruit ripening by modifying the expression of several ripening genes in Fragaria chiloensis fruit. Plant Physiol. Biochem. 2013, 70, 433–444. [Google Scholar] [CrossRef]
  29. Rosli, H.G.; Civello, P.; Martínez, G.A. Changes in cell wall composition of three Fragaria × ananassa cultivars with different softening rate during ripening. Plant Physiol. Biochem. 2004, 42, 823–831. [Google Scholar] [CrossRef]
  30. Parra-Palma, C.; Úbeda, C.; Gil, M.; Ramos, P.; Castro, R.; Morales-Quintana, L. Comparative study of the volatile organic compounds of four strawberry cultivars and it relation to alcohol acyltransferase enzymatic activity. Sci. Hortic. 2019, 251, 65–72. [Google Scholar] [CrossRef]
  31. Pillet, J.; Yu, H.-W.; Chambers, A.H.; Whitaker, V.M.; Folta, K.M. Identification of candidate flavonoid pathway genes using transcriptome correlation network analysis in ripe strawberry (Fragaria × ananassa) fruits. J. Exp. Bot. 2015, 66, 4455–4467. [Google Scholar] [CrossRef] [PubMed]
  32. Nardi, C.F.; Villarreal, N.M.; Opazo, M.C.; Martínez, G.A.; Moya-León, M.A.; Civello, P. Expression of FaXTH1 and FaXTH2 genes in strawberry fruit. Cloning of promoter regions and effect of plant growth regulators. Sci. Hortic. 2014, 165, 111–122. [Google Scholar] [CrossRef]
  33. Singleton, V.L.; Orthofer, R.; Lamuela-Raventós, R.M. Analysis of total phenols and other oxidation substrates and antioxidants by means of folin-ciocalteu reagent. Methods Enzymol. 1999, 299, 152–178. [Google Scholar] [CrossRef]
  34. Chang, C.C.; Yang, M.Y.; Wen, H.M.; Chern, J.C. Estimation of total flavonoid content in propolis by two complementary colorimetric methods. J. Food Drug. Anal. 2002, 10, 178–182. [Google Scholar]
  35. Lee, J.; Rennaker, C.; Wrolstad, R.E. Correlation of two anthocyanin quantification methods: HPLC and spectrophotometric methods. Food Chem. 2008, 110, 782–786. [Google Scholar] [CrossRef]
  36. Castro, R.; Morales-Quintana, L. Study of the cell wall components produced during different ripening stages through thermogravimetric analysis. Cellulose 2019, 26, 3009–3020. [Google Scholar] [CrossRef]
  37. Hertog, M.L.; Lammertyn, J.; Desmet, M.; Scheerlinck, N.; Nicolaï, B. The impact of biological variation on postharvest behaviour of tomato fruit. Postharvest Boil. Technol. 2004, 34, 271–284. [Google Scholar] [CrossRef]
  38. Rababah, T.M.; Ereifej, K.I.; Howard, L. Effect of Ascorbic Acid and Dehydration on Concentrations of Total Phenolics, Antioxidant Capacity, Anthocyanins, and Color in Fruits. J. Agric. Food Chem. 2005, 53, 4444–4447. [Google Scholar] [CrossRef]
  39. Ganhão, R.; Pinheiro, J.; Tino, C.; Faria, H.; Gil, M.M. Characterization of Nutritional, Physicochemical, and Phytochemical Composition and Antioxidant Capacity of Three Strawberry “Fragaria × ananassa Duch.” Cultivars (“Primoris”, “Endurance”, and “Portola”) from Western Region of Portugal. Foods 2019, 8, 682. [Google Scholar]
  40. Scalzo, J.; Politi, A.; Pellegrini, N.; Mezzetti, B.; Battino, M. Plant genotype affects total antioxidant capacity and phenolic contents in fruit. Nutrition 2005, 21, 207–213. [Google Scholar] [CrossRef]
  41. Aaby, K.; Mazur, S.; Nes, A.; Skrede, G. Phenolic compounds in strawberry (Fragaria × ananassa Duch.) fruits: Composition in 27 cultivars and changes during ripening. Food Chem. 2012, 132, 86–97. [Google Scholar] [CrossRef] [PubMed]
  42. García-Viguera, C.; Zafrilla, P.; Tomas-Barberan, F. The use of acetone as an extraction solvent for anthocyanins from strawberry fruit. Phytochem. Anal. 1998, 9, 274–277. [Google Scholar] [CrossRef]
  43. Clifford, M. Anthocyanins—Nature, occurrence and dietary burden. J. Sci. Food Agric. 2000, 80, 1063–1072. [Google Scholar] [CrossRef]
  44. Castro, I.; Goncalves, O.; Teixeira, J.A.; Vicente, A.A. Comparative study of Selva and Camarosa strawberries from the commercial market. J. Food Sci. 2002, 67, 2132–2137. [Google Scholar] [CrossRef]
  45. Edger, P.P.; Poorten, T.J.; VanBuren, R.; Hardigan, M.A.; Colle, M.; McKain, M.R.; Smith, R.D.; Teresi, S.J.; Nelson, A.; Wai, C.M.; et al. Origin and evolution of the octoploid strawberry genome. Nat. Genet. 2019, 51, 541–547. [Google Scholar] [CrossRef] [Green Version]
Figure 1. Phenylpropanoid biosynthetic pathway. A simple schematic view of the metabolic pathway and group of compounds evaluated. Bold and big letters indicate the encoded proteins of analyzed genes. The major compounds synthesized in the pathway route are indicated in the boxes.
Agronomy 10 00588 g001
Figure 2. Commercial orchard arrangement. (a) Aerial view of the commercial orchard and the cultivar distributions showing the “Camarosa” (blue), “Portola” (yellow), “Cristal” (orange), and “Monterey” (green orchards, respectively. Image obtained by Google map tool. (b) Street view of the commercial orchard. (c) Views of the representative “Camarosa” orchard. (d) View of the representative “Monterey” orchard. (eh) correspond to fruit developmental stages of different strawberry cultivars used in this research, being (e) “Camarosa,” (f) “Portola,” (g) “Cristal,” and (h) “Monterey.” Fruit developmental stages correspond to large green (G), white (W), 50% ripe (50%R), and ripe (R) based on the classification described by Rosli et al. (2004) [29]. Bar scale = 50 m.
Agronomy 10 00588 g002
Figure 3. CIELAB Color Chart of four F. x ananassa cultivars fruit peel in different development stages. The different color corresponds to the average of the measurements of 20 fruit from each cultivar and development stages (green, white, 50% ripe (50%R), and ripe stages). To see the values of the Hunter scale (L*, a*, b*), see Supplementary Table S2.
Agronomy 10 00588 g003
Figure 4. Chemical analysis of the four strawberry cultivars during fruit development and ripening. Total phenolics (A), flavonoids (B), and anthocyanins content (C).
Agronomy 10 00588 g004
Figure 5. Changes in (A) FaPAL1, (B) FaCHS1, (C) FaCHS2, (D) FaF3H, (E) FaF3′H, (F) FaFLS, (G) FaANS, and (H) FaANR mRNA levels measured by qRT-PCR during fruit development and ripening of the four strawberry cultivars. The expression data correspond to the mean of three replicates normalized against FaGADPH1 abundance. Different letters indicate significant differences between cultivars and stages (p < 0.05).
Agronomy 10 00588 g005
Table 1. Pearson’s correlation analysis of skin fruit color (a*), total anthocyanin, flavonoids and phenols accumulations and transcriptional profile of pigment related gene expression (FaPAL, FaCHI1, FaCHI2, FaFLS, FaF3H, FaF3′H, FaANS, and FaANR) in four different F. ananassa “Camarosa,” “Cristal,” “Monterey,” and “Portola.”
“Camarosa”FaPALFaCHS1FaCHS2FaF3HFaFLSFaF3‘HFaANSFaANRTotal PhenolsTotal FlavonoidsTotal AnthocyaninSkin Color (a*)
FaPAL
FaCHS10.959 *
FaCHS20.922 *0.992 **
FaF3H0.903 *0.981 **0.997 **
FaFLS−0.697−0.863−0.890−0.879
FaF3‘H−0.062 −0.315−0.368−0.3590.750
FaANS0.934 *0.995 **0.999 ***0.995 **−0.881−0.350
FaANR−0.407−0.597−0.613−0.5840.8970.919 *−0.604
Total phenols−0.526−0.735−0.776−0.7690.976 *0.872−0.7630.944 *
Total flavonoids−0.370−0.508−0.491−0.4440.7810.833−0.4890.959 *0.820
Total anthocyanin0.1170.3490.4660.522−0.552−0.5350.439−0.370−0.614−0.093
Skin color (a*)0.6990.8640.920 *0.938 *−0.919 *−0.5760.907 *−0.676−0.877 *−0.4770.765
“Cristal”FaPALFaCHS1FaCHS2FaF3HFaFLSFaF3‘HFaANSFaANRTotal PhenolsTotal FlavonoidsTotal AnthocyaninSkin Color (a*)
FaPAL
FaCHS10.958 *
FaCHS20.984 **0.910 *
FaF3H0.951 *0.997 **0.891
FaFLS−0.545−0.568−0.408−0.629
FaF3‘H−0.203−0.218−0.060−0.2930.927 *
FaANS0.983 **0.949 *0.989 **0.928 *−0.389−0.023
FaANR−0.380−0.417−0.232−0.4860.983 **0.977 *−0.213
Total phenols−0.643−0.724−0.500−0.7760.959 *0.812−0.5200.918 *
Total flavonoids−0.530−0.516−0.405−0.5780.991 **0.937 *−0.3660.975 *0.917 *
Total anthocyanin−0.1230.144−0.2790.188−0.403−0.434−0.169−0.478−0.527−0.296
Skin color (a*)0.5280.7160.3770.755−0.759−0.5870.459−0.725−0.902 *−0.6660.772
“Monterey”FaPALFaCHS1FaCHS2FaF3HFaFLSFaF3‘HFaANSFaANRTotal PhenolsTotal FlavonoidsTotal AnthocyaninSkin Color (a*)
FaPAL
FaCHS10.710
FaCHS20.8010.990 **
FaF3H0.6250.991 **0.967 *
FaFLS−0.399−0.488−0.516 ns−0.545
FaF3‘H−0.205−0.303−0.323 ns−0.3780.976 *
FaANS0.8280.979 *0.994 **0.943 *−0.429−0.225
FaANR−0.389−0.457−0.488−0.5140.999 ***0.980 **−0.401
Total phenols−0.402−0.705−0.697−0.7700.938 *0.878−0.6140.924 *
Total flavonoids−0.469−0.507−0.545−0.5530.996 **0.959 *−0.4640.996 **0.925 *
Total anthocyanin−0.3750.3480.2300.469−0.374−0.4140.152−0.354−0.586−0.303
Skin color (a*)0.0690.7170.6310.805−0.572−0.5220.561−0.545−0.809 *−0.5290.899 *
“Portola”FaPALFaCHS1FaCHS2FaF3HFaFLSFaF3‘HFaANSFaANRTotal PhenolsTotal FlavonoidsTotal AnthocyaninSkin Color (a*)
FaPAL
FaCHS10.980 *
FaCHS20.993 **0.986 **
FaF3H0.989 **0.998 ***0.994 **
FaFLS−0.514−0.666−0.593−0.636
FaF3‘H−0.402−0.557−0.496−0.5300.984 **
FaANS0.5350.5260.6170.555−0.527−0.583
FaANR−0.384−0.538−0.481−0.5120.978 *0.999 ***−0.599
Total phenols−0.377−0.549−0.458−0.5110.986 **0.981 **−0.4220.975 *
Total flavonoids−0.353−0.497−0.456−0.4760.950 *0.989 **−0.6660.993 **0.944 *
Total anthocyanin−0.08780.093−0.0740.031−0.543−0.493−0.419−0.474−0.647−0.388
Skin color (a*)0.4700.6340.5040.586−0.881−0.8040.0955−0.783−0.896 *−0.7060.811 *
*, **, *** indicate significant at 0.01, 0.001, and 0.0001 p-value by Fisher’s least significant difference (LSD) test.
Table 2. Pearson’s correlation analysis of skin fruit color (a*), total anthocyanin, flavonoids and phenols accumulations, firmness, weight, pH, SSC/TA, and total esters in four different F. ananassa “Camarosa,” “Cristal,” “Monterey,” and “Portola.”
“Camarosa”Total AnthocyaninTotal FlavonoidsSkin Color (a*)Total PhenolsFirmness aWeight apH aSSC/TA aTotal Esters b
Total anthocyanin
Total Flavonoids−0.093
Skin color (a*)0.765−0.477
Total phenols−0.614−0.820−0.877 *
Firmness−0.6030.798−0.6100.820
Weight0.799−0.6630.779−0.964 *−0.953 *
pH−0.918 *0.750−0.918 *0.8660.867−0.960
SSC/TA0.727−0.4540.599−0.853−0.8890.871−0.911 *
Total esters0.999 ***−0.0900.998 ***−0.610−0.5990.797−0.916 *0.723
“Cristal”Total AnthocyaninTotal FlavonoidsSkin Color (a*)Total PhenolsFirmness aWeight apH aSSC/TA aTotal Esters b
Total anthocyanin
Total Flavonoids−0.296
Skin color (a*)0.772−0.666
Total phenols−0.5270.917 *0.902 *
Firmness−0.6800.8880.6380.974 *
Weight0.903 *−0.6770.904 *−0.823−0.99 **
pH−0.8510.7500.8400.8830.963 *0.993 **
SSC/TA0.912−0.5380.911 *−0.793−0.8650.949 *−0.941 *
Total esters0.998 ***−0.2720.998 ***−0.494−0.655−0.891−0.8340.890
“Monterey”Total AnthocyaninTotal FlavonoidsSkin Color (a*)Total PhenolsFirmness aWeight apH aSSC/TA aTotal Esters b
Total anthocyanin
Total Flavonoids−0.303
skin color (a*)0.899 *−0.529
Total phenols−0.5860.925 *−0.809 *
Firmness−0.7310.843−0.7380.981 **
Weight0.8610.0320.877−0.977 *−0.925 *
pH−0.912 *0.657−0.922 *0.86670.946 *−0.934 *
SSC/TA0.935 *−0.5770.931 *−0.8254−0.920 *0.960 *−0.992 **
Total esters0.999 ***−0.2860.998 ***0.567−0.7150.846−0.903 *0.925 *
“Portola”Total anthocyaninTotal Flavonoidsskin color (a*)Total phenolsFirmness aWeight apH aSSC/TA aTotal esters b
Total anthocyanin
Total Flavonoids−0.388
skin color (a*)0.811 *−0−706
Total phenols−0.6470.944 *− 0.896 *
Firmness−0.71330.898−0.73130.993 *
Weight0.792−0.8270.772−0.967 *−0.987 **
pH−0.932 *0.695−0.920 *0.8750.910 *−0.943 *
SSC/TA0.899−0.6670.829−0.876−0.926 *0.970 *−0.964 *
Total esters0.996 **−0.3450.976 *−0.601−0.6640.746−0.9120.865
*, **, *** indicate significant at 0.01, 0.001 and 0.0001 p−value Fisher’s least significant difference (LSD) test. a obtained from Ramos et al., 2018 [7]; b obtained from Parra−Palma et al., (2019) [30].

