Article

Less Is More: Lower Sowing Rate of Irrigated Tef (Eragrostis tef) Alters Plant Morphology and Reduces Lodging

1
The Robert H. Smith Institute of Plant Sciences and Genetics in Agriculture, The Hebrew University of Jerusalem, Rehovot 7610001, Israel
2
Northern Agricultural R&D Authority, Kiryat Shmona 11016, Israel
3
Precision Agriculture Department, MIGAL–Galilee Research Institute, Kiryat Shmona 11016, Israel
*
Author to whom correspondence should be addressed.
Agronomy 2020, 10(4), 570; https://doi.org/10.3390/agronomy10040570
Submission received: 3 April 2020 / Revised: 11 April 2020 / Accepted: 13 April 2020 / Published: 16 April 2020
(This article belongs to the Special Issue Optimization of Water Usage and Crop Yield Using Precision Irrigation)

Abstract

:
Tef (Eragrostis tef (Zucc.) Trotter) is a panicle-bearing cereal crop plant, originating from and grown mainly in Ethiopia. Tef yields highly nutritious gluten-free grain as well as high-quality forage, therefore, interest is rising regarding tef cultivation for grain and forage outside Ethiopia. Lodging is a major factor limiting tef quality and yield, with losses estimated at 30%–35% and presumably higher under mechanical harvest. Studies in other cereal crops suggested that lowering plant density would lead to sturdier plants less prone to lodging. In this work, we reported on the effects of sowing rate on lodging, lodging-related traits, and productivity of tef under irrigated conditions. Four tef genotypes were grown under irrigation across two years at three sowing rates: low (3 kg/ha), medium (6 kg/ha), and high (common, 9 kg/ha). Grain yield and biomass did not differ significantly among sowing rates. The visually assessed lodging index (LI) increased as the season progressed, with the lowest values recorded under low sowing density. A significant difference in LI values among the tested genotypes suggested potential for crop improvement. Aerial RGB images of the field taken by an unmanned aerial vehicle twice during the second season produced a high-resolution crop surface model, which was used to assess lodging. Aerial-based LI values were significantly correlated with the ground-based ones and exhibited better capacity to identify minor differences in lodging. Among the morphological traits assessed, crown diameter, crown root number, and crown root diameter were significantly affected by sowing rate and genotype and were correlated with LI values. In summary, this study demonstrated for the first time the feasibility of tef production under irrigated Mediterranean conditions and the potential of a reduced sowing rate as a remedy for lodging.

1. Introduction

Tef (Eragrostis tef (Zucc.) Trotter) is a panicle-bearing cereal crop plant. It is an allotetraploid species with a chromosome number of 20 (2n = 4x = 40) and a genome size of about 730 Mb [1,2]. Tef has a thin culm, long narrow leaves, and a thousand kernel weight of 200–400 mg, making it the smallest grained cereal [3]. It has a C4 photosynthetic pathway, which allows efficient utilization of high solar radiation. Tef is highly durable to various stresses and thrives in a variety of environments [4].
Tef is grown mainly in Ethiopia, where it was presumably domesticated, as well as in other countries in the Horn of Africa. The earliest known archeological evidence of tef cultivation was found in Aksum, Ethiopia, dating back to 2700–2800 BP [5]. The tef crop occupies over 3 million ha in Ethiopia [6] and serves as a staple food for most of the local population [2]. Tef grain is gluten-free and contains all eight essential amino acids, as well as high contents of fiber, minerals, and vitamins [7]. Tef is also known as a high-quality forage crop thanks to its high feed quality, crude protein content, fast growth rate, and its suitability for multiple harvests [8,9]. Recognition of the unique nutritional properties of tef grain and forage raised global interest in its production and consumption. Today, in addition to Ethiopia, tef is cultivated as a forage and grain crop in the United States, Australia, Kenya, South Africa, and India [10].
Tef was tested in Israel as a forage crop alongside other species in the 1930s and found to be a promising feed crop [11]; however, it was not adopted as a new crop. In the last few decades, interest in tef was further enhanced in Israel following the massive immigration of Ethiopian Jews in the early 1990s, who continue to use it as their main staple. A ban on tef export, put into effect in 2009 by the Ethiopian government, caused a rise in tef grain and flour prices in Israel. For these reasons, as well as the interest in diversifying field crop rotation, the agricultural community in Israel is now reconsidering local tef production for grain and animal feed.
Adopting tef as a new crop in Israel requires the study and redefinition of various aspects of its management, as discussed in our previous paper [12]. A previous study in our laboratory [13], as well as the crop’s temperature requirements [9,14], suggested that tef should be sown in Israel during the spring (March–April) and grown during the hot and dry spring and summer; irrigation is therefore essential. These difficulties are exacerbated at the Hula Valley, a dried wetland which presents difficulties regarding cereal crop growth [15]. Another prerequisite of tef growing in Israel is full mechanization due to high labor costs and a low economic margin.
Lodging, defined as the state of permanent displacement of the stems from their upright position [16], is a major limiting factor of tef yield and quality. Yield loss in tef due to lodging is estimated to vary between 30% and 35% [17,18] and is likely to be even higher under mechanical harvest. Lodging-induced yield loss can be attributed to a reduction in the overall photosynthetic area of the plant exposed to direct radiation or, in some cases, to the bending of both phloem and xylem tubes, thereby interrupting water and nutrient flow [18]. The high humidity formed in a lodged canopy facilitates the development of mold, which reduces grain quality, as well as of other pathogens that further damage the plant [19].
Lodging is induced by the forces exerted by wind, rain, or irrigation, but usually by their combination; for example, rain weighing down plants and lubricating the soil combined with wind pushing plants toward the soil [16]. Lodging can be divided into stem lodging, in which the stem bends or breaks, and root lodging, in which a change in angle between the stem and the soil is caused by crown bending and/or root disanchoring in response to the torque exerted by the force of the wind on the stems [19]. Pinthus [16] claimed that unless stem breakage occurs, a stiffer culm transfers more force operating on the canopy to the plant part interacting with the soil. On the other hand, a flexible stem increases swing moment, which could increase the damage caused by minor force. This intricate relationship between the stem and root properties leading to lodging requires an in-depth analysis of both parts to address the causes of lodging in each species. Despite the delicate stem and leaf architecture of the tef plant, it appears to be mainly susceptible to root lodging (Figure 1), which is defined as “straight intact culms leaning from the crown” [16,19]. Since root lodging leads to a change in the angle between the culm and the soil, the actual tissue bending may be at the very bottom of the stem. However, our observations in field and pot trials (Figure 1) did not show any visual evidence of culm bending in tef.
Increasing soil moisture provides lubrication both at the surface, where the crown interacts with the soil, and in the rhizosphere, where the root hairs interact with soil particles, thereby reducing plant anchorage. When moisture is applied via rainfall or irrigation to both the topsoil and the plant canopy, it has a twofold effect, since the already weakened crown and root anchorage must cope with the higher torque exerted by the plants supporting the weight of canopy and irrigation water. It should also be noted that the impact of water drops on the plant produces an additional force operating on the stems.
The most commonly discussed approach to reducing lodging is to reduce plant height using either chemical treatments or genetic resources (such as the Rht1 gene in wheat) [20]. Changing the date of sowing, tilling practice, or sowing rate were also suggested as means to reduce lodging [16,19]. Reducing the number of plants in a row or increasing the intra-row space were shown to reduce lodging in wheat [16,19].
Available information on agricultural practices in Ethiopia and the United States [9,21,22] led Israeli farmers to apply a sowing rate of 10 kg/ha. Based on studies in wheat [19] and our own observations in tef, we hypothesized that lowering the plant density would lead to sturdier plants, which would be less prone to lodging. Hence, the objectives of this study were to test the effects of sowing rates on lodging, lodging-related traits, and productivity of tef under irrigated conditions.

2. Materials and Methods

2.1. Plant Material

Four accessions of tef (RTC-2, RTC-119, RTC-361, and RTC-400) were selected from the collection described in our previous work [12] due to their similar phenology. RTC-2 has white seeds, a high biomass, and a loose panicle. RTC-361 has white seeds, an average biomass, and an average panicle compactness. RTC-119 has brown seeds, high biomass, and an average panicle, and RTC-400 has brown seeds, high biomass, and a loose panicle.

2.2. Experimental Design and Management

Two field experiments were conducted during 2018 and 2019 in the Hula Valley in Northern Israel (33.113° N, 35.585° E), an area of wetland drained in the 1950s. Soil type at the experimental site was deep peat [23], consisting of 52% sand, 43% silt, 5% clay, and ~10% organic matter. Typical soil properties at the upper 30 cm layer were pH = 7.5, EC = 0.7 dS/m, N-NO3 = 42 mg/kg, N-NH4 = 8 mg/kg, P = 47 mg/kg, and K = 70 mg/kg. Decomposition of the high soil organic matter content releases NO3, hence, no mineral fertilization was necessary.
A factorial (4 genotypes × 3 sowing densities) randomized block design was employed with six replicates. Ten rows were sown in each 8 m × 1.6 m plot at three different sowing rates: low (3 kg/ha), medium (6 kg/ha), and high (9 kg/ha). The highest sowing rate treatment represented the common agricultural practice in Israel.
Soil preparation included tilling and flattening with a heavy-duty leveler and crumble roller tool (Zach Agricultural Equipment Afula, Afula, Israel) for a smooth and even seedbed. Seeds were tested each year to confirm similar germination rates of all genotypes and were treated with Vitavax® fungicide (Thiram + Carboxin, Gadot Agro Israel) at a rate of 100 µL/10 g seeds. Seeds were mechanically sown to a depth of 1 cm using a Plotseed S seeder (Wintersteiger, Ried im Innkreis, Austria). In 2018, sowing was conducted on 9 April. In 2019, due to an exceptionally long and rainy winter, sowing was postponed to 14 May, which led to a warmer (Figure 2) growing period and longer days compared to the 2018 season. The average maximum and minimum temperatures were 34.9/16.5 °C and 37.6/17.3 °C during the 2018 and 2019 experimental seasons, respectively, and the average wind speed was ~1.6 m/s in both years, with a maximum speed of 4.5 m/s.
Irrigation was applied using a sprinkler system in 2018 and a linear move (LM) irrigation system in 2019. The total amount of water applied was 378 mm in 2018 and 249 mm in 2019. Herbicides were applied twice every year, about two and six weeks after germination, to control broadleaf weeds. In 2018, Express® (Tribenuron methyl, DuPont de Nemours Inc., Wilmington, DE, USA) and Duplosan® (p-mecoprop, Adama-Agan, Ashdod, Israel) combined with Lotus® (cinidon-ethyl, Adama-Agan, Ashdod, Israel) were applied in first and second applications, respectively. In 2019, Basagran® (Bentazone, Adama-Agan, Ashdod, Israel) and Or® (Carfentrazone-ethyl, Tapazol Chemicals, Beit Shemesh, Israel) combined with Duplosan® were applied, respectively.

2.3. Assessment of Agronomic Traits

Seedling density was assessed at 10 days after emergence. A metal frame with inner dimensions of 25 × 100 cm was placed across the seedling rows in two locations per plot and the number of seedlings within this frame was counted.
The date of heading, i.e., full panicle exposure in at least 50% of the plot area, was determined based on twice-weekly observations. Plant phenology was scored as the number of days from planting to heading (DPH).
Culm length (CL) and panicle length (PL) were measured in the field at week 12 upon harvest. Three plants randomly selected from various parts of each plot were measured from the soil surface to the bottom and top of the panicle and used to calculate the average CL and PL per plot.
Harvest was conducted manually (due to plot size constrains) 12 weeks after emergence in both years. A metal frame of 25 × 100 cm was placed in the middle of the plot across six rows (excluding outer rows) and all of the biomass bordered by the frame was manually harvested and collected into paper bags. Biomass samples were dried in a hot glasshouse (max temp ~55 °C) for 2 weeks, weighed for total dry matter (TDM), and threshed using a LD350 thresher (Wintersteiger, Austria). Seed samples were cleaned of debris and grain yield (GY) was weighed. A random sample of ~1000 grains from each plot was counted using a DATA Count S-25 seed counter (DATA Technologies, Tsor’a, Israel) and weighed using an analytical scale to calculate the thousand grain weight.

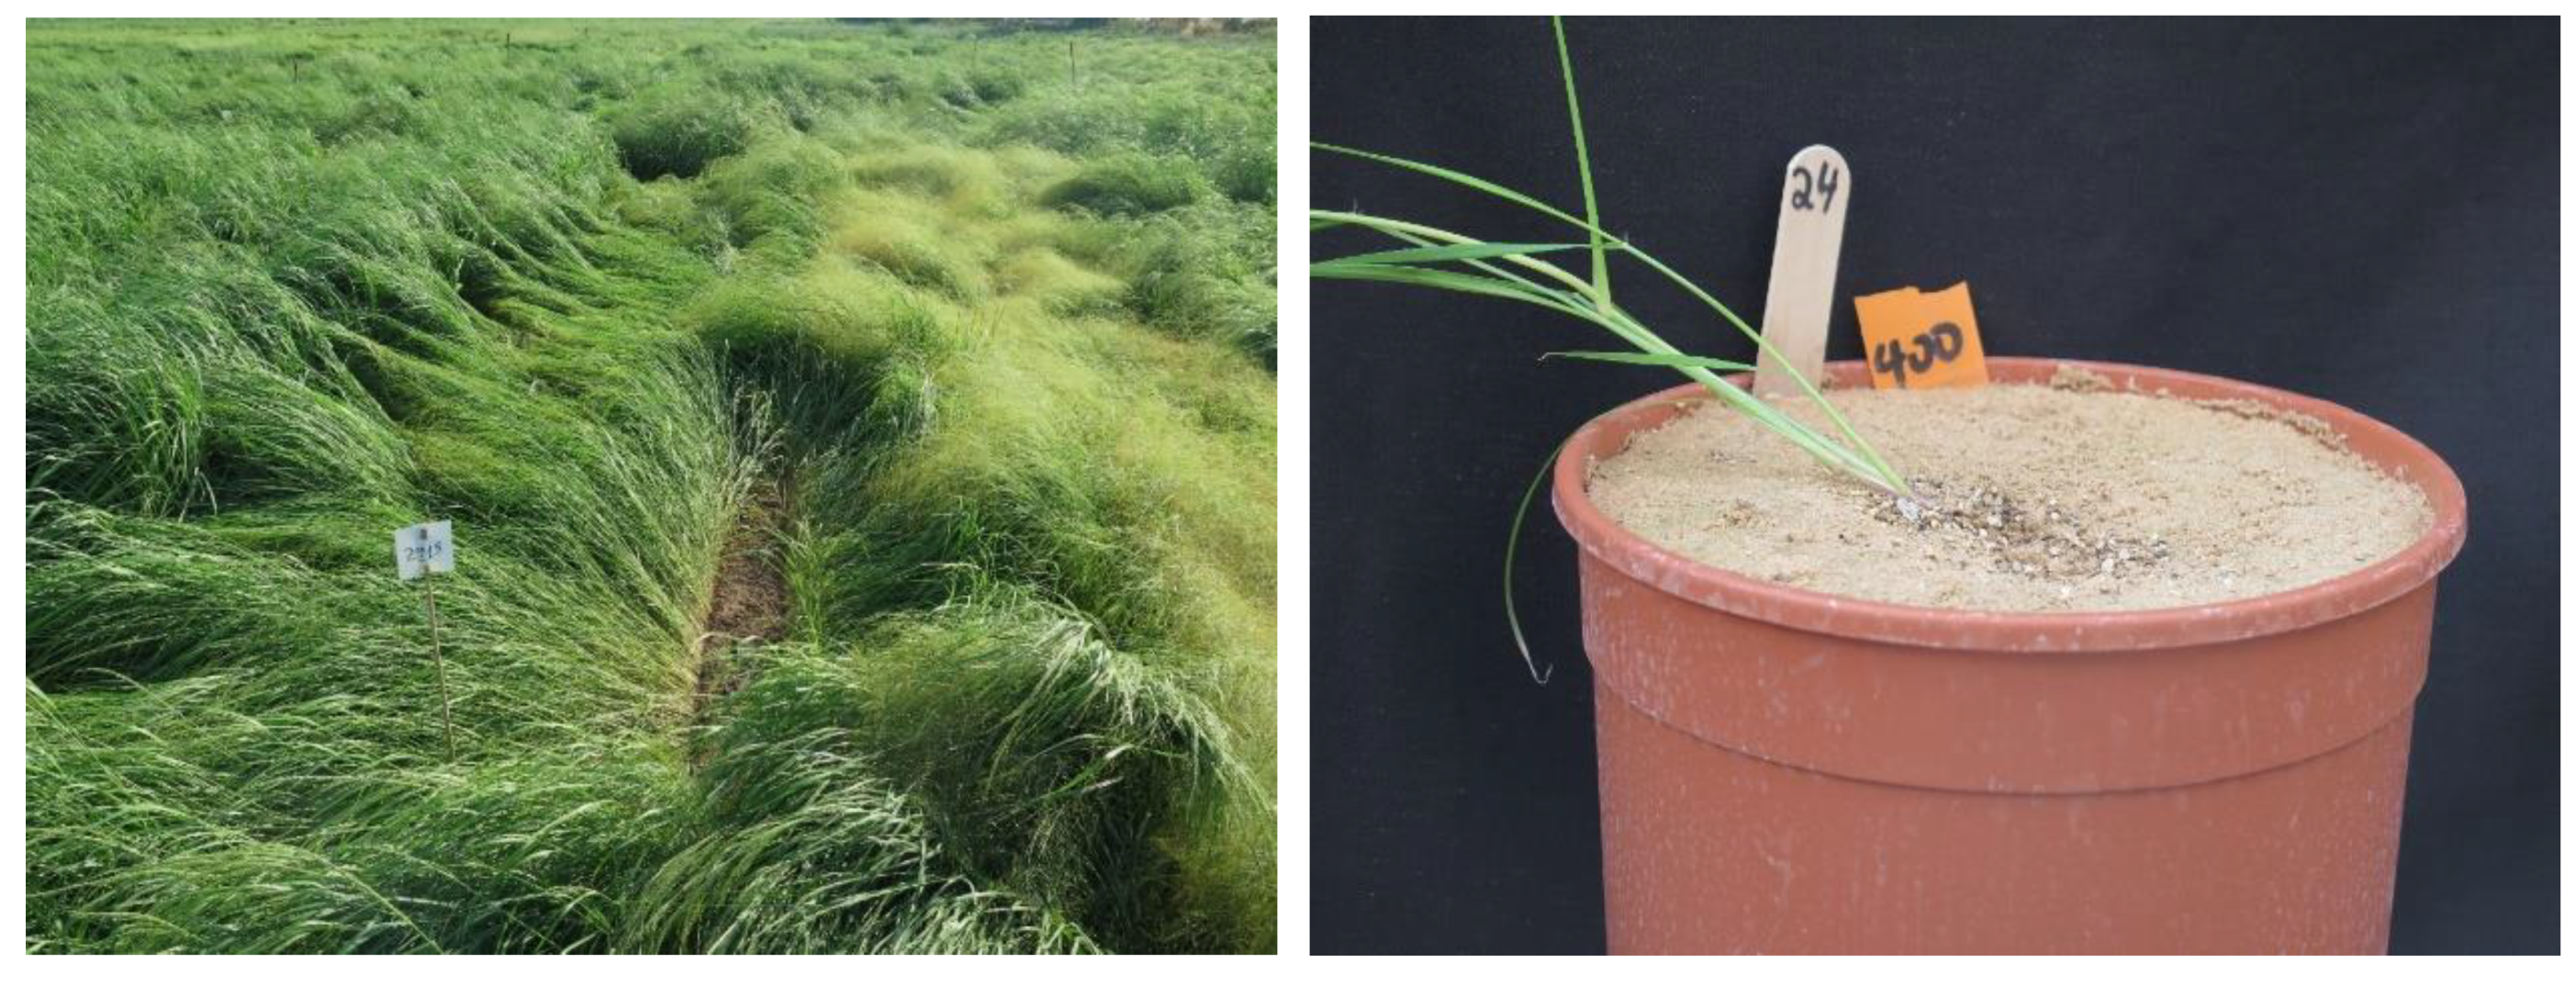
2.4. Lodging and Morphological Traits

Lodging was assessed visually by two independent surveyors twice a week starting from 6 weeks after emergence, using a scoring method adapted from Caldicott and Nuttall [24]. Lodging was scored on a 10-level severity scale (0 being an upright, non-lodging plant and 9 being a fully lodging plants), as well as for lodging prevalence (percentage of the entire plot area). The severity of lodging was multiplied by the percentage of the plot exhibiting each lodging score. The sum of these multiplications was calculated per plot to produce the lodging index (LI).
In 2019, three representative plants were collected from each plot at 7 weeks after emergence and individually phenotyped for lodging-related morphological traits. The most developed tiller of each plant was used to measure CL and count the number of internodes. The number of tillers that reached the 2ns leaf stage was counted. Plant crown diameter (CD) was calculated as the average of two perpendicular diameters at the middle of the crown (Figure 3). The number of crown roots (CR#) was recorded and the root diameter (RD) was calculated as the average of the basal diameters of three representative roots. All diameters were measured using an ABS Digimatic Caliper (Mitutoyo, Japan). Finally, the three plants were placed in paper bags and oven-dried (48 h, 70 °C) to determine the single-plant dry weight.

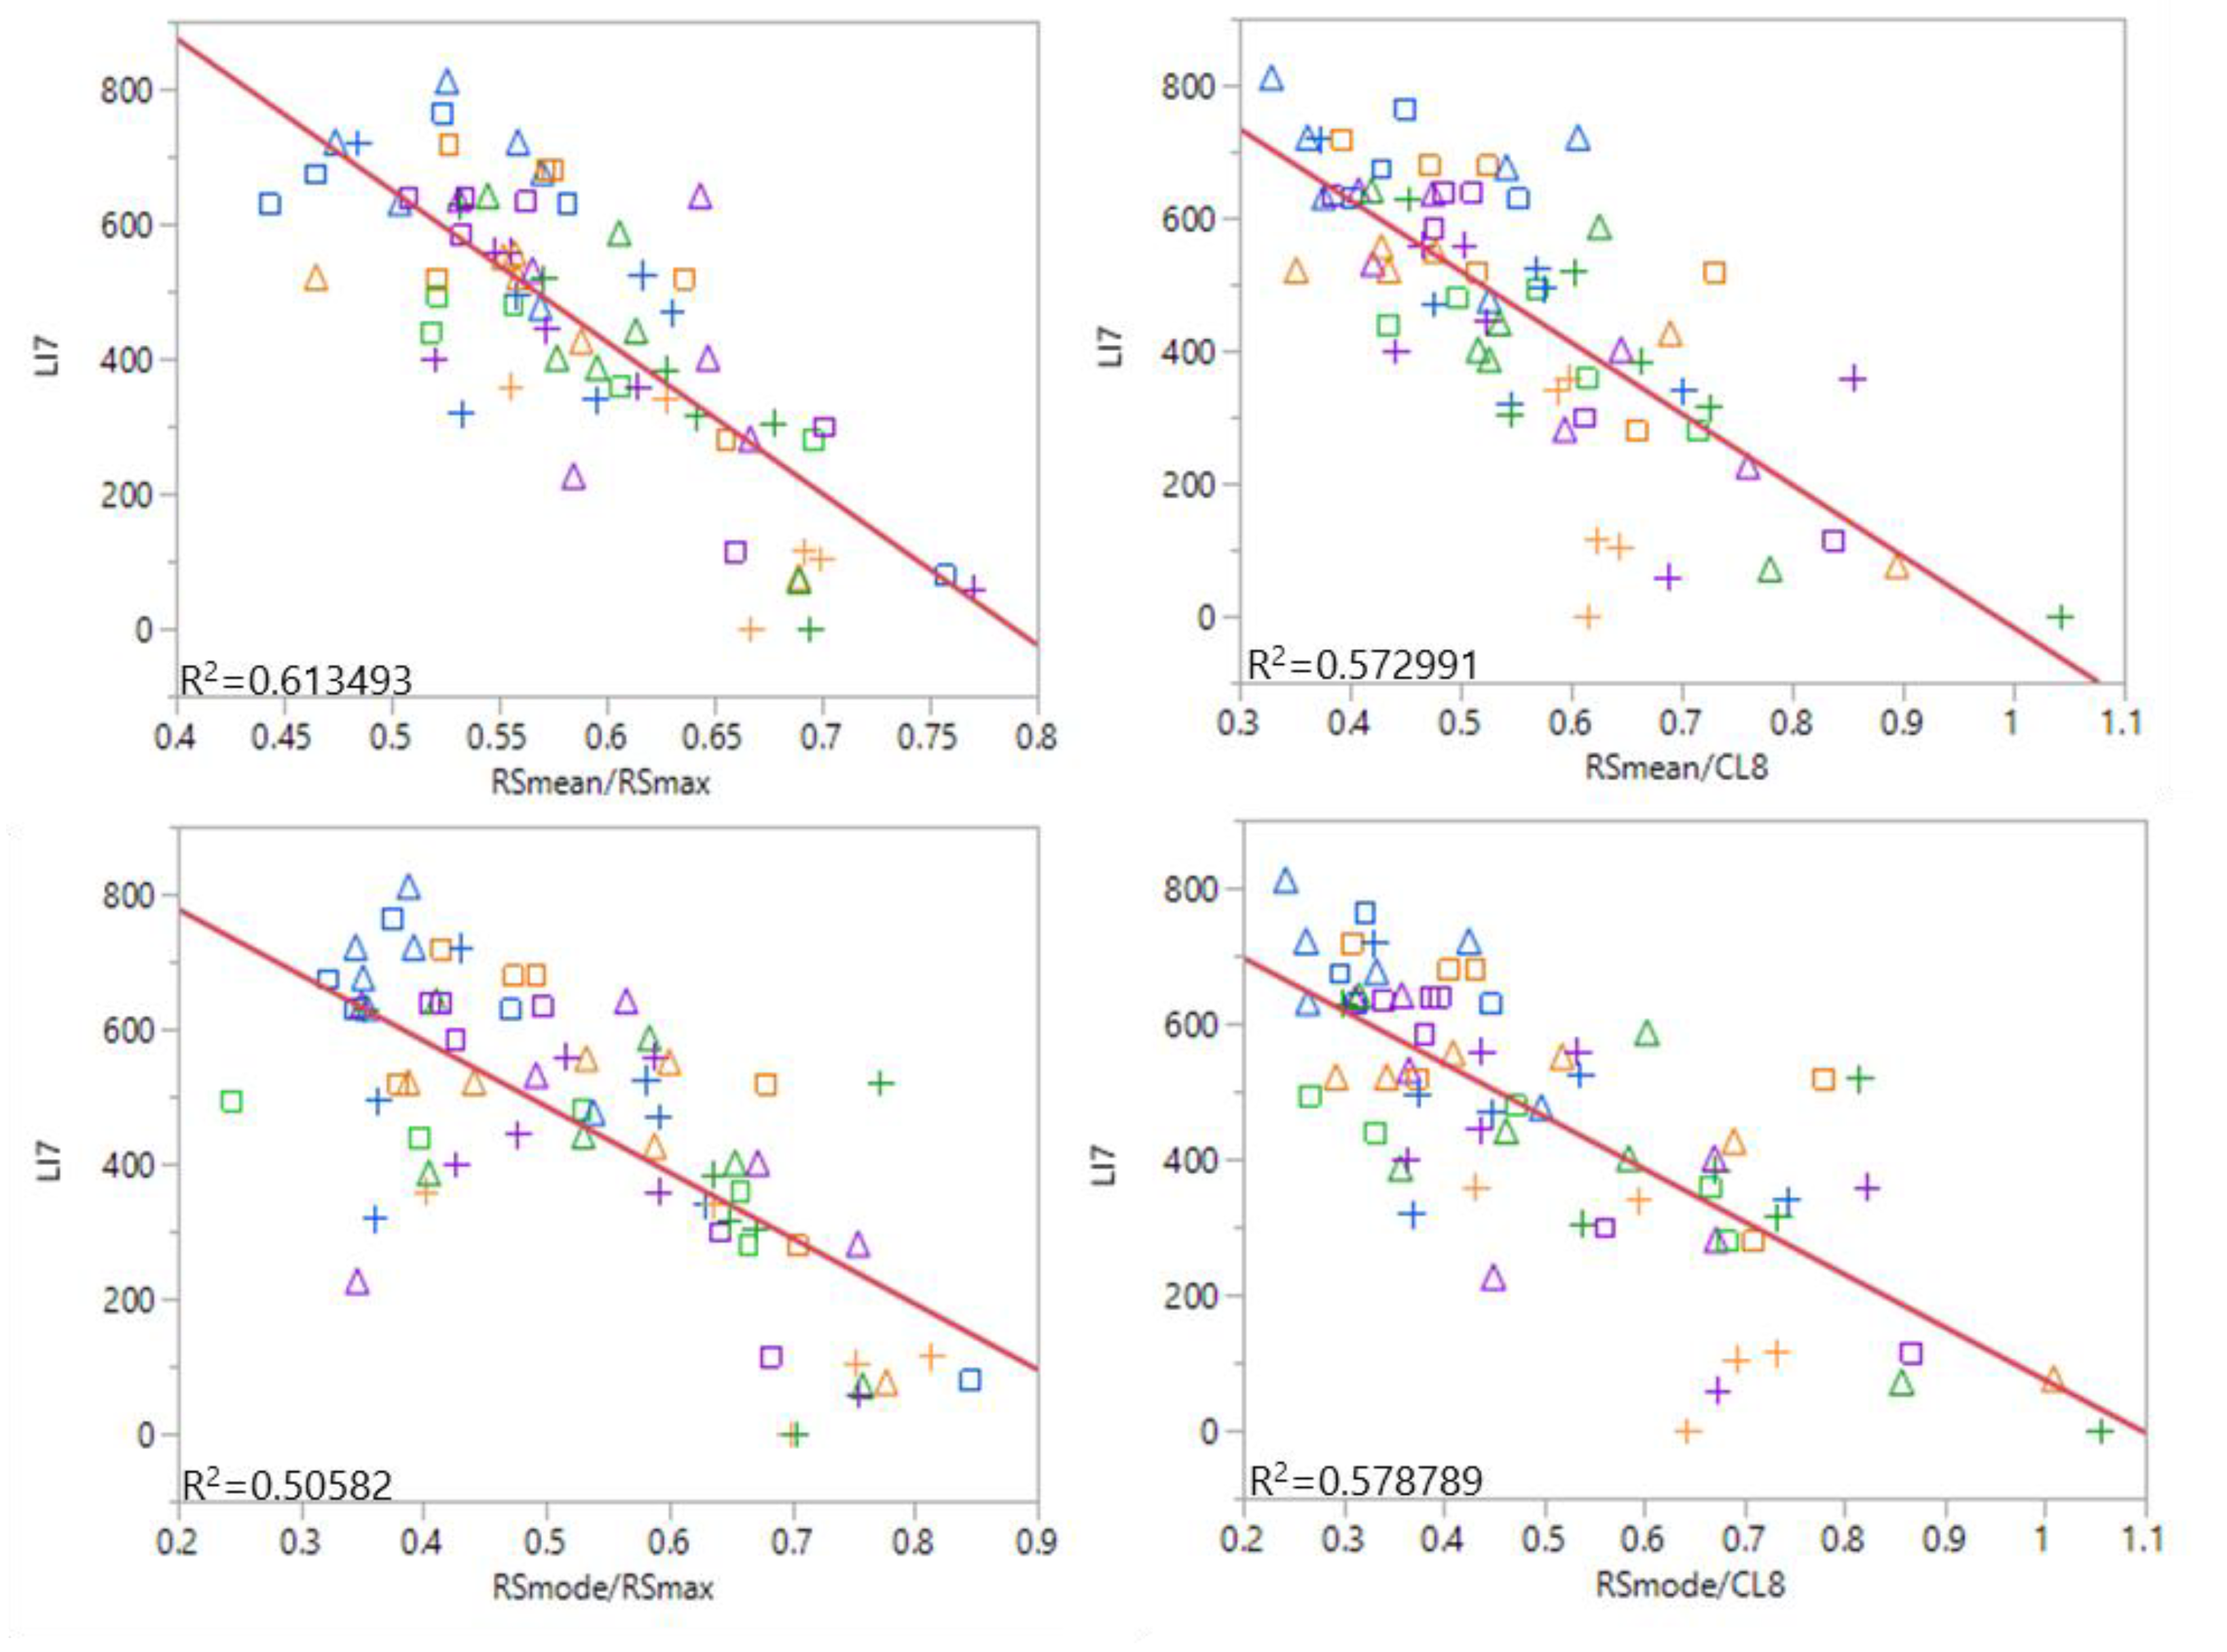
2.5. Remote Sensing of Lodging

Two flight campaigns were conducted in the 2019 growing season on 3 July and 24 July (7 and 10 weeks after emergence, respectively) to determine tef lodging. An unmanned aerial vehicle (UAV), the Phantom 4 quadcopter (DJI, China), was used as the flight platform. The UAV was equipped with a built-in RGB camera with a 4000 × 3000 pixel 4 K resolution sensor, a 20 mm (35 mm equivalent) lens with field of view of 94°, and a 3-axis gimbal stabilizer (https://www.dji.com/phantom-4/info). The UAV was flown using the Pix4Dcapture preprogrammed flightpath control set to “double grid” flight formation to create a 3D model to assess canopy height (Figure 4). Flight altitude was 25 m, with a camera angle of 70° (20° above tangent to ground), 80% front and side overlap, and a pixel size of 1.16 cm. The images taken by the UAV were processed into a 3D map with Pix4Dmapper using structure-from-motion (SfM) algorithms. The software created two ortho-mosaicked images, the digital terrain model (DTM) and the digital surface model (DSM). The absolute height of the crop was obtained by subtracting the DTM from the DSM. ESRI ArcMap 10.5 Spatial Analyst tools were used for this purpose. The final crop surface model (CSM) had a spatial resolution of 5.4 cm.
The remotely sensed mean-to-maximum height ratio (RSmean/RSmax), modal-to-maximum height ratio (RSmode/RSmax), remotely sensed mean height-to-actual CL ratio (RSmean/CL), and mode height-to-actual CL ratio (RSmode/CL) were calculated from the data obtained from the 3D model.

2.6. Statistical Analyses

Statistical analysis was conducted using JMP® Pro, Version 14, SAS Institute Inc., Cary, NC, 1989–2019, and included two-way analysis of variance, Tukey’s HSD test (for factors showing a significant F ratio), correlation, and principal component analysis.

3. Results

3.1. Plant Performance

Sowing rates of 3, 6, and 9 kg/ha, equivalent to about 850, 1700, and 2550 seeds/m2, respectively, produced significantly different seedling densities in 2018 and in 2019 (Table 1). Seedling densities were proportional to the various sowing rates, reflecting a seedling establishment rate of 25%–30% relative to the number of seeds sown. The thousand seed weight of the tested genotypes ranged between 360–400 and 280–310 mg in 2018 and 2019, respectively; hence, greater seed numbers sown in 2019 resulted in usually lower seedling densities, suggesting a lower germination rate in the second year.
Agronomic traits measured at the end of each season, including days from to heading, culm length, biomass, and grain yield, did not show significant differences, with the exception of panicle length in 2018 (Table 2). The DPH in 2018 did not differ among genotypes, but it did in 2019 (Table 3). The diverse phenologies observed in 2019 could have resulted from the longer days during the later growing season in that year and different susceptibilities of the genotypes to day length. Differences between seasons were also observed in other traits, with 2019 showing shorter PL and lower biomass and grain yield productivity (Table 3). A significant genotype by sowing rate (G*SR) interaction was found only in the case of CL in 2019 (Table 3), however, detailed analyses did not show significant differences between either the genotypes within sowing rates or between the sowing rates within genotypes (data not shown).

3.2. Lodging Development during the Growing Season

In both 2018 and 2019, LI values generally rose as the season progressed (Figure 5). The highest sowing rate (9 kg/ha) had the highest LI values throughout both seasons and the lowest sowing rate (3 kg/ha) had the lowest LI values, while the intermediate treatment (6 kg/ha) had intermediate LI values, which occasionally did not differ significantly (P < 0.05) from the higher or lower sowing rates. These differences remained significant at the end of the 2018 season, whereas at the end of 2019, the LI values of the different treatments did not differ (Figure 5).
During the vegetative stage at weeks 6–8 after emergence, higher LI values were recorded for 2019 relative to 2018 (Figure 5). These differences could have resulted from the faster growth rate in 2019 due to the higher temperature (Figure 2) and/or the higher rate of water application by the LM irrigation system used in 2019 compared to the sprinklers used in 2018. Following this observation, irrigation was paused during weeks 7 and 8 of 2019, resulting in a noticeable reduction in LI in week 9, and demonstrating the ability of tef plants to repair lodging to some extent.
Accession RTC-400 exhibited significantly higher LI values throughout both seasons (Figure 6). The lowest LI values were recorded for RTC-119 in 2018, with genotypes RTC-2 and RTC-361 showing intermediate values; in 2019, the three latter genotypes generally exhibited similar LI values with no significant differences between them, which were significantly lower than the RTC-400 LI values during most of the season.

3.3. Remote Sensing of Lodging

A UAV was used to acquire high-resolution SfM stereo-reconstructed 3D maps twice during the second season, in weeks 7 and 10. RGB-based canopy height ranged in both flights between 0 and 90 cm aboveground (Figure 4). Four LI-estimate approaches were examined, two fully based on remote sensing (RSmean/RSmax and RSmode/RSmax) and two on remote sensing vs. CL (RSmean/CL and RSmode/CL). Analysis of variance was used to assess the sensitivity of these four estimates compared to the ground-based LI values (Table S1). For measurements of both week 7 and 10, the fully remote-sensed lodging indices were significantly affected by both genotype and sowing density, whereas the remote-sensed vs. CL indices were significantly affected by sowing density in only one out of four cases and by genotype in two out of four cases. Ground-based LI values were significantly affected by genotype in both weeks and by sowing rate only in week 7.
Both fully remote-sensed and remote-sensed vs. ground LI values were compared to the ground-based LI values via regression analysis for weeks 7 and 10 individually. High lodging was represented in the remote-sensing-based indices by low values, whereas for the ground-based LIs, it received higher values; hence, the two types of variables were expected to be negatively correlated.
Correlations between all four remote-sensing-based indices and LI for week 10 were rather low (R2 values between 0.1 and 0.3, data not shown), possibly stemming from the narrow range of LI values among treatments during this week (Table S1). Nevertheless, in week 7, remote-sensing-based indices were highly correlated with LI (R2 between 0.5 and 0.6; Figure 7).

3.4. Mid-Season Lodging and Related Traits

A detailed characterization of lodging-related traits was conducted in 2019 at 8 weeks after emergence, a time point identified in our preliminary study as lodging onset. Indeed, differences among genotypes were among the largest at 8 weeks after emergence in both seasons (Figure 5). LI at week 8 (LI-8) was significantly affected by genotype and G*SR interaction in 2018 (data not shown), and by genotype and sowing rate factors in 2019 (Table 4).
The CD and RD measured in week 8 were significantly affected by sowing rate, with the highest values obtained under the lowest sowing rate (Table 4). Tiller number, internode number, CL, CR#, and single-plant dry weight (PDW) were not significantly affected by either genotype or sowing rate.
Correlation analyses between the various (ground- and remote-based) LI values and lodging-related traits revealed a significant association between lodging and CR#, CD, and RD (Table 5). A high CR# was correlated with reduced lodging (low LI value or high remote-based LI value) in three out of five cases. High CD was associated with high remote-based LI values (lower lodging), significantly so in three cases and nearly significant (P < 0.05) in one case. High RD was associated with reduced lodging in all five cases, with only one case falling below the 5% probability threshold.
Principal component analysis of 12 G*SR combinations resulted in three principal components. Components were only considered when their eigenvalues were higher than 1, according to the threshold set by Kaiser [25]. The three principal components jointly explained 81% of the variance of lodging and its related traits in week 8 (Figure 8). Principal component 1 explained 35.5% of the variance and was loaded positively with CD, RD, and single-plant weight, and negatively with LI-8 (Figure 8a,b, X-axis). Principal component 2 explained 25.4% of the variance and was loaded positively with CL and internode number (Figure 8a Y-axis and 107c X-axis). Principal component 3 explained 20.2% of the variance and was loaded positively with tiller number and single-plant weight, and negatively with CR# (Figure 8b,c, Y-axis). LI was negatively correlated (vector in opposite directions) with CR#, single-plant weight (Figure 8a), RD, and CD (Figure 8b), thus confirming the two-way correlation analyses.

4. Discussion

Tef is a staple crop in Ethiopia where it is grown mostly under traditional rain-fed conditions. Adapting tef to mechanized and irrigated agriculture in Israel requires the examination and redefinition of various aspects of the crop’s cultivation, which are currently ongoing.
The overall biomass production in our experiments was similar or slightly higher than the biomass reported in recent studies conducted in various areas of Ethiopia [21,26]. Grain yields were lower than those reported for modern varieties grown in Ethiopia [21,26]. The late sowing date in 2019 might have led to the later phenology and lower productivity observed in that year (Table 3). It is important to note that the yield and biomass data presented in this study were obtained under challenging soil and climate conditions of the Hula Valley [23].

4.1. Effects of Sowing Rate on Tef Productivity

Under traditional tef-growing practices, seeds are manually broadcasted on the soil surface and left uncovered, or are sometimes very lightly covered [27]. Under these conditions, the recommended sowing rate in Ethiopia is 25–30 kg/ha, whereas for mechanical broadcasting or drilling, 15 kg/ha is recommended [27].
A sowing rate of 5–25 kg/ha and row spacing of 5–25 cm were recently examined in various regions of Ethiopia, showing a minor effect with no apparent trend [21,28] or effect on crop productivity [29]. In the United States, the recommended sowing rate for forage tef is between 5 and 7 kg/ha for uncoated seeds and 9–10 kg/ha for coated seeds [9]. In the current study, sowing rates between 3 and 9 kg/ha had no impact on plant performance in terms of days to heading, grain yield, biomass, PL, or plant height (Table 2 and Table 3). We were not aware of any prior study reporting on tef-sowing rates lower than 5 kg/ha.
Grain yield is a product of plant density x number of fertile tillers per plant x number of grains per tiller x single-seed weight. In the current study, different numbers of seedlings (ca. 270 to 700 per m2) were established due to different sowing rates (Table 1). Nevertheless, grain yield was not affected by the treatments (Table 2 and Table 3), suggesting compensation for the lower plant density by other yield components. It is noteworthy that the manual harvest applied in the current study did not necessarily reflect the potential effect of lodging on yield loss under mechanical harvest. Thousand seed weight did not differ among treatments. The tiller number per plant, counted in 2019 shortly after lodging onset, exhibited a minor (but not significant) increase with decreasing sowing rate (Table 4); we could not rule out the possibility of differential tillering at a later stage. Therefore, number of fertile tillers and/or number of grains per tiller (neither of which were recorded at plant maturity) presumably increased and compensated for the lower plant density.

4.2. Lodging

The impact of plant density on lodging was studied in various cereal crops. In wheat (Triticum aestivum L.), lower plant densities and direct drilling increased the size of the root plate, plant anchorage, CR#, and crown root length, thus reducing the risk or severity of lodging [19]. In rice (Oryza sativa), lower plant densities were associated with lower mutual shading, resulting in stronger stems, higher plant biomass, shorter basal internodes, and reduced lodging [30]. In maize (Zea mays L.), low plant densities led to shorter basal internodes, higher culm and root diameters, and more roots, resulting in less lodging [31]. In sorghum (Sorghum bicolor L.), lower plant densities also led to stronger and thicker culms, which decreased the risk of lodging [32].
We are aware of only one study that assessed the effect of plant population (sowing rate and row spacing) on tef lodging [21], whereby lodging percentages were significantly different between sowing rates in one out of three experiments, with no apparent trend. Other recent studies on tef plant density did not assess lodging. Here, reduced plant density was associated with reduced lodging throughout most of the season across the two experiments (Figure 5). Therefore, our study seems to be the first to show a consistent reduction in tef lodging with decreasing plant density, in agreement with studies conducted on other cereals.
While sowing rate was the focus of the current study, lodging was also affected by irrigation method and genotype. Significant differences in LI values were detected among the four tef genotypes tested in the current study. RTC-119 exhibited consistently lower LI values across the two years and two different irrigation methods (Figure 6). In contrast, RTC-400 consistently presented the highest LI values, whereas RTC-361 and RTC-2 showed intermediate values in both years. The small set of genotypes selected for the current study, not based on their lodging performance, clearly demonstrated the existence of genetic diversity for this important trait. Five quantitative trait loci associated with LI were identified in a previous study [1], confirming the genetic basis of lodging susceptibility/resistance.
Tef is grown in Israel during the dry summer, when irrigation must be applied to support crop production [12]. This need was exacerbated by the high temperatures of the Hula Valley. Both rainfall and irrigation application enhance lodging, which is affected by both the volume of the water and the intensity of its delivery [16,19]. In our experiments, two irrigation methods were used, namely, sprinklers in 2018 and a LM system in 2019. The higher water-application rate of the LM system (approximately 150 mm/h) exerted a greater pressure on the plant than the lower delivery rate of sprinkler irrigation (approximately 15 mm/h), which may have accounted for the higher LI values recorded in 2019, particularly at the beginning of the scoring period (Figure 5 and Figure 6), suggesting that sprinkler irrigation is advantageous for tef growing. A possible remedy for increased lodging due to water pressure on the canopy under both the LM system and sprinkler irrigation could be a reduction in water application as the season progresses and the plants become more susceptible to lodging [18].

4.3. Remote Sensing of Lodging

Ground-based LI, which is generally assessed visually by one or several surveyors, suffers from two major limitations, namely, (a) a limited capacity to evaluate a large area at one time and (b) possible human bias. An automated remote-sensing technique can provide an objective evaluation of the entire field or experimental plot, thereby overcoming both of these issues.
Recent studies, making use of a variety of remote-sensing methodologies, reported a range of correlations between the visual and remotely sensed lodging data. One study used a low-altitude robotic helicopter to acquire RGB and near-infrared photographs to estimate canopy height in wheat [33]. The proportion of lodging, calculated as the percentage of pixels below 50 cm, ranged between 10% and 70%, which was verified by visual scores recorded during the same time period (correlation coefficients not reported). Yang et al. [34] used UAV imagery coupled with image-based modeling and texture analysis to assess lodging in rice, reporting an accuracy level of over 90%. Wilke et al. [35] used LIDAR technology to remotely assess canopy height and lodging in barley and presented R2 values of over 0.9 for both variables. The two latter studies demonstrated the potential of remote-sensing techniques to obtain reliable estimates of lodging. We are not aware of any prior attempt to quantify tef lodging by remote sensing.
In this study, we employed rather simple aerial RGB photography, complemented with 3D image processing, to assess canopy height. Four approaches to the lodging estimates were examined, two fully based on remote sensing and two based on remote sensing vs. CL. All four approaches showed significant correlations (R2 = 0.5–0.61) with the visual ground-based LI in week 7 (Figure 7). The major factor hindering the above correlation was assumed to stem from the limitations of ground-based lodging assessments. Fully remote-sensed LI’s, which have a clear advantage from a practical standpoint, were also more discriminatory between different levels of lodging at 10 weeks after emergence when ground-based LI values did not reveal any significant differences (Table S1).

4.4. Lodging-Related Morphological Traits

The development of semi-dwarf wheat genotypes as part of the Green Revolution is probably the most famous success story of reducing lodging by reducing plant height [20]. Similarly, most studies dealing with lodging in tef suggest reduced height as key for resistance to lodging [18,36,37,38]. In the current study, minor and nonsignificant differences were detected between the plant heights of the tested genotypes and the sowing densities, presented as CL measured at both lodging onset (week 8, Table 4) and at plant maturity (Table 2 and Table 3). Hence, our data can not support any conclusion regarding the relationship between plant height and lodging. However, the relatively uniform plant height enhanced the capacity to detect the effects of other morphological traits. A reduction in tiller number under higher plant densities was reported in sorghum [39] and wheat [40,41]. In tef, high tiller number was associated with high LI [42], but this was not the case in our study. It is worth noting that the plant densities tested in our study were considerably lower than those reported in most tef studies; such low densities may not induce sufficiently high competition between plants, resulting in nonsignificant effects on shoot traits (CL and tiller number). Single-plant weight at 8 weeks after emergence was the only shoot trait recorded in this study to show some association with lodging, though somewhat below the P < 0.05 significance threshold (Table 5).
Based on a previous publication [18] and our own observations (Figure 1) suggesting that tef is predominantly affected by root-borne lodging, the root–shoot junction (crown) morphology received special attention in the current study. Among the plant morphological traits recorded, tef lodging was significantly correlated with CD, CR#, and RD (Table 5, Figure 8). A review paper on cereal lodging suggested that cereals with thicker crowns were less likely to buckle under the mechanical pressure applied by the stems [16]. Two studies in tef discussed a negative correlation between CD and lodging [43,44]. A greater CD and CR# are associated with a substantial root plate, thereby improving plant anchorage, as reported for barley [45] and wheat [46]. In accordance with the current study, lower plant densities allow for higher assimilate availability to the plants due to lack of competition and higher exposure to light, thus facilitating the development of a stronger root system [16,19] (and references therein).

5. Conclusions

This study demonstrated for the first time the feasibility of tef production under irrigated Mediterranean conditions and the potential of a reduced sowing rate as a remedy for lodging. High-accuracy sowing rate and depth obtained by mechanical seeder, complemented with precise irrigation, enabled the establishment of the designated plant densities. Lodging was reduced during most of the two seasons under a low sowing rate with no penalty in terms of grain yield or biomass. These findings call for the study of even lower sowing rates, which could further decrease lodging without yield reduction. Based on the present results, the root–shoot junction and crown are the most critical plant parts related to root lodging in tef.
Both published studies and current results testify to the existence of genetic diversity in tef lodging, thereby providing a basis for breeding lodging-resistant tef cultivars. Remote sensing of lodging, complemented by newly discovered lodging related traits, provides a useful toolbox for further studies and breeding for resistance to this devastating phenomenon in tef.

Supplementary Materials

The following are available online: https://www.mdpi.com/2073-4395/10/4/570/s1, Table S1: Effects of genotypes and sowing rates on ground-based lodging index (LI) and remotely-sensed indices; mean pixel height (RSmean), modal pixel height (RSmode), maximum pixel height (RSmax), and culm length (CL) measured at early flowering (7–8 weeks after emergence) and late flowering (10 weeks after emergence) during the 2019 season.

Author Contributions

Conceptualization, S.B.-Z. and Y.S.; formal analysis, S.B.-Z., V.O.-L., and A.C.; funding acquisition, O.R. and Y.S.; investigation, S.B.-Z., O.R., N.G., and Y.G.; project administration, Y.S.; resources, A.C.; supervision, Y.S.; writing—original draft, S.B.-Z.; writing—review and editing, O.R., V.O.-L., A.C., N.G., Y.G., and Y.S. All authors have read and agreed to the published version of the manuscript.

Funding

This study was funded by The Israel Ministry of Agriculture and Rural Development, Chief Scientist Foundation (grant no. 21-01-0045) and the Northern Agricultural R&D Authority, Kiryat Shmona, Israel.

Acknowledgments

We thank Vered Barak, Tito Natanson, Roy Sade, Ayana Neta, Yonatan Goldwasser, Noa Kirby, Ori Harash, and Gilad Ben Israel for their technical assistance in the field and laboratory. S.B.-Z. is indebted to the Robert H. Smith Foundation for a doctoral fellowship award. Y.S. is the incumbent of the Haim Gvati Chair in Agriculture.

Conflicts of Interest

The authors declare no conflicts of interest.

References

  1. Yu, J.-K.; Graznak, E.; Breseghello, F.; Tefera, H.; Sorrells, M.E. QTL mapping of agronomic traits in tef [Eragrostis tef (Zucc) Trotter]. BMC Plant Biol. 2007, 7, 2–13. [Google Scholar] [CrossRef] [Green Version]
  2. Gebre, Y.G.; Bertolini, E.; Pè, M.E.; Zuccolo, A. Identification and characterization of abundant repetitive sequences in Eragrostis tef cv. Enatite genome. BMC Plant Biol. 2016, 16, 39. [Google Scholar] [CrossRef] [Green Version]
  3. Tatham, A.S.; Fido, R.J.; Moore, C.M.; Kasarda, D.D.; Kuzmicky, D.D.; Keen, J.N.; Shewry, P.R. Characterisation of the major prolamins of tef (Eragrostis tef) and finger millet (Eleusine coracana). J. Cereal Sci. 1996, 24, 65–71. [Google Scholar] [CrossRef]
  4. Ketema, S. Tef (Eragrostis tef): Breeding, Genetic Resources, Agronomy, Utilization and Role in Ethiopian Agriculture; Institute of Agricultural Research: Adis Ababa, Ethiopia, 1993. [Google Scholar]
  5. D’Andrea, A.C. T’ef (Eragrostis tef) in ancient agricultural systems of highland Ethiopia. Econ. Bot. 2008, 62, 547–566. [Google Scholar]
  6. The Federal Democratic Republic of Ethiopia, Central Statistical Agency. Agricultural Sample Survey 2016/2017; Report on area and production of major crops; The Federal Democratic Republic of Ethiopia, Central Statistical Agency: Adis Ababa, Ethiopia, 2017; Volume I. [Google Scholar]
  7. National Research Council. Lost Crops of Africa: Volume I: Grains, 1st ed.; National Academies Press: Washington, DC, USA, 1996; ISBN 978-0-309-04990-0. [Google Scholar]
  8. Matthew Davidson, J. Evaluating teff Grass as a Summer Forage; College of Agriculture Manhattan: Kansas, NY, USA, 2018. [Google Scholar]
  9. Miller, D. Teff Grass: Crop Overview and Forage Production Guide; Cal/West Seed Company: Woodland, CA, USA, 2010. [Google Scholar]
  10. Paff, K.; Asseng, S. A review of tef physiology for developing a tef crop model. Eur. J. Agron. 2018, 94, 54–66. [Google Scholar] [CrossRef]
  11. Horowitz, S. New field crops for Palestine. Jewish Agency Palest. Agric. Res. Stn. Rehovot. 1940, 26, 29–38. [Google Scholar]
  12. Ben-Zeev, S.; Bimro, J.; Barak, V.; Saranga, Y. Phenotypic diversity and heritability in Eragrostis tef under irrigated Mediterranean conditions. Isr. J. Plant Sci. 2018, 65, 222–231. [Google Scholar] [CrossRef]
  13. Bimro, J. Agronomic Aspects of Teff (Eragrostis tef) Cultivation in Israel; The Hebrew University of Jerusalem: Rehovot, Israel, 2016. [Google Scholar]
  14. Kebede, H.; Johnson, R.C.; Ferris, D.M. Photosynthetic response of Eragrostis tef to temperature. Physiol. Plant. 1989, 77, 262–266. [Google Scholar] [CrossRef]
  15. Cohen-Shacham, E.; Dayan, T.; Feitelson, E.; de Groot, R.S. Compromis entre services écologiques dans la gestion de zones humides: Le drainage et la réhabilitation de la Hula, Israël. Hydrol. Sci. J. 2011, 56, 1582–1601. [Google Scholar] [CrossRef]
  16. Pinthus, M.J. Lodging in Wheat, Barley, and Oats: The Phenomenon, its Causes, and Preventive Measures. Adv. Agron. 1974, 25, 209–263. [Google Scholar]
  17. Ketema, S. Studies of Lodging Floral Biology and Bredding Techniques in Tef (Eragrostis tef); University of London: London, UK, 1983. [Google Scholar]
  18. Van Delden, S.H.; Vos, J.; Ennos, A.R.; Stomph, T.J. Analysing lodging of the panicle bearing cereal teff (Eragrostis tef). New Phytol. 2010, 186, 696–707. [Google Scholar] [CrossRef] [PubMed]
  19. Berry, P.M.; Sterling, M.; Spink, J.H.; Baker, C.J.; Sylvester-Bradley, R.; Mooney, S.J.; Tams, A.R.; Ennos, A.R. Understanding and Reducing Lodging in Cereals. Adv. Agron. 2004, 84, 217–271. [Google Scholar]
  20. Würschum, T.; Langer, S.M.; Longin, C.F.H.; Tucker, M.R.; Leiser, W.L. A modern Green Revolution gene for reduced height in wheat. Plant J. 2017, 92, 892–903. [Google Scholar]
  21. Lakew, A.; Berhanu, T. Determination of seeding rate and inter row spacing on the yield of tef (Eragrostis tef Zucc. Trotter) in the dryland areas of Wag Lasta, North Eastern Amhara, Ethiopia. Arch. Agric. Environ. Sci. 2019, 4, 69–74. [Google Scholar] [CrossRef]
  22. Miller, D. Teff As an Alternative Summer Forage. In Proceedings of the California and Forge Symp and Westren Seed Conference, San Diago, CA, USA, 2–4 December 2008. [Google Scholar]
  23. Sade, R.; Litaor, M.I.; Shenker, M. Evaluation of groundwater and phosphorus transport in fractured altered wetland soils. J. Hydrol. 2010, 393, 133–142. [Google Scholar] [CrossRef]
  24. Caldicott, J.J.B.; Nuttall, A.M. A method for the assessment of lodging in cereal crops. J. Natl. Inst. Agric. Bot. 1979, 15, 88–91. [Google Scholar]
  25. Kaiser, H.F. The Application of Eelectronic Computers to Factor Aalaysis. Educ. Psychol. Meas. 1960, 20, 141–151. [Google Scholar] [CrossRef]
  26. Negash, W. Effect of Row Spacing on Yield and Yield Components of Teff [Eragrostis tef (Zucc.) Trotter] Varieties in Gonji Kolela District, North Western Ethiopia. J. Biol. Agric. Healthc. 2017, 7, 35–43. [Google Scholar]
  27. Ketema, S. Eragrostis tef (Zucc.) Trotter: Promoting the Conservation and Use of Underutilized and Neglected Crops; Institute of Plant Genetics and Crop Plant Research, Gatersleben/International Plant Genetic Resources Institute: Rome, Italy, 1997; ISBN 9290433043. [Google Scholar]
  28. Jabesa, K.B.; Abraham, T. Effect of Different Row Spacing, Levels of Nitrogen and Phosphorus Fertilizers on Yield Attributes, Productivity and Economics of Tef (Eragrostis tef). Int. J. Agric. Environ. Biotechnol. 2017, 10, 603–608. [Google Scholar] [CrossRef]
  29. Dereje, G.; Adisu, T.; Dimberu, A. Influence of Seed Rate and Row Spacing on Growth and Yield of Tef (Eragrostis tef) Production at Assosa, Benishangul-Gumuz Regional State, Western Ethiopia. Adv. Crop Sci. Technol. 2018, 06, 1–3. [Google Scholar] [CrossRef] [Green Version]
  30. Shah, L.; Yahya, M.; Shah, S.M.A.; Nadeem, M.; Ali, A.; Wang, J.; Riaz, M.W.; Rehman, S.; Wu, W.; Khan, R.M.; et al. Improving lodging resistance: Using wheat and rice as classical examples. Int. J. Mol. Sci. 2019, 20, 4211. [Google Scholar] [CrossRef] [PubMed] [Green Version]
  31. Xue, J.; Xie, R.Z.; Zhang, W.F.; Wang, K.R.; Hou, P.; Ming, B.; Gou, L.; LI, S. Research progress on reduced lodging of high-yield and -density maize. J. Integr. Agric. 2017, 16, 2717–2725. [Google Scholar] [CrossRef]
  32. Teetor, V.H.; Schmalzel, C.; Ray, D.T. Growing sweet sorghum (Sorghum bicolor [L.] moench) in clumps potentially reduces lodging in the arid-southwestern United States. Ind. Crops Prod. 2017, 107, 458–462. [Google Scholar] [CrossRef]
  33. Chapman, S.C.; Merz, T.; Chan, A.; Jackway, P.; Hrabar, S.; Dreccer, M.F.; Holland, E.; Zheng, B.; Ling, T.J.; Jimenez-Berni, J. Pheno-copter: A low-altitude, autonomous remote-sensing robotic helicopter for high-throughput field-based phenotyping. Agronomy 2014, 4, 279–301. [Google Scholar] [CrossRef] [Green Version]
  34. Yang, M.-D.; Huang, K.-S.; Kuo, Y.-H.; Tsai, H.; Lin, L.-M. Spatial and Spectral Hybrid Image Classification for Rice Lodging Assessment through UAV Imagery. Remote Sens. 2017, 9, 583. [Google Scholar] [CrossRef] [Green Version]
  35. Wilke, N.; Siegmann, B.; Klingbeil, L.; Burkart, A.; Kraska, T.; Muller, O.; van Doorn, A.; Heinemann, S.; Rascher, U. Quantifying Lodging Percentage and Lodging Severity Using a UAV-Based Canopy Height Model Combined with an Objective Threshold Approach. Remote Sens. 2019, 11, 515. [Google Scholar] [CrossRef] [Green Version]
  36. Assefa, K.; Ketema, S.; Tefera, H.; Kefyalew, T.; Hundera, F. Trait diversity, heritability and genetic advance in selected germplasm lines of tef [Eragrostis tef (Zucc.) Trotter]. Hereditas 2000, 133, 29–37. [Google Scholar] [CrossRef]
  37. Habteab, G.; Richard, B.; Shimelis, H.; Mark, L. The efficacy of four gametocides for induction of pollen sterility in Eragrostis tef (Zucc.) Trotter. Afr. J. Biotechnol. 2015, 14, 774–780. [Google Scholar] [CrossRef] [Green Version]
  38. Josst, M.; Esfeld, K.; Burian, A.; Cannarozzi, G.; Chanyalew, S.; Kuhlemeier, C.; Assefa, K.; Tadele, Z. Semi-dwarfism and lodging tolerance in tef (Eragrostis tef) is linked to a mutation in the alpha-Tubulin 1 gene. J. Exp. Bot. 2015, 66, 933–944. [Google Scholar] [CrossRef] [Green Version]
  39. Snider, J.L.; Raper, R.L.; Schwab, E.B. The effect of row spacing and seeding rate on biomass production and plant stand characteristics of non-irrigated photoperiod-sensitive sorghum (Sorghum bicolor (L.) Moench). Ind. Crops Prod. 2012, 37, 527–535. [Google Scholar] [CrossRef] [Green Version]
  40. Lafarge, T.A.; Broad, I.J.; Hammer, G.L. Tillering in grain sorghum over a wide range of population densities: Identification of a common hierarchy for tiller emergence, leaf area development and fertility. Ann. Bot. 2002, 90, 87–98. [Google Scholar] [CrossRef] [Green Version]
  41. Faris, D.G.; De Pauw, R.M. Effect of seeding rate on growth and yield of three spring wheat cultivars. F. Crop. Res. 1980, 3, 289–301. [Google Scholar] [CrossRef]
  42. Girma, D. The Relationships between Stem Characters and Lodging Tolerance in Tef (Eragrostis tef) Genotypes. Ethiop. J. Agric. Sci. 2019, 29, 59–70. [Google Scholar]
  43. Zeid, M.; Yu, J.-K.; Assefa, K.; Tefera, H.; Sorrells, M.E.; Belay, G. Breeding tef [Eragrostis tef (Zucc.) trotter]: Conventional and molecular approaches. Plant Breed. 2010, 130, 1–9. [Google Scholar]
  44. Zeid, M.; Belay, G.; Mulkey, S.; Poland, J.; Sorrells, M.E. QTL mapping for yield and lodging resistance in an enhanced SSR-based map for tef. Theor. Appl. Genet. 2011, 122, 77–93. [Google Scholar] [CrossRef] [PubMed]
  45. Adnew, T.; Ketema, S.; Tefera, H.; Sridhara, H. Genetic diversity in tef [Eragrostis tef (Zucc.) Trotter] germplasm. Genet. Resour. Crop Evol. 2005, 52, 891–902. [Google Scholar] [CrossRef]
  46. Berry, P.M.; Griffin, J.M.; Sylvester-Bradley, R.; Scott, R.K.; Spink, J.H.; Baker, C.J.; Clare, R.W. Controlling plant form through husbandry to minimise lodging in wheat. Field Crop. Res. 2000, 67, 59–81. [Google Scholar] [CrossRef]
Figure 1. Root lodging in tef grown in field plots (left) and pot (right).
Agronomy 10 00570 g001
Figure 2. Daily minimum and maximum air temperatures measured at the Hula experimental site during the 2018 (top) and 2019 (bottom) seasons. Arrows indicate date of sowing and horizontal bars indicate heading periods across treatments and genotypes.
Agronomy 10 00570 g002
Figure 3. Typical root–shoot junction (crown) of tef, demonstrating the crown diameter measuring point and the crown roots used to record their number and diameter.
Agronomy 10 00570 g003
Figure 4. Aerial RGB photograph (left) and 3D canopy height modeling (right) of the 2019 experiment in week 7 after emergence. The arc-like line is the track mark made by the linear move irrigation system when shifting to the adjacent experimental plot.
Agronomy 10 00570 g004
Figure 5. Lodging development (expressed as lodging index) between week 6 and 12 (season end) in 2018 (top) and 2019 (bottom). Data were averaged across genotypes for the three sowing rates: 9 kg/ha (blue), 6 kg/ha (red), and 3 kg/ha (grey). Linear fits and their R2 values are presented. Different letters at a given time point indicate significant differences at P < 0.05.
Agronomy 10 00570 g005
Figure 6. Lodging development (expressed as lodging index) between week 6 and 12 (season end) in 2018 (top) and 2019 (bottom). Data were averaged across sowing rates for the four genotypes: RTC-400 (blue), RTC-2 (grey), RTC-361 (red), and RTC-119 (orange). Linear fits and their R2 values are presented. Different letters at a given time point indicate significant differences at P < 0.05.
Agronomy 10 00570 g006
Figure 7. Regressions of remotely sensed lodging index values vs. ground-based lodging index (LI) values measured in the same week (LI-7). Mean and modal pixel height value divided by the maximum pixel height value (top left and bottom left, respectively) or by the actual culm length (CL) measured in the field in week 8 (top right and bottom right, respectively). Squares, triangles, and pluses represent 9 kg/ha, 6 kg/ha, and 3 kg/ha sowing rates, respectively. Purple, blue, orange, and green shapes represent accessions RTC-400, RTC-2, RTC-361, and RTC-119, respectively. R2 values are presented on each figure. All correlations were significant (P < 0.001).
Agronomy 10 00570 g007
Figure 8. Principal component analysis of lodging index at 8 weeks after emergence (LI-8) and lodging-related morphological traits assessed during that week. The three principal components are presented in all combinations: 1 and 2 (a), 1 and 3 (b), and 2 and 3 (c). Opposing vectors indicate a negative association between traits, whereas vectors with similar directions indicate a positive association. Squares, triangles, and pluses represent 9 kg/ha, 6 kg/ha, and 3 kg/ha sowing rates, respectively. Purple, blue, orange, and green shapes represent accessions RTC-400, RTC-2, RTC-361, and RTC-119, respectively. Crown diameter (CD), root diameter (RD), number of crown roots (CR#), and single-plant weight (SPW).
Agronomy 10 00570 g008
Table 1. Effects of genotypes and sowing rates on seedling density in the 2018 and 2019 seasons.
Source of VarianceSeedling Density 2018Seedling Density 2019
Genotype effect (seedlings/m2)
RTC-2517b395b
RTC-119409c447a
RTC-361631a452a
RTC-400497b459a
Sowing rate effect (seedlings/m2)
3 kg/ha270c266c
6 kg/ha531b441b
9 kg/ha740a607a
F ratio
Genotype (G) (df = 3)16.4 ***5.77 **
Sowing rate (SR) (df = 2)145.2 ***248.5 ***
G*SR (df = 6)2.95 *0.81
Block (df = 5)1.131.07
*, **, *** Significant at P < 0.05, 0.01 and 0.001, respectively. Significant values are bolded. Different letters indicate significant differences between treatments or genotypes (P < 0.05).
Table 2. Effects of genotypes and sowing rates on tef characteristics measured at the end of the 2018 season. Phenology: days from planting to heading (DPH); morphology: culm length at week 12 (CL-12), panicle length (PL); productivity: total dry matter (TDM), grain yield (GY), thousand seed weight (TSW).
Source of VarianceDPHCL-12 (cm) PL (cm) TDM (g/m2) GY (g/m2) TSW (mg)
Genotype effect
RTC-257.786.745.4a2307168.9282.4b
RTC-11956.783.048.6a2376138.0312.0a
RTC-36156.381.840.6b2221130.4294.4b
RTC-40057.484.646.0a2478180.9292.1b
Sowing rate effect
3 kg/ha56.584.247.1a2286170.8298.7
6 kg/ha57.185.643.1b2360142.7293.3
9 kg/ha57.582.345.1ab2390150.1294.1
F ratio
Genotype (G) (df = 3)1.292.347.96 ***0.622.449.8 ***
Sowing rate (SR) (df = 2)0.941.923.65 *0.201.170.7
G*SR (df = 6)1.231.090.451.330.861.3
Block (df = 5)2.94 *5.59 ***0.712.003.36 *1.2
*, *** Significant at P < 0.05 and 0.001, respectively. Different letters indicate significant differences between treatments or genotypes (P < 0.05).
Table 3. Effects of genotypes and sowing rates on tef characteristics measured at the end of the 2019 season. Phenology: days from planting to heading (DPH); morphology: culm length at week 12 (CL-12), panicle length (PL); productivity: total dry matter (TDM), grain yield (GY), thousand seed weight (TSW).
Source of VarianceDPHCL-12 (cm) PL (cm) TDM (g/m2)GY (g/m2) TSW (mg)
Genotype effect
RTC-260.0b68.744.91855ab81.4267.5
RTC-11956.9c70.543.51709ab84.5248.8
RTC-36158.2bc72.341.11645b89.8253.0
RTC-40066.3a70.845.22018a99.8239.6
Sowing rate effect
3 kg/ha59.671.845.26171290.4249.9
6 kg/ha61.269.642.45184592.2249.8
9 kg/ha60.270.343.29186484.0257.0
F ratio
Genotype (df = 3)27.38 ***1.741.532.88 *0.541.2
Sowing rate (df = 2)1.521.451.320.990.200.2
G*SR (df = 6)0.832.34 *1.030.851.170.9
Block (df = 5)2.69 *2.88 *1.703.47 **3.54 **1.9
*, **, *** Significant at P < 0.05, 0.01 and 0.001, respectively. Different letters indicate significant differences between treatments or genotypes (P < 0.05).
Table 4. Effects of genotype and sowing rate on lodging and related morphological traits assessed 8 weeks after emergence in the 2019 experiment: lodging index (LI-8), crown diameter (CD), tiller number (Tiller #), internode number (Internode #), single-plant dry weight (SPW), culm length (CL-8), root diameter (RD), and number of crown roots (CR#).
Source of VarianceLI-8CD (mm)Tiller #Internode #SPW (g) CL-8 (cm) RD (mm) CR#
Genotype effect
RTC-2518.4b6.364.475.334.0972.060.6411.30
RTC-119435.7b6.164.244.983.4269.100.6512.88
RTC-361450.5b6.503.655.203.3270.100.6712.62
RTC-400710.9a6.174.174.943.1469.770.6311.11
Sowing rate effect
3 kg/ha454.8b6.80a4.335.013.7467.610.68a12.06
6 kg/ha541.5a6.11b4.145.213.3372.510.61b11.79
9 kg/ha584.3a5.98b3.925.123.4070.640.65ab12.08
F ratio
Genotype (df = 3)25.2 ***0.661.902.032.300.211.081.47
Sowing Rate (df = 2)9.4 ***6.41 **0.860.870.901.076.50 **0.06
G*SR (df = 6)1.431.450.620.720.320.310.950.89
Block (df = 5)2.24 *0.880.653.24 *0.881.460.830.84
*, **, *** Significant at P < 0.05, 0.01 and 0.001, respectively. Different letters indicate significant differences between treatments or genotypes (P < 0.05).
Table 5. Correlations between morphological traits (number of crown roots (CR#), crown diameter (CD), root diameter (RD), and single-plant weight (SPW)) and four approaches to lodging index estimates, i.e., two based fully on remote sensing (RSmean/RSmax and RSmode/RSmax) and two based on remote sensing vs. culm length (CL) (RSmean/CL and RSmode/CL) in the 2019 experiment. Correlations with ground-based lodging index estimates recorded at week 8 after emergence (LI-8) are presented as references.
LI-8RSmean/RSmaxRSmode/RSmaxRSmean/CL-8RSmode/CL-8
Tiller#−0.090.170.070.220.11
CL-80.13−0.22−0.3−0.71 **−0.60 *
Internode#−0.230.110.06−0.37−0.25
CR#−0.67 *0.510.58 *0.40.5
CD−0.450.57 *0.67 *0.510.62 *
RD−0.58 *0.54 0.65 *0.64 *0.66 *
SPW−0.470.55 0.420.260.24
*, ** Significant at P < 0.05 and 0.01, respectively.

