Managing Phosphorus Loss from Agroecosystems of the Midwestern United States: A Review


Abstract
1. Introduction
2. Phosphorus Cycling and Fertilizer Recommendations
2.1. 4Rs of Phosphorus Management
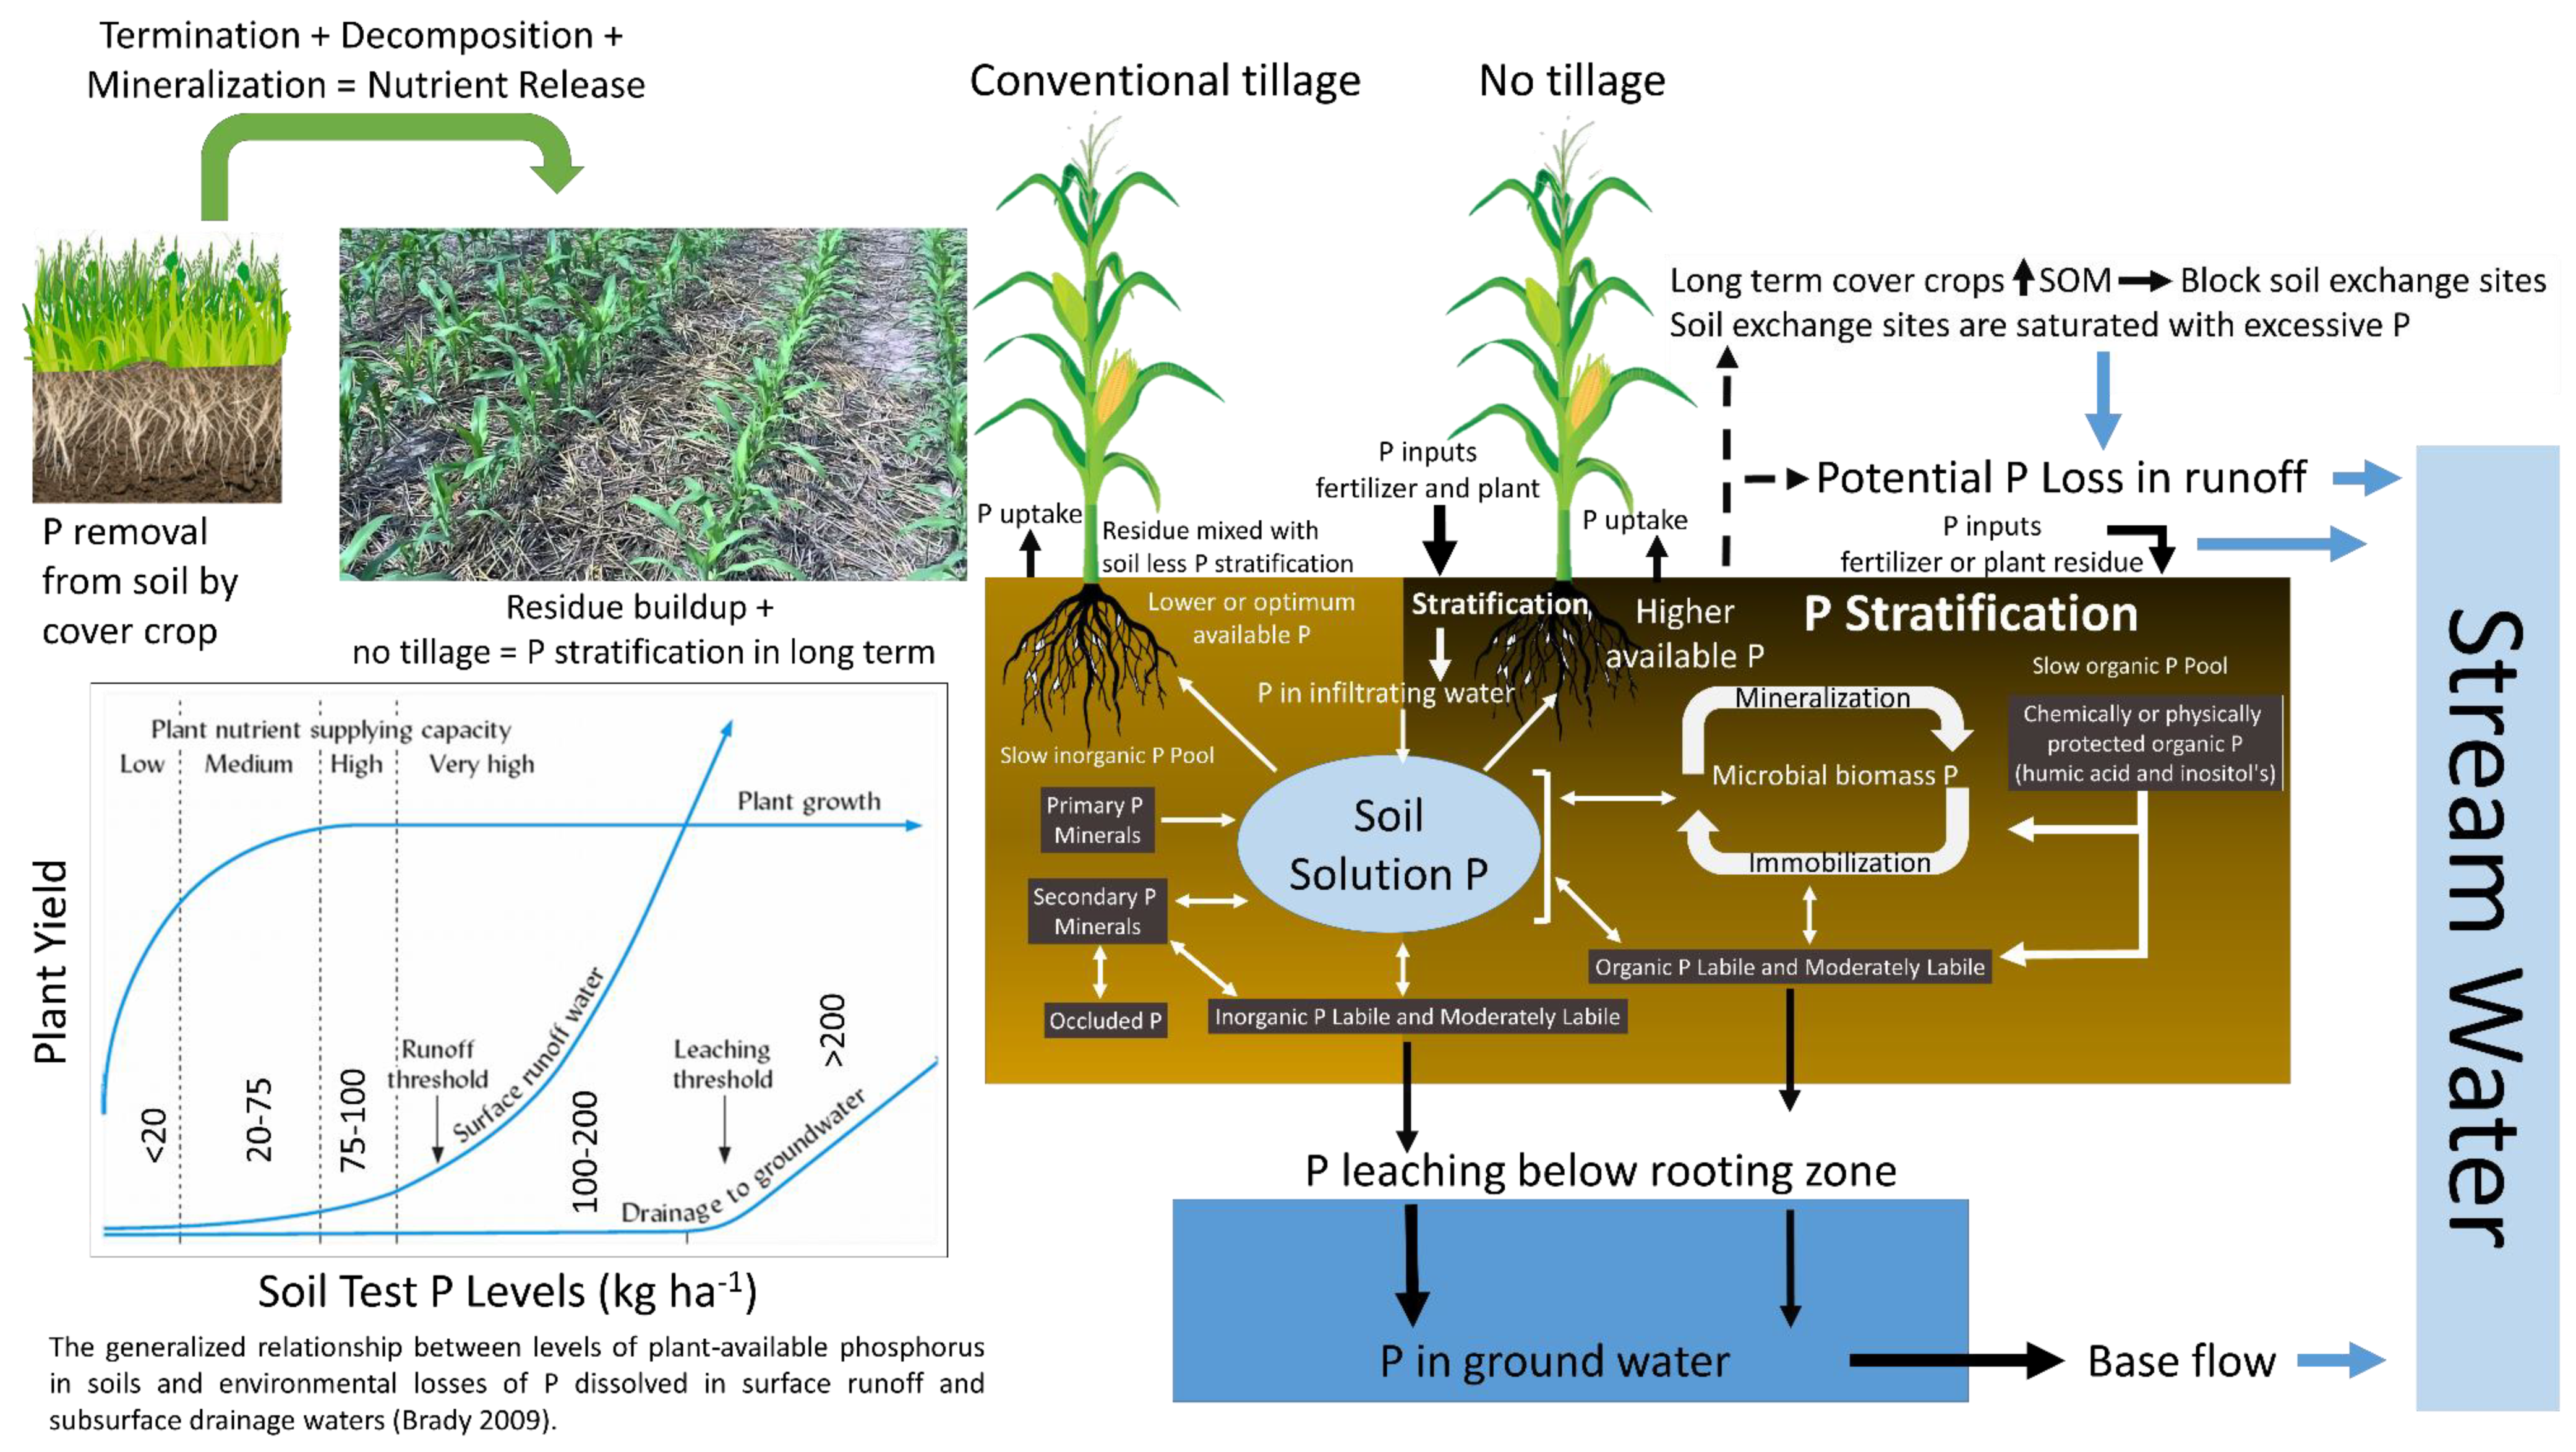
2.2. Phosphorus Stratification
2.3. Amendments, Enhanced Phosphorus Fertilizer, and Additives
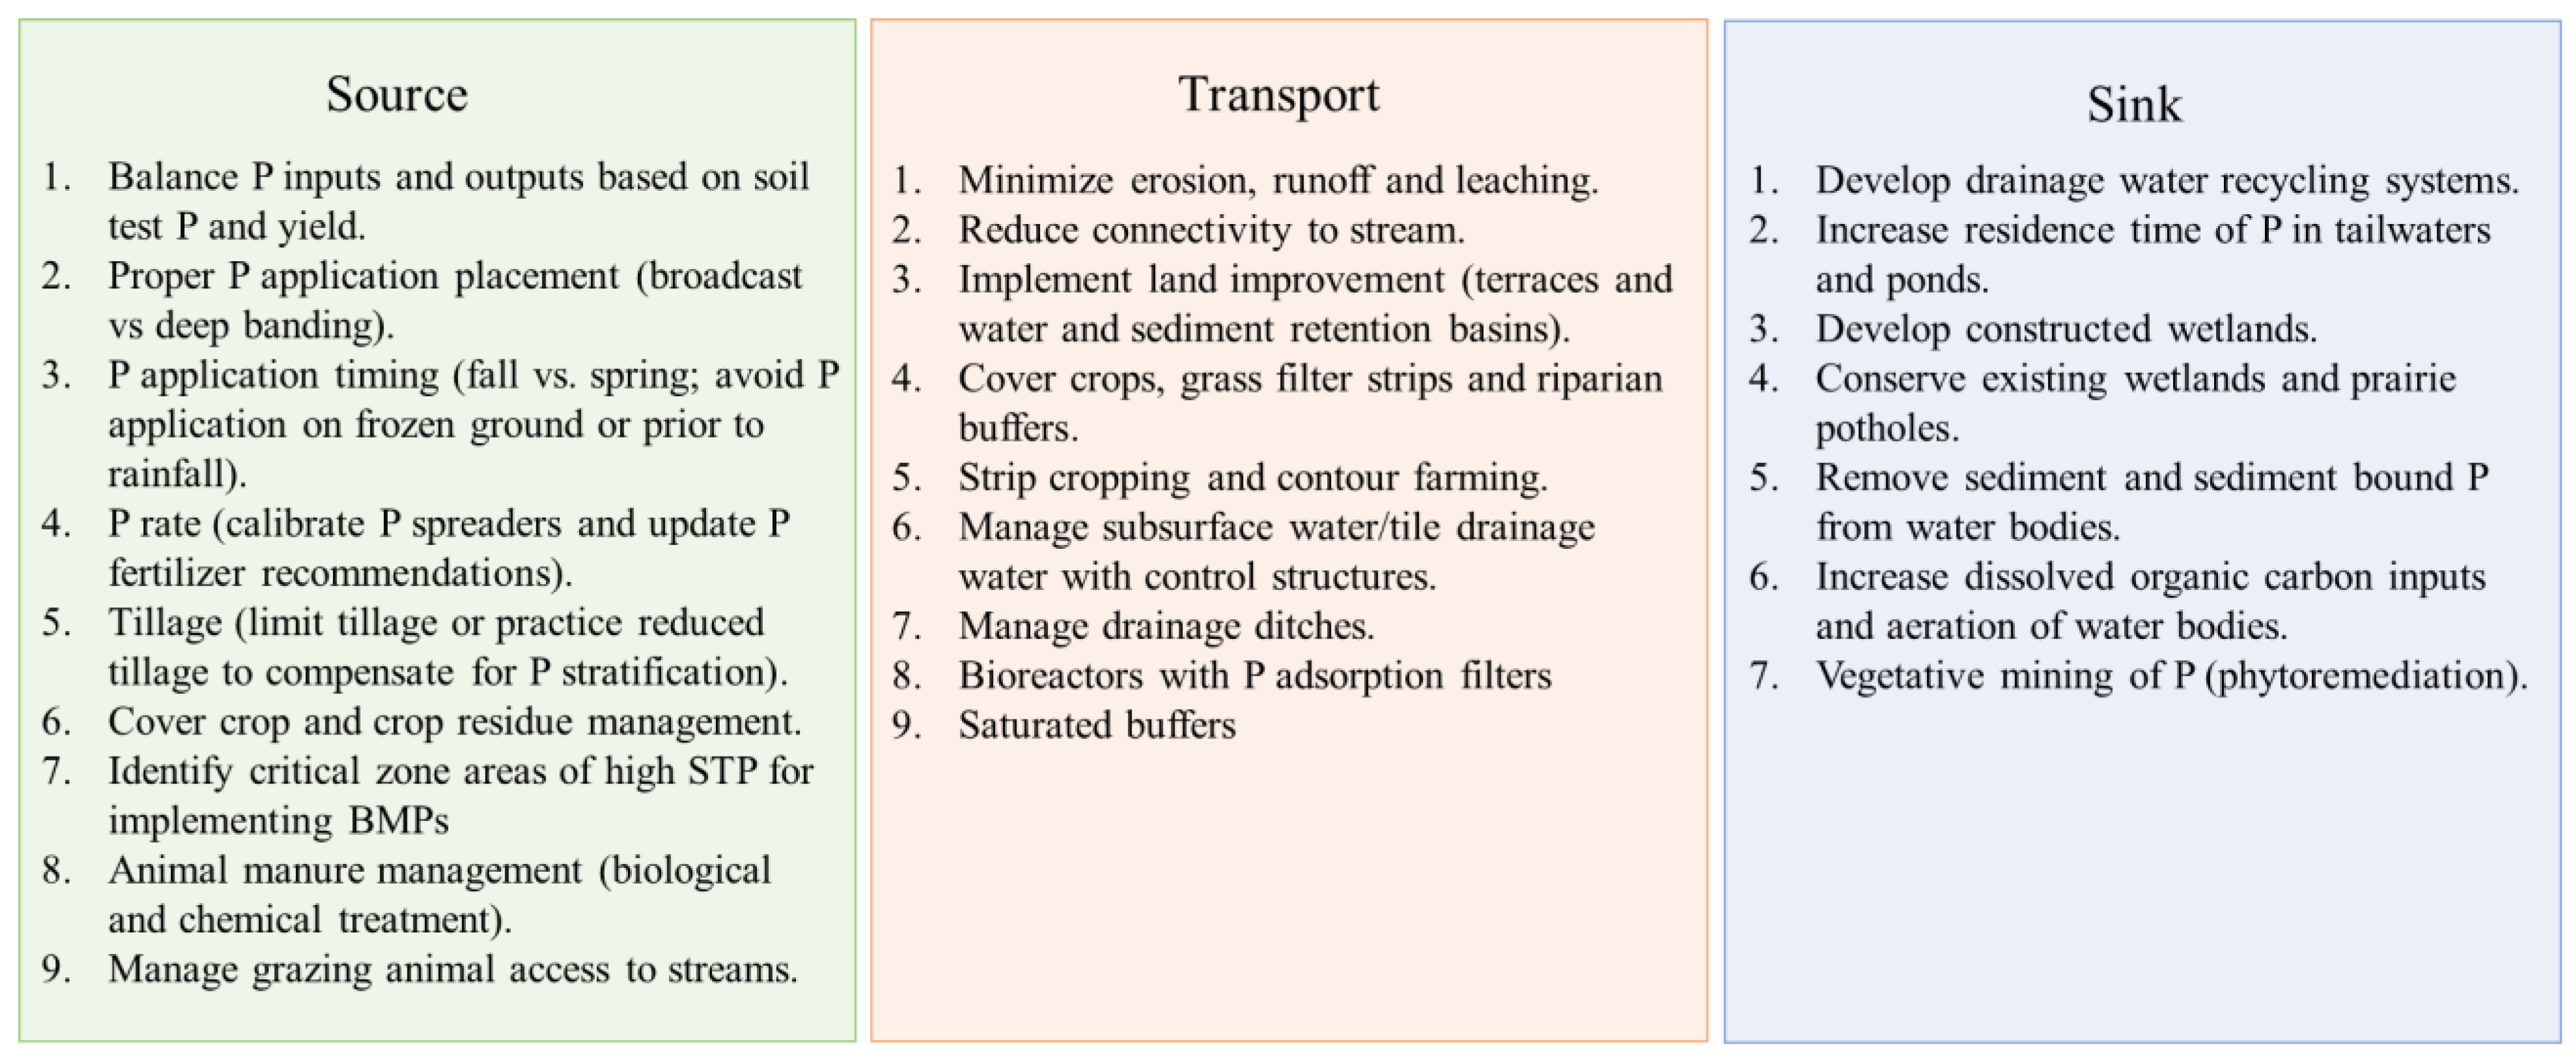
3. Managing P Loss from the Surface and Sub-Surface Water Flow
3.1. Surface Water Management
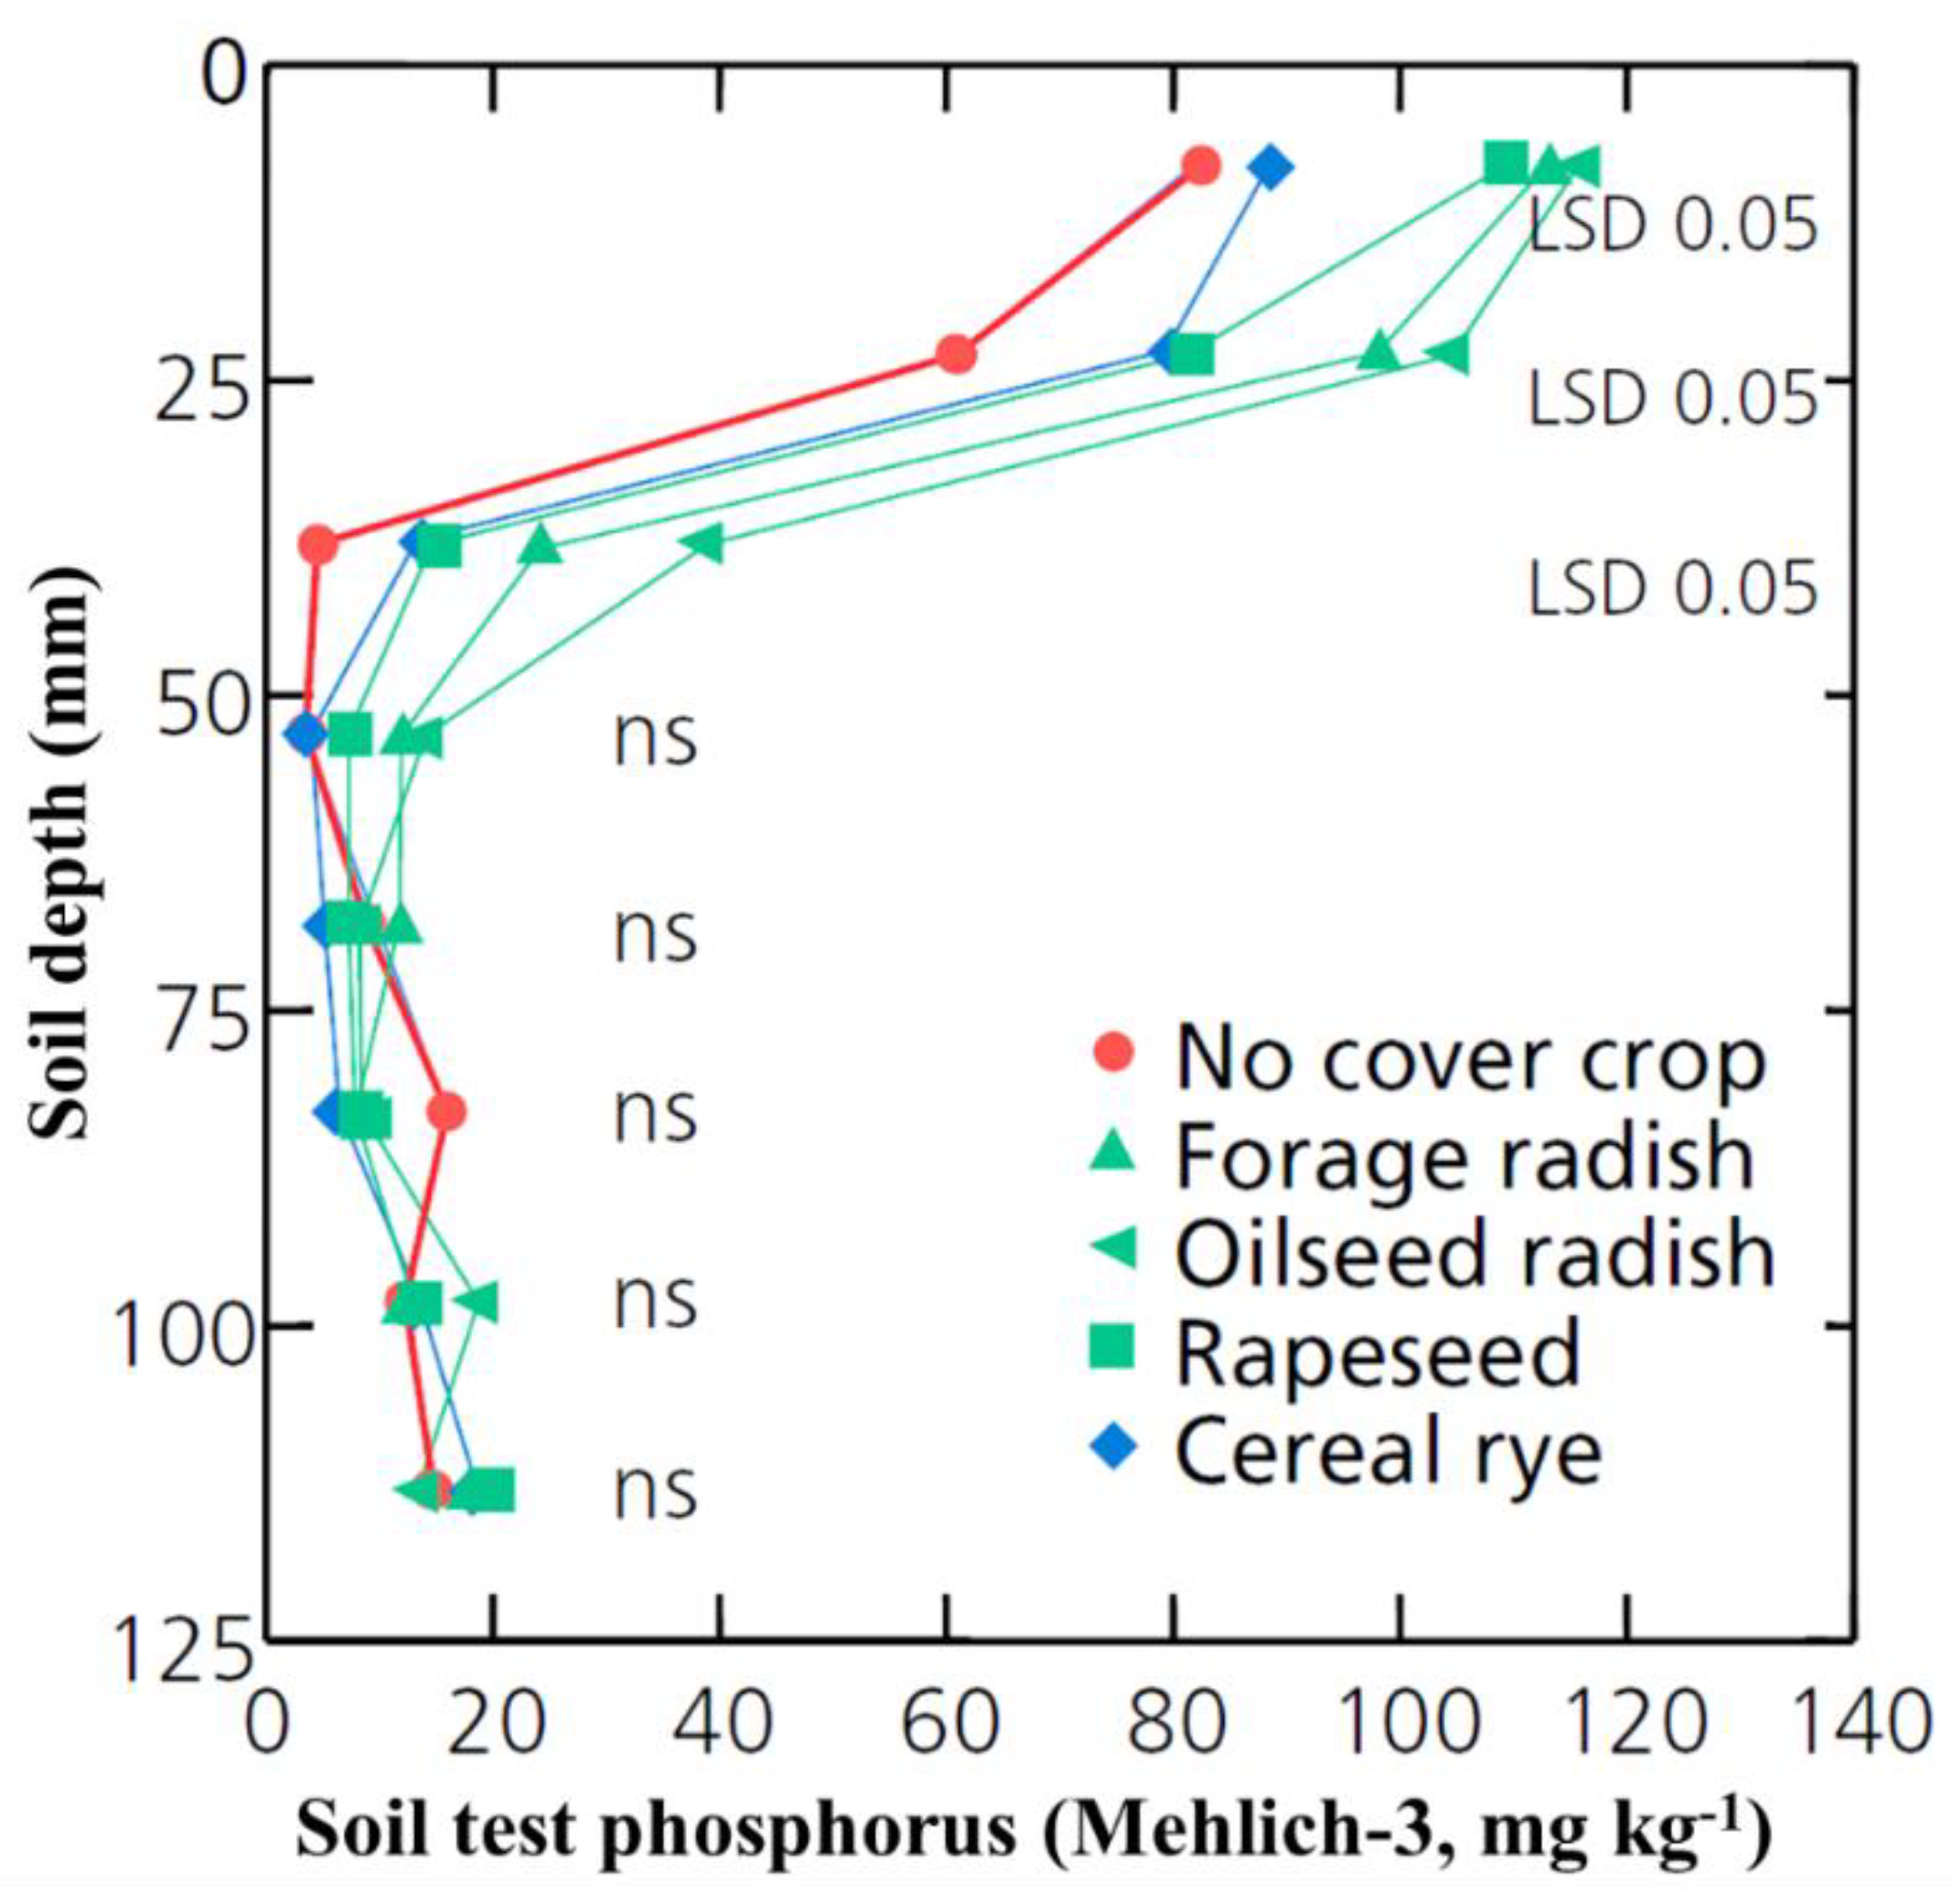
3.1.1. Cover Crops and Tillage
3.1.2. Water and Sediment Control Basins (WASCoBs) and Terraces
3.1.3. Vegetative Buffers
3.2. Subsurface Water Management
3.2.1. Controlled Drainage
3.2.2. Bioreactors
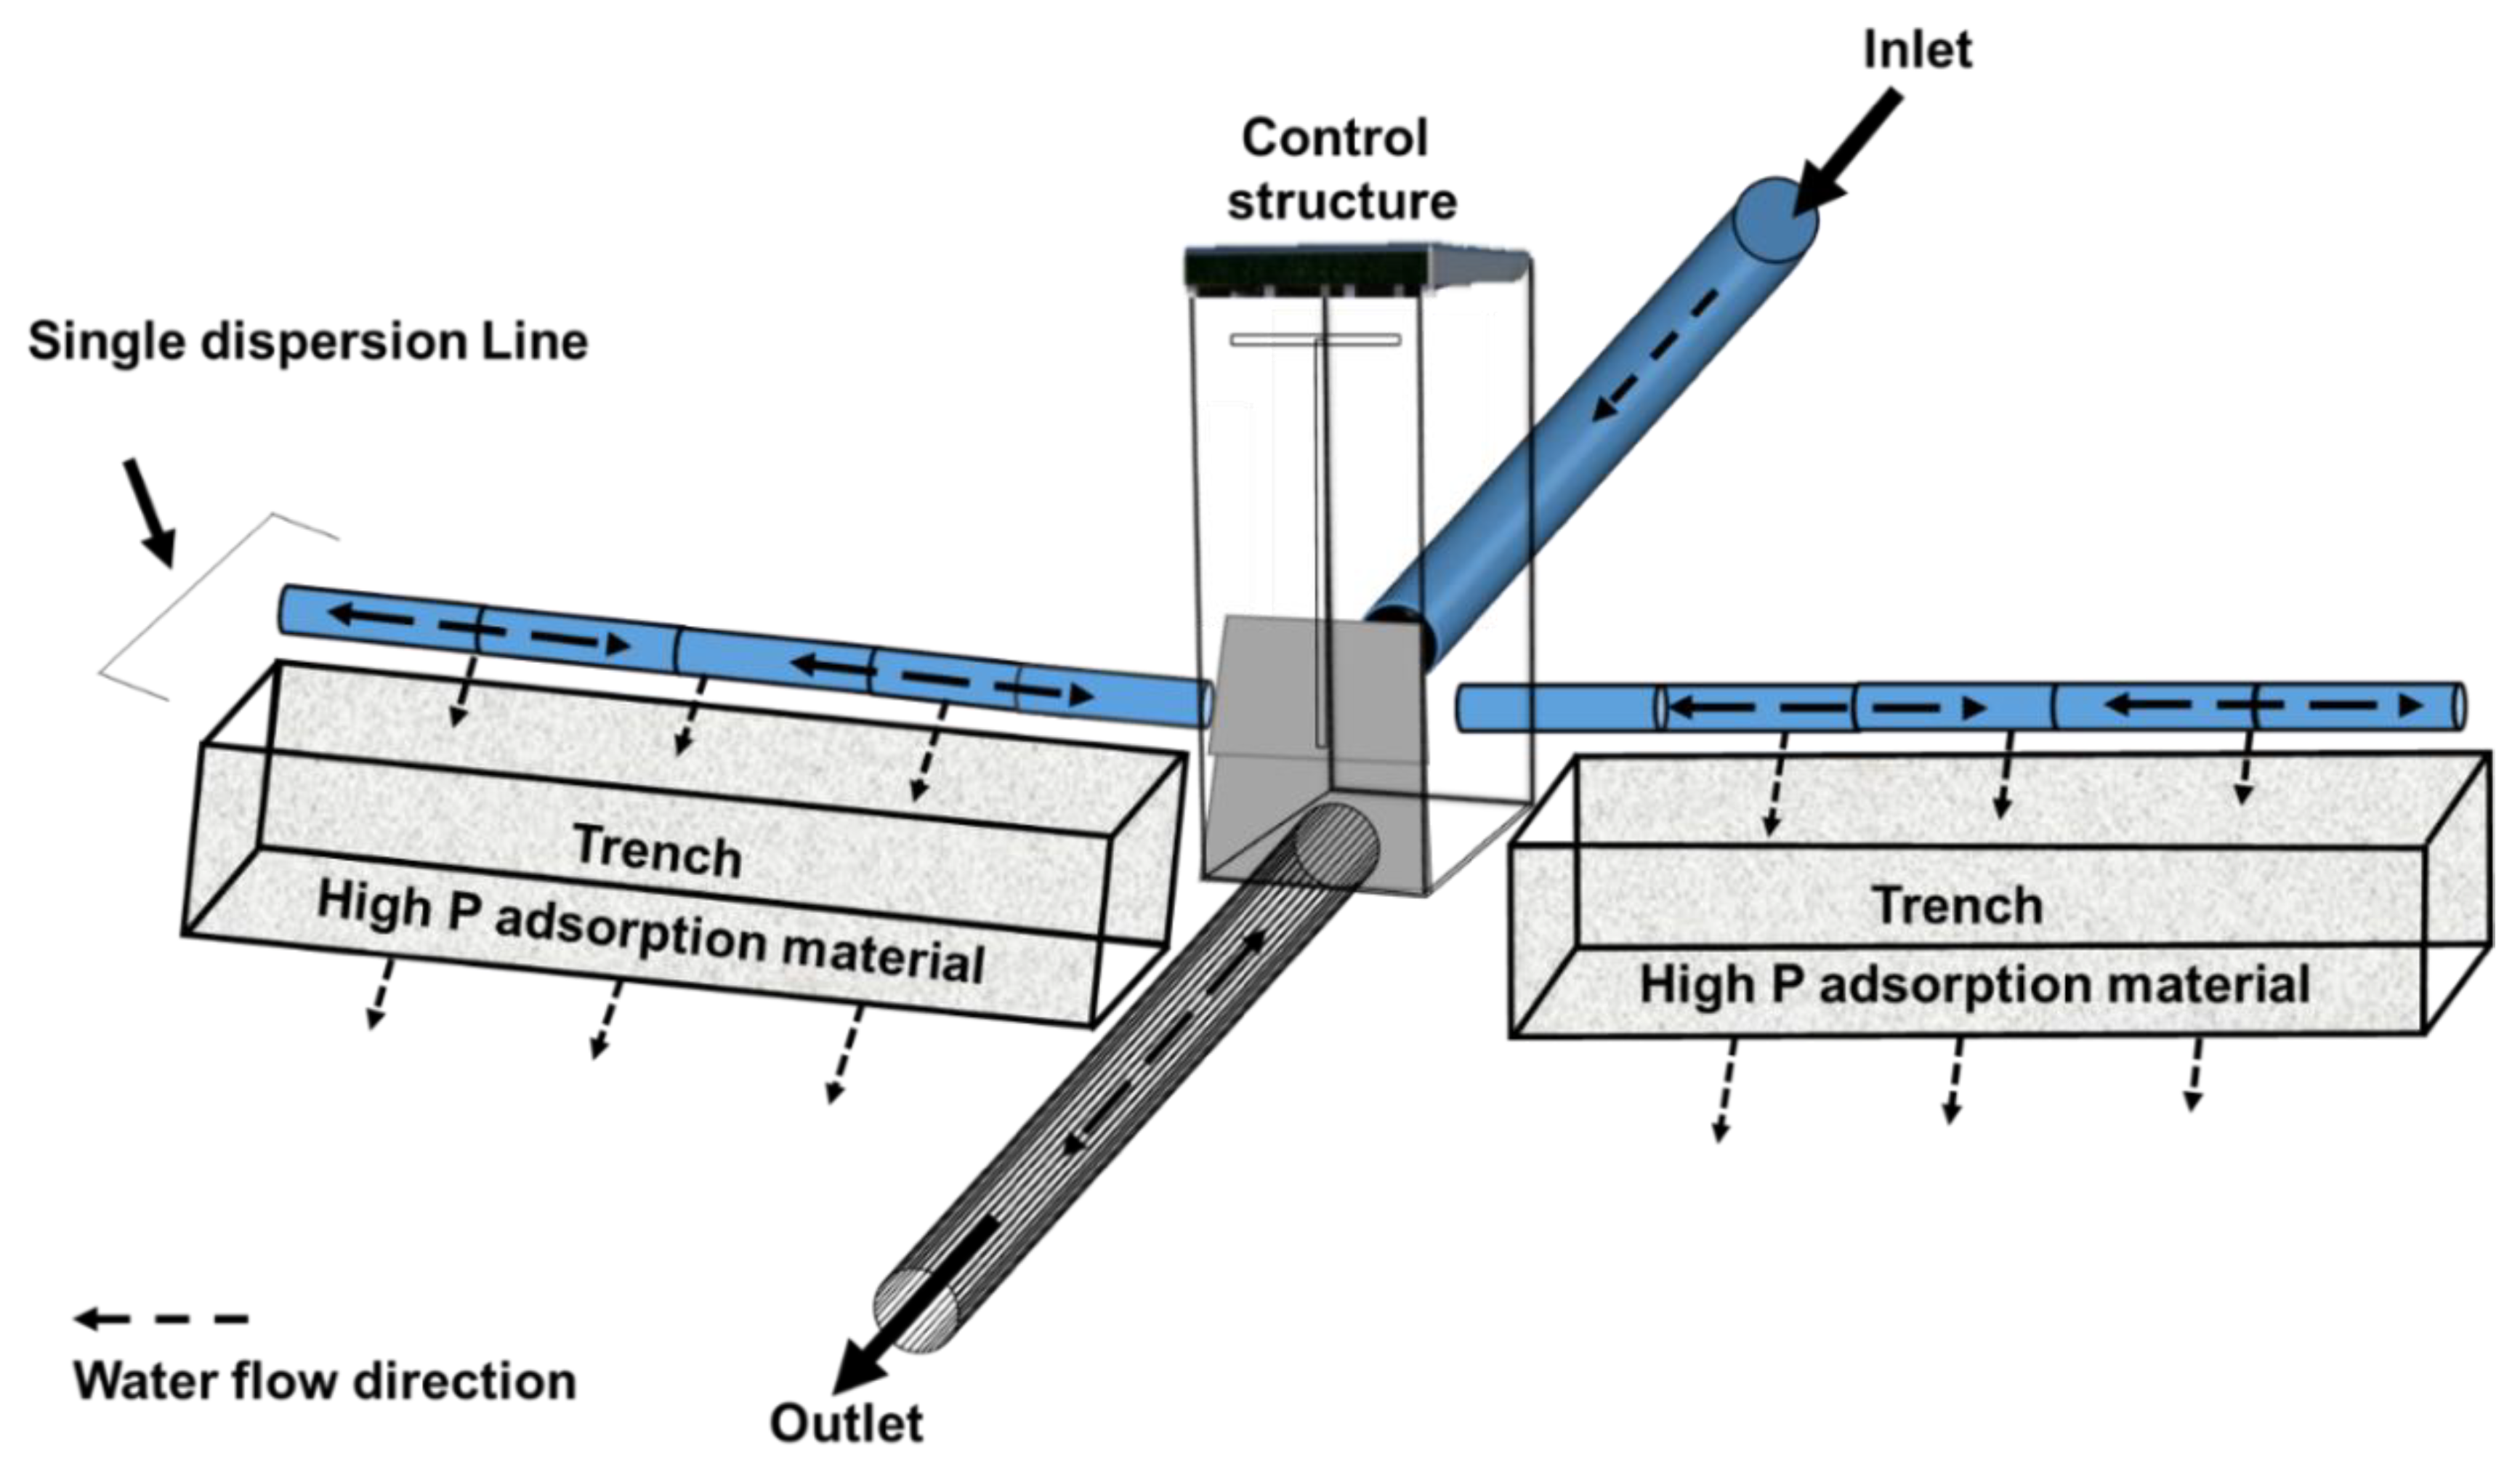
3.2.3. Saturated Buffers
3.2.4. Constructed Wetlands, Reservoirs, and Drainage Water Recycling
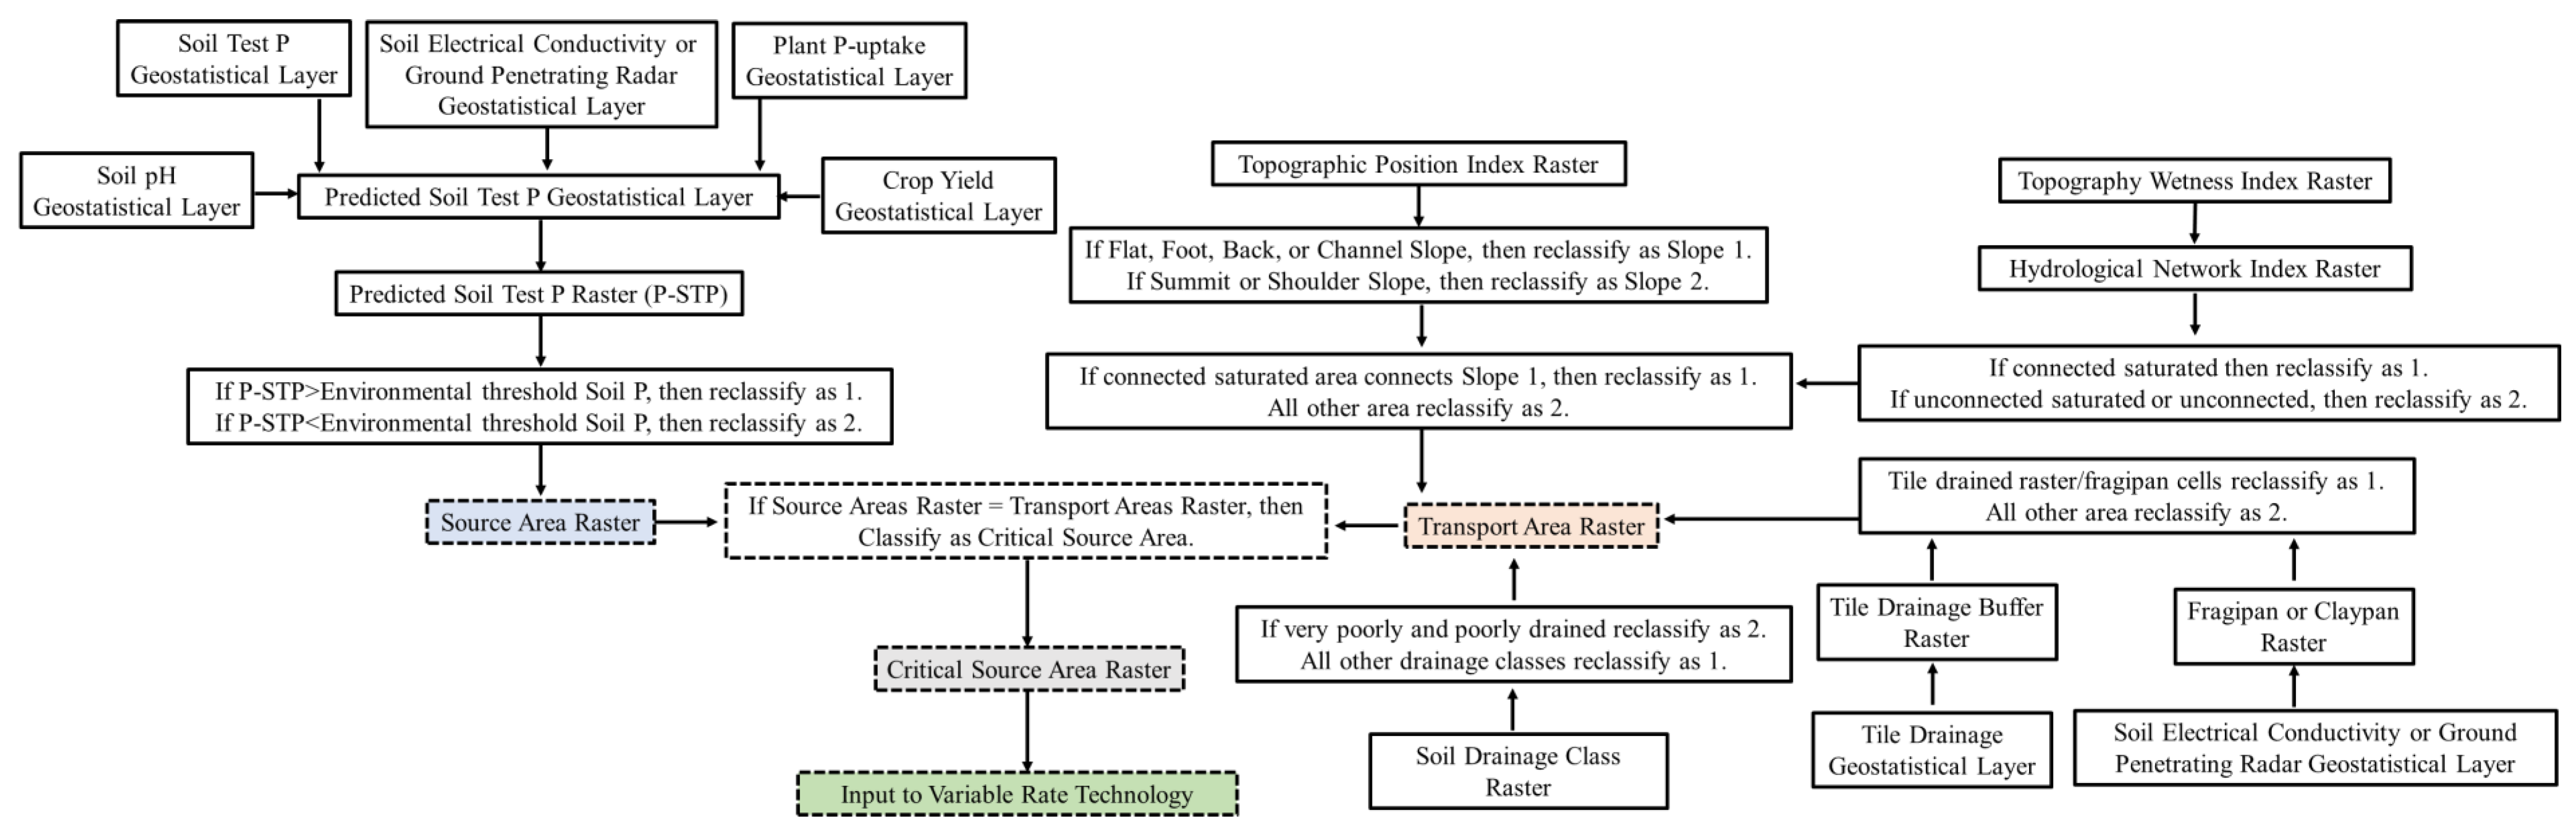
4. Watershed Scale Studies and Critical Source Area Concept
5. Phosphorus Index
6. Gap Analysis and Conclusion
Author Contributions
Funding
Conflicts of Interest
References
- Dhillon, J.S.; Torres, G.; Driver, E.; Figueiredo, B.; Raun, W.R. World Phosphorus Use Efficiency in Cereal Crops. Agron. J. 2017, 109, 1670–1677. [Google Scholar] [CrossRef]
- Liu, R.; Chi, L.; Wang, X.; Sui, Y.; Wang, Y.; Arandiyan, H. Review of metal (hydr)oxide and other adsorptive materials for phosphate removal from water. J. Environ. Chem. Eng. 2018, 6, 5269–5286. [Google Scholar] [CrossRef]
- Sharpley, A.N.; Chapra, S.C.; Wedepohl, R.; Sims, J.T.; Daniel, T.C.; Reddy, K.R. Managing Agricultural Phosphorus for Protection of Surface Waters: Issues and Options. J. Environ. Qual. 1994, 23, 437–451. [Google Scholar] [CrossRef]
- Carpenter, S.R.; Caraco, N.F.; Correll, D.L.; Howarth, R.W.; Sharpley, A.N.; Smith, V.H. Nonpoint pollution of surface waters with phosphorus and nitrogen. Ecol. Appl. 1998, 8, 559–568. [Google Scholar] [CrossRef]
- Sharpley, A.; Beegle, D.; Bolster, C.; Good, L.; Joern, B.; Ketterings, Q.; Lory, J.; Mikkelsen, R.; Osmond, D.; Vadas, P. Revision of the 590 nutrient management standard: SERA—17 recommendations. South Cooperative Ser. Bull. 2011, 412. Available online: https://sera17dotorg.files.wordpress.com/2015/02/590-sera-17-recommendations.pdf (accessed on 12 December 2019).
- Sharpley, A.N.; Jarvie, H.P.; Buda, A.; May, L.; Spears, B.; Kleinman, P. Phosphorus Legacy: Overcoming the Effects of Past Management Practices to Mitigate Future Water Quality Impairment. J. Environ. Qual. 2013, 42, 1308–1326. [Google Scholar] [CrossRef]
- Sharpley, A.; Tunney, H. Phosphorus Research Strategies to Meet Agricultural and Environmental Challenges of the 21st Century. J. Environ. Qual. 2000, 29, 176–181. [Google Scholar] [CrossRef]
- Sharpley, A.N.; Wang, X. Managing agricultural phosphorus for water quality: Lessons from the USA and China. J. Environ. Sci. 2014, 26, 1770–1782. [Google Scholar] [CrossRef]
- Sharpley, A.N.; Bergström, L.; Aronsson, H.; Bechmann, M.; Bolster, C.H.; Börling, K.; Djodjic, F.; Jarvie, H.P.; Schoumans, O.; Stamm, C.; et al. Future agriculture with minimized phosphorus losses to waters: Research needs and direction. Ambio 2015, 44, S163–S179. [Google Scholar] [CrossRef]
- Sharpley, A.N.; Daniel, T.; Gibson, G.; Bundy, L.; Cabrera, M.; Sims, T.; Stevens, R.; Lemunyon, J.; Kleinman, P.; Parry, R. Best Management Practices to Minimize Agricultural Phosphorus Impacts on Water Quality; USDA-ARS Washington: Washington, DC, USA, 2006. [Google Scholar]
- Kleinman, P.J.A.; Sharpley, A.N.; McDowell, R.W.; Flaten, D.N.; Buda, A.R.; Tao, L.; Bergström, L.; Zhu, Q. Managing agricultural phosphorus for water quality protection: Principles for progress. Plant Soil 2011, 349, 169–182. [Google Scholar] [CrossRef]
- Dungait, J.; Cardenas, L.M.; Blackwell, M.; Wu, L.; Withers, P.J.; Chadwick, D.R.; Bol, R.; Murray, P.; Macdonald, A.; Whitmore, A.P.; et al. Advances in the understanding of nutrient dynamics and management in UK agriculture. Sci. Total. Environ. 2012, 434, 39–50. [Google Scholar] [CrossRef] [PubMed]
- Kröger, R.; Dunne, E.; Novak, J.M.; King, K.; McLellan, E.; Smith, D.; Strock, J.; Boomer, K.; Tomer, M.; Noe, G.B. Downstream approaches to phosphorus management in agricultural landscapes: Regional applicability and use. Sci. Total. Environ. 2013, 442, 263–274. [Google Scholar] [CrossRef] [PubMed]
- McDowell, R. Challenges and opportunities to decrease phosphorus losses from land to water. In Advanced Nutrient Management: Gains from the Past-Goals for the Future; Occasional Report No. 25; Currie, L.D., Christensen, C.L., Eds.; Fertilizer and Lime Research Centre, Massey University: Palmerston North, New Zealand, 2012; Available online: http://flrc.massey.ac.nz/publications.html (accessed on 13 April 2020).
- McDowell, R.W.; Dils, R.M.; Collins, A.L.; Flahive, K.A.; Sharpley, A.N.; Quinn, J. A review of the policies and implementation of practices to decrease water quality impairment by phosphorus in New Zealand, the UK, and the US. Nutr. Cycl. Agroecosyst. 2015, 104, 289–305. [Google Scholar] [CrossRef]
- Liu, Y.; Engel, B.A.; Flanagan, D.C.; Gitau, M.W.; McMillan, S.K.; Chaubey, I. A review on effectiveness of best management practices in improving hydrology and water quality: Needs and opportunities. Sci. Total. Environ. 2017, 601, 580–593. [Google Scholar] [CrossRef] [PubMed]
- Aref, S.; Wander, M.M. Long-Term Trends of Corn Yield and Soil Organic Matter in Different Crop Sequences and Soil Fertility Treatments on the Morrow Plots. Adv. Agron. 1997, 62, 153–197. [Google Scholar]
- Cook, R.L.; Trlica, A. Tillage and Fertilizer Effects on Crop Yield and Soil Properties over 45 Years in Southern Illinois. Agron. J. 2016, 108, 415–426. [Google Scholar] [CrossRef]
- Motavalli, P.; Miles, R. Soil phosphorus fractions after 111 years of animal manure and fertilizer applications. Boil. Fertil. Soils 2002, 36, 35–42. [Google Scholar]
- Smith, D.; Wilson, R.; King, K.W.; Zwonitzer, M.; McGrath, J.; Harmel, R.D.; Haney, R.; Johnson, L. Lake Erie, phosphorus, and microcystin: Is it really the farmer’s fault? J. Soil Water Conserv. 2018, 73, 48–57. [Google Scholar] [CrossRef]
- Farber, B.G.; Fixen, P.E. Phosphorus response of late planted corn in three tillage systems. J. Fertil. 1986, 3, 46–51. [Google Scholar]
- Randall, G.W.; Hoeft, R.G. Placement Methods for Improved Efficiency of P and K Fertilizers: A Review. JPA 1988, 1, 70. [Google Scholar] [CrossRef]
- Bordoli, J.M.; Mallarino, A.P. Deep and Shallow Banding of Phosphorus and Potassium as Alternatives to Broadcast Fertilization for No-Till Corn. Agron. J. 1907, 90, 27–33. [Google Scholar] [CrossRef]
- Borges, R.; Mallarino, A.P. Grain Yield, Early Growth, and Nutrient Uptake of No-Till Soybean as Affected by Phosphorus and Potassium Placement. Semigroup Forum 2000, 92, 380. [Google Scholar]
- Buah, S.; Polito, T.A.; Killorn, R. No-tillage corn response to placement of fertilizer nitrogen, phosphorus, and potassium. Commun. Soil Sci. Plant Anal. 2000, 31, 3121–3133. [Google Scholar] [CrossRef]
- Schwab, G.J.; Whitney, D.A.; Kilgore, G.L.; Sweeney, D.W. Tillage and Phosphorus Management Effects on Crop Production in Soils with Phosphorus Stratification. Agron. J. 2006, 98, 430–435. [Google Scholar] [CrossRef]
- Boomsma, C.R.; Cánepa, M.; Vyn, T.J. Factors affecting the relative benefit of deep-banding versus broadcast application of phosphorus and potassium for corn and soybean. In Proceedings of the North Central Extension-Industry Soil Fertility Conference, Des Moines, IA, USA, 14–15 November 2007; pp. 55–63. [Google Scholar]
- Fernández, F.G.; Schaefer, D. Assessment of Soil Phosphorus and Potassium following Real Time Kinematic-Guided Broadcast and Deep-Band Placement in Strip-Till and No-Till. Soil Sci. Soc. Am. J. 2012, 76, 1090–1099. [Google Scholar] [CrossRef]
- Fernández, F.G.; White, C. No-Till and Strip-Till Corn Production with Broadcast and Subsurface-Band Phosphorus and Potassium. Agron. J. 2012, 104, 996–1005. [Google Scholar] [CrossRef]
- Kline, A.M. Corn Responses to Deep Placement of Phosphorus and Potassium in High Yield Production Systems. Ph.D. Dissertation, Purdue University, West Lafayette, IN, USA, 2005. [Google Scholar]
- Farmaha, B.; Fernández, F.G.; Nafziger, E.D. Soybean Seed Composition, Aboveground Growth, and Nutrient Accumulation with Phosphorus and Potassium Fertilization in No-Till and Strip-Till. Agron. J. 2012, 104, 1006–1015. [Google Scholar] [CrossRef]
- Farmaha, B.; Fernández, F.G.; Nafziger, E.D. Distribution of Soybean Roots, Soil Water, Phosphorus and Potassium Concentrations with Broadcast and Subsurface-Band Fertilization. Soil Sci. Soc. Am. J. 2012, 76, 1079–1089. [Google Scholar] [CrossRef]
- Buah, S.S.; Polito, T.A.; Killorn, R. No-Tillage Soybean Response to Banded and Broadcast and Direct and Residual Fertilizer Phosphorus and Potassium Applications. Agron. J. 2000, 92, 657–662. [Google Scholar] [CrossRef]
- Fernández, F.G.; Hoeft, R.G.; Randall, G.W.; Vetsch, J.; Greer, K.; Nafziger, E.D.; Villamil, M. Apparent Nitrogen Recovery from Fall-Applied Ammoniated Phosphates and Ammonium Sulfate Fertilizers. Agron. J. 2010, 102, 1674–1681. [Google Scholar] [CrossRef]
- Mallarino, A.P.; Barcos, S.R.; Prater, J.R.; Wittry, D.J. Timing of Broadcast Phosphorus Fertilization for No-Till Corn and Soybean. Soil Sci. Soc. Am. J. 2009, 73, 2143–2150. [Google Scholar] [CrossRef]
- McCollum, R. Buildup and decline in soil phosphorus: 30-year trends on a Typic Umprabuult. Agron. J. 1991, 83, 77–85. [Google Scholar] [CrossRef]
- Randall, G.W.; Iragavarapu, T.K.; Evans, S.D. Long-Term P and K Applications: I. Effect on Soil Test Incline and Decline Rates and Critical Soil Test Levels. JPA 1997, 10, 565. [Google Scholar] [CrossRef]
- Robbins, S.G.; Voss, R.D. Phosphorus and potassium stratification in conservation tillage systems. J. Soil Water Conserv. 1991, 46, 298–300. [Google Scholar]
- Mallarino, A.P.; Borges, R. Phosphorus and Potassium Distribution in Soil Following Long-Term Deep-Band Fertilization in Different Tillage Systems. Soil Sci. Soc. Am. J. 2006, 70, 702–707. [Google Scholar] [CrossRef]
- Grove, J.H.; Ward, R.C.; Weil, R.R. Nutrient stratification in no-till soils. Agron. J. 2007, 65, 781–783. [Google Scholar]
- McIsaac, G.; Mitchell, J.; Hirschi, M. Dissolved phosphorus concentrations in runoff from simulated rainfall on corn and soybean tillage systems. J. Soil Water Conserv. 1995, 50, 383–388. [Google Scholar]
- Randall, G.; Vetsch, J. Optimum placement of phosphorus for corn/soybean rotations in a strip-tillage system. J. Soil Water Conserv. 2008, 63, 152–153. [Google Scholar] [CrossRef]
- Baker, D.B.; Johnson, L.; Confesor, R.B.; Crumrine, J.P. Vertical Stratification of Soil Phosphorus as a Concern for Dissolved Phosphorus Runoff in the Lake Erie Basin. J. Environ. Qual. 2017, 46, 1287–1295. [Google Scholar] [CrossRef]
- Coale, F.J.; Porter, P.S.; Davis, W. Soil Amendments for Reducing Phosphorus Concentration of Drainage Water from Histosols. Soil Sci. Soc. Am. J. 1994, 58, 1470–1475. [Google Scholar] [CrossRef]
- Staats, K.E.; Arai, Y.; Sparks, D.L. Alum Amendment Effects on Phosphorus Release and Distribution in Poultry Litter-Amended Sandy Soils. J. Environ. Qual. 2004, 33, 1904–1911. [Google Scholar] [CrossRef] [PubMed]
- Torbert, H.; King, K.W.; Harmel, R.D. Impact of Soil Amendments on Reducing Phosphorus Losses from Runoff in Sod. J. Environ. Qual. 2005, 34, 1415–1421. [Google Scholar] [CrossRef] [PubMed]
- Dudenhoeffer, C.J.; Nelson, K.A.; Motavalli, P.; Burdick, B.; Dunn, D.; Goyne, K.W. Utility of Phosphorus Enhancers and Strip-Tillage for Corn Production. J. Agric. Sci. 2013, 5, 37. [Google Scholar] [CrossRef]
- Hopkins, B.G.; Fernelius, K.J.; Hansen, N.C.; Eggett, D.L. AVAIL Phosphorus Fertilizer Enhancer: Meta-Analysis of 503 Field Evaluations. Agron. J. 2018, 110, 389–398. [Google Scholar] [CrossRef]
- Kost, D.; Ladwig, K.J.; Chen, L.; DeSutter, T.M.; Espinoza, L.; Norton, L.D.; Smeal, D.; Torbert, H.A.; Watts, D.B.; Wolkowski, R.P.; et al. Meta-Analysis of Gypsum Effects on Crop Yields and Chemistry of Soils, Plant Tissues, and Vadose Water at Various Research Sites in the USA. J. Environ. Qual. 2018, 47, 1284–1292. [Google Scholar] [CrossRef] [PubMed]
- Pagliari, P.H.; Strock, J.; Johnson, J.M.F.; Waldrip, H.M. Phosphorus Distribution in Soils Treated with Bioenergy Co-product Materials following Corn Growth. Agron. J. 2018, 110, 850–858. [Google Scholar] [CrossRef]
- Watts, D.B.; Torbert, H.A. Impact of Gypsum Applied to Grass Buffer Strips on Reducing Soluble P in Surface Water Runoff. J. Environ. Qual. 2009, 38, 1511–1517. [Google Scholar] [CrossRef]
- King, K.W.; Williams, M.R.; Dick, W.A.; LaBarge, G.A. Decreasing Phosphorus Loss in Tile-Drained Landscapes Using Flue Gas Desulfurization Gypsum. J. Environ. Qual. 2016, 45, 1722–1730. [Google Scholar] [CrossRef]
- Watts, D.B.; Torbert, H.A. Influence of Flue Gas Desulfurization Gypsum on Reducing Soluble Phosphorus in Successive Runoff Events from a Coastal Plain Bermudagrass Pasture. J. Environ. Qual. 2016, 45, 1071–1079. [Google Scholar] [CrossRef]
- Murphy, P.N.C.; Stevens, R.J. Lime and Gypsum as Source Measures to Decrease Phosphorus Loss from Soils to Water. Water Air Soil Pollut. 2010, 212, 101–111. [Google Scholar] [CrossRef]
- Dudenhoeffer, C.J.; Nelson, K.A.; Motavalli, P.; Dunn, D.; Stevens, W.E.; Goyne, K.W.; Nathan, M.; Scharf, P. Corn Production as Affected by Phosphorus Enhancers, Phosphorus Source and Lime. J. Agric. Sci. 2012, 4, 137. [Google Scholar] [CrossRef]
- Rahman, M.; Salleh, M.M.; Rashid, U.; Ahsan, A.; Hossain, M.M.; Ra, C.S. Production of slow release crystal fertilizer from wastewaters through struvite crystallization–A review. Arab. J. Chem. 2014, 7, 139–155. [Google Scholar] [CrossRef]
- Everaert, M.; Da Silva, R.C.; Degryse, F.; McLaughlin, M.J.; Smolders, E. Limited Dissolved Phosphorus Runoff Losses from Layered Double Hydroxide and Struvite Fertilizers in a Rainfall Simulation Study. J. Environ. Qual. 2018, 47, 371–377. [Google Scholar] [CrossRef] [PubMed]
- Haggard, B.; Sharpley, A.; Massey, L. Handbook of Best Management Practices for the Upper Illinois River Watershed and Other Regional Watersheds; University of Arkansas: Fayetteville, AR, USA, 2010. [Google Scholar]
- McIsaac, G.F.; Hirschi, M.C.; Mitchell, J.K. Nitrogen and Phosphorus in Eroded Sediment from Corn and Soybean Tillage Systems. J. Environ. Qual. 1991, 20, 663–670. [Google Scholar] [CrossRef]
- Algoazany, A.S.; Kalita, P.K.; Czapar, G.F.; Mitchell, J.K. Phosphorus Transport through Subsurface Drainage and Surface Runoff from a Flat Watershed in East Central Illinois, USA. J. Environ. Qual. 2007, 36, 681–693. [Google Scholar] [CrossRef]
- Yuan, M.; Fernández, F.G.; Pittelkow, C.M.; Greer, K.; Schaefer, D. Tillage and Fertilizer Management Effects on Phosphorus Runoff from Minimal Slope Fields. J. Environ. Qual. 2018, 47, 462–470. [Google Scholar] [CrossRef]
- Römkens, M.J.M.; Nelson, D.W. Phosphorus Relationships in Runoff from Fertilized Soils. J. Environ. Qual. 1974, 3, 10–13. [Google Scholar] [CrossRef]
- Harmel, D.; Potter, S.; Casebolt, P.; Reckhow, K.; Green, C.; Haney, R. Compilation of the Measured Nutrient Load Data for Agricultural Land Uses in the United States. JAWRA J. Am. Water Resour. Assoc. 2006, 42, 1163–1178. [Google Scholar] [CrossRef]
- Harmel, D.; Qian, S.; Reckhow, K.; Casebolt, P. The MANAGE Database: Nutrient Load and Site Characteristic Updates and Runoff Concentration Data. J. Environ. Qual. 2008, 37, 2403–2406. [Google Scholar] [CrossRef]
- Blanco-Canqui, H.; Mikha, M.M.; Presley, D.; Claassen, M.M. Addition of Cover Crops Enhances No-Till Potential for Improving Soil Physical Properties. Soil Sci. Soc. Am. J. 2011, 75, 1471–1482. [Google Scholar] [CrossRef]
- Blanco-Canqui, H.; Shaver, T.M.; Lindquist, J.; Shapiro, C.A.; Elmore, R.W.; Francis, C.; Hergert, G.W. Cover Crops and Ecosystem Services: Insights from Studies in Temperate Soils. Agron. J. 2015, 107, 2449–2474. [Google Scholar] [CrossRef]
- Singh, G.; Schoonover, J.E.; Williard, K.W.J. Cover Crops for Managing Stream Water Quantity and Improving Stream Water Quality of Non-Tile Drained Paired Watersheds. Water 2018, 10, 521. [Google Scholar] [CrossRef]
- Singh, G.; Williard, K.W.J.; Schoonover, J.E. Cover Crops and Tillage Influence on Nitrogen Dynamics in Plant-Soil-Water Pools. Soil Sci. Soc. Am. J. 2018, 82, 1572–1582. [Google Scholar] [CrossRef]
- Hargrove, W.L. Winter Legumes as a Nitrogen Source for No-Till Grain Sorghum. Agron. J. 1907, 78, 70–74. [Google Scholar] [CrossRef]
- Groffman, P.M.; Hendrix, P.F.; Crossley, D.A., Jr. Nitrogen dynamics in conventional and no-tillage agroecosystems with inorganic fertilizer or legume nitrogen inputs. Plant Soil 1987, 97, 315–332. [Google Scholar] [CrossRef]
- Eckert, D.J. Chemical Attributes of Soils Subjected to No-Till Cropping with Rye Cover Crops. Soil Sci. Soc. Am. J. 1991, 55, 405. [Google Scholar] [CrossRef]
- Kabir, Z.; Koide, R.T. Effect of autumn and winter mycorrhizal cover crops on soil properties, nutrient uptake and yield of sweet corn in Pennsylvania, USA. Plant Soil 2002, 238, 205–215. [Google Scholar] [CrossRef]
- Villamil, M.; Bollero, G.A.; Darmody, R.G.; Simmons, F.W.; Bullock, D.G. No-Till Corn/Soybean Systems Including Winter Cover Crops. Soil Sci. Soc. Am. J. 2006, 70, 1936–1944. [Google Scholar] [CrossRef]
- Sharpley, A.N.; Smith, S.J.; Williams, J.R.; Jones, O.R.; Coleman, G.A. Water Quality Impacts Associated with Sorghum Culture in the Southern Plains. J. Environ. Qual. 1991, 20, 239–244. [Google Scholar] [CrossRef]
- Dabney, S.M.; Delgado, J.A.; Reeves, D.W. Using Winter Cover Crops to Improve Soli and Water Quality. Commun. Soil Sci. Plant Anal. 2001, 32, 1221–1250. [Google Scholar] [CrossRef]
- Abel, D.S. Cover Crop Effects on Soil Moisture and Water Quality. Ph.D. Thesis, Kansas State University, Manhattan, KS, USA, 2017. [Google Scholar]
- Bruening, B.G. Nutrient Loading Reduction. In a Tile Drained Agricultural Watershed Through Watershed-Scale Cover Cropping: A High Resolution Analysis. Ph.D. Thesis, Illinois State University, Normal, IL, USA, 2017. [Google Scholar]
- Zhu, J.C.; Gantzer, C.J.; Anderson, S.H.; Alberts, E.E.; Beuselinck, P.R. Runoff, Soil, and Dissolved Nutrient Losses from No-Till Soybean with Winter Cover Crops. Soil Sci. Soc. Am. J. 1989, 53, 1210–1214. [Google Scholar] [CrossRef]
- Johnson, H.P.; Baker, J.L.; Shrader, W.D.; Laflen, J.M. Tillage System Effects on Sediment and Nutrients in Runoff from Small Watersheds. Trans. ASAE 1979, 22, 1110–1114. [Google Scholar] [CrossRef]
- Kovar, J.L.; Moorman, T.; Singer, J.; Cambardella, C.; Tomer, M. Swine Manure Injection with Low-Disturbance Applicator and Cover Crops Reduce Phosphorus Losses. J. Environ. Qual. 2011, 40, 329–336. [Google Scholar] [CrossRef] [PubMed]
- Siller, A.R.S.; Albrecht, K.A.; Jokela, W.E. Soil Erosion and Nutrient Runoff in Corn Silage Production with Kura Clover Living Mulch and Winter Rye. Agron. J. 2016, 108, 989–999. [Google Scholar] [CrossRef]
- Timmons, D.R.; Burwell, R.E.; Holt, R.F. Nitrogen and phosphorus losses in surface runoff from agricultural land as influenced by placement of broadcast fertilizer. Water Resour. Res. 1973, 9, 658–667. [Google Scholar] [CrossRef]
- Muñoz, J.D.; Steibel, J.P.; Snapp, S.; Kravchenko, A.N. Cover crop effect on corn growth and yield as influenced by topography. Agric. Ecosyst. Environ. 2014, 189, 229–239. [Google Scholar] [CrossRef]
- Ladoni, M.; Kravchenko, A.N.; Robertson, G.P. Topography Mediates the Influence of Cover Crops on Soil Nitrate Levels in Row Crop Agricultural Systems. PLoS ONE 2015, 10, e0143358. [Google Scholar] [CrossRef]
- Sherrod, L.A.; Peterson, G.A.; Westfall, D.G.; Ahuja, L.R. Soil Organic Carbon Pools After 12 Years in No-Till Dryland Agroecosystems. Soil Sci. Soc. Am. J. 2005, 69, 1600–1608. [Google Scholar] [CrossRef]
- Von Wandruszka, R. Phosphorus retention in calcareous soils and the effect of organic matter on its mobility. Geochem. Trans. 2006, 7, 6. [Google Scholar] [CrossRef]
- Chan, K.Y.; Dorahy, C.G.; Tyler, S.; Wells, A.; Milham, P.P.; Barchia, I. Phosphorus accumulation and other changes in soil properties as a consequence of vegetable production, Sydney region, Australia. Soil Res. 2007, 45, 139. [Google Scholar] [CrossRef]
- Senthilkumar, S.; Kravchenko, A.N.; Robertson, G.P. Topography Influences Management System Effects on Total Soil Carbon and Nitrogen. Soil Sci. Soc. Am. J. 2009, 73, 2059–2067. [Google Scholar] [CrossRef]
- Benning, J.; Craft, K. The Iowa Watershed Approach—Water and Sediment Control Basins; Iowa State University: Ames, IA, USA, 2018. [Google Scholar]
- Edwards, C.L.; Shannon, R.D.; Jarrett, A.R. Sedimentation Basin Retention Efficiencise for Sediment, Nitrogen, and Phosphorus from Simulated Agricultural Runoff. Trans. ASAE 1999, 42, 403–409. [Google Scholar] [CrossRef]
- Fiener, P.; Auerswald, K.; Weigand, S. Managing erosion and water quality in agricultural watersheds by small detention ponds. Agric. Ecosyst. Environ. 2005, 110, 132–142. [Google Scholar] [CrossRef]
- Minks, K.R.; Lowery, B.; Madison, F.W.; Ruark, M.; Frame, D.; Stuntebeck, T.; Komiskey, M. An at-grade stabilization structure impact on runoff and suspended sediment. J. Soil Water Conserv. 2012, 67, 237–248. [Google Scholar] [CrossRef]
- Czapar, G.F. Effects of Erosion Control Practices on Nutrient Loss; American Society of Agricultural and Biological Engineers: St. Joseph, MI, USA, 2008. [Google Scholar]
- Yang, W.; Liu, Y.; Simmons, J.; Oginskyy, A.; McKague, K. SWAT Modelling of Agricultural BMPs and Analysis of BMP Cost Effectiveness in the Gully Creek Watershed; University of Guelph: Guelph, ON, USA, 2013. [Google Scholar]
- Herron, C.L.; Ruark, M.D.; Minks, K.R. Conservation Benefits of a Grade Stabilization Structure; University of Wisconsin: Madison, WI, USA, 2016. [Google Scholar]
- Gassman, P.W.; Osei, E.; Saleh, A.; Rodecap, J.; Norvell, S.; Williams, J. Alternative practices for sediment and nutrient loss control on livestock farms in northeast Iowa. Agric. Ecosyst. Environ. 2006, 117, 135–144. [Google Scholar] [CrossRef]
- Mielke, L. Performance of water and sediment control basins in northeastern Nebraska. J. Soil Water Conserv. 1985, 40, 524–528. [Google Scholar]
- Adler, R.L.; Singh, G.; Nelson, K.A.; Weirich, J.; Motavalli, P.P.; Miles, R.J. Cover crop impact on crop production and nutrient loss in a no-till terrace topography. J. Soil Water Conserv. 2020, 75, 153–165. [Google Scholar] [CrossRef]
- Feyereisen, G.W.; Francesconi, W.; Smith, D.R.; Papiernik, S.K.; Krueger, E.S.; Wente, C.D. Effect of replacing surface inlets with blind or gravel inlets on sediment and phosphorus subsurface drainage losses. J. Environ. Qual. 2015, 44, 594–604. [Google Scholar] [CrossRef]
- Epp, D.; Hamlett, J. Cost-effectiveness of conservation and nutrient management practices in Pennsylvania. J. Soil Water Conserv. 1996, 51, 486–494. [Google Scholar]
- Incorporated, D. An Evaluation of the Cost Effectiveness of Agricultural Best Management Practices and Publicly Owned Treatment Works in Controlling Phosphorus Pollution in the Great Lakes Basin; Report submitted to U.S.; Environmental Protection Agency: Washington, DC, USA, 1989. [Google Scholar]
- Roberts, W.M.; Stutter, M.; Haygarth, P.M. Phosphorus Retention and Remobilization in Vegetated Buffer Strips: A Review. J. Environ. Qual. 2012, 41, 389–399. [Google Scholar] [CrossRef]
- Abu-Zreig, M.; Rudra, R.P.; Whiteley, H.R.; Lalonde, M.N.; Kaushik, N.K. Phosphorus removal in vegetated filter strips. J. Environ. Qual. 2003, 32, 613–619. [Google Scholar] [CrossRef] [PubMed]
- Dillaha, T.; Inamdar, S. Buffer Zones as Sediment Traps or Sources. In Buffer Zones: THEIR PROCESSES AND POTENTIAL IN WATER PROTECTION; Haycock, N., Burt, T., Goulding, K., Pinay, G., Eds.; Haycock Associated Limited: St. Albans, UK, 1996; pp. 33–42. [Google Scholar]
- Uusi-Kämppä, J.; Turtola, E.; Hartikainen, H.; Yläranta, T. The interactions of buffer zones and phosphorus runoff. In Quest Environmental Buffer Zones: Their Processes and Potential in Water Protection; Haycock Associated Ltd.: St. Albans, UK, 1996; pp. 43–53. [Google Scholar]
- Cooper, A.; Smith, C.M.; Smith, M.J. Effects of riparian set-aside on soil characteristics in an agricultural landscape: Implications for nutrient transport and retention. Agric. Ecosyst. Environ. 1995, 55, 61–67. [Google Scholar] [CrossRef]
- Räty, M.; Horn, R.; Rasa, K. Compressive behaviour of the soil in buffer zones under different management practices in Finland. Agric. Food Sci. 2008, 19, 160–172. [Google Scholar] [CrossRef]
- Singh, G.; Schoonover, J.E.; Williard, K.W.J.; Sweet, A.L.; Stewart, J. Giant Cane Vegetative Buffer for Improving Soil and Surface Water Quality. J. Environ. Qual. 2019, 48, 330–339. [Google Scholar] [CrossRef] [PubMed]
- Karr, J.R.; Schlosser, I.J. Water Resources and the Land-Water Interface. Science 1978, 201, 229–234. [Google Scholar] [CrossRef] [PubMed]
- Lyons, J.; Thimble, S.W.; Paine, L.K. GRASS VERSUS TREES: MANAGING RIPARIAN AREAS TO BENEFIT STREAMS OF CENTRAL NORTH AMERICA. JAWRA J. Am. Water Resour. Assoc. 2000, 36, 919–930. [Google Scholar] [CrossRef]
- Hoffmann, C.C.; Kjaergaard, C.; Uusi-Kämppä, J.; Hansen, H.C.B.; Kronvang, B. Phosphorus Retention in Riparian Buffers: Review of Their Efficiency. J. Environ. Qual. 2009, 38, 1942–1955. [Google Scholar] [CrossRef]
- Stutter, M.; Langan, S.; Lumsdon, D.G. Vegetated Buffer Strips Can Lead to Increased Release of Phosphorus to Waters: A Biogeochemical Assessment of the Mechanisms. Environ. Sci. Technol. 2009, 43, 1858–1863. [Google Scholar] [CrossRef]
- Dodd, R.J.; Sharpley, A.N. Conservation practice effectiveness and adoption: Unintended consequences and implications for sustainable phosphorus management. Nutr. Cycl. Agroecosyst. 2015, 104, 373–392. [Google Scholar] [CrossRef]
- United States Department of Agriculture. Census of Agriculture; USDA: Washington, DC, USA, 2014. [Google Scholar]
- Nakagaki, N.; Wieczorek, M. Estimates of Subsurface Tile Drainage Extent for 12 Midwest States; U.S. Geological Survey: Reston, VA, USA, 2016. [Google Scholar] [CrossRef]
- Kalita, P.K.; Cooke, R.A.C.; Anderson, S.M.; Hirschi, M.C.; Mitchell, J.K. Subsurface Drainage and Water Quality: The Illinois Experience. Trans. ASABE 2007, 50, 1651–1656. [Google Scholar] [CrossRef]
- Gentry, L.E.; David, M.B.; Royer, T.V.; Mitchell, C.A.; Starks, K.M. Phosphorus Transport Pathways to Streams in Tile-Drained Agricultural Watersheds. J. Environ. Qual. 2007, 36, 408–415. [Google Scholar] [CrossRef] [PubMed]
- Christianson, L.E.; Harmel, R.D.; Smith, D.; Williams, M.R.; King, K. Assessment and Synthesis of 50 Years of Published Drainage Phosphorus Losses. J. Environ. Qual. 2016, 45, 1467–1477. [Google Scholar] [CrossRef] [PubMed]
- King, K.; Williams, M.R.; Macrae, M.L.; Fausey, N.R.; Frankenberger, J.; Smith, D.R.; Kleinman, P.J.A.; Brown, L.C. Phosphorus Transport in Agricultural Subsurface Drainage: A Review. J. Environ. Qual. 2015, 44, 467–485. [Google Scholar] [CrossRef] [PubMed]
- E Feset, S.; Strock, J.S.; Sands, G.R.; Birr, A.S. Controlled drainage to improve edge-of-field water quality in southwest Minnesota, USA. In Proceedings of the 9th International Drainage Symposium held jointly with CIGR and CSBE/SCGAB Proceedings, Quebec City, QC, Canada, 13–16 June 2010; p. 1. [Google Scholar]
- Nash, P.R.; Nelson, K.A.; Motavalli, P.; Nathan, M.; Dudenhoeffer, C. Reducing Phosphorus Loss in Tile Water with Managed Drainage in a Claypan Soil. J. Environ. Qual. 2015, 44, 585–593. [Google Scholar] [CrossRef]
- Nash, P.R.; Singh, G.; Nelson, K.A. Nutrient loss from floodplain soil with controlled subsurface drainage under forage production. J. Environ. Qual. 2020. [Google Scholar] [CrossRef]
- Valero, C.S.; Madramootoo, C.A.; Stämpfli, N. Water table management impacts on phosphorus loads in tile drainage. Agric. Water Manag. 2007, 89, 71–80. [Google Scholar] [CrossRef]
- Wesslak, R.N.; Nelson, K.A.; Dudenhoeffer, C.J. Spatial Response of Corn Yields to Drainage and Subirrigation Tile Spacings in a Claypan Soil. In Proceedings of the 2016 10th International Drainage Symposium, Minneapolis, MO, USA, 6–9 September 2016; pp. 1–7. [Google Scholar]
- Nelson, K.A. Soybean Yield Variability of Drainage and Subirrigation Systems in a Claypan Soil. Appl. Eng. Agric. 2017, 33, 801–809. [Google Scholar] [CrossRef]
- Zhang, T.; Tan, C.S.; Zheng, Z.M.; Welacky, T.W.; Reynolds, W. Impacts of Soil Conditioners and Water Table Management on Phosphorus Loss in Tile Drainage from a Clay Loam Soil. J. Environ. Qual. 2015, 44, 572–584. [Google Scholar] [CrossRef]
- Erickson, A.; Gulliver, J.; Weiss, P. Phosphate Removal from Agricultural Tile Drainage with Iron Enhanced Sand. Water 2017, 9, 672. [Google Scholar] [CrossRef]
- Radcliffe, D.E.; Reid, K.; Blombäck, K.; Bolster, C.H.; Collick, A.S.; Easton, Z.M.; Francesconi, W.; Fuka, D.R.; Johnsson, H.; King, K.; et al. Applicability of Models to Predict Phosphorus Losses in Drained Fields: A Review. J. Environ. Qual. 2015, 44, 614–628. [Google Scholar] [CrossRef]
- Bock, E.M.; Smith, N.G.; Rogers, M.; Coleman, B.; Reiter, M.; Benham, B.; Easton, Z.M. Enhanced Nitrate and Phosphate Removal in a Denitrifying Bioreactor with Biochar. J. Environ. Qual. 2015, 44, 605–613. [Google Scholar] [CrossRef] [PubMed]
- Christianson, L.E.; Lepine, C.; Sibrell, P.; Penn, C.; Summerfelt, S.T. Denitrifying woodchip bioreactor and phosphorus filter pairing to minimize pollution swapping. Water Res. 2017, 121, 129–139. [Google Scholar] [CrossRef] [PubMed]
- Birnbaum, A.P.; Owen, J.S.; Fox, L.J.; Niemiera, A.X. Removal Efficacy of Nursery Tail-Water Nitrogen and Phosphorus Using Ferric Aided Zeolite Sieves with or without Bioreactors; Virginia Tech: Blacksburg, VA, USA, 2018. [Google Scholar]
- Coleman, B.S. Impact of Biochar Amendment, Hydraulic Retention Time, and Influent Concentration on N and P Removal in Horizontal Flow-Through Bioreactors; Virginia Tech: Blacksburg, VA, USA, 2018. [Google Scholar]
- Hua, G.; Salo, M.W.; Schmit, C.G.; Hay, C.H. Nitrate and phosphate removal from agricultural subsurface drainage using laboratory woodchip bioreactors and recycled steel byproduct filters. Water Res. 2016, 102, 180–189. [Google Scholar] [CrossRef] [PubMed]
- Choudhury, T.; Robertson, W.D.; Finnigan, D.S. Suspended Sediment and Phosphorus Removal in a Woodchip Filter System Treating Agricultural Wash Water. J. Environ. Qual. 2016, 45, 796–802. [Google Scholar] [CrossRef]
- Thapa, U. Evaluation of Woodchip Bioreactors and Phosphorus Adsorption Media for Nutrient Removal from Subsurface Drainage Water. Ph.D. Thesis, South Dakota State University, Brookings, SD, USA, 2017. [Google Scholar]
- Husk, B.; Sanchez, J.; Anderson, B.; Whalen, J.; Wootton, B. Removal of phosphorus from agricultural subsurface drainage water with woodchip and mixed-media bioreactors. J. Soil Water Conserv. 2018, 73, 265–275. [Google Scholar] [CrossRef]
- Nodeh, H.R.; Sereshti, H.; Afsharian, E.Z.; Nouri, N. Enhanced removal of phosphate and nitrate ions from aqueous media using nanosized lanthanum hydrous doped on magnetic graphene nanocomposite. J. Environ. Manag. 2017, 197, 265–274. [Google Scholar] [CrossRef]
- Yang, B.; Liu, D.; Lu, J.; Meng, X.; Sun, Y. Phosphate uptake behavior and mechanism analysis of facilely synthesized nanocrystalline Zn-Fe layered double hydroxide with chloride intercalation. Surf. Interface Anal. 2018, 50, 378–392. [Google Scholar] [CrossRef]
- Tomer, M.; Porter, S.A.; Boomer, K.M.B.; James, D.E.; Kostel, J.A.; Helmers, M.J.; Isenhart, T.M.; McLellan, E. Agricultural Conservation Planning Framework: Developing Multipractice Watershed Planning Scenarios and Assessing Nutrient Reduction Potential. J. Environ. Qual. 2015, 44, 754–767. [Google Scholar] [CrossRef]
- CBMP. The Illinois Council on Best Management Practices. Available online: http://illinoiscbmp.com/ (accessed on 9 November 2018).
- Jaynes, D.B.; Isenhart, T.M. Performance of Saturated Riparian Buffers in Iowa, USA. J. Environ. Qual. 2019, 48, 289–296. [Google Scholar] [CrossRef]
- Utt, N.; Jaynes, D.; Albertsen, J. Demonstrate and Evaluate Saturated Buffers at Field Scale to Reduce Nitrates and Phosphorus from Subsurface Field Drainage Systems. Miss. River Basin Water Manag. 2015, 1–74. Available online: http://www.saturatedbufferstrips.com/images/final_report.pdf (accessed on 13 April 2020).
- McDowell, R.W.; Sharpley, A.N.; Bourke, W. Treatment of Drainage Water with Industrial By-Products to Prevent Phosphorus Loss from Tile-Drained Land. J. Environ. Qual. 2008, 37, 1575–1582. [Google Scholar] [CrossRef] [PubMed]
- Reddy, K.R.; Kadlec, R.H.; Flaig, E.; Gale, P.M. Phosphorus Retention in Streams and Wetlands: A Review. Crit. Rev. Environ. Sci. Technol. 1999, 29, 83–146. [Google Scholar] [CrossRef]
- Kadlec, R.H.; Hey, D.L. Constructed Wetlands for River Water Quality Improvement. Water Sci. Technol. 1994, 29, 159–168. [Google Scholar] [CrossRef]
- Vellidis, G.; Lowrance, R.; Gay, P.; Hubbard, R. Nutrient transport in a restored riparian wetland. J. Environ. Qual. 2003, 32, 711–726. [Google Scholar] [CrossRef]
- Hey, D.L.; Kenimer, A.L.; Barrett, K.R. Water quality improvement by four experimental wetlands. Ecol. Eng. 1994, 3, 381–397. [Google Scholar] [CrossRef]
- Higgins, M.; Rock, C.; Bouchard, R.; Wengrezynek, B. Controlling Agricultural Runoff by Use of Constructed Wetlands. In Constructed Wetlands for Water Quality Improvement; CRC Press: Boca Raton, FL, USA, 1993; pp. 359–367. [Google Scholar]
- Kovacic, D.A.; David, M.B.; Gentry, L.E.; Starks, K.M.; Cooke, R.A. Effectiveness of Constructed Wetlands in Reducing Nitrogen and Phosphorus Export from Agricultural Tile Drainage. J. Environ. Qual. 2000, 29, 1262–1274. [Google Scholar] [CrossRef]
- Miller, P.S.; Mitchell, J.K.; Cooke, R.A.; Engel, B.A. A wetland to improve agricultural subsurface drainage water quality. Trans. ASAE 2002, 45, 1305. [Google Scholar] [CrossRef]
- Jordan, T.E.; Whigham, D.; Hofmockel, K.S.; Pittek, M.A. Nutrient and Sediment Removal by a Restored Wetland Receiving Agricultural Runoff. J. Environ. Qual. 2003, 32, 1534–1547. [Google Scholar] [CrossRef]
- Yin, H.; Yan, X.; Gu, X. Evaluation of thermally-modified calcium-rich attapulgite as a low-cost substrate for rapid phosphorus removal in constructed wetlands. Water Res. 2017, 115, 329–338. [Google Scholar] [CrossRef]
- Bostrom, B. Phosphorus release from lake sediment. Arch. Hydrobiol. Beih. Ergebn. Limn. 1982, 18, 5–59. [Google Scholar]
- Reddy, G.; Redd, K. Phosphorus removal by ponds receiving polluted water from non-point sources. Wetl. Ecol. Manag. 1993, 2, 171–176. [Google Scholar] [CrossRef]
- Perniel, M.; Ruan, R.; Martinez, B. Nutrient removal from a stormwater detention pond using duckweed. Appl. Eng. Agric. 1998, 14, 605–609. [Google Scholar] [CrossRef]
- Fausey, N.R. Drainage management for humid regions. Int. Agric. Eng. J. 2005, 14, 209–214. [Google Scholar]
- Gburek, W.; Sharpley, A.; Pionke, H. Identification of critical source areas for phosphorus export from agricultural catchments. Adv. Hillslope Process. 1996, 1, 263–282. [Google Scholar]
- Lemke, A.M.; Kirkham, K.G.; Lindenbaum, T.T.; Herbert, M.E.; Tear, T.H.; Perry, W.L.; Herkert, J.R. Evaluating Agricultural Best Management Practices in Tile-Drained Subwatersheds of the Mackinaw River, Illinois. J. Environ. Qual. 2011, 40, 1215–1228. [Google Scholar] [CrossRef]
- Meals, D.W.; Dressing, S.A.; Davenport, T.E. Lag Time in Water Quality Response to Best Management Practices: A Review. J. Environ. Qual. 2010, 39, 85–96. [Google Scholar] [CrossRef]
- Pionke, H.B.; Gburek, W.J.; Sharpley, A.N. Critical source area controls on water quality in an agricultural watershed located in the Chesapeake Basin. Ecol. Eng. 2000, 14, 325–335. [Google Scholar] [CrossRef]
- Buda, A.R.; Kleinman, P.J.A.; Srinivasan, M.S.; Bryant, R.B.; Feyereisen, G.W. Factors influencing surface runoff generation from two agricultural hillslopes in central Pennsylvania. Hydrol. Process. 2009, 23, 1295–1312. [Google Scholar] [CrossRef]
- Srinivasan, M.; McDowell, R.W. Identifying critical source areas for water quality: Mapping and validating transport areas in three headwater catchments in Otago, New Zealand. J. Hydrol. 2009, 379, 54–67. [Google Scholar] [CrossRef]
- Evans, D. Linking Critical Source Areas of Phosphorus to Stormflow Dynamics in Three Central Illinois Agricultural Watersheds; Southern Illinois University: Carbondale, IL, USA, 2013. [Google Scholar]
- Jenness, J. Topographic Position Index; Jenness Enterprises: Flagstaff, AZ, USA, 2006. [Google Scholar]
- Beven, K.J.; Kirkby, M.J. A physically based, variable contributing area model of basin hydrology / Un modèle à base physique de zone d’appel variable de l’hydrologie du bassin versant. Hydrol. Sci. Bull. 1979, 24, 43–69. [Google Scholar] [CrossRef]
- Lane, S.N.; Brookes, C.J.; Kirkby, M.; Holden, J. A network-index-based version of TOPMODEL for use with high-resolution digital topographic data. Hydrol. Process. 2004, 18, 191–201. [Google Scholar] [CrossRef]
- Weld, J.L.; Sharpley, A.N.; Beegle, D.B.; Gburek, W.J. Identifying critical sources of phosphorus export from agricultural watersheds. Nutr. Cycl. Agroecosystems 2001, 59, 29–38. [Google Scholar] [CrossRef]
- Lemunyon, J.L.; Gilbert, R.G. The Concept and Need for a Phosphorus Assessment Tool. JPA 1993, 6, 483. [Google Scholar] [CrossRef]
- Sharpley, A.N.; Weld, J.L.; Beegle, D.B.; Kleinman, P.J.; Gburek, W.; Moore, P.; Mullins, G. Development of phosphorus indices for nutrient management planning strategies in the United States. J. Soil Water Conserv. 2003, 58, 137–152. [Google Scholar]
- Benning, J.; Wortmann, C. Phosphorus indexes in four Midwestern states: An evaluation of the differences and similarities. J. Soil Water Conserv. 2005, 60, 221–227. [Google Scholar]
- Osmond, D.; Cabrera, M.; Feagley, S.; Hardee, G.; Mitchell, C.; Moore, P.; Mylavarapu, R.; Oldham, J.; Stevens, J.; Thom, W. Comparing ratings of the southern phosphorus indices. J. Soil Water Conserv. 2006, 61, 325–337. [Google Scholar]
- Nelson, N.O.; Shober, A. Evaluation of Phosphorus Indices after Twenty Years of Science and Development. J. Environ. Qual. 2012, 41, 1703–1710. [Google Scholar] [CrossRef]
- Roberts, B.; Goodrich, R. Illinois Phosphorus Index; Natural Resource Conservation Service: Washington, DC, USA, 2013. [Google Scholar]
- Osmond, D.; Sharpley, A.; Bolster, C.; Cabrera, M.; Feagley, S.; Lee, B.; Mitchell, C.; Mylavarapu, R.; Oldham, L.; Walker, F.; et al. Comparing Phosphorus Indices from Twelve Southern U.S. States against Monitored Phosphorus Loads from Six Prior Southern Studies. J. Environ. Qual. 2012, 41, 1741–1749. [Google Scholar] [CrossRef]
- Barber, S.A. Relation of Fertilizer Placement to Nutrient Uptake and Crop Yield I. Interaction of Row Phosphorus and the Soil Level of Phosphorus. Agron. J. 1907, 50, 535–539. [Google Scholar] [CrossRef]
- Jamison, V.C.; Thornton, J.F. Results of Deep Fertilization and Subsoiling on a Claypan Soil. Agron. J. 1907, 52, 193–195. [Google Scholar] [CrossRef]
- Welch, L.F.; Mulvaney, D.L.; Boone, L.V.; McKibben, G.E.; Pendleton, J.W. Relative Efficiency of Broadcast Versus Banded Phosphorus for Corn. Agron. J. 1907, 58, 283–287. [Google Scholar] [CrossRef]
- Garg, K.P.; Welch, L.F. Growth and Phosphorus Uptake by Corn as Influenced by Phosphorus Placement. Agron. J. 1907, 59, 152–154. [Google Scholar] [CrossRef]
- Shear, G.M.; Moschler, W.W. Continuous Corn by the No-Tillage and Conventional Tillage Methods: A Six-Year Comparison. Agron. J. 1907, 61, 524–526. [Google Scholar] [CrossRef]
- Triplett, G.B.; Van Doren, D.M. Nitrogen, Phosphorus, and Potassium Fertilization of Non-Tilled Maize. Agron. J. 1907, 61, 637–639. [Google Scholar] [CrossRef]
- Smeck, N.E.; Runge, E.C.A. Phosphorus Availability and Redistribution in Relation to Profile Development in an Illinois Landscape Segment. Soil Sci. Soc. Am. J. 1971, 35, 952–959. [Google Scholar] [CrossRef]
- Belcher, C.R.; Ragland, J.L. Phosphorus Absorption by Sod-Planted Corn (Zea mays L.) from Surface-Applied Phosphorus. Agron. J. 1907, 64, 754–756. [Google Scholar] [CrossRef]
- DeMooy, C.J.; Young, J.L.; Kaap, J.D. Comparative Response of Soybeans and Corn to Phosphorus and Potassium. Agron. J. 1907, 65, 851–855. [Google Scholar] [CrossRef]
- Ham, G.E.; Nelson, W.W.; Evans, S.D.; Frazier, R.D. Influence of Fertilizer Placement on Yield Response of Soybeans. Agron. J. 1907, 65, 81–84. [Google Scholar] [CrossRef]
- Cihacek, L.J.; Mulvaney, D.L.; Olson, R.A.; Welch, L.F.; Wiese, R.A. Phosphate Placement for Corn in Chisel and Moldboard Plowing Systems. Agron. J. 1907, 66, 665–668. [Google Scholar] [CrossRef]
- Ham, G.E.; Caldwell, A.C. Fertilizer Placement Effects on Soybean Seed Yield, N2 Fixation, and 33 P Uptake. Agron. J. 1907, 70, 779–783. [Google Scholar] [CrossRef]
- Casanova, E.F. Rate, Placement, and Source of Phosphorus Fertilizer Effects on Corn Yields as Influenced by Weather, Soil, and Management Variables in Long-Term Experiments in Iowa. Ph.D. Thesis, Iowa State University, Ames, IA, USA, 1979. [Google Scholar]
- Alessi, J.; Power, J.F. Effects of Banded and Residual Fertilizer Phosphorus on Dryland Spring Wheat Yield in the Northern Plains. Soil Sci. Soc. Am. J. 1980, 44, 792–796. [Google Scholar] [CrossRef]
- Leikam, D.F.; Murphy, L.S.; Kissel, D.E.; Whitney, D.A.; Moser, H.C. Effects of Nitrogen and Phosphorus Application Method and Nitrogen Source on Winter Wheat Grain Yield and Leaf Tissue Phosphorus. Soil Sci. Soc. Am. J. 1983, 47, 530–535. [Google Scholar] [CrossRef]
- Maxwell, T.M.; Kissel, D.E.; Wagger, M.G.; Whitney, D.A.; Cabrera, M.; Moser, H.C. Optimum Spacing of Preplant Bands of N and P Fertilizer for Winter Wheat. Agron. J. 1907, 76, 243–247. [Google Scholar] [CrossRef]
- Sleight, D.M.; Sander, D.H.; Peterson, G.A. Effect of Fertilizer Phosphorus Placement on the Availability of Phosphorus. Soil Sci. Soc. Am. J. 1984, 48, 336–340. [Google Scholar] [CrossRef]
- Eckert, D.J.; Johnson, J.W. Phosphorus Fertilization in No-Tillage Corn Production. Agron. J. 1907, 77, 789–792. [Google Scholar] [CrossRef]
- McConnell, S.G.; Sander, D.H.; Peterson, G.A. Effect of Fertilizer Phosphorus Placement Depth on Winter Wheat Yield. Soil Sci. Soc. Am. J. 1986, 50, 148–153. [Google Scholar] [CrossRef]
- Cabrera, M.; Kissel, D.E.; Whitney, D.A. Combinations of Preplant-Banded and Seed-Banded Applications of Nitrogen and Phosphorus Fertilizer for Winter Wheat Production. Agron. J. 1907, 78, 620–625. [Google Scholar] [CrossRef]
- Rehm, G.W. Response of Irrigated Soybeans to Rate and Placement of Fertilizer Phosphorus. Soil Sci. Soc. Am. J. 1986, 50, 1227–1230. [Google Scholar] [CrossRef]
- Raun, W.R.; Sander, D.H.; Olson, R.A. Phosphorus Fertilizer Carriers and Their Placement for Minimum Till Corn Under Sprinkler Irrigation. Soil Sci. Soc. Am. J. 1987, 51, 1055–1062. [Google Scholar] [CrossRef]
- Mallarino, A.P.; Bordoli, J.M.; Borges, R. Phosphorus and Potassium Placement Effects on Early Growth and Nutrient Uptake of No-Till Corn and Relationships with Grain Yield. Agron. J. 1907, 91, 37–45. [Google Scholar] [CrossRef]
- Riedell, W.E.; Beck, D.L.; Schumacher, T.E. Corn Response to Fertilizer Placement Treatments in an Irrigated No-Till System. Semigroup Forum 2000, 92, 316. [Google Scholar]
- Kimmell, R.; Pierzynski, G.M.; Janssen, K.; Barnes, P. Effects of Tillage and Phosphorus Placement on Phosphorus Runoff Losses in a Grain Sorghum-Soybean Rotation. J. Environ. Qual. 2001, 30, 1324–1330. [Google Scholar] [CrossRef] [PubMed]
- Bundy, L.G.; Andraski, T.W.; Powell, J.M. Management Practice Effects on Phosphorus Losses in Runoff in Corn Production Systems. J. Environ. Qual. 2001, 30, 1822–1828. [Google Scholar] [CrossRef]
- Borges, R.; Mallarino, A.P. Broadcast and Deep-Band Placement of Phosphorus and Potassium for Soybean Managed with Ridge Tillage. Soil Sci. Soc. Am. J. 2003, 67, 1920–1927. [Google Scholar] [CrossRef]
- Tabbara, H. Phosphorus Loss to Runoff Water Twenty-Four Hours after Application of Liquid Swine Manure or Fertilizer. J. Environ. Qual. 2003, 32, 1044–1052. [Google Scholar] [CrossRef] [PubMed]
- Wittry, D.J.; Mallarino, A.P. Comparison of Uniform- and Variable-Rate Phosphorus Fertilization for Corn–Soybean Rotations Iowa Agric. Home Econ. Exp. Stn. Journal Paper no. J-Project Project supported in part by the Iowa Soybean Promotion Board and the Leopold Center for Sustainable Agriculture. Agron. J. 2004, 96, 26–33. [Google Scholar] [CrossRef]
- Kaiser, D.E.; Mallarino, A.P.; Bermudez, M. Corn Grain Yield, Early Growth, and Early Nutrient Uptake as Affected by Broadcast and In-Furrow Starter Fertilization. Agron. J. 2005, 97, 620–626. [Google Scholar] [CrossRef]
- Dodd, J.R.; Mallarino, A.P. Soil-Test Phosphorus and Crop Grain Yield Responses to Long-Term Phosphorus Fertilization for Corn-Soybean Rotations. Soil Sci. Soc. Am. J. 2005, 69, 1118–1128. [Google Scholar] [CrossRef]
- Lambert, D.M.; Lowenberg-Deboer, J.; Malzer, G.L. Economic Analysis of Spatial-Temporal Patterns in Corn and Soybean Response to Nitrogen and Phosphorus. Agron. J. 2006, 98, 43–54. [Google Scholar] [CrossRef]
- Bermudez, M.; Mallarino, A.P. Impacts of Variable-Rate Phosphorus Fertilization Based on Dense Grid Soil Sampling on Soil-Test Phosphorus and Grain Yield of Corn and Soybean. Agron. J. 2007, 99, 822–832. [Google Scholar] [CrossRef]
- Cánepa, M. Strip-Till Corn Response to Deep-Banded Placement of Phosphorus and Potassium. Ph.D. Thesis, Purdue University, West Lafayette, IN, USA, 2007. [Google Scholar]
- Sneller, E.G.; Laboski, C.A.M. Phosphorus Source Effects on Corn Utilization and Changes in Soil Test. Agron. J. 2009, 101, 663–670. [Google Scholar] [CrossRef]
- Mallarino, A.P.; Bergmann, N.; Kaiser, D.E. Corn Responses to In-Furrow Phosphorus and Potassium Starter Fertilizer Applications. Agron. J. 2011, 103, 685–694. [Google Scholar] [CrossRef]
- Arns, I. Evaluation of Corn and Soybean Response to Phosphorus and Potassium Fertilization. Ph.D. Thesis, Kansas State University, Manhattan, KS, USA, 2013. [Google Scholar]
- Edwards, C.L. Evaluation of Long-Term Phosphorus Fertilizer Placement, Rate, and Source, and Research in the US Midwest. Ph.D. Thesis, Kansas State University, Manhattan, KS, USA, 2017. [Google Scholar]
- Mackay, A.; Kladivko, E.J.; Barber, S.A.; Griffith, D.R. Phosphorus and Potassium Uptake by Corn in Conservation Tillage Systems. Soil Sci. Soc. Am. J. 1987, 51, 970–974. [Google Scholar] [CrossRef]
- Mallarino, A.P.; Webb, J.R.; Blackmer, A.M. Corn and Soybean Yields during 11 Years of Phosphorus and Potassium Fertilization on a High-Testing Soil. JPA 1991, 4, 312. [Google Scholar] [CrossRef]
- Karlen, D.; Berry, E.; Colvin, T.S.; Kanwar, R.S. Twelve-year tillage and crop rotation effects on yields and soil chemical properties in northeast Iowa. Commun. Soil Sci. Plant Anal. 1991, 22, 1985–2003. [Google Scholar] [CrossRef]
- Webb, J.; Mallarino, A.; Blackmer, A. Effects of Residual and Annually Applied Phosphorus on Soil Test Values and Yields of Corn and Soybean. JPA 1992, 5, 148. [Google Scholar] [CrossRef]
- Daroub, S.; Pierce, F.; Ellis, B. Phosphorus Fractions and Fate of Phosphorus-33 in Soils under Plowing and No-Tillage. Soil Sci. Soc. Am. J. 2000, 64, 170–176. [Google Scholar] [CrossRef]
- Fernández, F.G.; Farmaha, B.; Nafziger, E.D. Soil Fertility Status of Soils in Illinois. Commun. Soil Sci. Plant Anal. 2012, 43, 2897–2914. [Google Scholar] [CrossRef]
- Stout, W.L.; Sharpley, A.N.; Landa, J. Effectiveness of Coal Combustion By-Products in Controlling Phosphorus Export from Soils. J. Environ. Qual. 2000, 29, 1239–1244. [Google Scholar] [CrossRef]
- Boruvka, L.; Rechcigl, J.E. Phosphorus retention by the Ap horizon of a spodosol as influenced by calcium amendments 1. Soil Sci. 2003, 168, 699–706. [Google Scholar] [CrossRef]
- Stout, W.L.; Sharpley, A.N.; Weaver, S.R. Effect of amending high phosphorus soils with flue-gas desulfurization gypsum on plant uptake and soil fractions of phosphorus. Nutr. Cycl. Agroecosyst. 2003, 67, 21–29. [Google Scholar] [CrossRef]
- Drizo, A.; Forget, C.; Chapuis, R.P.; Comeau, Y. Phosphorus removal by electric arc furnace steel slag and serpentinite. Water Res. 2006, 40, 1547–1554. [Google Scholar] [CrossRef] [PubMed]
- Elrashidi, M.A.; West, L.T.; Seybold, C.; Benham, E.C.; Schoeneberger, P.J.; Ferguson, R. Effects of Gypsum Addition on Solubility of Nutrients in Soil Amended with Peat. Soil Sci. 2010, 175, 162–172. [Google Scholar] [CrossRef]
- Bryant, R.; Buda, A.R.; Kleinman, P.J.A.; Church, C.; Saporito, L.S.; Folmar, G.J.; Bose, S.; Allen, A.L. Using Flue Gas Desulfurization Gypsum to Remove Dissolved Phosphorus from Agricultural Drainage Waters. J. Environ. Qual. 2012, 41, 664–671. [Google Scholar] [CrossRef]
- Favaretto, N.; Norton, L.D.; Johnston, C.T.; Bigham, J.; Sperrin, M. Nitrogen and Phosphorus Leaching as Affected by Gypsum Amendment and Exchangeable Calcium and Magnesium. Soil Sci. Soc. Am. J. 2012, 76, 575–585. [Google Scholar] [CrossRef]
- Torbert, H.A.; Watts, D.B.; Chaney, R.L. Impact of Flue Gas Desulfurization Gypsum and Manure Application on Transfer of Potentially Toxic Elements to Plants, Soil, and Runoff. J. Environ. Qual. 2018, 47, 865–872. [Google Scholar] [CrossRef]
- Klausner, S.D.; Zwerman, P.J.; Ellis, D.F. Surface Runoff Losses of Soluble Nitrogen and Phosphorus Under Two Systems of Soil Management. J. Environ. Qual. 1974, 3, 42–46. [Google Scholar] [CrossRef]
- Angle, J.S.; Mc Clung, G.; Mc Intosh, M.S.; Thomas, P.M.; Wolf, D.C. Nutrient Losses in Runoff from Conventional and No-Till Corn Watersheds. J. Environ. Qual. 1984, 13, 431–435. [Google Scholar] [CrossRef]
- Langdale, G.; Leonard, R.; Thomas, A. Conservation practice effects on phosphorus losses from Southern Piedmont watersheds. J. Soil Water Conserv. 1985, 40, 157–161. [Google Scholar]
- Yoo, K.; Touchton, J.; Walker, R. Runoff, sediment and nutrient losses from various tillage systems of cotton. Soil Tillage Res. 1988, 12, 13–24. [Google Scholar] [CrossRef]
- White, C.; Weil, R.R. Forage Radish Cover Crops Increase Soil Test Phosphorus Surrounding Radish Taproot Holes. Soil Sci. Soc. Am. J. 2011, 75, 121–130. [Google Scholar] [CrossRef]
- Acuña, J.C.M.; Villamil, M. Short-Term Effects of Cover Crops and Compaction on Soil Properties and Soybean Production in Illinois. Agron. J. 2014, 106, 860–870. [Google Scholar] [CrossRef]
- Dozier, I.A.; Behnke, G.; Davis, A.S.; Nafziger, E.D.; Villamil, M. Tillage and Cover Cropping Effects on Soil Properties and Crop Production in Illinois. Agron. J. 2017, 109, 1261–1270. [Google Scholar] [CrossRef]
- Aryal, N.; Reba, M.; Straitt, N.; Teague, T.; Bouldin, J.; Dabney, S. Impact of cover crop and season on nutrients and sediment in runoff water measured at the edge of fields in the Mississippi Delta of Arkansas. J. Soil Water Conserv. 2018, 73, 24–34. [Google Scholar] [CrossRef]
- Fink, R.J.; Wesley, D. Corn Yield as Affected by Fertilization and Tillage System. Agron. J. 1907, 66, 70–71. [Google Scholar]
- Barisas, S.G.; Baker, J.L.; Johnson, H.P.; Laflen, J.M. Effect of Tillage Systems on Runoff Losses of Nutrients, A Rainfall Simulation Study. Trans. ASAE 1978, 21, 893–897. [Google Scholar] [CrossRef]
- Laflen, J.M. Simulation of Sedimentation in Tile-Outlet Terraces. Ph.D. Thesis, Iowa State University, Ames, IA, USA, 1972. [Google Scholar]
- Andraski, B.J.; Mueller, D.H.; Daniel, T.C. Phosphorus Losses in Runoff As Affected by Tillage. Soil Sci. Soc. Am. J. 1985, 49, 1523–1527. [Google Scholar] [CrossRef]
- Guertal, E.A.; Eckert, D.J.; Traina, S.J.; Logan, T.J. Differential Phosphorus Retention in Soil Profiles under No-Till Crop Production. Soil Sci. Soc. Am. J. 1991, 55, 410. [Google Scholar] [CrossRef]
- Phillips, D.L.; Hardin, P.D.; Benson, V.W.; Baglio, J.V. Nonpoint source pollution impacts of alternative agricultural management practices in Illinois: A simulation study. J. Soil Water Conserv. 1993, 48, 449–457. [Google Scholar]
- Seta, A.K.; Blevins, R.L.; Frye, W.W.; Barfield, B.J. Reducing Soil Erosion and Agricultural Chemical Losses with Conservation Tillage. J. Environ. Qual. 1993, 22, 661–665. [Google Scholar] [CrossRef]
- Holanda, F.S.R.; Mengel, D.B.; Paula, M.B.; Carvaho, J.G.; Bertoni, J.C. Influence of crop rotations and tillage systems on phosphorus and potassium stratification and root distribution in the soil profile. Commun. Soil Sci. Plant Anal. 1998, 29, 2383–2394. [Google Scholar] [CrossRef]
- Eghball, B.; Gilley, J.E. Phosphorus and Nitrogen in Runoff following Beef Cattle Manure or Compost Application. J. Environ. Qual. 1999, 28, 1201–1210. [Google Scholar] [CrossRef]
- Randall, G.; Vetsch, J.; Murrell, T. Corn response to phosphorus placement under various tillage practices. Better Crops 2001, 85, 12–15. [Google Scholar]
- Zhao, S.L.; Gupta, S.C.; Huggins, D.R.; Moncrief, J.F. Tillage and Nutrient Source Effects on Surface and Subsurface Water Quality at Corn Planting. J. Environ. Qual. 2001, 30, 998–1008. [Google Scholar] [CrossRef] [PubMed]
- Andraski, T.W.; Bundy, L.G.; Kilian, K.C. Manure History and Long-Term Tillage Effects on Soil Properties and Phosphorus Losses in Runoff. J. Environ. Qual. 2003, 32, 1782–1789. [Google Scholar] [CrossRef] [PubMed]
- Bermudez, M.; Mallarino, A.P. Corn Response to Starter Fertilizer and Tillage across and within Fields Having No-Till Management Histories. Agron. J. 2004, 96, 776–785. [Google Scholar] [CrossRef]
- Al-Kaisi, M.M.; Kwaw-Mensah, D. Effect of Tillage and Nitrogen Rate on Corn Yield and Nitrogen and Phosphorus Uptake in a Corn-Soybean Rotation. Agron. J. 2007, 99, 1548–1558. [Google Scholar] [CrossRef]
- Sweeney, D.W.; Kilgore, G.L.; Kelley, K. Fertilizer Management for Short-season Corn Grown in Reduced, Strip-till, and No-till Systems on Claypan Soil. Crop Manag. 2008, 7. [Google Scholar] [CrossRef]
- Zuber, S. Long-term effect of crop rotation and tillage on soil properties. Ph.D. Thesis, University of Illinois, Champaign, IL, USA, 2014. [Google Scholar]
- Schuman, G.E.; Spomer, R.G.; Piest, R.F. Phosphorus Losses from Four Agricultural Watersheds on Missouri Valley Loess. Soil Sci. Soc. Am. J. 1973, 37, 424–427. [Google Scholar] [CrossRef]
- Burwell, R.E.; Schuman, G.E.; Piest, R.F.; Spomer, R.G.; McCalla, T.M. Quality of water discharged from two agricultural watersheds in southwestern Iowa. Water Resour. Res. 1974, 10, 359–365. [Google Scholar] [CrossRef]
- Hanway, J.J.; Laflen, J.M. Plant Nutrient Losses from Tile-Outlet Terraces. J. Environ. Qual. 1974, 3, 351–356. [Google Scholar] [CrossRef]
- Burwell, R.; Schuman, G.; Heinemann, H.; Spomer, R. Nitrogen and phosphorus movement from agricultural watersheds. J. Soil Water Conserv. 1977, 32, 226–230. [Google Scholar]
- Alberts, E.E.; Schuman, G.E.; Burwell, R.E. Seasonal Runoff Losses of Nitrogen and Phosphorus from Missouri Valley Loess Watersheds. J. Environ. Qual. 1978, 7, 203–208. [Google Scholar] [CrossRef]
- Alberts, E.; Spomer, R. Dissolved nitrogen and phosphorus in runoff from watersheds in conservation and conventional tillage. J. Soil Water Conserv. 1985, 40, 153–157. [Google Scholar]
- Smith, D.R.; Livingston, S.J. Managing farmed closed depressional areas using blind inlets to minimize phosphorus and nitrogen losses. Soil Use Manag. 2013, 29, 94–102. [Google Scholar] [CrossRef]
- Peterjohn, W.T.; Correll, D.L. Nutrient Dynamics in an Agricultural Watershed: Observations on the Role of A Riparian Forest. Ecology 1984, 65, 1466–1475. [Google Scholar] [CrossRef]
- Dillaha, T.; Reneau, R.; Mostaghimi, S.; Lee, D. Vegetative Filter Strips for Agricultural Nonpoint Source Pollution Control. Trans. ASAE 1989, 32, 513–519. [Google Scholar] [CrossRef]
- Magette, W.L.; Brinsfield, R.B.; Palmer, R.E.; Wood, J.D. Nutrient and Sediment Removal by Vegetated Filter Strips. Trans. ASAE 1989, 32, 663–667. [Google Scholar] [CrossRef]
- Daniels, R.B.; Gilliam, J.W. Sediment and Chemical Load Reduction by Grass and Riparian Filters. Soil Sci. Soc. Am. J. 1996, 60, 246–251. [Google Scholar] [CrossRef]
- Srivastava, P.; Edwards, D.R.; Daniel, T.C.; Moore, P.A., Jr.; Costello, T.A. Performance of Vegetative Filter Strips with Varying Pollutant Source and Filter Strip Lengths. Trans. ASAE 1996, 39, 2231–2239. [Google Scholar] [CrossRef]
- Barfield, B.J.; Blevins, R.L.; Fogle, A.W.; Madison, C.E.; Inamdar, S.; Carey, D.I.; Evangelou, V.P. Water quality impacts of natural filter strips in karst areas. Trans. ASAE 1998, 41, 371–381. [Google Scholar] [CrossRef]
- Lee, K.-H.; Isenhart, T.M.; Schultz, R.C.; Mickelson, S.K. Nutrient and sediment removal by switchgrass and cool-season grass filter strips in Central Iowa, USA. Agrofor. Syst. 1998, 44, 121–132. [Google Scholar] [CrossRef]
- Schmitt, T.J.; Dosskey, M.G.; Hoagland, K.D. Filter Strip Performance and Processes for Different Vegetation, Widths, and Contaminants. J. Environ. Qual. 1999, 28, 1479–1489. [Google Scholar] [CrossRef]
- Eghball, B.; Gilley, J.E.; Kramer, L.; Moorman, T. Narrow grass hedge effects on phosphorus and nitrogen in runoff following manure and fertilizer application. J. Soil Water Conserv. 2000, 55, 172–176. [Google Scholar]
- Lee, K.-H.; Isenhart, T.; Schultz, R.C.; Mickelson, S.K. Multispecies Riparian Buffers Trap Sediment and Nutrients during Rainfall Simulations. J. Environ. Qual. 2000, 29, 1200–1205. [Google Scholar] [CrossRef]
- Udawatta, R.; Krstansky, J.J.; Henderson, G.S.; Garrett, H.E. Agroforestry Practices, Runoff, and Nutrient Loss. J. Environ. Qual. 2002, 31, 1214–1225. [Google Scholar] [CrossRef]
- Lee, K.-H.; Isenhart, T.M.; Schultz, R.C. Sediment and nutrient removal in an established multi-species riparian buffer. J. Soil Water Conserv. 2003, 58, 1–8. [Google Scholar]
- Lowrance, R.; Sheridan, J.M. Surface Runoff Water Quality in a Managed Three Zone Riparian Buffer. J. Environ. Qual. 2005, 34, 1851–1859. [Google Scholar] [CrossRef]
- Benoit, G.R. Effect of agricultural management of wet sloping soil on nitrate and phosphorus in surface and subsurface water. Water Resour. Res. 1973, 9, 1296–1303. [Google Scholar] [CrossRef]
- Baker, J.L.; Campbell, K.L.; Johnson, H.P.; Hanway, J.J. Nitrate, Phosphorus, and Sulfate in Subsurface Drainage Water. J. Environ. Qual. 1975, 4, 406–412. [Google Scholar] [CrossRef]
- Schwab, G.O.; Fausey, N.R.; Kopcak, D.E. Sediment and Chemical Content of Agricultural Drainage Water. Trans. ASAE 1980, 23, 1446–1449. [Google Scholar] [CrossRef]
- Gilliam, J.W.; Skaggs, R.W. Controlled Agricultural Drainage to Maintain Water Quality. J. Irrig. Drain. Eng. 1986, 112, 254–263. [Google Scholar] [CrossRef]
- Kladivko, E.J.; Van Scoyoc, G.E.; Monke, E.J.; Oates, K.M.; Pask, W. Pesticide and Nutrient Movement into Subsurface Tile Drains on a Silt Loam Soil in Indiana. J. Environ. Qual. 1991, 20, 264–270. [Google Scholar] [CrossRef]
- Evans, R.O.; Skaggs, R.W.; Gilliam, J.W. Controlled versus Conventional Drainage Effects on Water Quality. J. Irrig. Drain. Eng. 1995, 121, 271–276. [Google Scholar] [CrossRef]
- Xue, Y.; David, M.B.; Gentry, L.E.; Kovacic, D.A. Kinetics and Modeling of Dissolved Phosphorus Export from a Tile-Drained Agricultural Watershed. J. Environ. Qual. 1998, 27, 917–922. [Google Scholar] [CrossRef]
- Randall, G.W.; Iragavarapu, T.K.; Schmitt, M.A. Nutrient Losses in Subsurface Drainage Water from Dairy Manure and Urea Applied for Corn. J. Environ. Qual. 2000, 29, 1244–1252. [Google Scholar] [CrossRef]
- Penn, C.J.; McGrath, J.; Rounds, E.; Fox, G.; Heeren, D. Trapping Phosphorus in Runoff with a Phosphorus Removal Structure. J. Environ. Qual. 2012, 41, 672–679. [Google Scholar] [CrossRef]
- King, K.; Williams, M.R.; Fausey, N.R. Contributions of Systematic Tile Drainage to Watershed-Scale Phosphorus Transport. J. Environ. Qual. 2015, 44, 486–494. [Google Scholar] [CrossRef]
- Smith, D.R.; King, K.; Johnson, L.; Francesconi, W.; Richards, P.; Baker, D.; Sharpley, A.N. Surface Runoff and Tile Drainage Transport of Phosphorus in the Midwestern United States. J. Environ. Qual. 2015, 44, 495–502. [Google Scholar] [CrossRef]
- Hoover, N.L.; Kanwar, R.; Soupir, M.L.; Pederson, C. Effects of Poultry Manure Application on Phosphorus in Soil and Tile Drain Water Under a Corn-Soybean Rotation. Water Air Soil Pollut. 2015, 226, 138. [Google Scholar] [CrossRef]
- Daigh, A.L.; Zhou, X.; Helmers, M.; Pederson, C.H.; Horton, R.; Jarchow, M.; Liebman, M. Subsurface Drainage Nitrate and Total Reactive Phosphorus Losses in Bioenergy-Based Prairies and Corn Systems. J. Environ. Qual. 2015, 44, 1638–1646. [Google Scholar] [CrossRef] [PubMed]
- Mitsch, W.; Dorage, C.L.; Wiemhoff, J.R. Ecosystem Dynamics and a Phosphorus Budget of an Alluvial Cypress Swamp in Southern Illinois. Ecol. 1979, 60, 1116. [Google Scholar] [CrossRef]
- Magner, J.; Gernes, M.; Jacobson, M.; Brooks, K.; Engstrom, D. Structural Redevelopment and Water Quality response of a prairie pothole wetland restoration in Western Minnesota. In Variability of Wetlands in the Agricultural Landscape; American Society of Agricultural Engineers: St. Joseph, MI, USA, 1995; pp. 413–426. [Google Scholar]
- Reinelt, L.E.; Horner, R.R. Pollutant removal from stormwater runoff by palustrine wetlands based on comprehensive budgets. Ecol. Eng. 1995, 4, 77–97. [Google Scholar] [CrossRef]
- Kröger, R.; Holland, M.M.; Moore, M.T.; Cooper, C. Agricultural Drainage Ditches Mitigate Phosphorus Loads as a Function of Hydrological Variability. J. Environ. Qual. 2008, 37, 107–113. [Google Scholar] [CrossRef] [PubMed]
- Moore, M.T.; Kröger, R.; Locke, M.; Cullum, R.; Steinriede, R.; Testa, S.; Lizotte, R.; Bryant, C.; Cooper, C. Nutrient mitigation capacity in Mississippi Delta, USA drainage ditches. Environ. Pollut. 2010, 158, 175–184. [Google Scholar] [CrossRef] [PubMed]


| Purpose | State † | Soil Series * | Crop ** | P Source | P Placement | P Rate (kg P ha−1) | P Timing | Tillage | STP (mg kg−1, kg ha−1 *) | Tile Drain | Irrigated | Study Type | Reference |
|---|---|---|---|---|---|---|---|---|---|---|---|---|---|
| P application and STP effects on P uptake and crop yield | IN | Raub SiL | C, S, W, H | SP | Mixed by disking | 7.9, 19.96, 39.9 | na | DT | 17.6, 30.8, 55 | na | na | Placement | Barber [175] |
| Deep P fertilizer application and subsoiling on a claypan soil | MO | Mexico SiL, Putnam, SiL | A | TSP | Surface or mixed with soil | 181 | na | CT | na | na | na | Placement | Jamison and Thornton [176] |
| Relative efficiency of P placement methods (broadcast vs. banded) | IL | Zanesville, Elliott, Muscatine SiL | C | SP | Broadcast, banded | 0, 4, 8,16, 6, 12, 24 | na | 2.5–9 | na | na | Placement | Welch et al. [177] | |
| Water-soluble P source and placement method effect on corn growth and P uptake | IL | Proctor SiL | C | na | Mixed, banded, with seed placement | 0, 300, 600 mg P/pot | na | na | 5.5 | na | na | Placement | Garg and Welch [178] |
| NT impact on corn yields, soil pH, soil fertility, and compaction | VA | Lodi loam | C, CC | na | na | na | na | yes | na | na | na | Tillage, cover crops | Shear and Moschler [179] |
| Combination of row and surface applied fertilizers on NT corn yields in low and high fertility systems | OH | Canfield SiL | C | TSP | Broadcast, mixed | 9, 55 | na | yes | 30* | na | na | Tillage | Triplett and Van Doren [180] |
| Determination of dominant forms of P present in poorly to somewhat poorly drained prairie soils; Quantification of vertical and horizontal P movement within the landscape | IL | Tama; Muscatin; Sable; Denny | na | na | na | na | na | na | na | na | na | P availability | Smeck and Runge [181] |
| P uptake from surface-applied fertilizer by NT corn planted in low soil P content | KY | Zanesville SiL | C | SP | Broadcast, banded near-seed | 0, 56, 112, 224 | na | NT | 3* | na | na | Placement, rate | Belcher and Ragland [182] |
| Crop response to P and K placement methods | IA | Webster SiL | C, S | SP | Broadcast, banded | 0,29,58 | na | na | na | na | na | Rate | DeMooy et al. [183] |
| Fertilizer placements impact on soybeans | MN | MeIntosh SiL, Webster SiCL, Nicollet SiCL | S | Banded, seed placemen, broadcast | Vary | na | na | na | na | na | Placement | Ham et al. [184] | |
| Tillage and P placement methods impact on corn growth and yield. | IL, NE | Sharpsburg SiCL, Leshara SiL, Platte SL, Flanagan SiL | C | OA | Broadcast, banded | 0, 11, 22, 45, 30, 60 | PP | CP, MP | 4.2–12.8 | na | Both | Placement, rate, tillage | Cihacek et al. [185] |
| P fertilizer placement method impact on P utilization, N uptake and N2 fixation | MN | Waukegan SiL | S | SP | Broadcast and incorporated, broadcast, banded near seed, banded at some distance from row | 35 | na | na | na | na | na | Placement | Ham and Caldwell [186] |
| Interaction of weather and soil variables with P fertilizer application rates, sources and methods | IA | Kenyon SiL, Readlyn, Floyd, Clarion-Webster, Primghar silty clay, Grundy SiL, Edina SiL | C | RP, SP | Broadcast, in-row | 22.5, 45, 67, 134, 268 | na | na | na | na | na | Source, rate, placement | Casanova [187] |
| Comparison of tillage systems | IA | Loess Hills, Monona-Ida-Napier soils | na | na | na | na | na | na | na | na | na | Tillage, runoff and placement | Johnson et al. [79] |
| Residual effects of different P fertilizer application rates and placement on Soil-P solubility | ND | Parshall fSL | SW | TSP | Broadcast, banded | 0, 20, 40, 80, 160 | PP | CT | 6.6 | na | Dryland | Placement | Alessi and Power [188] |
| N and P placement method impact on P uptake and crop yield | KS | Hastings Si, Cherokee SiC, Woodston SiC | WW | APP | Broadcast, knife | 0, 20 | PP | na | 4–22 | na | na | Placement | Leikam et al. [189] |
| Spacing of N-P fertilizer bands influence on crop yield and P uptake | KS | Crete SiC, Parsons Si, Pond Creek Si, Pawnee C | WW | APP | Banded | 0, 6, 12, 24 | PP | na | 4–10 | na | na | Placement, rate | Maxwell et al. [190] |
| Effect of different spacing of fertilizer placement and placement methods on P uptake and yield | NE | Uly SiL subsoil, Thurman LfS | O | na | Broadcast, banded | na | na | na | 4.4–11 | na | na | Placement | Sleight et al. [191] |
| Surface and subsurface P applications on corn yields and P distribution | OH | Wooster SiL | C | TSP | Broadcast, banded | 0, 14.5, 29, 19, 39, 58, 116 | PP, AP | NT | 12 | na | na | Placement | Eckert and Johnson [192] |
| P placement depth effects on grain yield, yield components, and P uptake | NE | Holdrege Si, Hall Sit, Burchard-Shelby C, Adair-Pawnee C, Keith Si, Alliance Si, Geary SiC | WW | APP | Surface, seed placement | 11 | AP | na | 4–9 | na | na | Placement | McConnell et al. [193] |
| P placement method impact on grain yield | KS | Crete SiCL | WW | APP | Pre-plant banded, seed-banded | 0, 2.5, 5, 10, 20 | PP, AP | CT | 8–11 | na | na | Placement, rate | Cabrera et al. [194] |
| P fertilizer rate and placement effect on soybean | NE | Crofton SiL, Nora SiL, Moody SiCL | S | APP | Broadcast and incorporated, banded below/side of seed | 0, 11, 22, 33, 44 | PP, AP | na | 0.6–3.1 | na | yes | Placement, rate | Rehm [195] |
| P application methods and P sources effect on corn yields and P uptake | NE | Sharpsburg SiCL, Coly SiL | C | APP, UP, DAP | Broadcast, banded near/below seed | 9, 18 | PP | MT | 1.5–5.5 | na | yes | Source, placement, rate | Raun et al. [196] |
| P and K placement methods for NT corn | IA | Kenyon, Webster, Galva, Mahaska, Marshall, Nevin, Colo, Nicollet, Givin, Dinsdale | C | TSP | Deep banded, shallow banded, broadcast | 14, 28, 56 | PP | NT | 7–41 | na | na | Placement | Bordoli and Mallarino [23] |
| P and K fertilizer placement impact on corn growth, yield, nutrient uptake | OH | Kenyon, Webster, Galva, Mahaska, Marshall, Nevin, Colo, Nicollet, Givin, Dinsdale | C | na | Broadcast, deep banded, and shallow banded | 14, 28, 56 | PP | NT | 7–41 | na | na | Placement | Mallarino et al. [197] |
| Interaction of K fertilizer with P and N planting time fertilizer placement | SD | Lowry SiL | C | APP, 7-21-7 liquid fertilizer | Surface, with seed, close to seed furrow | 10–57 | AP | NT | 6 | na | yes | Placement, timing | Riedell et al. [198] |
| P and K fertilizer placements effect on soybean growth and nutrient uptake | IA | Kenyon, Webster, Galva, Mahaska, Marshall, Nevin, Nicollet, Givin, Dinsdale | S | na | Broadcast, banded with the planter, deep banded | 14, 28 | PP | NT | 7–39 | na | na | Placement | Borges and Mallarino [24] |
| P or K fertilizers placement on soybean | IA | Dinsdale, Colo, Vesser, Downs, Webster, Clarion, Primghar | S | na | Surface, broadcast, subsurface banded at planting | 0, 19.5, 39, 78 | Annual and semi-annual | NT | na | na | Dryland | Rate, placement, timing | Buah et al. [33] |
| P and K fertilizer rates and placement | IA | Dinsdale, Vesser, Downs, Clarion, Wester, Colo | C | TSP | Broadcast, banded beside or below seed | 0, 19, 39 | AP | NT | 12–79 | na | na | Rate, placement | Buah et al. [25] |
| RT, P and K fertilizer placement effect on corn grain yield, early P and K uptake | IA | Marshall, Tama, Clarion, Canisteo, Webster | C | na | Broadcast and deep banded | 14, 56 | na | RT | 6–64 | na | na | Placement, rate, tillage | Borges and Mallarino [24] |
| Tillage, P placement and rate influence on P losses | KS | Woodson SiL | S, M | liquid fertilizer | Broadcast or knifed | 0, 24 | PP | RT, CT, NT | na | na | na | Placement, rate, runoff | (Kimmell Kimmell et al. [199] et al., 2001) |
| Management practices (manure, tillage, biosolids, inorganic fertilizer) effects on P runoff losses | WI | SiL | na | na | Surface | 71, 198, 331, 830, 441, 65 | Spring | NT, ShT, CP | na | na | na | Source, tillage, runoff | Bundy et al. [200] |
| P and K placement on soybean managed with RT | IA | Marshall, Tama, Clarion, Canisteo, Webster | S | TSP | Broadcast and deep banded | 0, 14, 56 | PP | RT | 7–61 | na | na | Placement | Borges and Mallarino [201] |
| Reduction in P runoff loss after incorporation of liquid swine manure or P fertilizer | IA | Terril loam | na | Liquid swine manure, APP | Broadcast, incorporated | 62–158 | na | CT | 24 | na | no | Source, placement, rate, runoff | Tabbara [202] |
| Crop response to VR and uniform-rate (UR) P fertilization | IA | Webster, Nicollet, Clarion | C, S | MAP | Broadcast | 35–70 | Fall | CT | 11–24 | na | na | Rate | Wittry and Mallarino [203] |
| Interaction effects of deeper P and K fertilizer placement with hybrid and planting population | IN | Toronto-Millbrook complex, Drummer soils | C | DAP | Broadcast, deep banded, shallow banded | 44 | PP | CT | na | na | Dryland | Placement | Kline [30] |
| P and K starter fertilizer placement effects on corn yield and nutrient uptake | IA | Sparta, Marshall, Readlyn, Marshan, Webster, Atterberry | C | 3–8–15 (N–P–K) liquid, TSP | Broadcast and in-furrow | 5–7; 49–66 | Starter | NT, CP | 5–77 | na | na | Placement | Kaiser et al. [204] |
| STP trends over time for different initial STP levels and response of corn and soybean yield to P fertilization and STP | IA | Nicollet-webster complex, Webster–Canisteo complex, Kenyon | C, S | TSP | Broadcast | 0, 22, 33, 44 | Fall | CT | 17–96 | na | na | Rate | Dodd and Mallarino [205] |
| Tillage and annual P fertilizer management on stratified soils on plant growth and P uptake. | KS | Parsons SiL, Catoosa SiL | C, S, W | APP | Broadcast, deep banded | 0, 20 | PP | MP, NT, ReT | 16–27 | na | na | Rate, placement, tillage | Schwab et al. [26] |
| Spatio-temporal variations of corn-soybean yield and economics of variable rate N and P management | MN | Jeffers CL series, Clarion-Swanlake CL, Webster-Delft CL | C, S | TSP | na | 25, 49 | Fall | na | <5 to >15 | na | na | Rate | Lambert et al. [206] |
| P application rates (fixed rate vs. variable rate) influence on corn and soybean yield | IA | Clarion, Webster, Canisteo, Marshall | C, S | MAP | Broadcast | 24–70 | Fall | CT | 8–27 | ns | na | Rate | Bermudez and Mallarino [207] |
| P and/or K placement effect on corn growth, development and yield | IN | Drummer, Raub-Brenton complex | C | TSP, MAP, APP | Broadcast, deep banded | 44 | Fall, PP | ST | 23–109 | yes | na | Placement | Cánepa [208] |
| P availability from manure to crop growth through crop P uptake and yield; residual P availability from manure application during consequent year; evaluate the effect of P source on changes in STP levels. | WI | Plano SiL, Withee SiL | C | Various manure, TSP | 39, 79, 118 | PP | CT | 11–12 | na | na | Source | Sneller and Laboski [209] | |
| Impact of fall and spring broadcast P fertilization on P uptake and grain yield | IA | Multiple | C, S | TSP | Broadcast | 0, 10, 20, 30, 40, 50 | Fall, spring | NT | 5.1–34 | na | na | Timing | Mallarino et al. [35] |
| In-furrow fluid starter P–K fertilizer application impact on yield, P and K concentration and uptake | IA | Sparta LS, Readlyn L, Marshan CL, Webster SiCL | C | 3–8–15 fluid fertilizer, TSP | Broadcast, starter | 5–7; 49–66 | Starter | CT, NT | 4–56 | na | na | Placement, source | Mallarino et al. [210] |
| Tillage, P and K fertilizer rate and placement effect on soybean roots distribution, soil water, P, and K levels. | IL | Drummer SiCL, Flanagan SiL | S | na | Broadcast, deep banded | 0, 12, 24, 36 | PP | NT, ST | 20 | yes | na | Tillage, placement and rate | Farmaha et al. [32] |
| Effect of P and K rate and placement in NT and ST on P and K accumulation | IL | Drummer SiCL, Flanagan SiL | S | na | Broadcast, deep banded | 0, 12, 24, 36 | na | NT, ST | 21 | yes | na | Rate, placement | Farmaha et al. [31] |
| P and K distribution after repeated applications in NT and ST soils | IL | Drummer SiCL, Flanagan SiL | DAP, TSP | Broadcast, deep banded | 22, 333, 44, 55, 66, 77 | NT, ST | na | na | na | Tillage, rate and placement, stratification | Fernández and Schaefer [28] | ||
| Effect of P and K rate and placement in NT and ST on grain yield; soil water, P, and K content, corn roots distribution | IL | Drummer SiCL, Flanagan SiL | C | TSP | Broadcast, deep banded | 0, 12, 24, 36 | PP | NT, ST | 41 | na | na | Rate, placement, tillage | Fernández and White [29] |
| Effect of starter and broadcast fertilizer application on corn and soybean production, STP | KS | Eudora SL, Rossville SL, Woodson SL; Kenoma SL; Crete SL | C, S | MAP | Starter, broadcast | 9.8, 19.6, 29.3, 39.1, 48.9 | Starter, PP | CT, NT | 12–26 | na | Irrigated, rainfed | Placement, timing | Arns [211] |
| Review of tillage system and P fertilizer placement interaction on corn and soybean production. | KS | Woodson SiL, Crete SiL | C, S | TSP, APP | Broadcast, deep banded | 0, 20, 39 | Starter, AP | CT, NT | na | na | Irrigated, rainfed | Tillage, P placement | Edwards [212] |
| Tillage, P placement and rate impact on P runoff | IL | Drummer SiCL, Flanagan SiL | C, S | TSP | Broadcast, deep banded | 23, 40 | NT, ST | 12–31 | no | Tillage, placement, rate | Yuan et al. [61] |
| Purpose | State | Soil Series | Crop Rotation | P rate (kg ha−1) | Tillage | STP (mg kg−1) | Reference |
|---|---|---|---|---|---|---|---|
| Comparison of P stratification between CT, NT, RiT | IN | Chalmers SiCL | C | 274 (biannual) | CT, NT, RiT | 35 to 117 | Mackay et al. [213] |
| Effects of 8-yr P buildup and 26-yr residual decline on crop yields and soil-test P. | NC | Portsmouth soil | C-S | 0, 10, 20, 40, and 60 (annually) | CT | Initial STP 22 g m−3; adding 30 g P m−3 yr−1 resulted in an increase of 7.4 g P m−3 yr−1 | McCollum [36] |
| Effects of P and K fertilization on STP | IA | Kenyon L | C-S | 0, 22, 45 | na | 28 | Mallarino et al. [214] |
| Vertical and horizontal distributions of P in conservation tillage systems | IA | Webster CL, Tama SiL | C-S, CCo | 30, 80 | NT, RiT | 69 to 129 | Robbins and Voss [38] |
| Changes in soil chemical properties, associated with different crop rotation and tillage practices over a 12-yr period | IA | Floyd L, Kenyon L, Readlyn L | C-S, CCo | 17 to 58 | MP, CP, RiT, NT | 57 to 141 | Karlen et al. [215] |
| changes in STP values, crop yields and economic returns to P fertilization resulting from 14-yr of annual applications of P fertilizer | IA | Webster CL, Canisteo CL | C-S | 0, 11, 22, 34 | na | 18 | Webb et al. [216] |
| P build up and decline was determined during a 20-yr period and critical STP concentrations were determined for corn and soybean | MN | Webster CL, Aastad CL | C-S | 0, 56, 112 | na | Initial STP 10 mg kg−1; adding 56 kg P ha−1 resulted in an increase of 0.7 mg P kg−1 yr−1 and adding 112 kg P ha−1 resulted in an increase of 2.5 mg P kg−1 yr−1 | Randall et al. [37] |
| Long-term tillage management impact on P fractions in the soil | MI | Capac L, Kalamazoo L | C-S, CCo | na | CT, NT | 32 to 107 | Daroub et al. [217] |
| Determining changes in soil P dynamics over time in Sanborn field. | MO | Mexico SiL | CCo, CW, CT, C-W-RC | 0–31 | MP | 0–75 | Motavalli and Miles [19] |
| P stratification after deep banding fertilizers for 4 yr | IA | Kenyon, Webster, Galva, Mahaska, Marshal | C-S | 28, 66 | NT, CT | 12 to 56 | Mallarino and Borges [39] |
| Survey of P, K, pH, Ca, Mg, and organic matter levels of soils in Illinois and the degree of nutrient vertical stratification. | IL | na | na | na | na | 1 to 576 | Fernández et al. [218] |
| Effects of 45 yr of fertilizer and tillage treatments on soil nutrients and crop yields | IL | Bethalto SiL | C-S, C | 14 to 39 | MP, CP, NT | 5 to 35 | Cook and Trlica [18] |
| P stratification at the watershed scale and its relationship to STP, and potential contribution to increased DRP export | OH | na | C, S, W | na | 65% NT | na | Baker et al. [43] |
| Purpose | State † | Soil Series | Amendment or Enhance P Fertilizer Type Rate | Crop | P rate | STP (mg kg−1, kg ha−1 *) | Study type | Highlights | Reference | |
|---|---|---|---|---|---|---|---|---|---|---|
| Effectiveness of soil amendments on reduction of drainage water P concentration. | FL | Pahokee muck | Calcium oxide plus aluminum sulfate, dolomite, gypsum | 0, 4, 8, and 12 Mg ha−1 | na | 5 mg L−1 | 5 | Column leaching | 25–40% reduction of DP with gypsum compared to other treatments | Coale et al. [44] |
| Coal combustion by-products and gypsum effects on heavy metal uptake and P loss in surface runoff | PA | Klinesville, Hagerstown, Watson | Flyash, FGD gypsum, agriculture gypsum | 5, 10, and 20 g kg−1 | Canola | na | 128 to 370 | Growth chambers, runoff boxes | 20–43% reduction in DP | Stout et al. [219] |
| Effect on P sorption capacity of Ap horizon after applying limestone, dolomite, and gypsum | FL | Immokalee fS | Limestone, dolomite, gypsum | 1.8 Mg ha−1 for gypsum and 1 Mg ha−1 for other two | Pasture | na | 2 | Column study | Ca amendments that increase soil pH are more efficient at retention of P in soil | Boruvka and Rechcigl [220] |
| Repeated plant growth cycles impact on the stability of soil inorganic P fractions formed after FGD gypsum application | DE, PA | Watson SiL, Klinesville SiL | FGD gypsum | 22 Mg ha−1 | Ryegrass | na | 228 to 367 | Greenhouse | Treatment with FGD decreased water extractable soil P 38% to 57%, | Stout et al. [221] |
| Alum amended poultry manure effects on P release from soils | DE | Evesboro LS, Rumford LS, Pocomoke SL | Aluminum sulfate amended poultry manure | 9 Mg ha−1 | na | na | 467 to 671 | Controlled incubation | 7.3% to 20% reduction in P desorption from amended soils compared to control | Staats et al. [45] |
| P removal efficiencies of two amendments with or without limestone | VT | na | Electric arc, furnace steel slag, serpentinite | na | na | na | na | Column study | Serpentinite + limestone removed 1.0 mg P g−1 and steel slag + limestone removed 2.2 mg P g−1 of material used during 180 d of experiment | Drizo et al. [222] |
| effectiveness of grass buffer strips and gypsum amendments in reducing the P loss from land-applied poultry litter | AL | Hartsells fSL | Gypsum | 0, 1, 3.2, and 5.6 Mg ha−1 | Tall fescue | 11 kg ha−1 | na | Grass buffer strip, simulated runoff | 32–40% reduction in DP in grass buffer strips with gypsum | Watts and Torbert [51] |
| Increasing levels of gypsum application effects on solubility of 13 nutrients | NE | Sharpsburg SiCL | Gypsum | 0, 0.01, 0.05, 0.1, 0.15, 0.2, 0.3, and0.5 g g−1 of soil | na | na | na | Laboratory experiment | Gypsum addition increased the solubility of N, K, Ca, Mg, Mn, Cl, and S, whereas it decreased the solubility of P, Na, Fe, Cu, Zn, and B. | Elrashidi et al. [223] |
| Effect of liming, P source, and P enhancer products on corn production and P uptake | MO | Putnam SiL, Tiptonville SiL | Limestone, Avail, P2O5 Max | Limestone (3.4, 4.5, and 8.1 Mg ha−1) and Avail and P2O5 Max (2.1 and 4.2 L Mg−1 of fertilizer) | Corn | 24, 49. and 51 kg ha−1 | 30 to 118 * | Field | P enhancers did not affect plant population, silage dry weights, grain moisture, yield, protein, oil, or starch | Dudenhoeffer et al. [55] |
| Effectiveness of an in-ditch filter to remove DP was evaluated | MD | Quindocqua SiL, Manokin SiL | FGD gypsum | 110 Mg | na | na | 374 * | Filter in drainage ditch | 65% to 73% DP removal. Ditch filtration using FGD gypsum is not practical at a farm scale due to maintenance and clean-out requirements | Bryant et al. [224] |
| Leaching potential of P after application of gypsum amendments and different levels of exchangeable Ca2+ and Mg2+ to the soil | IN | Miami SiL | Gypsum, 5 Ca:Mg ratios | 5 Mg ha−1 | na | 45 kg ha−1 | 53 | Column study | Leaching of particulate P was significantly less in the Ca-treated soil than the Mg-treated soil | Favaretto et al. [225] |
| Effect of tillage, fertilizer placement, P rate, and two P enhancer products on corn production, grain quality, P uptake, and apparent P recovery efficiency | MO | Kilwinning SiL, Bremer SiCL | Avail, P2O5 Max | 2.1 and 4.2 L Mg−1 of fertilizer | Corn | 0, 24, and 49 kg ha−1 | 27 to 90 * | Field | P enhancers addition did not increase plant P uptake | Dudenhoeffer et al. [47] |
| Reduction in P losses with application of FGD gypsum | AL | Luverne SL | FGD gypsum | 0, 2.2, 4.4, and 8.9 Mg ha−1 | Bermudagrass | 20.6 g P kg−1 (13.4 Mg ha−1 poultry litter wet wt.0 | na | Simulated runoff | 54% cumulative reduction in DP concentration losses was observed with FGD gypsum compared control | Watts and Torbert [53] |
| Impact of FGD gypsum on P concentrations and loads in surface runoff and tile discharge | OH | Blount SiL | FGD gypsum | 2.24 Mg ha−1 | Continuous corn | 0 kg ha−1 | >480 | Field runoff, tile drainage | Combined surface and tile discharge reduction of DRP and TP were 36% and 38%. FGD gypsum can be used as a tool to address elevated P concentrations and loadings in drainage waters. | King et al. [52] |
| Gypsum effects on crop yield, STP, plant tissue P, and vadose water | AL, AR, IN, NM, ND, OH, WI | na | FGD, mined gypsum | Alfalfa, Bermudagrass, canola, cotton, corn, soybean, wheat | 0 to 22.4 Mg ha−1 | na | Field | Crop yield was generally not affected by gypsum application however reduction in DP losses in water were seen | Kost et al. [49] | |
| impacts on soil, plant tissue, and surface water runoff from fields receiving FGD gypsum | AL | Luverne sandy | FGD gypsum | 0, 2.2, 4.4, and 8.9 Mg ha−1 | Bermudagrass | na | 30 | Simulated runoff | FGD gypsum application did not result in increase of toxic elements in plants, soil, or runoff | Torbert et al. [226] |
| Purpose | State † | Soil Series | Crop | Tillage | STP (mg kg−1, kg ha−1 *) | P rate (kg ha−1) | P source | P placement | P timing | Study Type | Highlights | Reference |
|---|---|---|---|---|---|---|---|---|---|---|---|---|
| Effects of tillage types on corn yield, P accumulation and soil compaction | VA | Lodi loam | C, Annual ryegrass, O, rye | CT, NT | na | 22–49 | 5-10-5, 10-100-10 15-10-10 | Broadcast, incorporated | Tillage, cover crops | At same application rate of P, available P accumulation was more in the upper 5 cm of the untilled soil than NT. NT soil had greater available phosphorus for the upper 20 cm of soil | Shear and Moschler [179] | |
| Crop rotation, soil management practices and fertilizer rates impact on soluble N and P losses in surface runoff. | NY | Lima-Kendaia soil association | C, beans, wheat, rye, A | na | 10–49 | na | Broadcast, planter, sidedressed | Runoff, cover crops | Three times higher P losses in high fertility, poorly managed plots than other treatments. | Klausner et al. [227] | ||
| Tillage effects on runoff quality and quantity | MD | Manor loam | C, barley | CT, NT | 87 | 108 | 6-24-24 | na | Runoff, cover crops | Higher runoff, sediment and soluble solids losses from CT than NT. 163 g ha−1 more TP lost from CT than NT in one year. No significant differences between CT and NT for loss of ortho-PO, and total soluble P | Angle et al. [228] | |
| Conservation practices impact on runoff P forms | GA | Cecil SL | C, S, M WW, barley, crimson clover, rye | CT, RT | 20–50 | Preplant-incorporated, broadcast | Runoff, cover crops | higher soluble P and total P concentrations and >50% lower TP losses with conservation tillage than CT. Lower runoff losses with conservation tillage | Langdale et al. [229] | |||
| Tillage and cover crop impacts on runoff | AL | Decatur SiL | Cotton, WW | NT, RT, CT | na | na | na | na | Runoff, cover crops | RT with CC most effective in decreasing runoff, sediment, and nutrient losses. | (Yoo et al. [230] | |
| Effectivenessof selected non-leguminous winter cover crops in reducing runoff, soil loss, and dissolved N and P levels transportedin runoff. | MO | Mexico SiL | S, common chickweed, Canada bluegrass, downy brome | NT | na | 25 | 6-10-20 | na | Runoff, cover crops | Chickweed, downy brome, and Canada bluegrass decreased annual soil losses by 87%, 95%, and 96%, and runoff by 44%, 53%, and 45%, respectively, compared to no-CC control. CC have 1.62 to 2.86-time greater dissolver phosphate than no-CC control. CC reduced annual dissolved nutrient losses by 7% to 77% | Zhu et al. [78] | |
| Effect of rye CC and N fertilizer sources on soil chemical properties | OH | Canfield SiL, Hoytville SiC | C, S, rye, A | NT | 0.20–0.54 mmol/kg P | 26–38 | na | Broadcast | Spring | Cover crops | Rye CC reduced P concentration in surface 5 cm soil depth in continuous corn rotation that received ammonia fertilizer applications. | Eckert [71] |
| Effects of winter CC on soil chemical and physical properties | IL | Flanagan | C, S, hairy vetch, cereal rye | NT | Not applied | no | no | no | Cover crops | Lower soil P in rotation with rye or mixture of rye and hairy vetch CC compared to no-CC treatments. | Villamil et al. [73] | |
| CCs impact on P uptake and soil P concentration | MD | Downer, Codorus | C, forage radish, cereal rye | CT | 88–98 | 17 | TSP | Broadcast | In-season | Cover crops | Forage radish resulted into 19 and 22 mg P kg−1 more P in 0–2.5 cm soil depth than cereal rye and No-CC control | White and Weil [231] |
| Compaction and CC effects on soybean growth, yield, and soil properties | IL | Drummer SiCL | S, radish, triticale, buckwheat, hairy vetch | CT | na | no | Not used | no | no | Cover crops | No differences obtained in soil P concentration due to CC | Acuña and Villamil [232] |
| Effects of single or mixture of CCs on crop yields, weeds and soil properties | IL | Flanagan SiL, Danabrook SiL | C, S, forage radish, buckwheat, cereal rye, hairy vetch | CT | 1 ton | Manure (5-3-3) | na | Cover crops | In non-headland areas, mixture of forage radish, hairy vetch and rye had lower soil P by 6.4 mg/kg than in forage radish + buck wheat treatment. | Welch et al. [177] | ||
| Impact of tillage and CCS on crop yield and soil properties | IL | Flanagan SiL, Drummer SiCL, Catlin SiL | C, S, rape, radish, annual ryegrass, red clover, hairy vetch, cereal rye, spring oat | NT, CP | na | na | na | na | Cover crops | Available P not affected by CC or tillage | Dozier et al. [233] | |
| Performance of winter CCs in reducing nitrate and TP in tile-drained agricultural watershed. | IL | na | C, S, cereal rye, tillage radish, O, annual rye | na | na | na | na | Watershed scale, cover crops, subsurface tiles | No significant change in TP loading | Bruening [77] | ||
| effectiveness of winter cover crops in reducing runoff, total suspended solids (TSS), nitrogen (N) and phosphorus (P) concentrations in ephemeral streams of non-tile drained headwater agricultural watersheds. | IL | Hosmer SiL | C, S, cereal rye, hairy vetch | NT | na | 26 | DAP | Broadcast | na | Cover crops | Event meant concentrations of NO3-N, NH4-N, and DRP did not decrease | Singh et al. [67] |
| impacts of cover crops on the water quality draining from cotton production fields. | AR | Mhoon fine SL, Commerce vfSL, Bruno LS, Dundee fSL, Routon, Crevasse, Sharkey-Steele complex | Cotton, C, O, WW | CT | na | 22–28 | na | Broadcast | na | Cover crops, runoff | CC reduced phosphate by 53% than control at one of the sites | Aryal et al. [234] |
| effects of cover crop in a corn-soybean rotation on nutrient loss, soil health, and crop yields in a terraced field | MO | Putman SiL | C, S, WW, radish, turnip and cereal rye | NT | 80–90 | 28 | na | Broadcast | Spring | Cover crops and terraces | CC did not decrease cumulative total P loss | Adler [98] |
| Effects of different N application rates and tillage practices on corn yield | OH | Canfield SiL | C | NT, CT | 30* | 9 +55 | TSP | Broadcast, mixed | At planting | Tillage | NT increased corn yields compared to CT, but no significant differences in P uptake at tasseling stage | Triplett and Van Doren [180] |
| Tillage practices impact on corn growth, and P stratification | VA | Lodi loam | C | NT, CT, tillage alternate year | na | 112 | 10/10/2010 | Broadcast and/or incorporated | na | Tillage, cover crops | NT increased corn yields than CT. | Shear and Moschler [179] |
| tillage methods effects on runoff water and sediment N and P composition | IN | Bedford SiL | C | Coulter plant, till-plant, chisel-plant, DT, CT | na | 56 | TSP | na | na | Tillage | CT had highest soil erosion and water losses, but small N and P losses; disk and till systems have lower soluble N and P concentrations in runoff water. | Römkens and Nelson [62] |
| Tillage and P placement methods impact on corn growth and yield. | IL, NE | Sharpsburg SiCL, Leshara SiL, Platte SL, Flanagan SiL | C | CP, MP | 4.2–12.8 | 0, 11, 22, 45, 30, 60 | OA | Broadcasting, banding, application by CP | Pre-planting | Placement, rate, tillage | Lower P losses in runoff with chisel placement of P | Cihacek et al. [185] |
| P fertilizer application and tillage system impacts on corn production and P movement in soil profile | IL | Clinton and Ipava SiL | C | CT, NT | na | 51.5 | na | Broadcast | Pre-planting | Tillage | Slow P movement in soil under NT than CT. | Fink and Wesley [235] |
| N and P runoff and sediment losses as affected by tillage practices | IA | Ida SiL, Tama SiCL, Kenyon SL | C | CT, till plant, CP, DT, ridge-plant, fluted coulter | na | 30 | na | Broadcast | Before spring tillage and planting | Runoff, tillage | Conservation tillage practices reduced soil erosion and related nutrient losses, but they were not effective in reducing the loss of water soluble nutrients | Barisas et al. [236] |
| Comparison of conservation tillage system with CT for sediment and nutrient losses in runoff | IA | Loess, Hills, Monona-Ida-Napier soils | na | Conventional plowing and planting, till-planting, and ridge-planting | 22 | 37 | na | na | na | Tillage, runoff, placement | Conservation tillage reduced runoff (40%), soil loss (60–90%), N and P losses as compared to Conventional plowing. | Johnson et al. [79] |
| Tillage practices effects on N and P losses in runoff in corn-soybean rotation | IA | Clarion, Monoma | C, S | CT, CP, NT | na | 37 | AP | Broadcast | Before tillage and planting | Tillage and runoff | Phosphate-P in runoff water and sediment TP follows the order: NT > CP > CT. P loses in erosion followed opposite trend. | Laflen [237] |
| Effects of tillage systems on runoff P loss were evaluated | WI | Griswold SiL | C | CT, TP, NT, CP | 39–58 | 111 | 6–10.6–20; 6-24-24 | Subsurface banded | At planting | Tillage, runoff | All conservation tillage systems reduced TP and AAP losses by 59% to 81% and 27% to 63%, respectively, than CT. | Andraski et al. [238] |
| Impact of NT on P-retention in soil | OH | Hoytville SiCL, Canfield SiL | na | NT, CT | na | na | na | na | na | Tillage | na | Guertal et al. [239] |
| influence of crop rotation under different tillage practices on soil erosion, N and P export using the EPIC model | IL | na | soybean, S | CT, NT | na | na | na | na | na | Tillage, crop rotation | NT resulted higher P losses in surface runoff | Phillips et al. [240] |
| Conservation tillage impact on soil erosion, N and P losses in runoff. | KY | Maury SiL | na | CT, CP, NT | na | 44 | TSP | Broadcast | na | Tillage, runoff | NT had lower mean runoff rate, total runoff volume, mean sediment concentration, and total soil losses compared to CP and CT. NT increased phosphate concentration in runoff than CT or CP. | Seta et al. [241] |
| Interaction effect of tillage systems and crop rotation on P stratification | IN | Chalmers SiCL | C, S | MP, CP, NT | na | na | na | na | na | Tillage, crop rotation, P stratification | Characteristic P stratification in NT due to surface fertilizer application | Holanda et al. [242] |
| Manure and compost application impact on runoff losses of P and N | NE | Sharpsburg SiCL | M, WWt | NT, DT | 12–79 | na | Manure | na | na | Tillage, placement, runoff | NT had lower TP and PP concentrations than disked treatments. DP, BAP losses in runoff were greater with NT than Disked treatments. | Eghball and Gilley [243] |
| Corn response to P placement and rates under various tillage practices | MN | Nicollet-Webster CL | C | na | na | na | na | na | na | 4R, tillage | Under very low STP levels, large responses to P were observed for all placements. Banded applications at half the recommended broadcast rate was not enough to optimize corn grain yield | Randall et al. [244] |
| Effects of tillage and N/P source on surface runoff losses of N and P fractions. | MN | Webster CL | C | MP, RT | na | 53–86 | TSP, manure | Surface broadcast | Fall, spring | Tillage, runoff, subsurface tile | RT with manure applications increased TP and soluble P losses. MP with manures resulted into least water quality degradation | Zhao et al. [245] |
| Impact of manure application and tillage on runoff P losses | WI | Plano and Rozetta SiL | C | CP, NT | na | 88 | manure | Broadcast | Spring | Tillage, runoff | NT resulted into greater P stratification near the surface (0–5 cm) than CP. NT reduced P loads by 57%, 70% and 91% for dissolved P, bioavailable P, and TP, respectively as compared to CP. | Andraski et al. [246] |
| Impact of tillage and starter fertilizer on grain yield and nutrient uptake | IA | Maxfield, Donnan, Marshall, Klinger, Sawmill, Dinsdale | C | ST, DT | 14–50 | 5.2–24.2 | 6-8-6, 7-8-5, 10-15-0, 16-10-3 | Broadcast | na | Tillage | Tillage increased yield and nutrient uptake by 2.5% and 22–30%, respectively. | Bermudez and Mallarino [247] |
| Effects of P fertilizer management under different tillage systems on crop yield and P uptake | KS | Parsons SiL, Catoosa SiL | C, S, WW, M | ReT, NT, MP | 12–27 | 20 | APP | Broadcast, banding, deep banding | Pre-planting | 4R, tillage | Corn and sorghum yield and P uptake were increased with subsurface placement of P. MP increased grain yields of corn, soybean and wheat as compared to NT | Schwab et al. [26] |
| Evaluate interactive effects of tillage systems and N rates of liquid swine manure and N fertilizer on corn N and P use efficiencies | IA | Kenyon loam | C | NT, ST, CP | 35 | na | Liquid swine manure | na | na | Tillage | Greater P recovery with CP than NT or ST with manure application at 85 kg N ha−1. For N fertilizer treatments, NT had greater grain P recovery than ST or CP at all N rates. | Al-Kaisi and Kwaw-Mensah [248] |
| Influence of tillage and fertilizer N-P management on short-season corn grown | KS | Parsons SiL | C | ST, NT, ReT | 17 | 20 | APP | Surface band, subsurface band | Spring, fall | Tillage | ReT increased corn yields by 2.82 Mg ha−1 than other tillage systems. Spring and subsurface banding applications increased yields than other treatments. | Sweeney et al. [249] |
| Effect of P and K rate and placement in NT and ST on grain yield; water, P, and K values in the soil; and the distribution of corn roots were evaluated. | IL | Flanagan SiL, Drummer SiCL | C | NT, ST | 41 | 0,12,24,36 | TSP | Broadcast, deep banding | Pre-planting | Tillage, rate, placement | Deep banding increased soil P beneath the crop row and reduced soil surface test values compared to broadcast applications | Fernández and White [29] |
| Effect of crop rotation and tillage on both soil chemical and physical properties | IL | Sable silty CL, Muscatune SiL, Caseyville SiL, Downsouth SiL | C, S, WW | CP, NT | na | na | na | na | Tillage, crop rotation | NT had 8.8 mg kg more P in soil than CT at depth 0–10 cm. However, at depth 10–20 cm, NT had 3.2 mg kg−1 less P than CT. continuous soybean rotation had higher soil P concentrations than continuous corn a corn-soybean-wheat | Zuber [250] | |
| Effects of tillage, P fertilizer placement and rate on runoff P concentrations and loads | IL | Drummer SiCL, Flanagan SiL | C, S | NT, ST | 12–31 | 23, 40 | TSP | broadcast, deep placement | Fall | 4R, runoff, tillage | DRP loads reduced by deep placement 69% to 72% compared to broadcast P application, irrespective of rate. Increasing P rates increased P concentration for broadcast treatments. Deep placement also reduced TP runoff losses | Yuan et al. [61] |
| Purpose | State | Soil Series | Crop | P application (kg ha−1) | Tillage | STP (mg kg−1) | Study Type | Highlights | Reference |
|---|---|---|---|---|---|---|---|---|---|
| Conservation practices impact on managing P loss in runoff and its relation to sediment P and DP. | IA | Monona, Ida, and Napier SiL | C, P | 39 and 97 | na | na | Terraces | Average loss of DP was 0.049 and inorganic P (IP) was 0.085 kg ha−1 yr−1 from terraced fields whereas 0.171 (DP) and 1.05 (IP) kg ha−1 yr−1 for fields without terraces | Schuman et al. [251] |
| Influence of levelled terraces and contour planted corn on water quality | IA | Marshall SiL, Judson SiL, Monnona SiL | C | na | na | na | Terraces | na | Burwell et al. [252] |
| Nutrient losses in water from terraced continuous row cropping system | IA | Fayette silt, Clarion loam, Sharpsburg SiC, Floyd loam | C | 17 to 43 | MP | 7–42 | Terraces | Generally total P losses in runoff were 0.44 to 1.06 kg ha−1 and were correlated to sediment loss | Hanway and Laflen [253] |
| Watershed budgets of N and P were calculated using crop removal, surface runoff loss, deep percolation and subsurface discharge | IA | Marshall SiL, Judson SiL, Monnona SiL | C | 17 to 48 | CT | na | Terraces | Terraced watersheds had 0.11 to 0.46 kg ha−1 yr−1 less total P loss compared to contour watersheds | Burwell et al. [254] |
| Nitrogen and P losses for three seasonal runoff and erosion periods | IA | Marshall SiL, Judson SiL | C | 39 and 97 | MP, DT | na | Terraces | Terraced watersheds had 0.019 to 0.048 kg ha−1 yr−1 DP loss whereas contour watersheds had 0.022 to 0.045 kg ha−1 yr−1 | Alberts et al. [255] |
| N and P loss in surface and subsurface water for a 10-yr period from terrace and contour till fields | IA | Marshall SiL, Judson SiL | C | 36 and 97 | MP, DT | na | Terraces | P loss in surface runoff was <2% of applied fertilizer and was highest for tilled fields | Alberts and Spomer [256] |
| design and potential of blind inlets to improve water quality compared to tile risers | IN | na | C, S, O, W | na | na | na | Blind inlets | Reduction of 65–72% in DP and 50–78% in total P loading was reported by replacing tile risers with blind inputs | Smith and Livingston [257] |
| Blind inlets and tile riser were evaluated for suspended sediment and P loads from drainage water | IN, MN | na | A, C, S, O, W | 20–54 | na | na | Blind inlets | Total P and DP loads were 66% and 50% less for the blind inlets compared to tile risers | Feyereisen et al. [99] |
| effects of inclusion of a cover crop on nutrient loss | KS | Smolan SiCL | C, CC | 36 | NT | na | Cover crops, terraces | Out of 2 yr runoff DP loss was reduced only in 1 yr in the terraces with cover crops | Abel [76] |
| Effects of inclusion of a CC in a corn-soybean rotation on nutrient loss, soil health, and crop yields in a terraced field | MO | Putman SiL | C, CC | 28 | NT | 80–90 | Cover crops, terraces | Terraces with cover crops did not decreased cumulative total P loss | Adler et al. [98] |
| Nutrient (C, N, and P) concentration changes in surface runoff and shallow groundwater | MD | SL | na | na | na | na | Riparian buffers | na | Peterjohn and Correll [258] |
| Performance of vegetative filter strips (VFS) of different lengths for the removal of sediment, nitrogen (N), and phosphorus (P) from cropland runoff | VA | Groseclose SiL | Orchard grass | 49 | CT | na | In-Field vegetative buffers | Reduction by 70–84% of the incoming suspended solids, 61–79% of the incoming P, and 54–73% of the incoming N | Dillaha et al. [259] |
| Performance of vegetated filter strips of different lengths in nutrients and sediments reduction from agricultural runoff. | MD | Woodstown SL | Ky-31 fescue | 114 | na | na | In-Field vegetative buffers | 66%, 0% and 27% reduction in TSS, TN, and TP from runoff masses | Magette et al. [260] |
| Natural and planted VFS effectiveness in reducing sediment and nutrient losses | NC | Cecil, Georgeville | Fescue, shrubs, trees | na | na | na | In-Field vegetative buffers | 50–80% reduction in runoff load, 80% reduction in sediment loss, 50% and 80% reduction in TP and Phosphate-P | Daniels and Gilliam [261] |
| Performance of poultry treated VFS of varying filter strip length in reducing nutrient losses from varying pollutant source runoff | AR | Captina SiL | Manured treated fescue, P | 60 | na | 60 | In-Field vegetative buffers | 22–82% phosphate-P and 21–66% TP reduction from runoff by VFS | Srivastava et al. [262] |
| Effectiveness of natural riparian grass buffer strips in removing sediment, atrazine, nitrogen and phosphorus from surface runoff | KY | Maury SiL | na | na | na | na | In-Field vegetative buffers | na | Barfield et al. [263] |
| Comparison of switch grass and cool-season grass strips of different width in sediment and nutrients reduction | IA | Coland | Switchgrass, bromegrass, timothy, fescue | na | ns | na | In-Field vegetative buffers | Filter strips removed 66–77% sediment, 37–52% TP and 34–43% phosphate P, depending upon filter strip width. Switchgrass filter strip removed more TP and phosphate than cool season grass filter strips | Lee et al. [264] |
| Effects of using different vegetation types (mixed grasses, trees, shrubs) and width in buffer filter strip on runoff reduction | NE | Sharpsburg SiCL | M, S, switchgrass, tall fescue, bush honeysuckle, golden currant eastern cottonwood, silver maple | na | CT | na | In-Field vegetative buffers | 76–93% and 55–79% reduction in runoff and total P by buffer strips | Schmitt et al. [265] |
| Reduction in P and N transport by narrow switchgrass hedges following application of manure and inorganic fertilizer under NT and disked till. | IA | Monona SiL | C, switchgrass | 25.8 | NT, DT | 27–101 | In-Field vegetative buffers | In NT, buffer reduced runoff DP, BAP, PP, TP by 47%, 48%, 38%, and 40% than control. In disked, buffer reduced runoff DP, BAP, PP, TP by 21%, 29%, 43%, and 38% than control. | Eghball et al. [266] |
| Effectiveness of multiple species riparian buffers in reducing N and P runoff losses | IA | Coland SiCL, Clarion loam | C, S, switchgrass, woody plant buffer | na | na | na | Riparian buffers | Switchgrass buffer and switchgrass-woody buffer reduced sediment loss by 70% and >92%, respectively. Switchgrass buffer removed TP and phosphate-P by 72% and 44% during 2-hr rainfall simulation at 25 mm/hr and by 46% and 28% during 1-hr rainfall simulation at 69 mm/h. Switchgrass-woody buffer removed TP and phosphate-P by 93% and 85% during 2-hr rainfall simulation at 25 mm/hr and by 81% and 35% during 1-hr rainfall simulation at 69 mm h−1 | Lee et al. [267] |
| Effectiveness of agroforestry, and contour legume-grass filter strips in reducing sediment and nutrient loss from watershed planted with corn-soybean crops. | MO | Putnam SiL, Kilwinning SiL, Armstrong loam | C, S, redtop, brome grass, pin oak, swamp white oak, bur oak | 18–22 | NT | na | In-Field vegetative buffers | Contour strip reduced runoff, erosion, TP by 10%, 19%, and 8%, respectively. Agroforestry reduced runoff and TP by 1% and 17%. | Udawatta [268] |
| Effectiveness of multispecies buffer in reducing sediment, nitrogen, and phosphorus from runoff | IA | Clarion, Coland | Switchgrass, woody buffer, chokecherry cherry, wild plum, red osier dogwood, ninebark | na | na | na | Riparian buffers | Switchgrass buffer removed sediment, total-N, nitrate-N, TP, and phosphate-phosphorus from runoff by 95%, 80%, 62%, 78%, and 58%, respectively. switchgrass/woody buffer removed sediment, total-N, nitrate-N, TP, and phosphate-phosphorus by 97%, 94%, 85%, 91%, and 80%, respectively. | Lee et al. [269] |
| Variability of N, P, and chloride movement and loads in surface runoff in a grass filter strip, a mature riparian forest, and a managed riparian buffer | GA | Alapaha LS, Tifton LS | C, Peanut, millet, bermudagrass, Bahia grass, perennial ryegrass, slash pine, long leaf pine, yellow poplar, swamp black gum | na | CT | na | Riparian buffers | 27% reduction in TKN, 63% reduction in sediment P; on average ~65% reduction in all nutrient load | Lowrance and Sheridan [270] |
| Effectiveness of VBSs on surface runoff water quality | IL | Hosmer SiL | C, S, giant cane, Kentucky bluegrass, orchard grass, bareground | 37 | CT | na | In-Field vegetative buffers | All VBSs reduced total P in runoff by 0.84–1.16 mg L−1 than corn | Singh et al. [108] |
| Purpose | State | Soil Series | Crop | P application | Tillage | STP (mg kg−1 or kg ha−1*) | Study type | Highlights | Reference |
|---|---|---|---|---|---|---|---|---|---|
| Impact of cropping systems with tile drains on nitrate and phosphate content of water | VT | Cabot SiL | P, A, C | na | na | na | Subsurface tile water monitoring | Vertical and lateral movement of P through the soil to subsurface drains was not reported | Benoit [271] |
| Monitoring of nutrient losses in subsurface drainage water | IA | Clarion loam, Webster SiCL | O, C, S | na | na | na | Subsurface tile water monitoring | Annual loss of DP ranged between 0 to 0.04 kg ha−1 | Baker et al. [272] |
| Monitoring of nutrient and sediment losses for 10 yr in deep and shallow tile drainage | OH | SiC | A, O, C, S | na | CT | na | Subsurface tile water monitoring | Average P loss was between 0.8 to 1.2 kg ha−1 | Schwab et al. [273] |
| Land clearing and improved drainage effects on the drainage water quantity and quality | NC | Portsmouth fSL, Wasda muck | C, S | na | na | na | Controlled drainage structures | Annual total P loss in tiles ranged between 0.2 to 7.6 kg ha−1 | Gilliam and Skaggs [274] |
| Monitoring of pesticide, nutrient, and sediment concentrations in subsurface tile drains for 3 yr | IN | Clermont SiL | C | na | CP | na | Subsurface tile water monitoring | Annual loss of DP averaged 0.04 kg ha−1 | Kladivko et al. [275] |
| Evaluation of nutrient loss between conventional and controlled drainage | NC | na | na | na | na | na | Controlled drainage structures | P reduction of 50% by using controlled drainage was reported | Evans et al. [276] |
| P export patterns from tile drains and estimated P output from fields and watersheds | IL | Drummer SiCL | C, S | 42 kg P ha−1 yr−1 | na | na | Subsurface tile water monitoring | Dissolved P export varied between 0.18 to 0.79 kg P ha−1 yr−1 | Xue et al. [277] |
| Measuring loss of N, P, and fecal indicator bacteria in tile drainage and change in STP and STK in fields applied with dairy manure and urea applied fields | MN | Webster CL | C | 36 to 68 kg ha−1 | CT | 30 | Subsurface tile water monitoring | Total P and DP losses were very small and averaged 31 and 10 g ha−1 yr−1 | Randall et al. [278] |
| Tillage and fertilizer source interactions on sediment, N, and P loss from surface and subsurface tile drains | MN | Webster CL | C | 53, 69, and 86 kg ha−1 | MP, ReT | 12 to 26 | Subsurface tile water monitoring | Dissolved P loss in ridge till varied between 12 to 140 g ha−1 whereas for moldboard varied between 0.1 to 4.6 g ha−1 | Zhao et al. [245] |
| Dominant P forms and primary P transport pathways for tile drained watersheds | IL | na | C, S | ~50 kg ha−1 | na | na | Subsurface tile water monitoring | Dissolved P concentrations were highest (1.25 mg L−1) when precipitation event followed widespread application of P fertilizer on frozen soils. | Gentry et al. [117] |
| Evaluation of agricultural management practices for DP losses in subsurface tile flow and surface runoff | IL | Drummer, Flanagan SiCL, Sabina and Xenia SiL | C, S | 44 to 74 kg ha−1 | ReT, NT | na | Subsurface tile water monitoring | Average flow-weighted soluble P concentrations in subsurface flow ranged between 0.09 to 0.19 mg L−1 | Algoazany et al. [60] |
| Evaluated of yield, drain flow, and NP loads through subsurface drainage from free-drainage and controlled drainage | MN | Millington SiL | C, S | 67 and 138 kg ha−1 | na | 17 to 21 1 | Controlled drainage structures | Total P and DP losses were reduced by 50% and 63% with controlled drainage compared to free drainage | Feset et al. [120] |
| Design of P removal structure and its P removal efficiency by monitoring inflow and outflow water. | OK | na | na | na | na | na | Removal structure for P | 54% of P was removed from inflow water and life of stricture was estimated ~17 m | Penn et al. [279] |
| Calculation of P loads from discharge data for 8 yr | OH | Bennington SiL, Pewamo CL | C, S | na | CP, NT | na | Subsurface tile water monitoring | Tile drainage accounted for 47% of the discharge, 48% of the dissolved P, and 40% of the total P exported from the watershed. | King et al. [280] |
| Phosphorus loading via subsurface tile | IN | na | na | na | na | na | Subsurface tile water monitoring | 49% of DP and 48% of total P losses were reported to occur via tile discharge | Smith et al. [281] |
| Differences in DP losses from controlled drainage and free drainage | MO | Putnam SiL | C | 35 and 78 kg ha−1 | VT, TO | 71 to 88* | Controlled drainage structures | Dissolved P loss in tile drain water was reduced by 80% with controlled drainage compared to free drainage | Nash et al. [121] |
| P loss in tile drainage water, movement and accumulation of P in topsoil after long-term application of poultry manure | IA | Nicollet; fine loamy, Canisteo, Harps | C, S | na | na | 20 to 80 | Subsurface tile water monitoring | Average DP concentration in tile drainage ranged between 0.01 and 0.02 mg L−1 | Hoover et al. [282] |
| Subsurface tile P drainage loss in different cropping systems | IA | Webster, Nicollet | C, S, CC | 61 to 94 kg P ha−1 | DT | na | Subsurface tile water monitoring with cover crops | Dissolved P ranged between 0.02 and 0.04 kg ha−1 and were not significantly affected by cropping systems | Daigh et al. [283] |
| Measured Annual Nutrient loads from Agricultural Environments (Manage) database was evaluated for water quality associated with P management strategies | IL | na | na | na | na | na | Subsurface tile P loss review | Generally, less than 2% of applied P was lost in drainage water and no-till significantly increased drainage DP loads compared with conventional tillage | Christianson et al. [118] |
| Effectiveness of winter cover crops in reducing N and total P loading from tile drained agricultural watershed | IL | na | C, S, CR, R | na | na | na | Subsurface tile water monitoring with cover crops | CC significantly reduced n of total P loading in baseflow were reported in watershed planted with cover crops | Bruening [77] |
| Effectiveness of woodchip bioreactors and a P adsorption structure in removing N and DP from subsurface drainage water | SD | na | C, S, W | na | na | na | Bioreactor and P adsorption structure | Dissolved P reduction: 10% to 9% P removal rates: 2.2 to 183.7 g m−3 d−1 | Thapa [135] |
| Purpose | State | Soil Series | Hydraulic Load (mm d−1) | Detention Time | Study Type | Highlights | Reference |
|---|---|---|---|---|---|---|---|
| Annual patterns in hydrology, P circulation, and sediment dynamics | IL | na | na | Wetlands | Reduction in P was 10 times at outflow compared to in flow | Mitsch et al. [284] | |
| Evaluation of a constructed wetland for controlling non-point source pollution | IL | na | 1.4–86 | na | Wetlands | P removal efficiencies ranged from 60% to 100% in summer and from 27% to 100% in winter | Kadlec and Hey [145] |
| Potential of a constructed wetlands receiving tile drain water for removing N and P | IL | Colo SiCL | 17–30 | 22.38 | Wetlands | Total P removed varied from −76 to 8.5 kg ha−1 yr−1 | Kovacic et al. [149] |
| Effectiveness of wetland to reduce N and P from agricultural drainage water | IL | na | na | na | Wetlands | Reduction in DP concentration and load was not significant | Miller et al. [150] |
| Monitoring of water, nutrients, and sediment flux into and out of the wetland | MD | Othello, Mattapex | 12–20 | 12–19 | Wetlands | Total P removed varied between −2.8 to 18 kg ha−1 yr−1 | Jordan et al. [151] |
| Potential of restored forested riparian wetland buffer system for removal of N and P from water | GA | Alapaha LS, Tifton LS | na | na | Wetlands | Retention rates of DP and total P by wetland were 66%. | Vellidis et al. [146] |
| A prairie pothole restored wetland was monitored for P removal | MN | na | na | na | Wetlands | Total P removed varied from 1 to 3 kg ha−1 yr−1 | Magner et al. [285] |
| Comparison of annual loading and removal of P by a wetland receiving urban water and a wetland receiving rural water | WA | na | 620–720 | 3.3–20 | Wetlands | Total P removed varied from 4.4 to 30 kg ha−1 yr−1 | Reinelt and Horner [286] |
| Mitigation capacity of agricultural drainage ditches by measuring DP and total P | MS | Chenneby SiL | na | na | Drainage diches | Average P removed was 1.43 kg ha−1 yr−1 | Kröger et al. [287] |
| Comparison of a vegetated versus non-vegetated agricultural drainage ditch in reducing nutrient concentrations and loads | MS | Sharkey, Dundee | na | na | Drainage diches | No reduction in DP however 36–71% reduction in inorganic P was reported | Moore et al. [288] |
© 2020 by the authors. Licensee MDPI, Basel, Switzerland. This article is an open access article distributed under the terms and conditions of the Creative Commons Attribution (CC BY) license (http://creativecommons.org/licenses/by/4.0/).
Share and Cite
Singh, G.; Kaur, G.; Williard, K.; Schoonover, J.; Nelson, K.A. Managing Phosphorus Loss from Agroecosystems of the Midwestern United States: A Review. Agronomy 2020, 10, 561. https://doi.org/10.3390/agronomy10040561
Singh G, Kaur G, Williard K, Schoonover J, Nelson KA. Managing Phosphorus Loss from Agroecosystems of the Midwestern United States: A Review. Agronomy. 2020; 10(4):561. https://doi.org/10.3390/agronomy10040561
Chicago/Turabian StyleSingh, Gurbir, Gurpreet Kaur, Karl Williard, Jon Schoonover, and Kelly A. Nelson. 2020. "Managing Phosphorus Loss from Agroecosystems of the Midwestern United States: A Review" Agronomy 10, no. 4: 561. https://doi.org/10.3390/agronomy10040561
APA StyleSingh, G., Kaur, G., Williard, K., Schoonover, J., & Nelson, K. A. (2020). Managing Phosphorus Loss from Agroecosystems of the Midwestern United States: A Review. Agronomy, 10(4), 561. https://doi.org/10.3390/agronomy10040561