Article

Soybean Seed Vigor: Uniformity and Growth as Key Factors to Improve Yield

by
Luciano Antônio Ebone
,
Andréia Caverzan
,
Alberto Tagliari
,
José Luís Trevizan Chiomento
,
Diógenes Cecchin Silveira
and
Geraldo Chavarria
*
Agronomy Post Graduate Program, University of Passo Fundo, Passo Fundo 99052-900, Rio Grande do Sul, Brazil
*
Author to whom correspondence should be addressed.
Agronomy 2020, 10(4), 545; https://doi.org/10.3390/agronomy10040545
Submission received: 22 March 2020 / Revised: 6 April 2020 / Accepted: 7 April 2020 / Published: 10 April 2020

Abstract

:
Emergence uniformity and the time required for emergence are essential factors for obtaining highly productive potential in plants. Factors such as sowing depth and soil moisture affect uniformity and emergence, but little is known about the impacts of seed vigor. Thus, we determined the impacts of seed vigor on uniformity and growth as well as development and yield in soybean (Glycine max [L.] Merrill) plants. The treatments consisted of four vigor levels (89%, 57%, 47%, and 43%) obtained by accelerated aging, in a randomized block design, with five replicates at three sites. Seeds with the highest vigor level showed higher uniformity and faster emergence. Dominated plants through their phenotypic plasticity modify stem diameter and internode length. The plants that emerged earlier had a larger leaf area in the three stages (V1, V4, and R2), allowing them to accumulate more photoassimilates in the initial stages. Consequently, these plants exhibited an increase in yield components, especially in the number of fertile nodes and the number of pods per plant, making them more productive.

Graphical Abstract

1. Introduction

The importance of soybean (Glycine max [L.] Merrill) is undoubted given its role as a major source of protein in food-producing animals and its increasing significance in human consumption [1]. Recently, these considerations, along with changes to human diets (especially in developing countries), have increased the demand for this product. In order to increase the soybean supply to meet this demand, a larger area of land must be cultivated, leading to deforestation in the tropical forests of South America [2].
Such an environmental liability makes it necessary for researchers to develop strategies to fill the narrowing yield gap; through an improvement in yield, the pressure to open new fields for cultivation would be reduced. In this sense, the use of better-quality seeds would be an efficient way to address the challenge of increased food demand [3,4].
Like all products, seeds are also subject to quality standards for their commercialization, with purity (physical quality) and germination (biological quality) being the main standards [4]. However, germination data cannot be extrapolated to the field; this is mainly because germination tests assume ideal conditions, which is contrary to the sub-optimal conditions actually present in the field [5]. Therefore, biological quality should also be measured by another concept, namely vigor, which can be more assertive in the measurement of germination rate, uniformity, and growth [6].
Among the various vigor tests, the mean germination test evaluates the speed of emergence [5]. There are differences among seed lots with different vigor levels in terms of the time required for germination [7]. However, despite being well corroborated in the laboratory, information about how seed lots would behave in the field is scarce. Thus, two questions emerge: whether lots with different vigor levels produce distinct flows of emergence, and whether such a distinct flow of emergence generates unequal growth by distinct days of emergence, thus interfering in the yield.
Unequal plant growth results in yield losses [8]; this is true even for the soybean, despite its capability to compensate [9]. Specifically, in contrast to the historical expectation that soybeans compensate for their non-uniformity, new research has proven that this is not the case [9]. Non-uniformity in the field could be created by the day of emergence of plants in the field [10]. Thus, we asked: what are the differences in the growth of plants with distinct days of emergence in the field, and which aspects of plant growth and reproductivity will be impacted?
The hypothesis that forms the basis this work is that in soybean, the non-uniformity generated by the reduction of seed vigor creates distinguishing developments in the plants on the field, enhancing intraspecific competition, leading to a lower efficiency in the use of the resources by the plants (light), causing a reduction of yield. Here, we investigated if soybean seed vigor influences plant emergence speed, flow uniformity emergence, and yield. Moreover, we investigated how the day of emergence of each plant impacted development, nodulation, and reproductivity characteristics.

2. Materials and Methods

2.1. Plant Material

In this study, we worked with soybean seeds from the DM 5958 RSF IPRO cultivar. This cultivar has a maturity group of 5.8, a medium size, and indeterminate habit of growth. The experiment was conducted in the Brazilian subtropic, in the state of Rio Grande do Sul (RS).

2.2. Experimental Design

The treatments, outlined in a bifactorial scheme, consisted of four vigor levels (89%, 57%, 47%, and 43%) of soybean seeds of the DM 5958 RSF IPRO cultivar, and three sites: (I) the municipality of Coxilha (28°07′ S, 52°17′ W; 721 m above sea level); (II) the municipality of Passo Fundo (28°13′27″ S, 52°23′18″ W; altitude, 696 m); and (III) Passo Fundo (28°13′40″ S, 52°23′32″ W; altitude, 701 m).
Initially, to test the physiological quality of the seeds, accelerated aging vigor tests [11] and germination tests [12] were performed. Germination was determined with four samples of 100 seeds each put in wrapped wet germination paper, which were placed in a Mangelsdorf-type germination chamber and maintained at 25 °C for seven days, being the number of normal seedlings read at the end of this period [12]. For the vigor test, seeds were exposed at 42 °C for two days, and then the germination procedure was followed [11].
The seed lot presented 92% of germination and 89% vigor. To obtain different vigor levels, the seeds were exposed to 32 °C heat and 95% humidity for 0, 120, 192, and 216 h [13], thus obtaining vigor levels of 89% (92% of germination), 57% (87% of germination), 47% (83% of germination), and 43% (81% of germination), respectively. It is noteworthy that in this study, we used only seeds with a germinative potential above 80%. In this study, 89% was considered a high vigor level; 57%, a medium vigor level; 47%, a low vigor level; and 43%, a very low vigor level.
A randomized block experimental design was used with five replications, resulting in a total of 20 experimental units per site. The plots were 7 m long and consisted of 14 rows with 0.45-m spacing. The seedling rate was adjusted in each vigor to achieve 220,000 plants·ha−1; the adjustment was based on the emergence of seeds in previous sowings in the sites, resulting in a sowing rate of 13 seeds·m−1 for 89% of vigor, 14 seeds·m−1 for 57% of vigor, and 16 seeds·m−1 for 47% and 43% of vigor.
Additionally, the date of emergence of the plants in the field was used to establish another factor, ranging from five to 14 days. For these data, we used a completely randomized design, with 200 repetitions in each of the places. We took this measure because we assumed that the day of plant emergence would be a determinant for the results of the variables related to plant development and productivity, supporting the hypothesis that the vigor level decreases the emergence time and that the shorter emergence time is reflected in the most productive plants.

2.3. Procedure

The experiment was performed in a no-tillage system with oat (Avena strigosa Schreb) as the previous crop at the three sites; all sites are located in a humid, subtropical climate region with humic dystrophic Red Latosol; soil chemistry properties (Supplementary Table S1) and water soil content (Supplementary Figure S1) had distinct properties at each site. Sowing was accompanied by fertilization with 6 kg·ha−1 N, 69 kg·ha−1 P2O5, and 69 kg·ha−1 K2O. Seeds were inoculated with Bradyrhizobium japonicum (250 mL of inoculant with 7 × 10⁹ CFU/mL for 100 kg of seeds) and treated with insecticide (50 g of Fipronil for 100 kg of seeds) and fungicides (5 g of Piraclostrobin and 45 g of thiophanate-methyl for 100 kg of seeds), according to recommendations for soybean crops. Site I was sown on November 20, and sites II and III were sown on November 21 (Figure 1). Phytosanitary management was made to preventively control diseases, pests, and weeds equally at all sites.

2.3.1. Emergence Speed, Plant Stand, and Uniformity Index

To measure emergence speed, 6.75 m of sowing row was marked. These 6.75 m were marked in five different lines of 1.35 m, being three lines of 1.35 m marked along the third row and two lines in the twelfth sowing row in each plot, where the spacing between lines marked in the same row was 0.40 m (Supplementary Figure S2). For the plants within these lines, we daily marked the emergence in days after sowing (EDAS) for 15 days. The emergence values of each plot were the means of the emergences of each of the five lines. The plant stand was measured in each plot by counting 6.75 m of the sowing row at 20 days after sowing.
The uniformity index was established by the sum of the percentage of plants emerged on the emergence peak day, plus the day before and after the emergence peak. The uniformity index (Equation (1)) was calculated in each plot by the average uniformity index of all the plants that emerged in five lines of 1.35 m:
Uniformity   index = NPEP + NPEBP + NPEAP Total   number   of   emerged   plants   ×   100
where NPEP is the number of plants, which emerge in the day with higher plant emergence; NPEBP is the number of plants, which emerge in the day before NPEP; and NPEAP is the number of plants, which emerge in the day after NPEP.

2.3.2. Plant Growth and Development

For the destructive evaluations, 10 plants in one of the marked emergence (EDAS) lines (see Section 2.3.1 and Supplementary Figure S2) were collected from each of the 60 plots. The area of the first trifoliate leaf was measured at stage V2 (stage 12 102 in the Biologische Bundesanstalt, Bundessortenamt, und Chemische Industrie (BBCH) scale) [14], and the leaf area was determined at stages V4 (stage 14 104 in BBCH scale) and R2 (stage 65 605 in BBCH scale). All analyses were performed destructively using a leaf area meter (LI-3100C, LI-COR Biosciences, Lincoln, Nebraska).
Dry root and shoot masses were measured at stage V4 [14]. For this, the plants were divided into shoots and roots and placed in a drying oven (60 °C) until reaching constant mass. After drying, the dry masses of roots and shoots were determined per plant (g·plant−1). Plant height was measured in V4 and R8 from the soil surface to the apical meristem of the main stem. The diameter of the stem was measured at ground level with the use of a caliper in R2 [14].

2.3.3. Nodulation

Nodulation was evaluated destructively in 10 plants from lines with day of emergence marked (EDAS) (see Section 2.3.1 and Supplementary Figure S2) per plot sequentially along the sowing row by counting the number of nodules at stage V4. The nodules were oven-dried at 60 °C until reaching constant mass [14]; after drying, the nodule dry mass per plant was determined (g·plant−1).

2.3.4. Grain Yield Components

The yield components were evaluated for each plant based in the EDAS in the R8 stage (stage 99 909 in the BBCH scale). The total number of nodes as well as the number of fertile nodes, pods on the main stem, and seeds on the whole plant (main stem plus branches) were determined [13]. Average node length was determined by the division of the plant height by the total number of nodes. Harvesting was made in the three central rows and the five central meters of each plot, using a plot harvester (WINTERSTEIGER Classic, AT). The samples were weighed and corrected for 13% moisture, and the grain yield (kg·ha−1) and thousand-seed weight (TSW) were defined.

2.4. Statistical Analysis

The data (seedling emergence, plant stand, uniformity index, and yield) were subjected to analysis of variance as a randomized block design with two factors (vigor levels versus sites), comprised of four vigor levels with five repetitions in three sites, in a total of 60 experimental units. The means were compared with a Tukey test at 0.05 error probability.
The other variables were subjected to analysis of variance as a completely randomized design with EDAS as the only factor, with each of the 200 plants analyzed at each site as an experimental unit. The means were compared with a Tukey test at 0.05 error probability.

3. Results

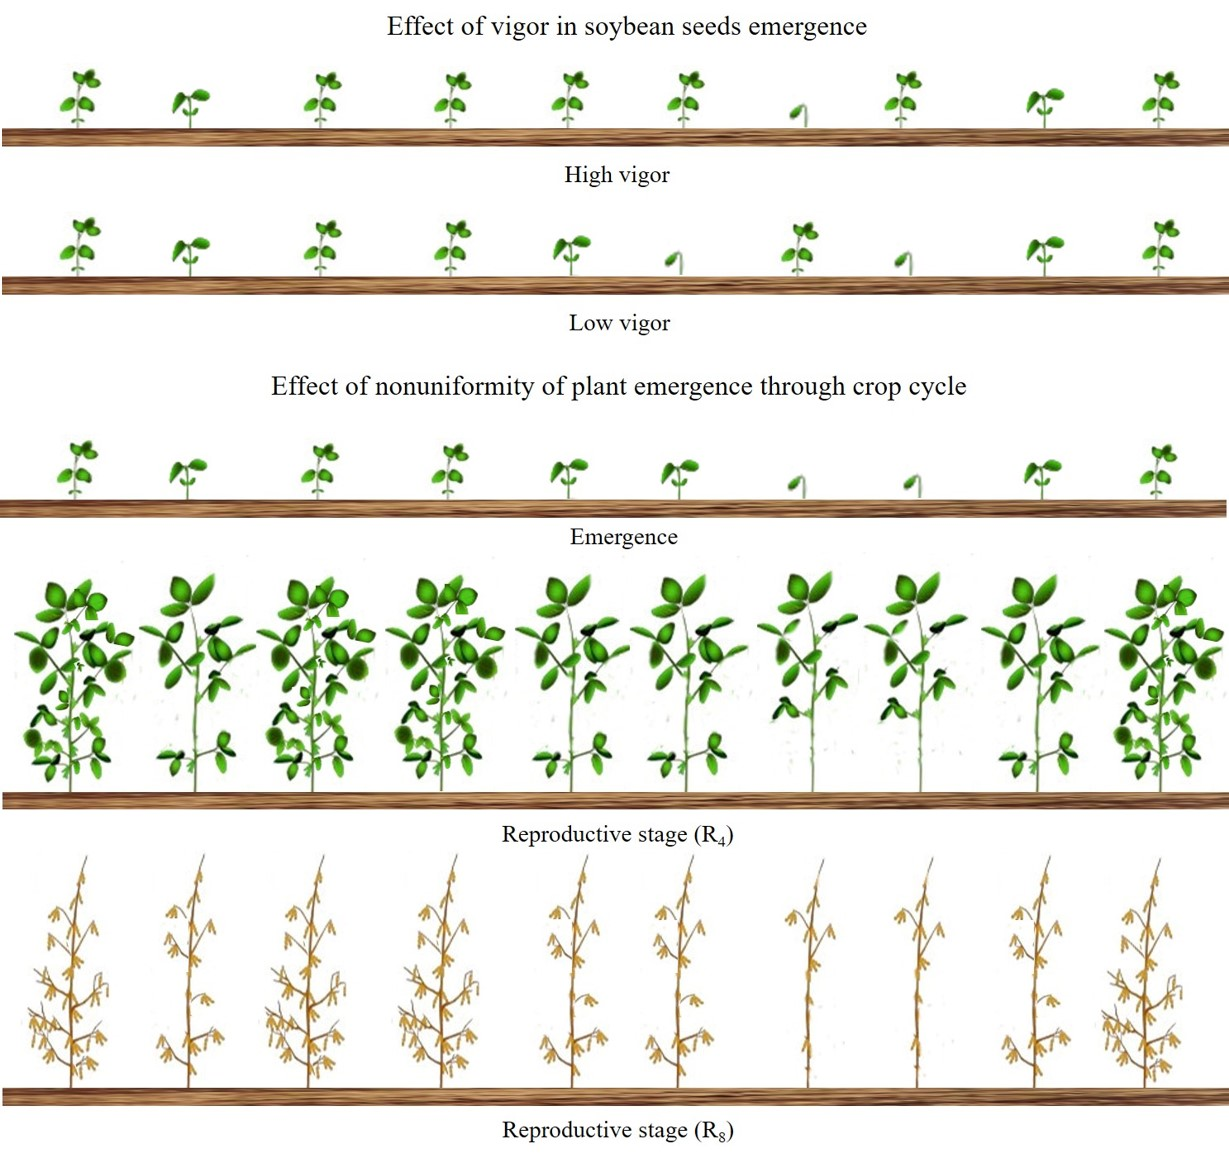
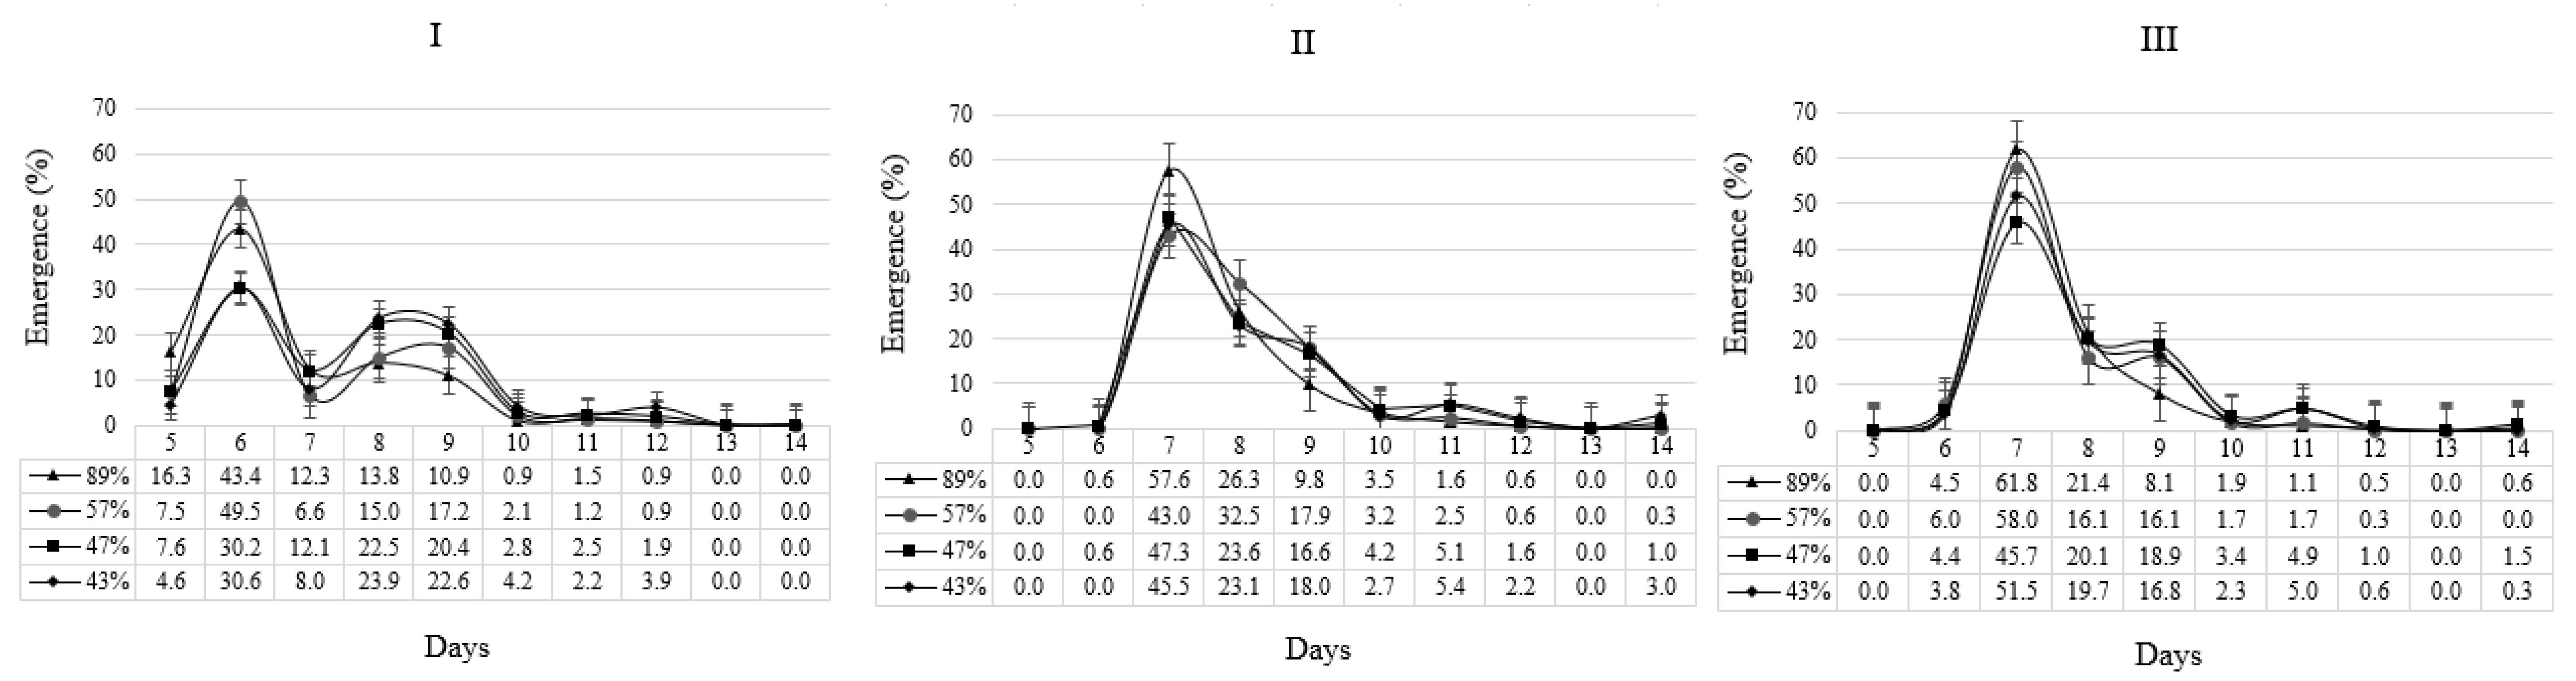
3.1. Seedling Emergence, Plant Stand, and Uniformity

The differences between the average time of emergence of the highest (89%) and the lowest vigor levels (43%) were found on day 1 for site I, and from 0.5 days for sites II and III (Table 1). We observed no significant differences in plant stands among the sites and treatments, with the treatments showing plant stands between 222.768 and 226.060 plants·ha−1.
The uniformity index reduced as the vigor reduced, showing that the decrease in vigor enhanced variability among the plants in the field. There were differences among the sites, with site I being distinct from sites II and III. This was due to the distinct flows of emergence (Figure 2), where site I had beyond its peak a small peak in day 8, causing the low uniformity index.

3.2. Soybean Growth and Development

The leaf area of the first trifoliate leaf (V1 stage) showed that the plants that emerged earlier had a larger leaf area (Table 2). When comparing plants that emerged within six days with those that emerged within eight days, there was a percentage difference of 11% for site I, 37% for site II, and 21% for site III. The differences between the plants of six and eight EDAS at the V4 stage were 18% for site I and 29% for site III (site II percentage differences for plants with six EDAS at stage V4 were not determined due to the absence of an evaluation of these plants). For stage R2, this difference was 2, 36, and 18% for locations I, II, and III, respectively.

3.3. Nodulation

There was no clear relationship between these factors when assessing nodule dry mass (Table 2). Sites II and III showed a decreasing pattern with increasing EDAS values, although at site I, the response to the EDAS increase was random. A similar effect was observed for nodule number, where only site II showed a response pattern.

3.4. Shoot, Root, and Stem

The dry mass of shoot and root in V4 (Table 3) showed a reduction when the EDAS was increased. The weighted average of the dry mass of shoot (Table 3) and the percentage of plant emergence (Figure 2) multiplied by 220,000 (plant population per hectare) resulted in a biomass accumulation of 1633.32 kg·ha−1 in the vigor of 89% and 1447.21 kg·ha−1 in the vigor of 43% at site I. Therefore, due to the difference of emergence caused by the distinct vigor, we saw a reduction of 11.4% of the total dry mass accumulate in the V4 stage. Upon analysis, site III had the smallest difference of biomass accumulation of 1370.07 kg·ha−1 in the vigor of 89% and 1301.62 kg·ha−1 in the vigor of 43%, meaning a decrease of 5% of the biomass. We did not estimate the biomass of site II due to the absence of an evaluation of plants with six and 12 EDAS in the V4 stage.
The ratio of dry mass of shoot by total dry mass remained stable despite the differences of EDAS, with about 80% for shoot and 20% for roots (Table 3). The diameter of the stem in the R2 stage showed an inverse proportional response to EDAS (Table 4). When comparing EDAS, we could see a reduction of 5, 12, and 11% (in sites I, II, and III, respectively) in the diameter of plants emerging within six days from plants emerging within eight days.
The shoot length was not very responsive for EDAS in stage V4 (Table 3), as only the plants with a much higher EDAS (11, 12, and 14) showed a minor decrease in shoot length when compared with earlier emerging plants. This result remains when analyzing shoot length in R2 (Table 4), where, with a few exceptions, even late emerging plants showed the same shoot length as that of earlier emerging plants. However, the number of nodes of plants decreased as the EDAS increased, resulting in an increase of the average length of internodes.

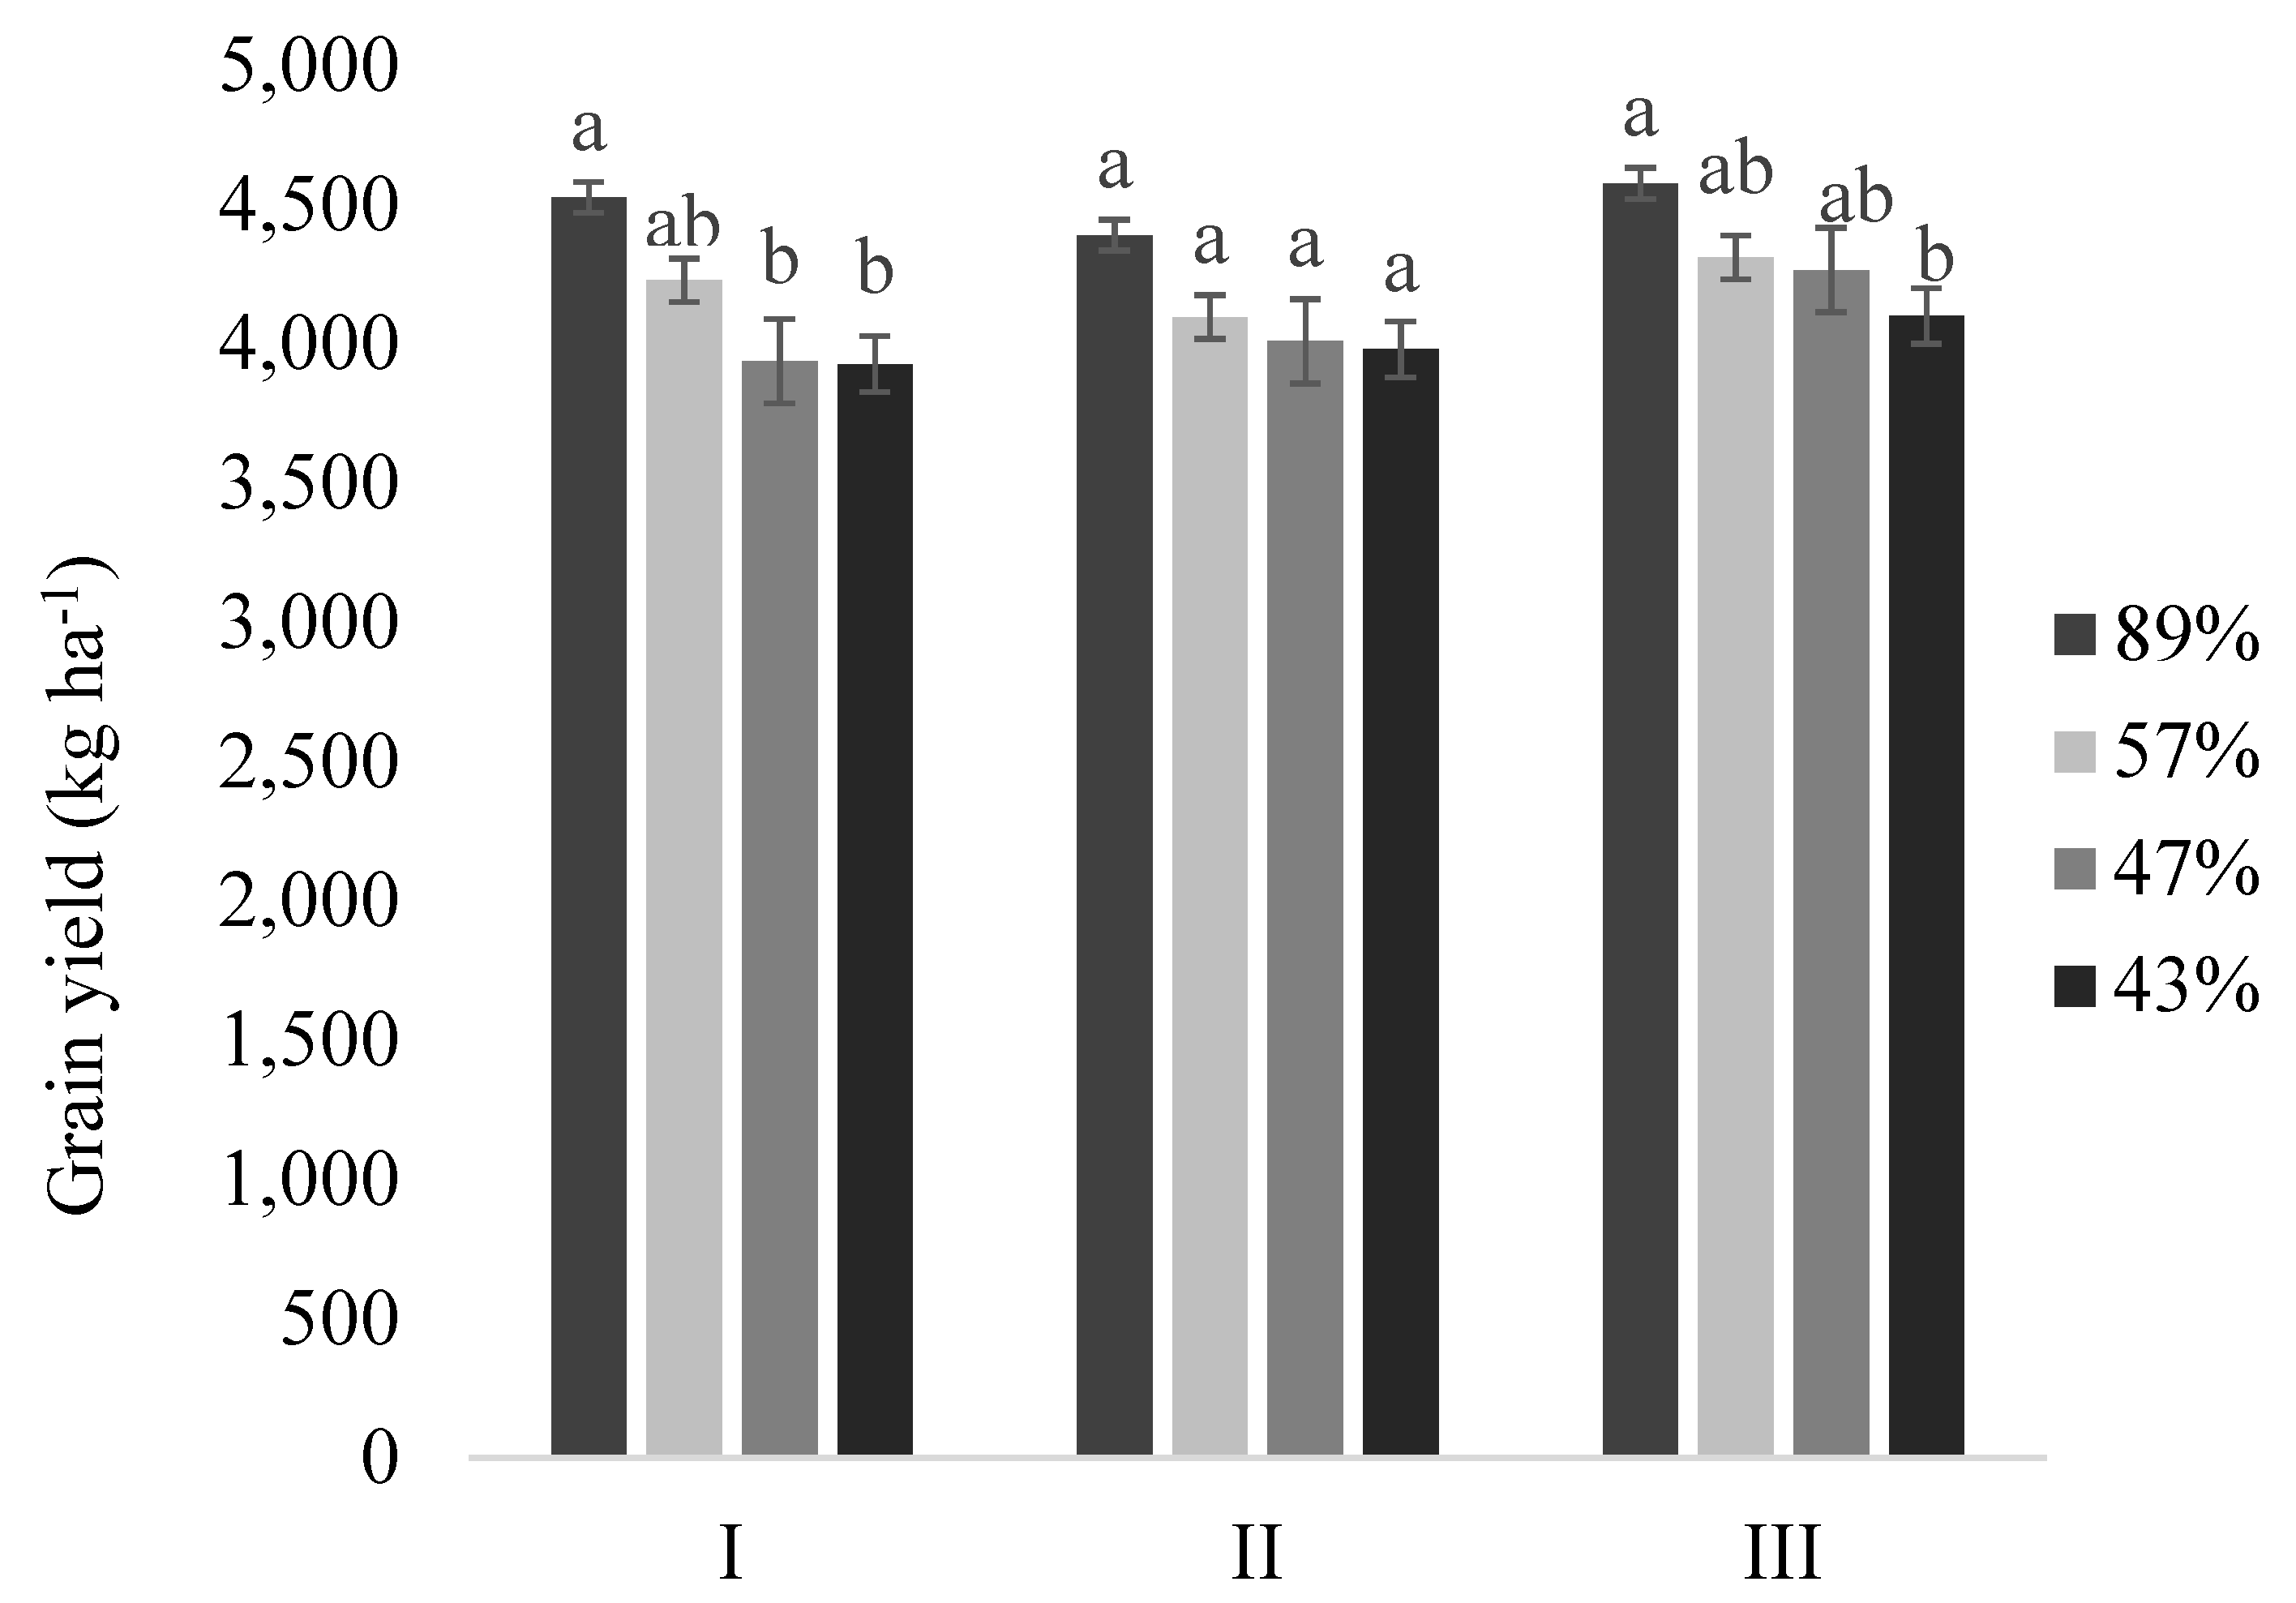
3.5. Yield Components

The yield components were affected by the EDAS in terms of the number of fertile nodes (Table 4), number of pods, number of grains, and grain mass (Table 5). However, the number of grains per plant and grain mass were only a result of the distinct number of pods, once the grains for pods was around 2.40 to 2.55 for all of the EDAS; in addition, the thousand-seed weight did not show a cohesive response to the EDAS, with only some late emerging plants showing an increase in this variable.
When analyzing grain mass, EDAS can be divided into three groups: rapid, with EDAS values between 5 and 7; medium, with values of 8 and 9; or slow, with EDAS values of 10 and more. The rapid group had a grain mass (Table 5) of 29.4, 26.8, and 28.5 g·plant−1; the medium group had a grain mass of 23.3 (20% less than in the rapid group), 21.9 (−18%), and 22.1 (−22%) g·plant−1; and the slow group had a grain mass of 13.3 (−55% less than the rapid group), 17.0 (−37%), and 14.4 (−49%) g·plant−1 at sites I, II, and III, respectively.
The final yield (Figure 3) showed that growth and uniformity variations in seedlings with different vigor levels need to be considered. In the present study, the differences between the vigors of 43% and 89% were 599 (+15.2%), 410 (+10.3%), and 476 (+10.4%) kg·ha−1 for sites I, II, and III, respectively.

4. Discussion

Our results showed that soybean seed vigor interfered with the time required for seedling emergence. In addition, we observed that the emergence date was a determining factor in the development of soybean plants throughout the cycle. Thus, crops from seeds with low vigor levels are less productive because they have higher percentages of late emergence plants. These plants have lower yield per plant because they presented a smaller number of pods due to the lower accumulation of photoassimilates and the smaller leaf area.
The same situation observed in the laboratory was found in the field when the emergence speed was analyzed, as seeds with a higher vigor level produced a quick emergence [7]. Nevertheless, the differences among the values in the sites showed that the magnitude of the dates were impacted by the environment and that better condition allowed for more distinction in emergence speed: once at site I, where seeds started to emerge at 5 EDAS, we had a higher difference among the speeds of plant emergence.
The greater uniformity established by the uniformity index of the lots with higher vigor levels was already expected; although the environmental conditions interfered with the magnitude of the uniformity data, the lots with greater vigor presented a higher uniformity over a wide range of environmental conditions (Figure 4) [5,15,16]. Again, the best conditions that allowed for quick emergence provided more distinction of the uniformity caused by seed quality, as was found at site I.
Thinking in terms of uniformity is necessary because it is a quality parameter of a crop [8] as the crop is a community of plants that influence each other via intraspecific competition [17]. The uniformity of plant emergence reduces this competition, enabling a better use of available resources.
Nonuniformity in seedling emergence generates dominant and dominated plants in the crops, with substantial differences in leaf area and number of nodes [18]. These differences could be mediated by a decrease in the red–far red (R:FR) ratio, impinging on the dominated plants [19]. However, it is important to note that even under non-restrictive conditions such a change in light quality, reduced biomass, increased internodes, and reduced branching in soybean can be observed, albeit without any effects on the harvest index [19].
Some studies have found that the effects of seed vigor would only be relevant in the early stages of the crop [20,21]. However, in this study, the variable leaf area in the V1, V4, and R2 stages maintained the differences observed due to the different EDAS values, so the effects did not dissipate.
Maintenance of the differences in terms of leaf area can be explained by the greater leaf area since the initial stages (V1) of the crop result in greater ground coverage and resource use [13,22]. Thus, the plant is provided with more carbohydrates for development and a growth cycle is initiated in which the larger leaf area provides more carbohydrates and, subsequently, more energy for a positive cycle of plant development [23].
Due to the greater leaf area and carbon assimilation obtained by the dry shoot mass in the V4 stage in plants with lower EDAS, it was expected that the results for the dry mass of nodules and number of nodules would point in the same direction. Since the increased availability of carbohydrates would provide more sugars for nitrogen-fixing bacteria, this would promote an increase in nodule number and dry mass [24].
However, this does not occur. The fact that this variable presents high unevenness among plants may be the core of this problem. To mitigate such problems, it is recommended that evaluations of these variables be made at later stages of the culture, when the nodules are larger and the variations tend to decrease. Moreover, a previous study states that carbohydrate partition between shoot and roots is responsible for modulating the development of nodules [25], showing that the mere increase in dry shoot mass or the larger leaf area is not, in isolation, a good parameter for inferences with nodulation.
It was expected that with increasing EDAS values, the root dry mass would decrease more significantly than the shoot dry mass. In soybean plants, the embryonic axis is highly susceptible to deterioration because the radicle of the embryonic axis is in close contact with the end of the funicle and ensures the interaction with the environment, resulting in enhanced lipid peroxidation [26,27].
Thus, plants with high EDAS values must be more deteriorated, and the radicle must be the structure more affected. However, this does not occur, the differences are generally small, and the partition of dry mass between roots and aerial parts tends to remain stable, independent of the EDAS value. The distribution of carbohydrates, despite being affected by a number of factors (nutrients, water potential, luminosity, temperature, and CO2 concentration), tends to maintain a proportion that favors the balance of shoot and root activities [28].
The shoot length results (Table 3) support differences in the initial developmental capacity of plants with different EDAS values. In this sense, the larger leaf area provides more resources for faster development [29]. The capacity of the phenotypic plasticity of plants undergoing competition will only be able to match plant height at more advanced stages of development [19].
The reduction of stem diameter with increasing EDAS values is one of the phenotypic responses of soybean plants to shading because, when exposed to low photosynthetically active conditions and low R:FR ratios, plants respond by decreasing stem diameter and increasing stem length [30].
Shoot length at the R8 stage was more uniform among the different EDAS values than at the V4 stage (Table 3 and Table 4), which is a result of etiolation, in which the changes in light quality stimulate an increase in the average internode length [19]. The increase in the mean length of the internodes led to a reduction in the number of total nodes (Table 4). However, the number of fertile nodes presented a greater relevance, since, in addition to the effects of etiolation, this variable is still impacted by the plant’s ability to flower adhesion in the formation of a fertile node [31]. The maintenance of a reproductive node depends on two characteristics: the amount of photoassimilates and the distribution of flowering [32]. The differences in fertile nodes can partly be attributed to the larger leaf area of the plants with lower EDAS values, providing a greater amount of photoassimilates and thus reducing the abscission of flowers and pods.
At the end of the cycle at stage R8, the main yield components affected by delays in EDAS were pod and grain number, which decreased (Table 5). Reductions in grain number are generally observed when intraspecific competition occurs at the field level [10]. Two hypotheses can be constructed about this phenomenon. The first is that plants with lower EDAS values have greater flowering and fruiting periods by altering intra-nodal pod interactions, similar to the effects that occur when the photoperiod increases, generating more pods [33]. Another hypothesis is that the greater accumulation of photoassimilates leads to greater fruiting [34]. The number of grains per pod is a characteristic with high uniformity and is not impacted by EDAS (Table 5), since it does not respond to intraspecific competition [35]. The absence of significant variations in the number of grains per pod implies that the number of grains per plant only corroborates the differences caused by the EDAS in the number of pods per plant.
The differences in yield among the distinct groups are a result of the higher trifoliate leaf (Table 2) area of the rapid group, allowing the plants to use more resources (light) for their development [13,22]. This difference generates a higher growth [29] and dry mass accumulation in the V4 stage (Table 2 and Table 3) for the rapid plants [10], making them more competitive for light. These plants therefore do not need to increase their average internode length [30] and have a higher number of total nodes and a higher pod number [34], which explains the differences in grain mass (Figure 5).
However, when comparing these results with the results of studies without any adjustment of the plant population, vigor variations from 48% to 90% generated greater productivity differences of 1180; 1376; and 1307 kg·ha−1 for different locations [13]. Thus, it is suggested that adjusting the sowing rate slows down some of the effects of vigor, but does not eliminate them, since in addition to the final plant stand, uniformity and growth will also reverberate in the final yield.
The differences in yield were due to the higher photosynthetic activity in the initial stages, where shading by the crop was still low, and thus the larger leaf area at these times allowed for a greater assimilation of carbon [23]. Consequently, fertile node number and pod number were higher [34], resulting in increased yield.

5. Conclusions

In this work, we showed that the vigor of soybean seeds impacts the time required for seedling emergence that is, a higher vigor level leads to a faster emergence. In addition, we have shown that the emergence date is a determining factor in the development of soybean plants throughout their growth cycle, as faster emergent plants have higher leaf area indexes from the early stages (V1) to the reproductive stages (R2).
Late emergence plants, through their phenotypic plasticity, adapt to intraspecific competition. By reducing the stem diameter and increasing the average internode length, these late plants are equal in height to early emergence plants. However, despite their phenotypic plasticity, late emergence plants have lower dry grain mass due to the reduction in the number of fertile nodes and the number of pods per plant. Thus, crops from seeds with low vigor levels are less productive because they have higher percentages of late emergence plants, which have a lower yield per plant.

Supplementary Materials

The following are available online at https://www.mdpi.com/2073-4395/10/4/545/s1, Figure S1: Water soil content. Volume moisture (m3/m3) at Field Capacity (Vm FC) and Permanent Wilting Point (Vm PWP) in different soil depth (0.00–0.20 m) at three sites (I, II and III), Figure S2: Plot design. Schematic representation of each plot (7m × 14 rows), with 2 rows and 1 m of each side as borders control to plants with emergence days after sowing (EDAS) evaluated in the five rows of 1.35 m located in the third and twelfth sowing row. Table S1: Chemical analysis of the soils of the three sites (I, II and III).

Author Contributions

Conceptualization, L.A.E.; Data curation, L.A.E., A.C., and A.T.; Formal analysis, D.C.S.; Funding acquisition, G.C.; Investigation, L.A.E. and A.C.; Project administration, A.C. and G.C.; Supervision, L.A.E., G.C.; Visualization, L.A.E.; Writing—original draft, L.A.E.; Writing—review & editing, A.C., J.L.T.C., and G.C. All authors have read and agreed to the published version of the manuscript.

Funding

This work was supported by Sementes Butiá; Associação dos Produtores e Comerciantes de Sementes e Mudas do Rio Grande do Sul (APASSUL); and Coordenação de Aperfeiçoamento de Pessoal de Nível Superior (CAPES).

Conflicts of Interest

The authors declare no conflicts of interest.

References

  1. Friedman, M.; Brandon, D.L. Nutritional and health benefits of soy proteins. J. Agric Food Chem. 2001, 49, 1069–1086. [Google Scholar] [CrossRef] [PubMed]
  2. Grau, R.; Gasparri, N.I.; Aide, T.M. Agriculture expansion and deforestation in seasonally dry forests of north-west Argentina. Environ. Conserv. 2005, 32, 140–148. [Google Scholar] [CrossRef]
  3. Ebone, L.A.; Caverzan, A.; Chavarria, G. Physiologic alterations in orthodox seeds due to deterioration processes. Plant Physiol. Biochem. 2019, 145, 34–42. [Google Scholar] [CrossRef] [PubMed]
  4. Wimalasekera, R. Role of Seed Quality in Improving Crop Yields. In Production and Global Environmental Issues; Hakeem, K., Ed.; Springer: Berlin, Germany, 2015; pp. 153–168. [Google Scholar]
  5. Finch-Savage, W.E.; Bassel, G.W. Seed vigour and crop establishment: Extending performance beyond adaptation. J. Exp. Bot. 2016, 67, 567–591. [Google Scholar] [CrossRef] [Green Version]
  6. Zhang, H.; Wang, W.Q.; Liu, S.J.; Moller, I.M.; Song, S.Q. Proteome analysis of poplar seed vigor. PLoS ONE 2015, 10, e0132509. [Google Scholar] [CrossRef] [Green Version]
  7. Matthews, S.; Khajeh, H.M. Mean germination time as an indicator of emergence performance in soil of seed lots of maize (Zea mays). Seed Sci Technol. 2006, 24, 339–347. [Google Scholar] [CrossRef]
  8. Tao, L.; Rui, L.; Xiuliang, J.; Jinfeng, D.; Xinkai, Z.; Chengming, S.; Guo, W. Evaluation of seed emergence uniformity of mechanically sown wheat with UAV RGB imagery. Remote Sens. 2017, 9, 1241. [Google Scholar] [CrossRef] [Green Version]
  9. Masino, A.; Rugeroni, P.; Borrás, L.; Rotundo, J.L. Spatial and temporal plant-to-plant variability effects on soybean yield. Eur. J. Agron. 2018, 98, 14–24. [Google Scholar] [CrossRef]
  10. Pinthus, M.J.; Kimel, U. Speed of germination as a criterion of seed vigor in soybeans. Crop Sci. 1979, 19, 291–292. [Google Scholar] [CrossRef]
  11. Krzyzanowski, F.C.; Vieira, R.D.; França-Neto, J.B. Vigor de Sementes: Conceitos e Testes, 1st ed.; Associação Brasileira de Tecnologia de Sementes-ABRATES: Londrina, Brazil, 1999. [Google Scholar]
  12. Brasil—Ministério da Agricultura, Pecuária e Abastecimento. Regras Para Análise de Sementes, 1st ed.; Ministério da Agricultura, Pecuária e Abastecimento, Secretária de Defesa Agropecuária: Brasília, Brazil, 2009; pp. 147–220.
  13. Caverzan, A.; Giacomin, R.; Müller, M.; Biazus, C.; Lângaro, N.C.; Chavarria, G.L. How does seed vigor affect soybean yield components? Agron J. 2018, 110, 1318–1327. [Google Scholar] [CrossRef]
  14. Fehr, W.R.; Caviness, C.E. Stages of Soybean Development; Spec. Rep. 80; Iowa State University of Science and Technology: Ames, IA, USA, 1977; pp. 2–11. [Google Scholar]
  15. Egli, D.B.; Rucker, M. Seed vigor and the uniformity of emergence of corn seedlings. Crop Sci. 2012, 52, 2774–2782. [Google Scholar] [CrossRef]
  16. Marcos-Filho, J. Seed vigor testing: An overview of the past, present and future perspective. Sci. Agri. 2015, 72, 363–374. [Google Scholar] [CrossRef] [Green Version]
  17. Park, S.E.; Benjamin, L.R.; Watkinson, A.R. The theory and application of plant competition models: An agronomic perspective. Ann Bot. 2003, 92, 741–748. [Google Scholar] [CrossRef] [PubMed] [Green Version]
  18. Higley, L.G.; Pedigo, L.P. Soybean growth responses and intraspecific competition from simulated seed corn maggot injury. Agron J. 1990, 82, 1057–1063. [Google Scholar] [CrossRef]
  19. Green-Tracewicz, E.; Page, E.R.; Swanton, C.J. Shade avoidance in soybean reduces branching and increases plant-to-plant variability in biomass and yield per plant. Weed Sci. 2011, 59, 43–49. [Google Scholar] [CrossRef]
  20. Adegbuyi, E.; Burris, J.S. Field criteria used in determining the vigor of seed corn (Zea mays L.) as influenced by drying injury. J. Agron Crop. Sci. 1988, 161, 171–177. [Google Scholar] [CrossRef]
  21. TeKrony, D.M.; Egli, D.B. Relationship of seed vigor to crop yield: A review. Crop Sci. 1991, 31, 816–822. [Google Scholar] [CrossRef]
  22. Müller, M.; Rakocevic, M.; Caverzan, A.; Chavarria, G. Grain yield differences of soybean cultivars due to solar radiation interception. Am. J. Plant Sci. 2017, 8, 2795–2810. [Google Scholar] [CrossRef] [Green Version]
  23. Bullock, D.; Khan, S.; Rayburn, A. Soybean yield response to narrow rows is largely due to enhanced early growth. Crop Sci. 1998, 38, 1011–1016. [Google Scholar] [CrossRef]
  24. Hardy, R.W.F.; Havelka, U.D. Photosynthate as a Major Factor Limiting Nitrogen Fixation by Field Grown Legumes with Emphasis on Soybeans. In Symbiotic Nitrogen Fixation in Plant; Nutman, P.S., Ed.; Cambridge University Press: Cambrigde, UK, 1976; pp. 421–439. [Google Scholar]
  25. Finn, G.A.; Brun, W.A. Effect of atmospheric CO(2) enrichment on growth, nonstructural carbohydrate content, and root nodule activity in soybean. Plant Physiol. 1982, 69, 327–331. [Google Scholar] [CrossRef] [Green Version]
  26. Hartmann-Filho, C.P.; Goneli, A.L.D.; Masetto, T.E.; Martins, E.A.S.; Oba, G.C. The effect of drying temperatures and storage of seeds on the growth of soybean seedlings. J. Seed Sci. 2016, 38, 287–295. [Google Scholar] [CrossRef] [Green Version]
  27. Singh, J.; Paroha, S.; Mishra, R.P. Effect of storage on germination and viability of soybean (Glycine max) and niger (Guizotia abyssinica) seeds. Int. J. Curr. Microbiol. Appl. Sci. 2016, 5, 484–491. [Google Scholar] [CrossRef]
  28. Engels, C. Effect of root and shoot meristem temperature on shoot to root dry matter partitioning and the internal concentrations of nitrogen and carbohydrates in maize and wheat. Ann Bot. 1994, 73, 211–219. [Google Scholar] [CrossRef]
  29. Weraduwage, S.M.; Chen, J.; Anozie, F.C.; Morales, A.; Weise, S.E.; Sharkey, T.D. The relationship between leaf area growth and biomass accumulation in Arabidopsis thaliana. Front Plant Sci. 2015, 6, 167. [Google Scholar] [CrossRef] [Green Version]
  30. Wu, Y.; Gong, W.; Yang, W. Shade inhibits leaf size by controlling cell proliferation and enlargement in soybean. Sci Rep. 2017, 7, 9259. [Google Scholar] [CrossRef]
  31. Wiebold, W.J.D.; Ashley, A.; Boerma, H.R. Reproductive abscission levels and patterns for eleven determinate soybean cultivars. Agron J. 1981, 73, 43–46. [Google Scholar] [CrossRef]
  32. Egli, D.B. Flowering, pod set and reproductive success in soya bean. J. Agron Crop Sci. 2005, 191, 283–291. [Google Scholar] [CrossRef]
  33. Nico, M.; Mantese, A.I.; Miralles, D.J.; Kantolic, A.G. Soybean fruit development and set at the node level under combined photoperiod and radiation conditions. J. Exp Bot. 2016, 67, 365–377. [Google Scholar] [CrossRef] [Green Version]
  34. Ainsworth, E.A.; Yendrek, C.R.; Skoneczka, J.A.; Long, S.P. Accelerating yield potential in soybean: Potential targets for biotechnological improvement. Plant Cell Environ. 2012, 35, 38–52. [Google Scholar] [CrossRef]
  35. Ribeiro, A.B.M.; Bruzi, A.T.; Zuffo, A.M.; Zambiazzi, E.V.; Soares, I.O.; Vilela, N.J.D.; Pereira, J.L.A.R.; Moreira, S.G. Productive performance of soybean cultivars grown in different plant densities. Cien. Rural. 2017, 47, e20160928. [Google Scholar] [CrossRef] [Green Version]
Figure 1. Climate date. Rainfall (mm), average temperature of air (°C), and average temperature of soil at 5 cm (°C) near the sowing at (A) site I, (B) site II and III. Rainfall (mm), radiation (calories/cm2·day−1), and average temperature of air (°C) during the cycle of the crop at (C) site I, (D) site II and III. Source: Instituto Nacional de Meterologia (InMet).
Agronomy 10 00545 g001
Figure 2. The emergence flow of the soybean seeds. Emergence (%) at each day after sowing (5, 6, 7, 8, 9, 10, 11, 12, 13, and 14) of soybean seeds with different vigor levels (89%, 57%, 47%, and 43%) in three sites (I, II, and III).
Agronomy 10 00545 g002
Figure 3. Grain yield of the soybean plants originating from seeds of different vigor levels (89%, 57%, 47%, and 43%) at the three sites (I, II, and III). Values followed by distinct letters for each site differ from each vigor on a Tukey’s test (p < 0.05).
Agronomy 10 00545 g003
Figure 4. Schematic representation of vigor effect on soybean seed emergence. Plant from seeds with a high level of vigor presented higher uniformity and earlier emerging plants than plants with low seed vigor level.
Agronomy 10 00545 g004
Figure 5. Schematic representation of nonuniformity effect of the plants emergence through crop cycle. (A) Plant growth nonuniformity due to different days of plant emergence. (B) Plants in the reproductive stage (R4) with medium and slow emergence are equal in height with plants of early development, but have smaller leaf area and number of nodes. (C) Plants in physiological maturity (R8) that emerged first have higher yields due to the higher number of nodes and fertile pods when compared to medium and slow emergence plants.
Agronomy 10 00545 g005
Table 1. Average time of emergence (emergence speed) in days and uniformity index in percentage from soybean seeds with different vigor levels (89, 57, 47, and 43%) at three sites (I, II, and III).
VigorEmergence Speed (Days)Uniformity Index (%)
Site ISite IISite IIISite ISite IISite III
89%6.8 a7.7 a7.6 a70.6 aB82.5 aA86.3 aA
57%7.0 a8.0 ab7.7 a61.5 aB73.8 abA80.9 abA
47%7.5 b8.1 b8.0 ab48.3 bB70.5 bA76.7 abA
43%7.8 b8.2 b8.1 b 38.6 bB69.8 bA72.1 bA
CV (%)3.18.9
Means followed by the same uppercase letter within a row and lowercase letter within a column were not significantly different by Tukey’s test (p = 0.05). CV = coefficient of variation.
Table 2. First trifoliate leaf area (stage V1), leaf area (V4 and R2 stage), dry nodule mass (stage V4), and number of nodules (stage V4) in soybean plants with different emergence days after sowing (EDAS)* at three sites (I, II, and III).
First Trifoliate Area (cm2)Leaf Area V4 (cm2)Leaf Area R2 (cm2)Nodules Dry Mass (g)Number of Nodules
EDASIIIIIIIIIIIIIIIIIIIIIIIIIIIIII
530.4 a 1254 a 2878 a 0.298 a 61.6 a
627.3 a45.7 a34.8 a1103 ab 1138 a2534 a3345 abc2573 ab0.276 ab 0.1334 ab53.4 a 41 a
726.1 ab32.5 b30 b950 bc833 a880 b2491 ab2501 a2483 a0.177 cd0.0905 a0.1640 a41.1 ab38 a44.2 a
824.1 b28.4 c27.4 c904 cd726 b802 b2486 ab2140 cd2095 bc0.259 abc0.0939 a0.1442 ab54.7 a38.2 a43.4 a
920.5 c24.1 d24.5 cd720 cde597 bc596 c1927 bc1947 bcd1849 cd0.2439 bc0.0936 a0.0944 b51 ab38.3 a35.4 ab
1016.5 cd23.2 d17.5 de570 def570 abc457 bc1062 bc1220 d1624 bcde0.195 abcd0.0502 a0.0787 ab49.4 ab30 a23.5 ab
119.6 d17 e16.1 e309 ef283c444 c918 c1118 d1146 de0.077 bcd0.0392 a0.0333 ab21.6 ab16.5 a9.5 b
129.6 d7.7 e10.5 ef190 f 300 c 580 e0.048 d 0.0379 ab14 b 30 ab
14 10.5 e4.9 f 266 c226 c 421 cde 0.0395 a0.0204 ab 17.3 a10.5 ab
CSD5.54.65.22632072238027256270.110.070.0824.920.418.1
Values followed by distinct letters within a column are significantly different by Tukey’s test (p = 0.05). CSD = combined standard deviation. * Values of EDAS are an average obtained from plants with distinct vigor levels (89, 57, 47, and 43%).
Table 3. Shoot dry mass, root dry mass, dry mass of shoot ratio by total dry mass (SDM/TDM), shoot length, and root length in stage V4 in soybean plants from distinct emergence days after sowing (EDAS)* at the three sites (I, II, and III).
Shoot Dry Mass (g)Root Dry Mass (g)SDM/TDMShoot Length (cm)Root Length (cm)
EDASIIIIIIIIIIIIIIIIIIIIIIIIIIIIII
58.69 a 1.93 a 0.82 a 32.1 a 16.3 a
68.15 a 8.05 a1.82 a 1.39 a0.81 a 0.83 a31.1 ab 28.8 a16.5 a 10.6 a
77.20 ab6.10 a6.65 ab1.68 ab1.30 a1.34 a0.81 a0.8 a0.82 a30.7 ab26.2 a26.7 abc13 a10.3 a10.8 a
86.66 bc5.67 a5.91 bc1.55 abc1.20 a1.22 a0.79 ab0.81 a0.82 ab29 ab26.3 a27.0 ab15.3 a10.5 a9.5 a
95.32 cd5.54 a4.58 cd1.46 bc1.12 a1.22 a0.78 b0.83 a0.77 c28.2 b25 a24.8 cd15 a9.7 a9.3 a
104.78 bcde4.58 a3.36 cd1.44 abc0.83 a1 a0.76 b0.84 a0.80 abc27.2 abc25 a24 abcd16.8 a9 a9 a
112.50 de3.47 a3.31 bcd0.79 cd0.87 a1.01 a0.76 b0.79 a0.77 abc24.3 abc25 a23.7 abcd15 a8 a8.5 a
121.53 e 2.31 cd0.42 d 0.99 a0.76 b 0.67 bcd18.7 c 21 bcd9 a 7.5 a
14 3.36 a1.36 d 0.71 a0.98 a 0.83 a0.57 d 21.3 a20 d 7.3 a7.5 a
CSD1.82.01.90.450.40.420.030.080.064.63.2363.23.2
Values followed by distinct letters within a column are significantly different by Tukey’s test (p = 0.05). CSD = combined standard deviation (CSD). * Values of EDAS are an average obtained from plants with distinct vigor levels (89%, 57%, 47%, and 43%).
Table 4. Stem diameter, shoot length, average length of internodes (ALI), total numbers of nodes, and number of fertile nodes at stage R8 in soybean plants from distinct emergence days after sowing (EDAS)* at the three sites (I, II, and III).
Stem Diameter (cm)Shoot Length (cm)ALI (cm)Total Number of NodesNumber of Fertile Nodes
EDASIIIIIIIIIIIIIIIIIIIIIIIIIIIIII
50.91 a 96.7 a 4.70 b 20.6 a 17.4 a
60.85 a1 abc1 a97.1 a 94.4 a4.72 b 4.91 a20.6 a 19.2 a17.1 a 16.6 a
70.85 ab0.90 a0.96 a97.7 a94.4 a94.3 a4.76 b4.87 b5.62 a20.6 a19.4 a19.1 a17 a15.8 a15.2 ab
80.81 ab0.88 a0.89 ab97 a92 ab94.6 a4.84 ab4.89 b5.04 a20.1 a18.8 ab18.8 a16.2 ab14.9 a14.3 abc
90.72 bc0.73 c0.72 c96.3 a91.1 bc95.4 a5.04 ab5.02 ab5.19 a19.5 ab18.2 bc18.4 ab15 b13.3 b13 cd
100.46 cd0.6 bc0.66 abc95 a90.8 abc94.1 a5.18 ab5.38 a5.39 a18.4 ab17 c17.5 ab13.6 bc12 b11.6 d
110.4 d0.62 bc0.62 bc93.3 a89.3 abc93.4 a5.47 a5.42 a5.69 a17.1 b16.5 c16.4 b11 c11.1 b10.1 d
12 0.4 c 82.6 c93 ab 5.08 ab6.2 a 16.3 c15 ab 11 b9 bcd
14 0.4 abc 71 b 5.46 a 13 b 7 d
CSD0.170.190.1965.16.80.50.372.321.41.82.322.2
Values followed by distinct letters within a column are significantly different by Tukey’s test (p = 0.05). CSD = combined standard deviation. * Values of EDAS are an average obtained from plants with distinct vigor levels (89%, 57%, 47%, and 43%).
Table 5. Number of pods, grains for pod, number of grains for plant, thousand-seed weight, and grain mass in stage R8 in soybean plants from distinct emergence days after sowing (EDAS)* at the three sites (I, II, and III).
Number of PodsGrains for PodNumber of GrainsThousand-Seed Weight (g)Grain Mass (g)
EDASIIIIIIIIIIIIIIIIIIIIIIIIIIIIII
580.9 a 2.41 a 194.9 a 166.3 a 32 a
672.6 a 71.9 a2.42 a 2.49 a175.2 a 179.5 a164.3 a 168.8 bc28.8 a 30.2 a
769.8 ab65.6 a62.2 a2.39 a2.44 a2.51 a166.7 ab160 a156.2 a165.1 a168.7 b172.8 c27.4 ab26.8 a26.9 ab
859.7 bc56.4 b52.7 b2.42 a2.46 a3.12 a144.5 bc138.8 b135.7 b170.6 a170.2 b181.9 abc24.6 bc23.4 b24.1 abc
954.2 c46.2 c42.6 c2.47 a2.46 a2.53 a133.7 c114.3 c108.3 c165.7 a180.1 ab183.3 abc22 c20.5 b20.1 c
1040.6 cd39.2 c39.7 bc2.48 a2.41 a2.54 a100.6 cd95.3 c101.2 bc166.8 a201.7 a179.7 abc16.8 cd19.1 b18 bc
1125.8 d36.3 c32.8 c2.41 a2.52 a2.52 a62.5 d92 c83.3 c161.4 a184.2 ab227.2 a9.9 cd16.7 b18.1 c
12 33 c18 bc 2.53 a2.55 a 83.7 c46 bc 180.5 ab285.7 abc 15.2 b13.1 abc
14 16 bc 2.43 a 39 bc 216.2 abc 8.4 abc
CSD15.413.613.80.160.151.836.231.834.7162137.26.15.47.5
Values followed by distinct letters within a column are significantly different by Tukey’s test (p = 0.05). CSD = combined standard deviation. * Values of EDAS are an average obtained from plants with distinct vigor levels (89%, 57%, 47%, and 43%).

