Article

Forage Performance and Detection of Marker Trait Associations with Potential for Napier Grass (Cenchrus purpureus) Improvement

by
Ermias Habte
1,†,
Meki S. Muktar
1,†,
Asebe Abdena
1,
Jean Hanson
1,
Alieu M. Sartie
1,
Alemayehu T. Negawo
1,
Juarez Campolina Machado
2,
Francisco José da Silva Ledo
2 and
Chris S. Jones
3,*
1
Feed and Forage Development, International Livestock Research Institute, Addis Ababa PO Box 5689, Ethiopia
2
Brazilian Agricultural Research Corporation (EMBRAPA), Brasilia 70770-901, Brazil
3
Feed and Forage Development, International Livestock Research Institute, Nairobi PO Box 30709, Kenya
*
Author to whom correspondence should be addressed.
Both authors contributed equally.
Agronomy 2020, 10(4), 542; https://doi.org/10.3390/agronomy10040542
Submission received: 14 February 2020 / Revised: 22 March 2020 / Accepted: 25 March 2020 / Published: 9 April 2020
(This article belongs to the Special Issue Breeding and Genetics of Forages for Semi-Arid and Arid Rangelands)

Abstract

:
The evaluation of forage crops for adaptability and performance across production systems and environments is one of the main strategies used to improve forage production. To enhance the genetic resource base and identify traits responsible for increased feed potential of Napier grass, forty-five genotypes from Empresa Brasileira de Pesquisa Agropecuária (EMBRAPA), Brazil, were evaluated for forage biomass yield and feed nutritional quality in a replicated trial under wet and dry season conditions in Ethiopia. The results revealed significant variation in forage yield and feed nutritional qualities among the genotypes and between the wet and dry seasons. Feed fiber components were lower in the dry season, while crude protein, in vitro organic matter digestibility, and metabolizable energy were higher. Based on the cumulative biomass and metabolizable energy yield, top performing genotypes were identified that are candidates for future forage improvement studies. Furthermore, the marker-trait association study identified diagnostic single nucleotide polymorphisms (SNP) and SilicoDArT markers and potential candidate genes that could differentiate high biomass yielding and high metabolizable energy genotypes in the collection.

1. Introduction

Forage provides an essential component of the feed resource for small scale dairy-producing farmers in developing countries [1]. Production by the farmers, however, is affected by seasonal fluctuations of forage performance, both in terms of quantity and quality. The productivity of forage crops is also hampered by abiotic and biotic stresses [2,3]. Hence, several national research institutes are aiming to improve forage productivity and to provide new forage cultivars by the identification of adaptable, higher quality forage accessions, mainly through the introduction and evaluation of different options in their forage development programs [4,5].
Napier grass, (Cenchrus purpureus Schumach., syn. Pennisetum purpureum Schumach), also called elephant grass, is one of the most popular tropical forage crops [6]. Napier grass is a C4 perennial grass species of the Poaceae family, native to Sub-Saharan Africa, and it is widely distributed across the tropical and subtropical parts of the world [7]. Napier grass is valued for its high biomass production, pest resistance, feed quality, and year-round availability due to its perennial nature [8,9]. The grass is used in the ‘push-pull’ strategy for the management of insect pests that can cause significant damage to maize production, and it can grow in degraded and marginalized lands; hence, it can play a role in preventing soil erosion [10]. Due to its superior biomass yield, Napier grass is also a candidate species for biofuel production [11]. To exploit the potential of this grass, various conservation centers maintain and develop superior cultivars for forage production. Among these centers, the forage genebanks of the International Livestock Research Institute (ILRI) in Ethiopia and the Brazilian Agricultural Research Corporation, Empresa Brasileira de Pesquisa Agropecuária (EMBRAPA), maintain a large number of Napier grass germplasm that has been acquired from a range of different countries.
Napier grass has limited genomic information available, and, until recently, only a handful of molecular markers have been applied, mainly in studies targeting the assessment of genetic diversity. Although the recent advances in the genotyping by sequencing (GBS) approach have enabled the generation of a large number of high-density genome-wide markers [12,13,14], this species still lacks a reference genome. Hence, the reference genome sequence of pearl millet [15], a closely related species to Napier grass, has been used for mapping the genome-wide markers.
Several studies have been directed towards the characterization and evaluation for forage yield, feed quality, and resistance to the major diseases affecting Napier grass [16]. From the ILRI genebank collection, some genotypes shown to be promising for high biomass yield and nutritional quality have been identified and utilized by national programs, including in Ethiopia and Kenya [17,18,19]. Due to the impacts of climate change in East and Central Africa (ECA) and the potential risks from the emergence and spread of pests and diseases [20], the selection and development of new forage varieties with desirable traits that fit with the climatic conditions and production systems of ECA needs continuous assessment of a large number of genotypes. The success of such improvement programs will depend on the available gene pool and the genetic diversity contained within. In line with these goals, a collaborative study was conducted between ILRI and EMBRAPA to identify unique genotypes, including some elite lines, from the collections of both centers [21]. As a result of this targeted introduction, 53 Napier grass genotypes were transferred to the ILRI gene bank from EMBRAPA in 2013, an activity that greatly enhanced the genetic diversity contained in the ILRI collection and provided potential new options for future utilization.
Forage quality and the production potential of an individual genotype can be location- and season-specific; hence, the assessment of plant performance and adaptability to a new environment are major activities employed when new genotypes are introduced into a collection. Consequently, the introduced Napier grass genotypes were evaluated for their agronomic performance and feed quality under wet and dry season conditions in the Ethiopian environment. Here, we report on the performance of 45 Napier grass genotypes for forage biomass yield (total fresh weight (TFW) and total dry weight (TDW)]) and feed quality traits in the wet and dry seasons of Bishoftu, Ethiopia, using field phenotypic evaluation and molecular analyses. We also report on the identification of single nucleotide polymorphisms (SNPs), SilicoDArT markers, and potential candidate genes associated with high TDW and metabolizable energy. In general, the results demonstrate that there is significant variation in growth and performance among the genotypes and between the wet and dry seasons. Marker-trait associations identified discriminatory SNP and SilicoDArT markers that were able to differentiate high biomass yielding genotypes in the collection. One of these markers aligned with markers previously identified to be associated with improved agronomic performance in pearl millet (Pennisetum glaucum), a closely related species to Napier grass. This finding may be used in the future to improve the selection efficiency in Napier grass through the application of marker assisted selection (MAS).

2. Materials and Methods

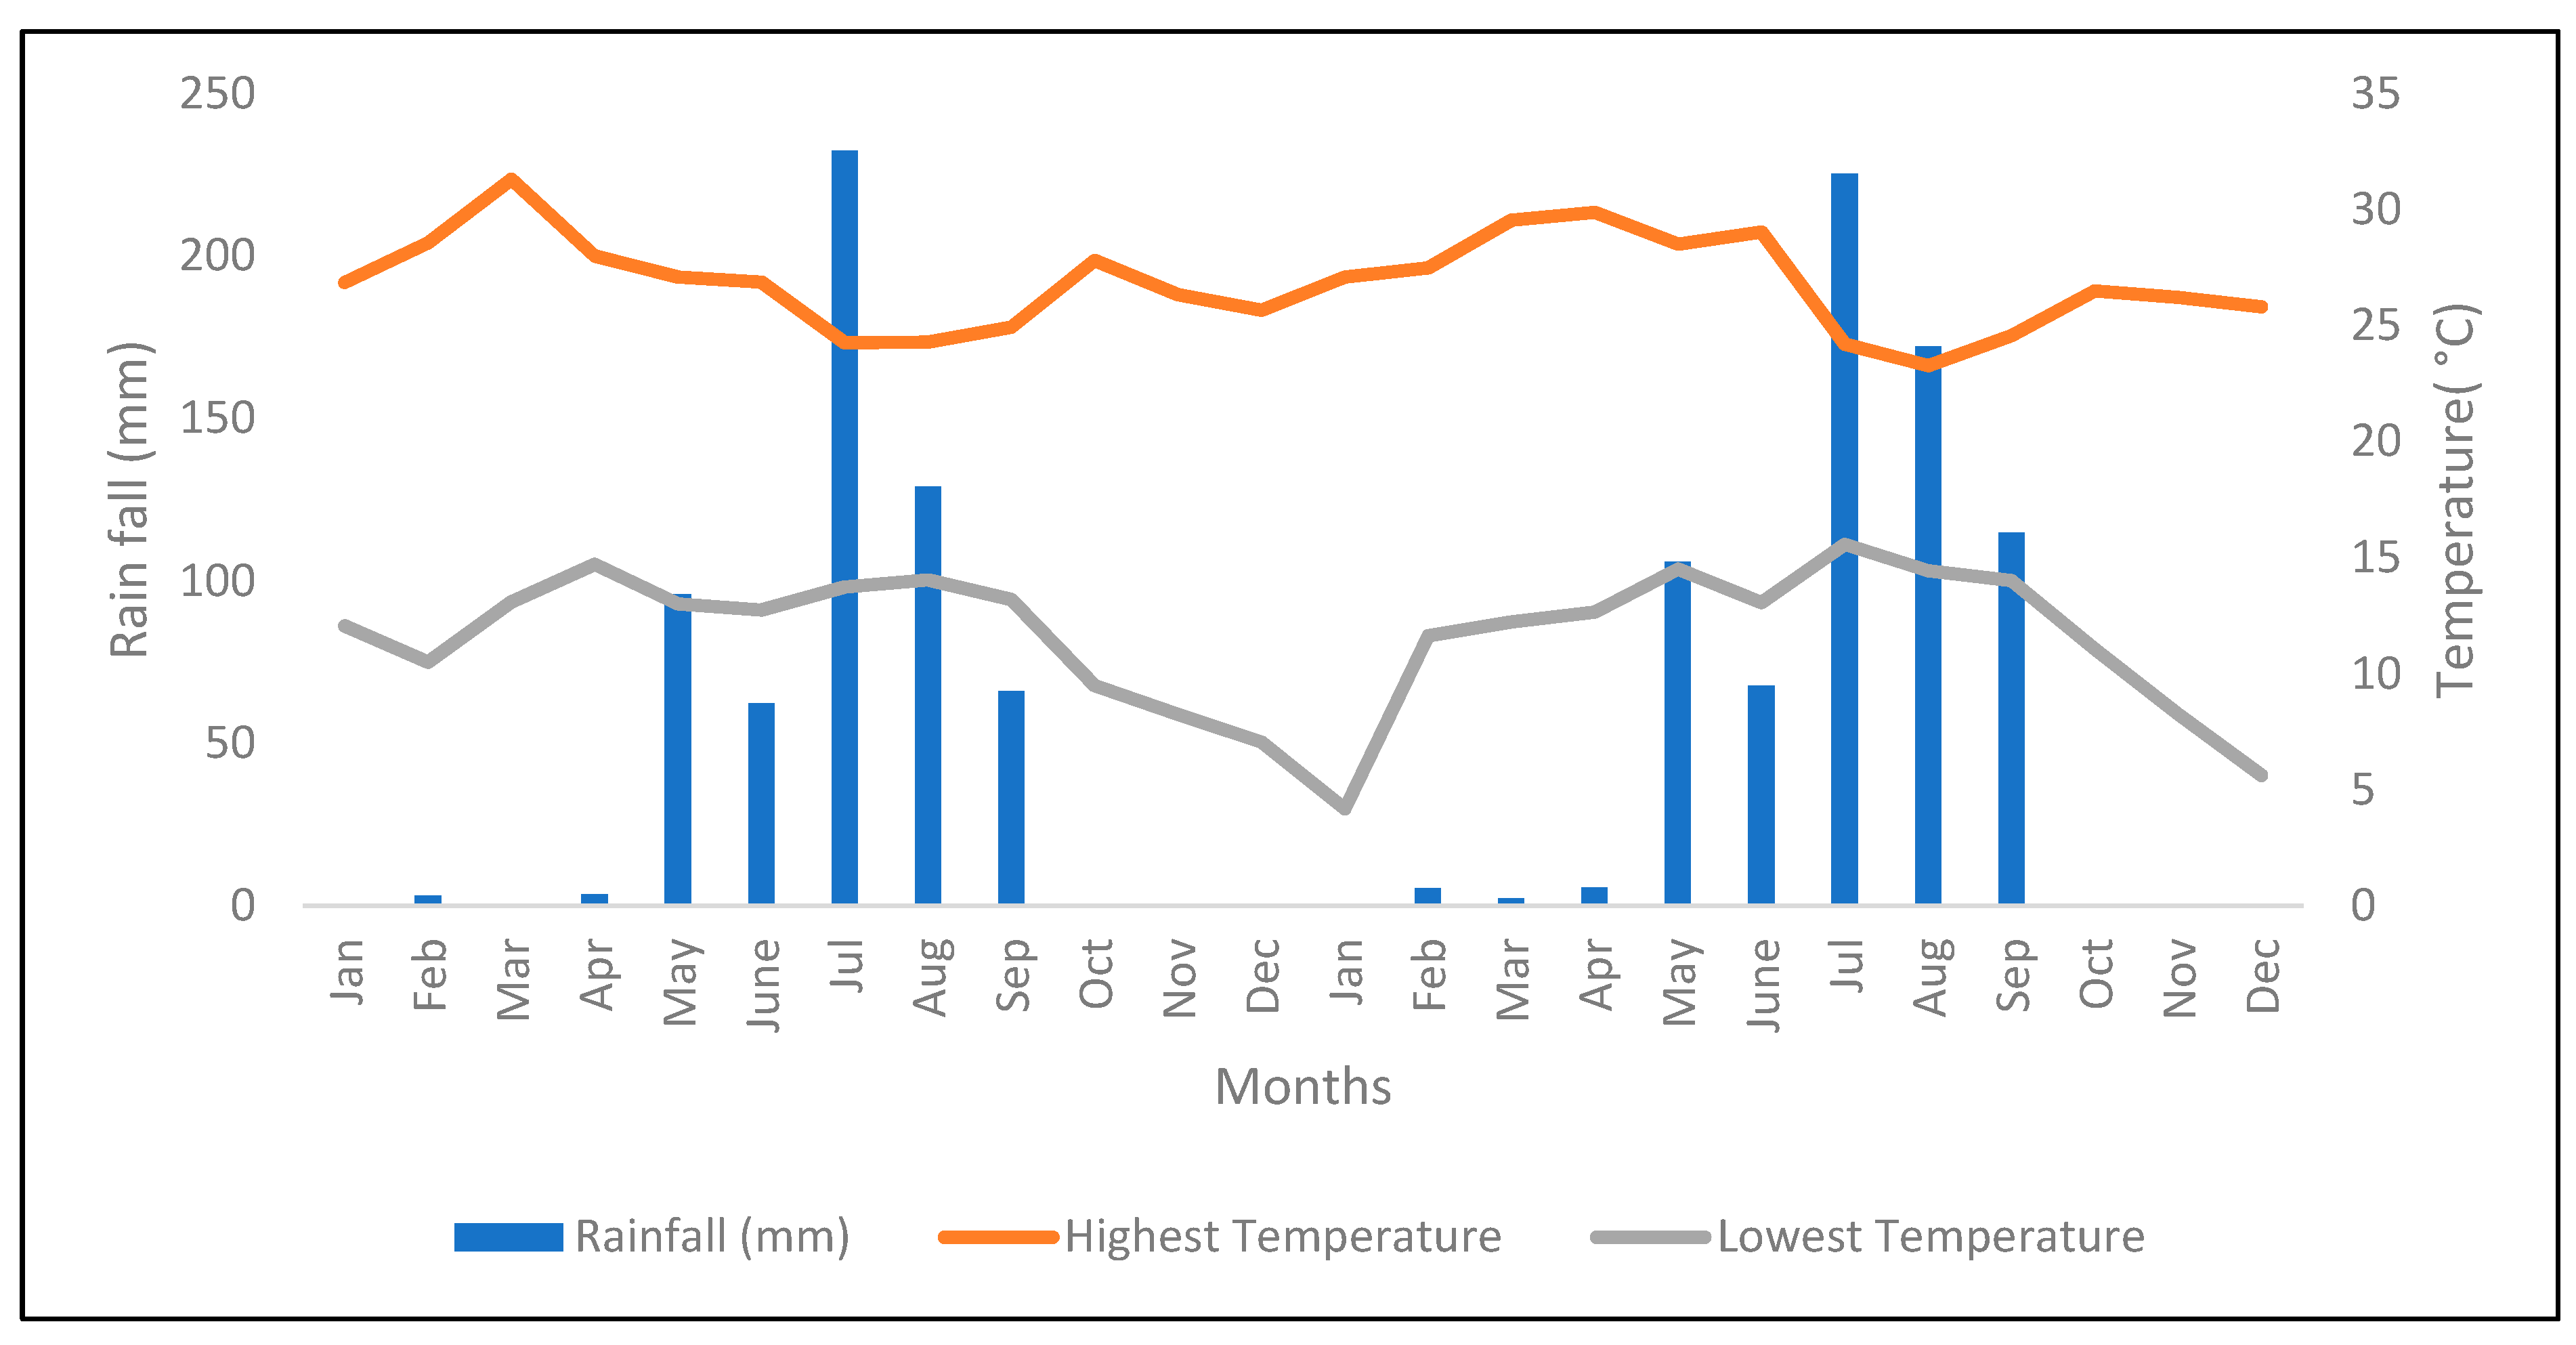
2.1. Description of the Experimental Area

The study was conducted in Bishoftu, Ethiopia (008°47′20′′ N and 038°59′15′′ E), over a 21-month period, from May 2016 to January 2018. The altitude of Bishoftu is 1890 meters above sea level with an Alfisol soil type. The monthly precipitation and temperature for the harvest period of 2016 to 2017 are provided in Figure 1. During the dry periods, plants were supplemented with water by sprinkler irrigation.

2.2. Planting Materials and Trial Establishment

Forty-five genotypes of Napier grass from EMBRAPA were used for the study (Table 1). Cuttings from established Napier grass plants were planted in Bishoftu using a randomized complete block design, with three replications, at the start of the main rainy season on 6 May 2016. Each genotype was planted in a single 5 m long row, with a spacing of 1 m between rows and 0.5 m between plants within a row. Four months later, on 8 September 2016, the established plants were uniformly cut at 5 cm above ground level. Land preparation, planting, weeding, harvesting, and related management practices were uniformly applied to all plots. Inorganic fertilizer, urea, was applied during the rainy season in 2017 at a rate of 6.2 g/plant.

2.3. Data Collection

Plants were harvested after every 8 weeks of regrowth for eight consecutive harvests between November 2016 and January 2018. During each harvest, biomass data were collected from the middle 8 plants in each row. To determine the forage biomass yield, i.e., total fresh weight (TFW) and total dry weight (TDW), forage harvesting was undertaken by chopping with a sickle, leaving a residual stubble height of 5 cm. TFW was measured immediately after each harvest. A sub-sample of 300 g of whole plant material was then chopped and placed in a labeled paper bag. An additional 600 g sample was separated into leaf and stem, weighed immediately, chopped, and placed into separate labelled paper bags for leaf and stem. The labeled paper bags were oven dried at 60 °C for 48 h. The sub-samples from the bags were used to calculate the TDW, and the leaf to stem ratio (LSR) was calculated by dividing the leaf dry weight by the stem dry weight of each genotype.
For genetic analysis, leaf sample collection, DNA extraction, and genotyping were conducted, as described previously by Muktar et al [12].

2.4. Feed Quality Analysis

The oven-dried tissue samples from the whole plant, leaf, and stem components were ground separately until fine enough to pass through a 1 mm sieve. The ground samples were scanned using Near Infrared Spectroscopy (NIRS) (FOSS Forage Analyzer 5000 with software package WinISI II) to predict feed quality traits, as indicated by Choudhary et al. [22]. The traits analyzed were: acid detergent fiber (ADF), neutral detergent fiber (NDF), acidic detergent lignin (ADL), organic matter (OM), dDry matter (DM), inorganic matter (ash), total nitrogen (N), crude protein (CP), in vitro organic matter digestibility (IVOMD), and metabolizable energy (ME), i.e., values were predicted using previously developed equations calibrated against conventional wet chemistry analyses for Napier grass. The predicted values were corrected by DM, and the percentage values were used for statistical analyses. The ME yield was calculated by multiplying ME by TDW.

2.5. Data Analysis

In order to improve the precision and to reliably estimate genetic values for genotypes, a spatial analysis was conducted using TFW, TDW, and LSR. As described by Velazco et al. [23], the mixed model features of spatial analysis were used to fit a smooth surface to account for all sources of environmental variation. We, therefore, used the first-order autoregressive (AR1) model [24] in GenStat software version 19 [25], where blocks (columns) and plots (rows) in each block were used as random terms and genotypes as fixed terms. The plot values were then fitted based on the spatial variations. The fitted data were subjected to an analysis of variance (ANOVA) using GenStat software version 19 [25] to determine the significance of the main effects and the interactions using the model set out below.
Yijk = μ + Gi + Sj + G ∗ Sij + εijk,
where Yijk is the response (Biomass yield and chemical composition) during each season, μ = overall mean, Gi = effect of Napier grass genotypes, Sj = effect of season of harvest (j = dry and wet), G * Sij = the interaction of ith genotype and jth season, and εijk = the residual error.
The least significant difference (LSD), for comparison of mean values, was employed to compare genotypes for traits with significant p values. Genetic parameters, genotypic coefficient of variation (GCV), and phenotypic coefficient of variation (PCV) were estimated according to Singh and Chaudary [26], using the formulae:
GCV = σ 2 g   ×   100 / X ¯
PCV = σ 2 p   ×   100 / X ¯
where GCV = genotypic coefficient of variation, PCV = phenotypic coefficient of variation, σ2g = genotypic variance, σ2p = phenotypic variance, and X ¯ = grand mean.
To evaluate Napier genotypes based on annual TDW and ME, cumulative TDW and ME yield were computed. The cumulative annual TDW was obtained by adding the mean TDW of wet and dry season harvests of each genotype. The cumulative ME yield was obtained by adding the mean ME of wet and dry season harvests and multiplying by the respective cumulative TDW.
Pattern analyses, i.e., cluster analysis and principal component analysis (PCA), were applied to visualize the pattern of genotypes using DeltaGen 3_1 [27]. Pearson correlation analysis among forage biomass and feed quality traits were conducted using GenStat software (version 19, VSN international LTD, UK) [25].
To examine scaling relationships between biomass yield (TDW) with feed quality traits and leaf to stem ratio, linear regression on log-transformed trait values were conducted using the GenStat platform [25]. The scaling relationship was analyzed based on the allometric equation of Gilles and Gilles [28].
Y = a × Xb,
where Y is the response variable, i.e., feed quality or leaf to stem ratio traits, and X is the fixed variable, i.e., total dry weight; a is the y-intercept, and b is the slope of the scaling function, representing the allometric exponent.
To represent the relationship between total dry weight with feed quality traits in wet and dry seasons a scatter plot was drawn using observed and predicted values of linear regression.

2.6. Marker-Trait Association Analysis

Marker-trait associations were detected with R statistical software (https://www.r-project.org) using the R package GWASpoly [29], which facilitates taking kinship into account in a mixed model to correct against spurious associations due to the level of relatedness between genotypes. In addition, the simple ANOVA model, which assumes that genotypes are independent, was employed to test the association of each marker with the trait. The collection was genotyped using the DArTseq platform (http://www.diversityarrays.com) to generate genome wide (SNP and SilicoDArT) markers, as described previously [12]. The genome-wide marker data, together with the phenotype data for annual dry weight production and metabolizable energy, were used in the marker-trait association analysis.
The DArTseq sequence reads corresponding to the SNP and SilicoDArT markers were aligned to Napier grass genomic [30] and transcriptome [31] sequences using the bwa mem sequence alignment method [32], and the sequences were annotated using the GeneBank NCBI blastx tool (https://blast.ncbi.nlm.nih.gov/Blast.cgi).

3. Results

3.1. Forage Biomass Productivity of Napier Grass Genotypes

In order to assess the adaptation and performance of the Napier grass genotypes sourced from EMBRAPA, a statistical analysis was conducted using analysis of variance (ANOVA). Highly significant (p < 0.001) variation for total fresh weight (TFW), total dry weight (TDW), and leaf to stem ratio (LSR) was observed between genotypes and harvest seasons (Table 2). The results show that, with the exception of LSR, seasonal variation was more significant compared to the genotypes contribution. As expected, forage yield was lower during the dry season, with the mean total dry weight for wet season harvests almost three-fold higher compared to the dry season harvests (Table 3). Similarly, LSR was over two-fold higher during the dry season compared to the wet season, presumably reflecting the fact that genotypes produce a higher proportion of stem associated with the increased yield during eight weeks of regrowth in the wet season (Table 3). In line with this finding, the top yielding genotypes during the wet season harvests, BAGCE 94, BAGCE 86, and BAGCE 100, had a low to medium LSR reflecting the contribution of stem elongation to the high yield. The highest LSRs during the dry season were obtained from genotypes BAGCE 7, BAGCE 43, and BAGCE 25, while the lowest LSRs were observed from BAGCE 80, BAGCE 56, and CNPGL-93-06-1 (Table A3; Appendix B).
The phenotypic coefficient of variation (PCV) and the genotypic coefficient of variation (GCV) were calculated to assess the contribution of these factors to the forage biomass yield traits (Table 3). The GCV values of both TFW and TDW for the wet season harvests were higher than for the dry season harvests and, conversely, PCV were higher in the dry season than the wet season harvests. This indicates that the environment had a greater influence on forage production in the dry season than in the wet season. However, overall the GCV values of both traits were close to their respective PCV values, indicating that genetic factors contributed a major effect to the variation observed in the trial. On the other hand, PCV values for LSR were more than two-fold higher than the GCV values, indicating that the environment plays a significant role in the variation observed among genotypes for this trait (Table 3). Some of the top performing genotypes identified for TFW and TDW during the wet season were also top performers during the dry season. For example, the genotypes BAGCE 94 and BAGCE 100 were among the highest yielding in both seasons, while genotypes CNPGL 92-190-1, BAGCE 75, and CNPGL 96-21-1 were amongst those that produced the lowest (Table A3; Appendix B).

3.2. Feed Qualities of Napier Grass Genotypes

The results of the feed quality analysis are shown in Table 4. Significant differences were observed among the genotypes in the traits: dry matter (DM); organic matter (OM); inorganic matter (ash); acid detergent fiber (ADF); acid detergent lignin (ADL); neutral detergent fiber (NDF); crude protein (CP); total nitrogen (N); in vitro organic matter digestibility (IVOMD); and metabolizable energy (ME) in both the leaf and stem (L + S) and the leaf (L) tissue samples taken across harvests (Table 4). In addition, highly significant (p < 0.001) seasonal variation for most feed quality parameters, with the exception of DM, OM, and ash, were observed, but the genotype-by-season interaction was not significant. The data on fiber fractions showed that, in general, the genotypes had a higher percentage of NDF, ADF, and ADL in the wet season than in the dry season, which had significantly lower (p < 0.05) mean values (Table 5). Conversely, the mean values for CP, IVOMD, and ME were significantly higher (p < 0.05) during the dry season (Table 5). During the wet season, PCV values for most feed quality parameters were almost two-fold higher than their respective GCV values (Table 5). Similarly, during the dry season, the PCV values were also approximately two-fold higher than the respective GCV values (Table 5). Taken together, these results indicate that the environmental effect was equally as important as the genotypic effect for the observed variation in feed nutrition quality traits. Generally, genotypes that showed highest mean performance for NDF had the lowest mean performance for CP, IVOMD, and ME in both wet and dry seasons (Table A4; Appendix B).

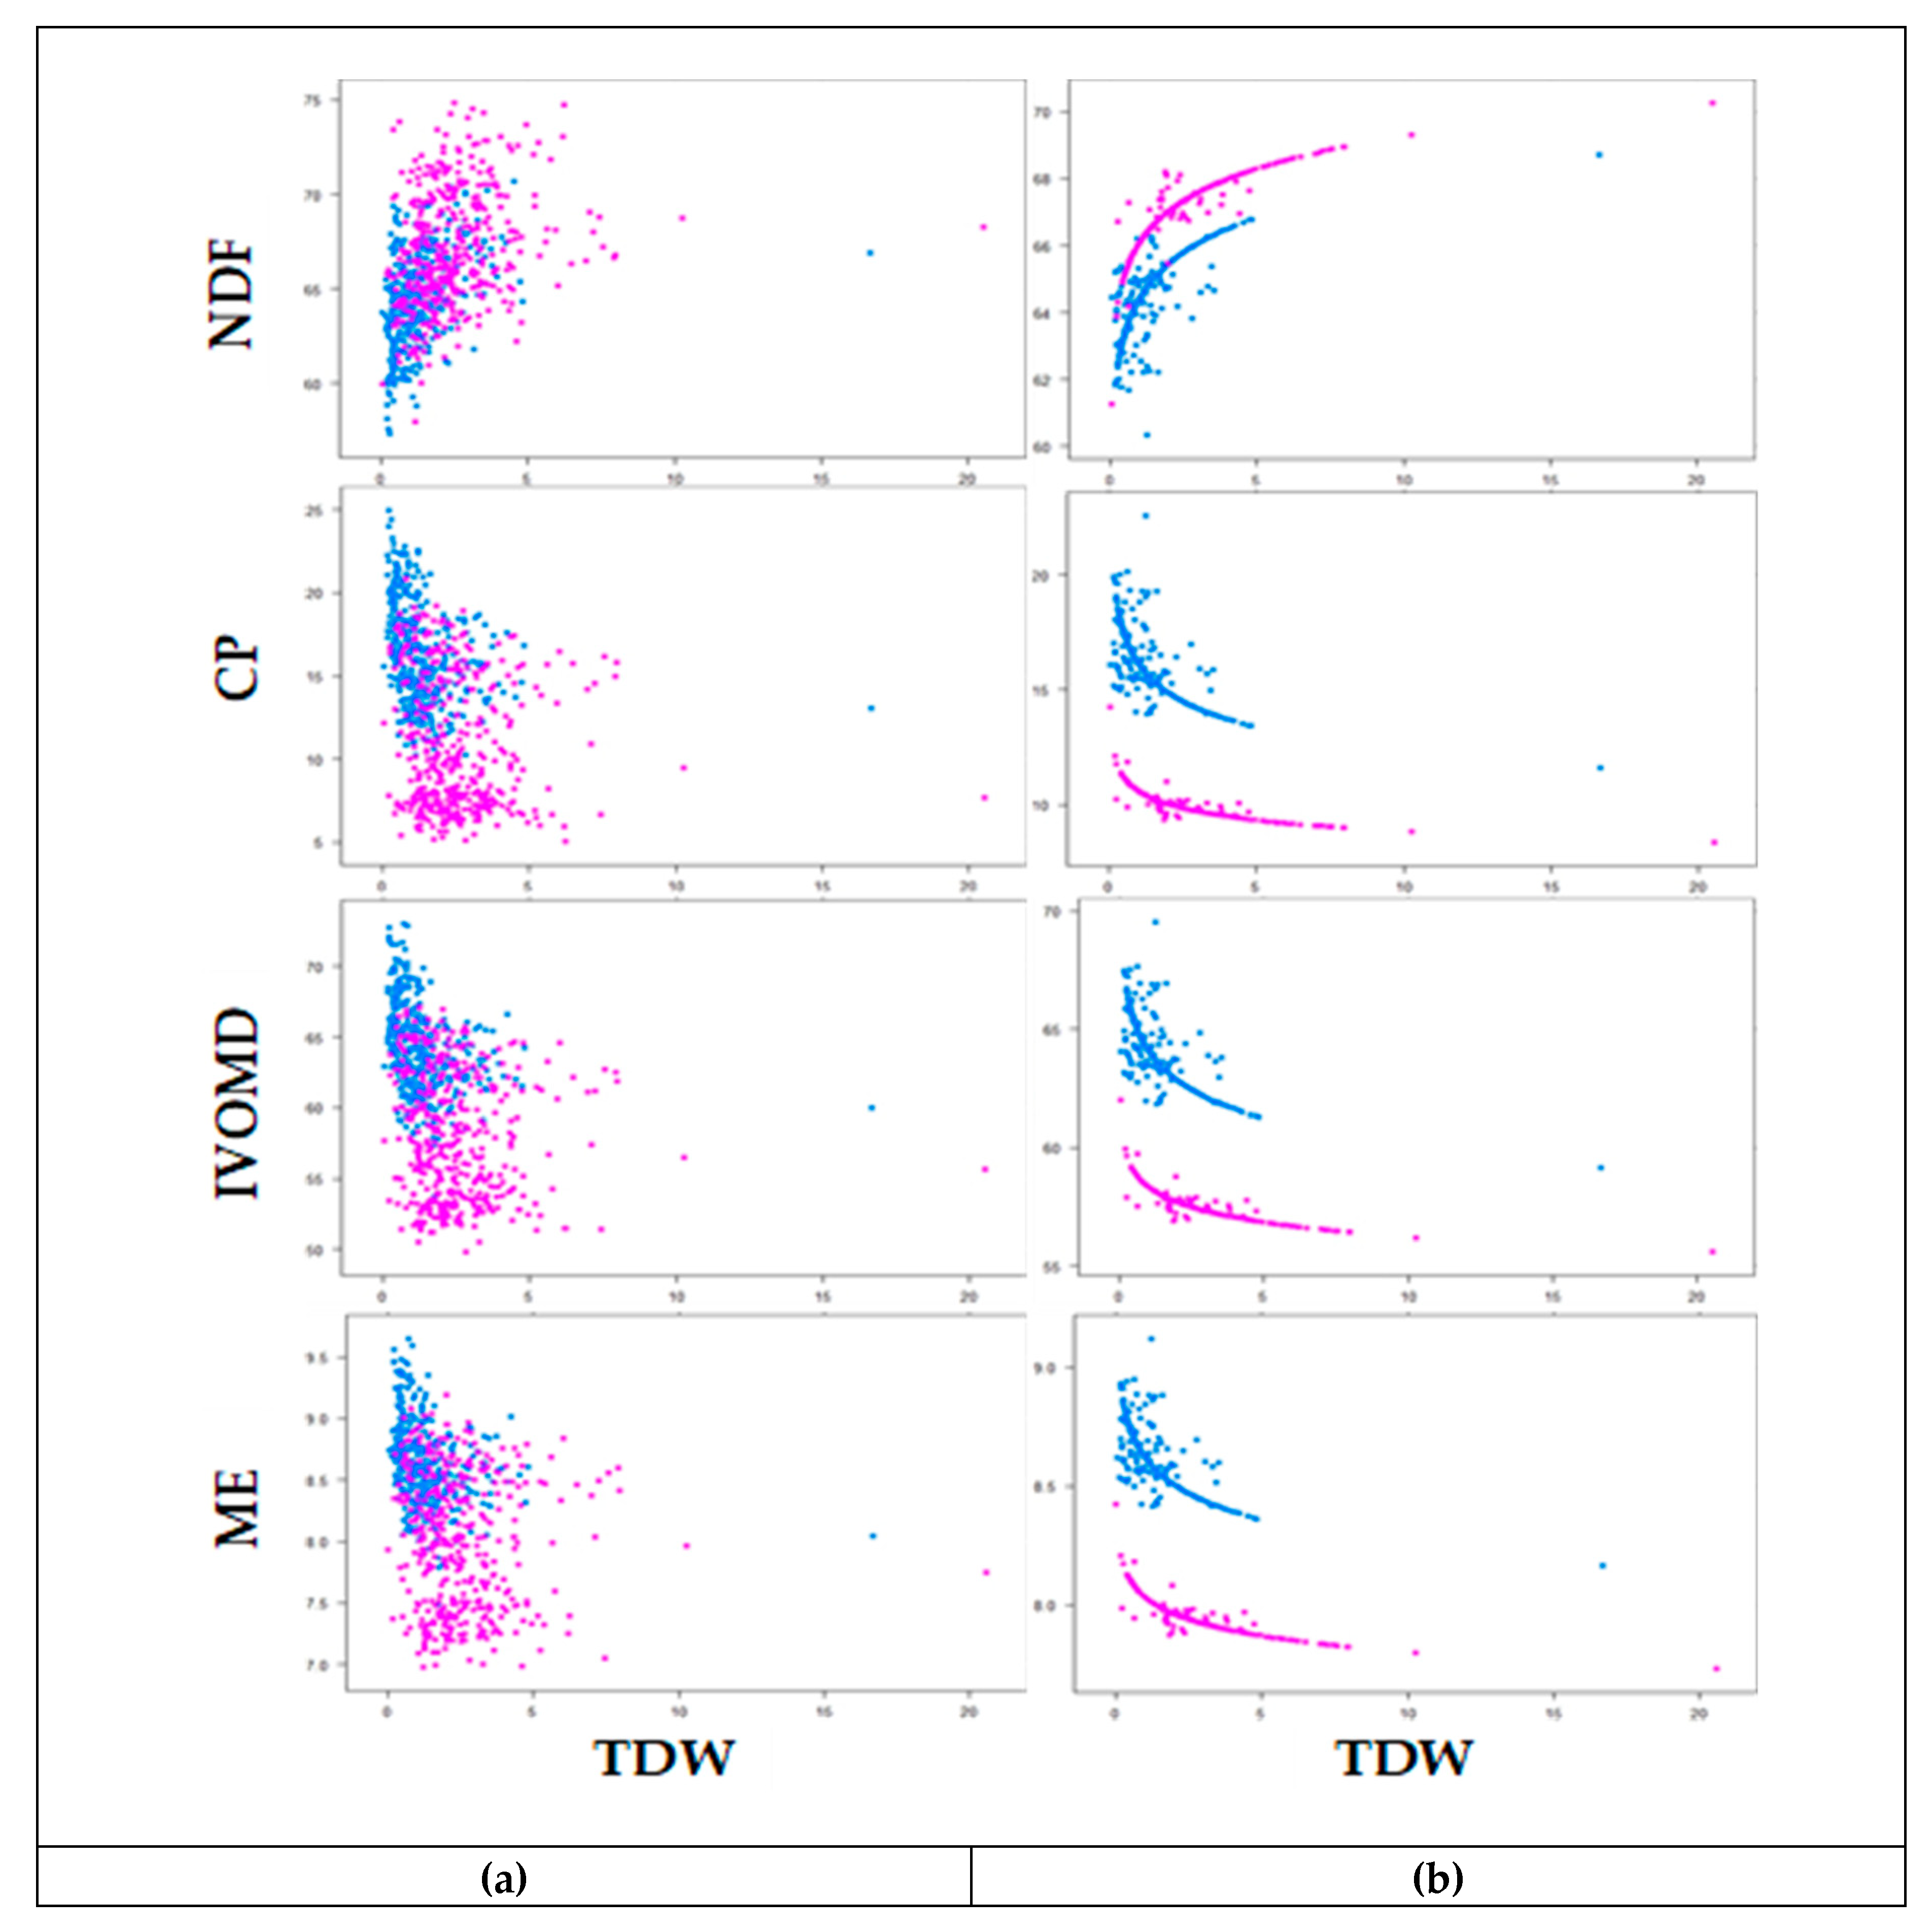
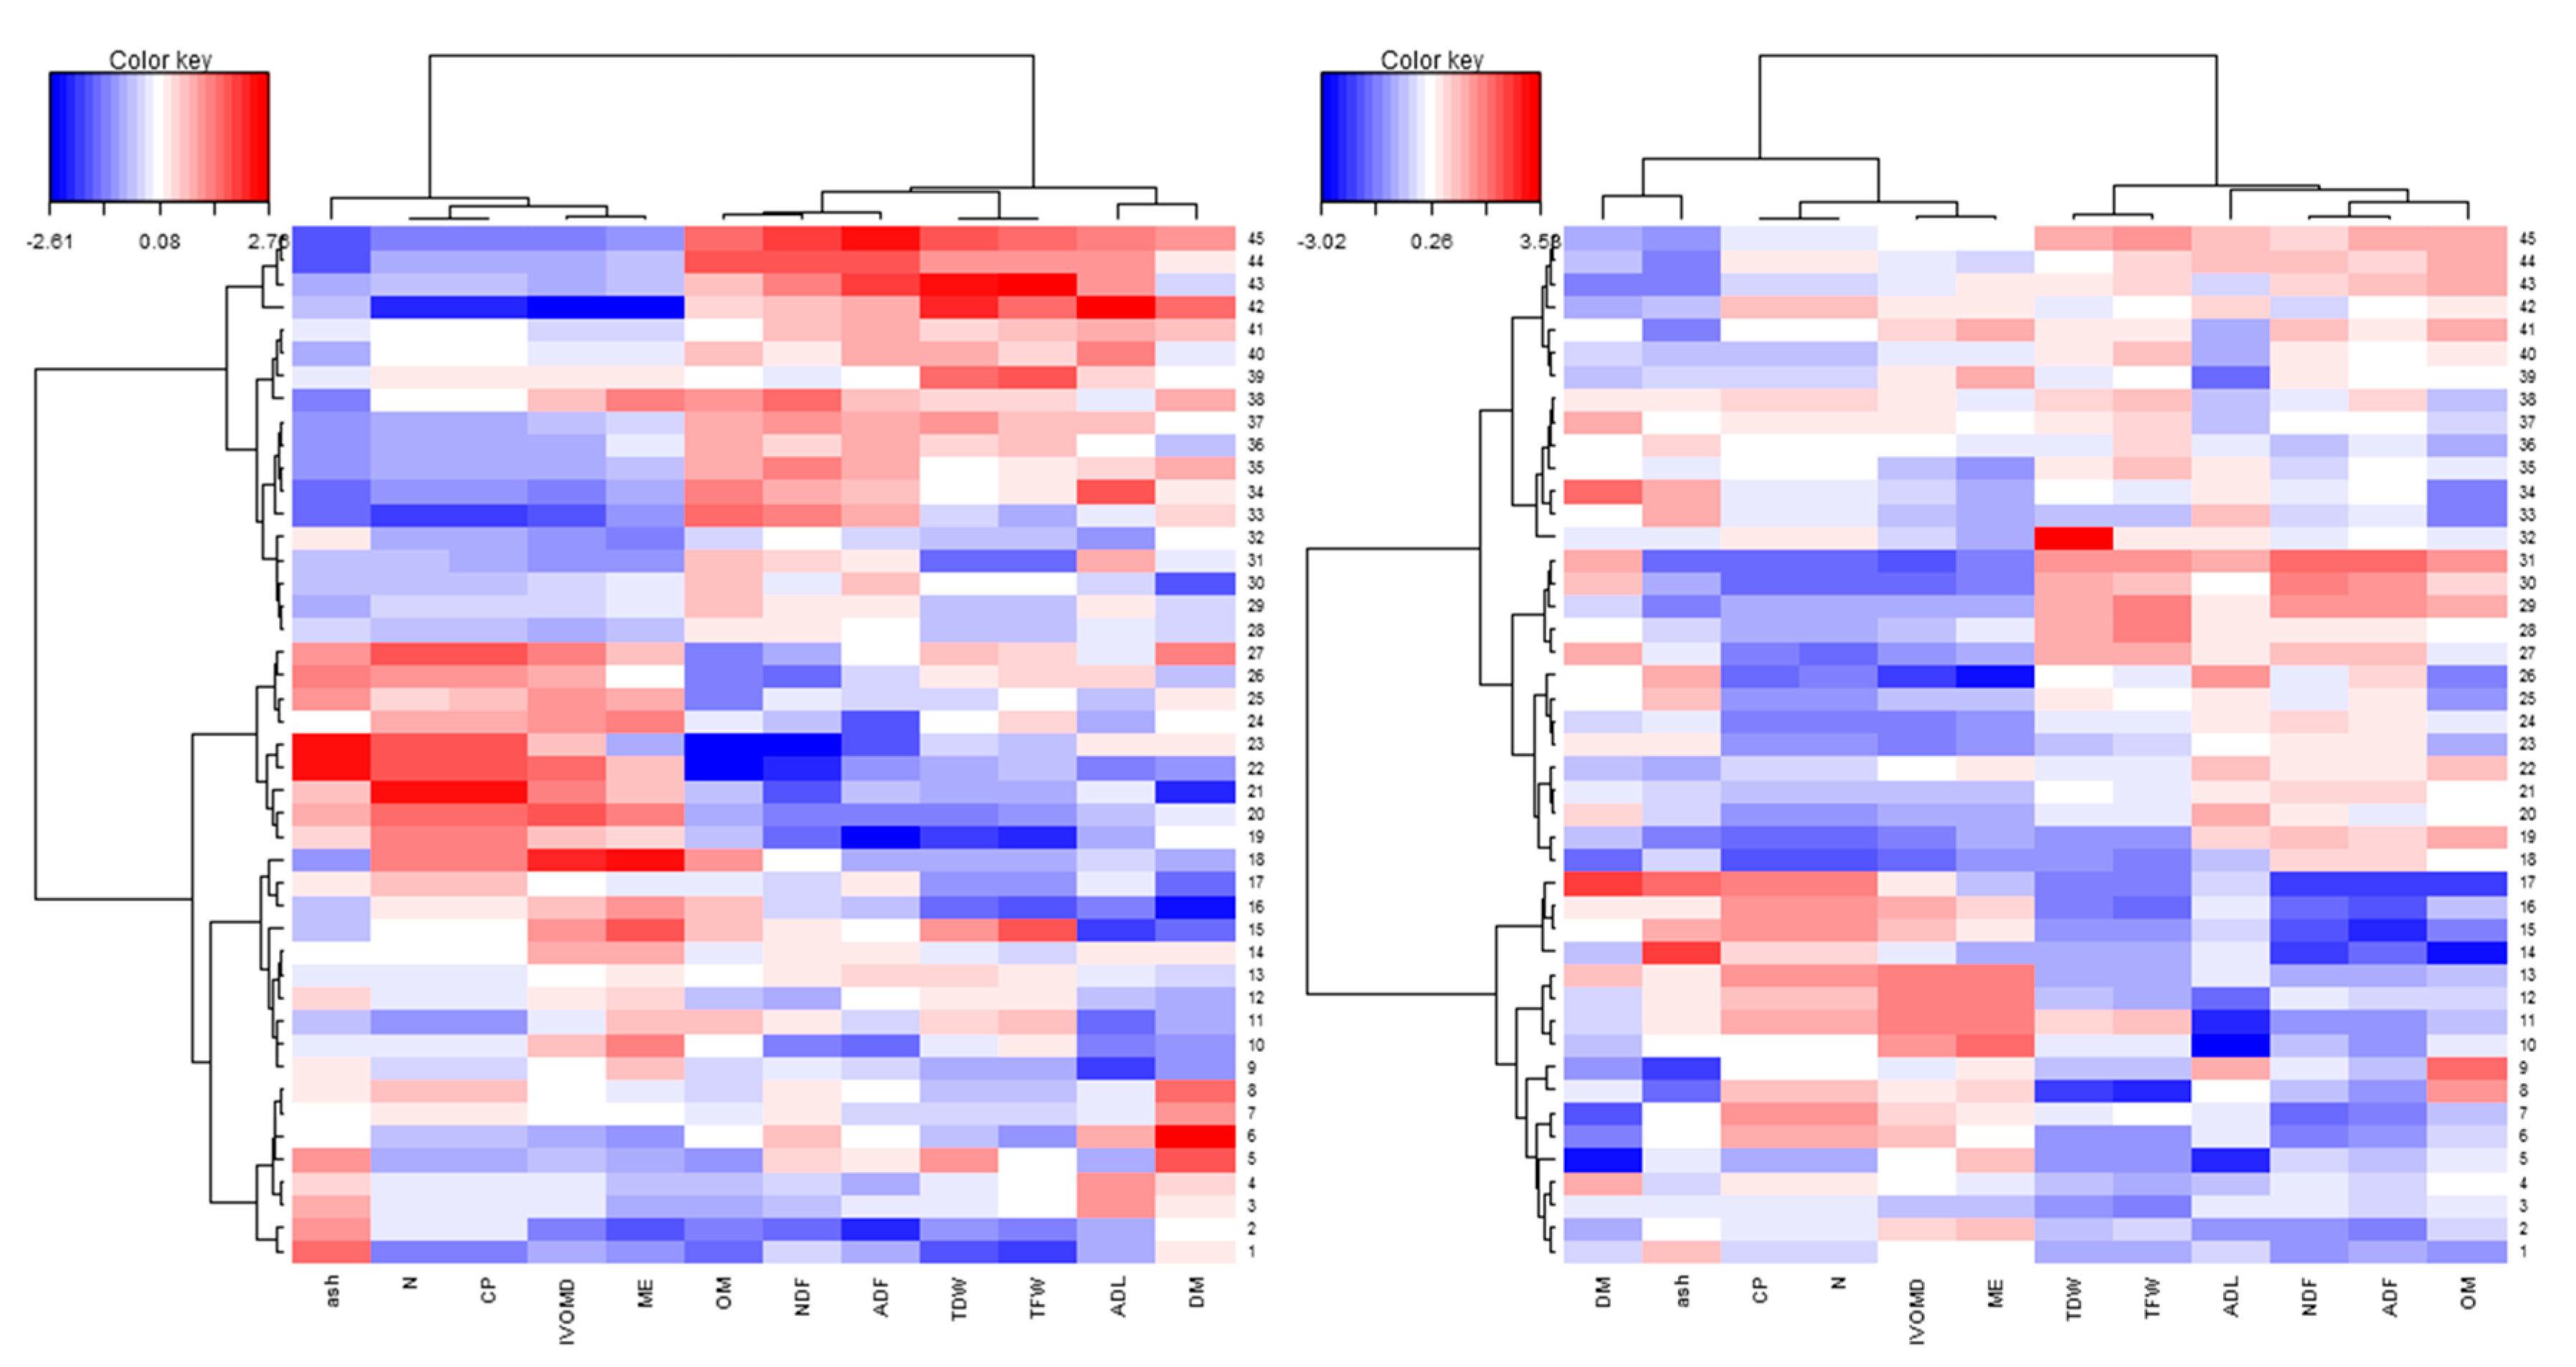
3.3. Phenotypic Variability and Association Between Biomass Yield and Feed Quality Traits

In order to understand the variation between genotypes and the correlation between traits, a pattern analysis was performed to depict patterns of genotypes using forage biomass and feed quality traits across the wet and dry season harvests (Figure 2; Table 6 and Figure A1, Appendix B). The biplot from the pattern analysis revealed that the first two principal components explain 70.8% and 68.3% of the total variation during the wet and dry season harvests, respectively (Figure 2). The first component (PC1) accounted for 53.0% and 48.4% of the total variation in the wet and dry season harvests, respectively. Of the different traits, CP and N were the main contributors during the wet season, while NDF and ADF were the main contributors during the dry season. The second component (PC2), mainly associated with DM, IVOMD, and ME, accounted for 17.8% and 19.9% of the total variation in the wet and dry season harvests, respectively. The biplot analyses revealed three cluster groups where genotypes in the first group are high in CP, IVOMD, and ME, while genotypes in the second group are high in TFW, TDW, NDF, and ADF, indicating that these groups of genotypes differ in their feed qualities and biomass yield. The genotypes in the third cluster were distributed between the two groups. For example, genotypes BAGCE 94, BAGCE 100, and CNPGL 94-13-1 are clustered in a group that performed best for forage biomass yield and were also high for fiber components, while CNPGL 92-133-3, CNPGL 00-1-1, and CNPGL 94-07-2 were clustered in a group that showed the lowest in IVOMD, ME, and CP percentages in both seasons, although this was associated with a lower biomass yield (Figure 2).
The degree of correlation among forage biomass yield (TFW and TDW) and feed quality traits are presented in Table 6. Forage biomass yield was positively correlated with NDF, ADF, ADL, and OM and negatively correlated with LSR, ash, CP, and N, in both wet and dry season harvests. Strong positive correlations were observed between the fiber traits, while the correlations of fiber traits with ash, CP, N, IVOMD, and ME were negative. The scaling relationship between TDW and feed quality traits (NDF, CP, IVOMD, and ME) is presented in Table 7. The slopes of linear regression between TDW and feed quality traits were statistically significant, except for LSR in the wet season, indicating that feed quality traits are allometrically associated with TDW (Table 7). The scaling slope increased slightly in the dry season compared to the wet season for the relationship between TDW and CP, IVOMD, and ME, while the scaling relationship between TDW and NDF was similar in both seasons. The scatter plot of the observed and predicted values indicated a decrease of CP, IVOMD, and ME as TDW increased, and NDF increased as TDW increased (Figure 3). Consequently, the results from both the pattern analysis and correlation analysis indicate that selection of genotypes for increased biomass yield could also increase the amount of fiber and simultaneously reduce the digestibility and protein content of the forage. Taken together, these results indicate the need for careful consideration when selecting for improved performance of Napier grass to support livestock productivity.

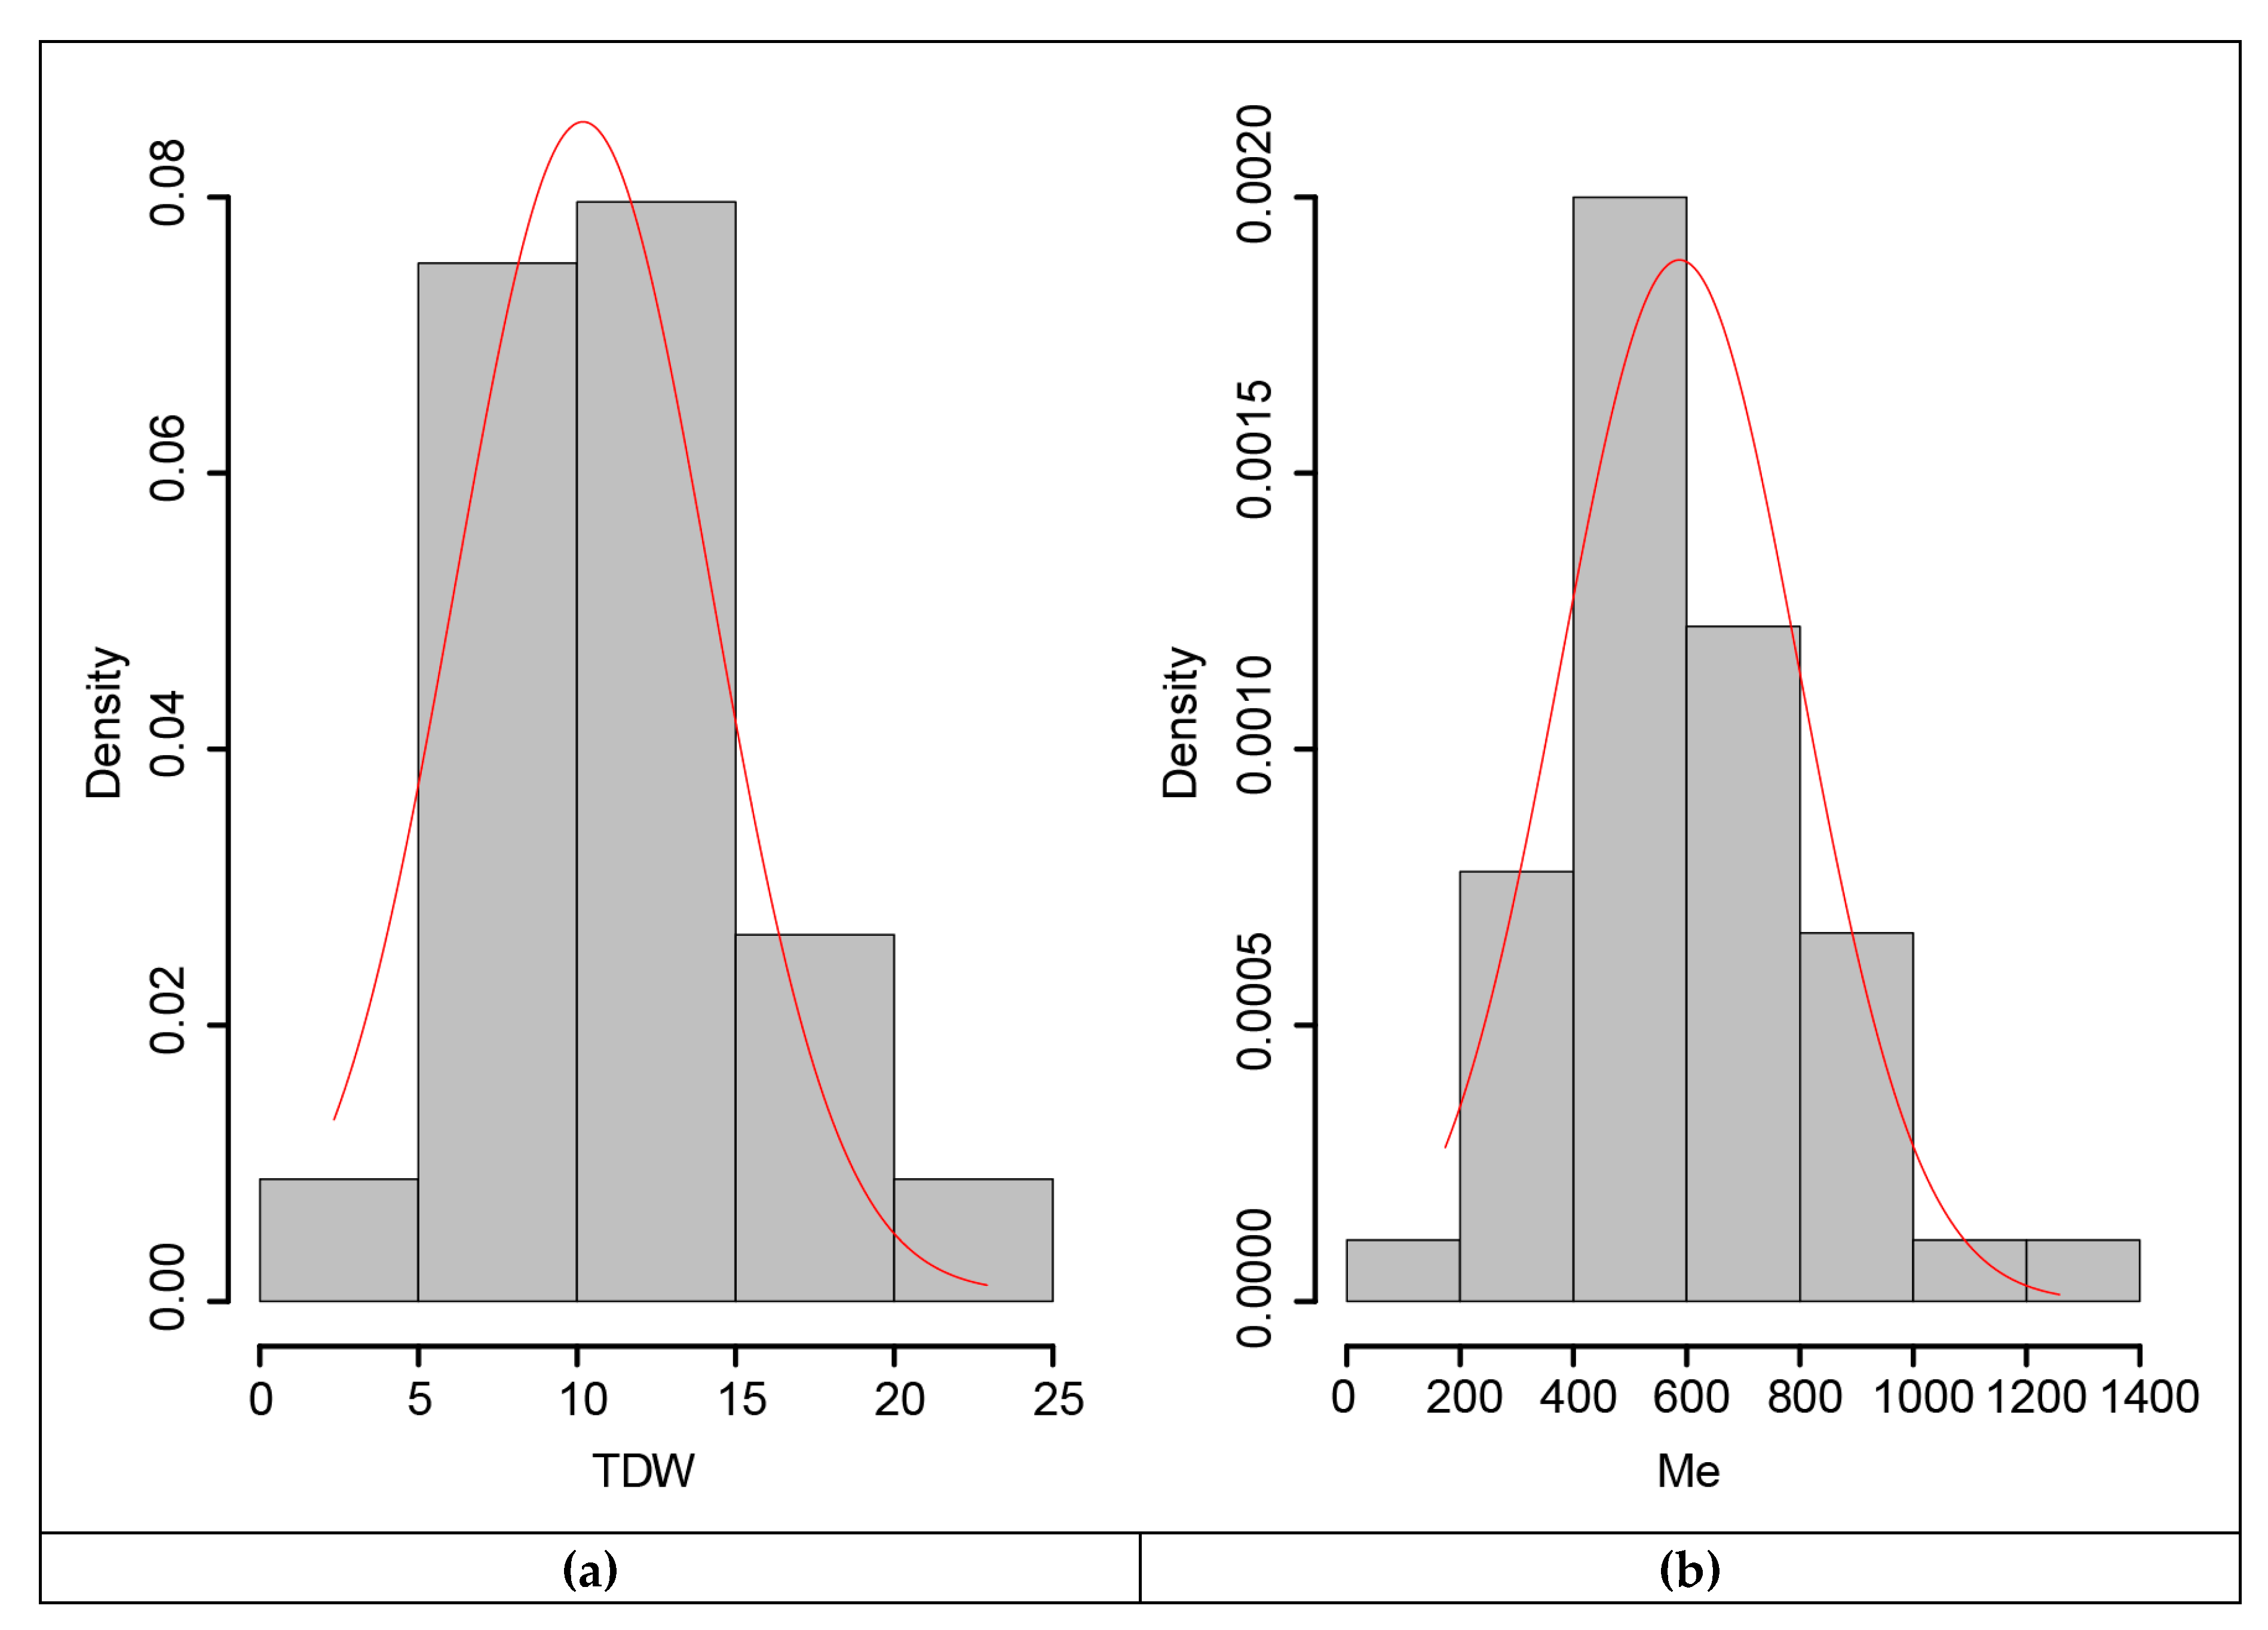
3.4. Cumulative Dry Weight and Metabolizable Energy Production of Genotypes

In order to evaluate forage performance, genotypes were assessed for the combination of TDW and ME as these traits are major components underpinning feed value. Genotypes BAGCE 94, BAGCE 100, BAGCE 53, and CNPGL 94-13-1 were highest for annual TDW. There was no significant differences in ME; in terms of MJ/Kg DM/year, the genotypes that produced the highest annual TDW also produced the highest ME yield (Table 8).

3.5. Marker-Trait Associations

For the association study, annual dry weight yields and the amount of metabolizable energy quantified for the 45 EMBRAPA Napier grass genotypes were used. Normality analysis showed the normal distribution of the data (Figure 4), which was also supported by a non-significant (Table 9) Shapiro-Wilk normality test [33], demonstrating the suitability of the data for analysis of variance (ANOVA) and genome-wide association study (GWAS) analyses. The broad-sense heritability values, which show the amount of the phenotypic variation in a population, attributed to the genetic differences between individuals, were calculated from the phenotypic variance across replications, which revealed broad-sense heritability values of above 60%, with 64% for annual dry weight yield and 65% for metabolizable energy (Table 9). Hence, the estimated broad-sense heritability values indicated that the variation observed in the traits was mainly due to genetic factors rather than environmental factors, further demonstrating the suitability of the traits in the collection for marker-trait association studies. Most feed quality component traits showed low heritability values and hence were not suitable for marker-trait association analysis.
Molecular markers used in the analysis were as previously described [16]. For the genome-wide association analysis, a total of 87,289 markers, comprising of 25,773 SNP and 61,516 silicoDArT markers, were used. The markers minor allele frequency (MAF) and missing values were greater than 5% and less than 10%, respectively. Association analysis using two statistical models, the mixed model using kinship matrix as a covariate (MM) and ANOVA, identified 64 SNP and 24 silicoDArT markers that were associated with dry weight yield at a −log10 p value threshold of > 2.5, using both models (Table A5; Appendix B). Similarly, 60 SNP and 23 silicoDArT markers were associated (−log10 p > 2.5) with the metabolizable energy trait. From the identified 88 markers, 82 markers were found to be associated with both traits, which would be anticipated as the dry weight is used in the quantification of cumulative metabolizable energy. A number of the markers were used to detect most of the high performing genotypes identified in the agronomic performance analysis. Although the genomic location of the majority of the associated markers was not identified in the pearl millet reference genome, at least one associated marker was detected on each of the seven chromosomes. Eleven of the associated markers were mapped on chromosome 3, potentially indicating the importance of the chromosome for future association analyses.

3.6. Analysis of Nucleotide Sequences Corresponding to the Associated Markers

Nucleotide sequences of the associated markers were retrieved from the available Napier grass genomic [30] and transcriptomic [31] sequence data by aligning the DArTseq short sequence reads (approximately 55 nucleotides (nt)) corresponding to each SilicoDArT marker (Supplementary Table S1). Seven of the SilicoDArT markers were aligned with the assembled genomic sequences [30]. The genomic sequences ranged from 278 to 6143 nt in length, which is suitable for the design of PCR primers, amplicon sequencing and in silico functional analysis of the associated markers. A total of 36 markers were able to be aligned with the transcriptome sequences (approximately 150 nt in length), indicating that many of the associated markers are found within the gene coding regions. For 23 of the markers, sequence annotation information was retrieved from the GeneBank NCBI databases using the blastx tool. Most of the annotated sequences were detected in the transcriptome sequences. Out of the eleven associated markers located on chromosome 3, five were annotated as a cytochrome P450, glutamate decarboxylase 2, mitochondrial fission protein ELM1 isoform X2, inositol transporter 2, and U-box domain-containing protein 35-like.

4. Discussion

4.1. Seasonal Variation Determines Forage Yield of Napier Grass Genotypes

The performance of introduced EMBRAPA Napier grass genotypes from Brazil was evaluated at Bishoftu, Ethiopia, for forage biomass yield and feed quality traits under sequential wet and dry season harvests, where the wet season is between May and September, while dry season extends from October to April in both 2016 and 2017 (Figure 1). Generally, the study revealed marked differences among genotypes for forage biomass yield and feed quality traits, which indicates the existence of genotypic variability amongst the genotypes. Similarly, season and genotype-by-season interaction significantly affected most of the traits, but their effect was more pronounced in forage biomass yield than feed nutrition quality traits. The seasonal change was reflected by the distinct distribution of rainfall (Figure 1) in the wet and dry seasons, which could greatly influence Napier grass plants growth and development in the respective seasons. For example, Napier grass genotypes in the trial had a lower LSR in the wet season than in the dry season, indicating that plant growth had been stimulated by the rains resulting in increased stem development during the wet season. Hence, for efficient exploitation of Napier grass, evaluation of forage performance relies on the evaluation of genotypes across years, particularly during the dry season, where major feed shortages affect livestock production and productivity.

4.2. Forage Yield of Napier Grass Genotypes

Forage biomass yield is one of the major targets in forage crop improvement, where fast-growing and high LSR types are preferred [34]. The current study revealed that TFW and TDW were higher in the wet season than in the dry season, indicating that moisture availability was a determinant factor for growth and development of Napier grass. For example, top productive genotypes BAGCE 94, BAGCE 100, and BAGCE 30 had mean TDW of 5.7 t/ha, 5.5 t/ha, and 4.9 t/ha, respectively, during the wet season, while in the dry season, their respective mean TDW were 2.5 t/ha, 1.64 t/ha, and 1.46 t/ha, respectively (Table A3; Appendix B). These results indicate that the potential performance for high levels of forage production is associated with adequate moisture levels in the soil. With regards to TDW in the wet season, TDW in the current study was much lower than previously reported [19,35] for some Napier grass genotypes from the ILRI collection grown under Ethiopian conditions. While these variations might be attributed to differences in genotype performance, the influences of the prevailing environmental conditions and agronomic management practices among these studies could not be ruled out.
In relation to LSR, the proportion of leaf to stem was higher in the dry season than the wet season, which indicated slower stem development during the dry season. In the wet season, the highest mean LSR was obtained from genotypes CNPGL 93-08-1, BAGCE 63, and BAGCE 80, with mean values of 4.9%, 4.8%, and 4.1%, respectively, while mean LSR values for top biomass producing genotypes had low to medium LSR values. Thus, top yielding genotypes can be classified as fast growing with a higher stem proportion, which might have implications in feed nutritive quality because leaves have been shown to have a high level of feed quality compared to the stem fraction [36].
Significant variation for TFW, TDW, and LSR was observed among genotypes, regardless of the season (wet or dry), indicating the existence of genetic variability among the Napier grass genotypes. As Napier grass is a perennial fodder, the identification of consistently productive cultivars across the seasons and years is an important parameter. Results from the current study showed that top biomass yielding genotypes in the dry season were also top producing during the wet season. Genotypes that show consistently high TDW throughout the wet and dry seasons were BAGCE 94, BAGCE 100, and BAGCE 53. These genotypes performed better than some of the current ILRI ‘best bet’ genotypes planted in a replicated trial in adjacent plots (Table A1 and Table A2, Appendix A), indicating the potential of these genotypes to be used for improved biomass yield in the tested environment. Under the Brazilian environment, however, BAGCE 53 was an early flowering and low biomass producing genotype [37], which indicates differential performance of this genotype in the respective environments.
The cumulative annual yield also reflects that these top yielding genotypes produced the highest annual forage yield and can therefore be selected for stable forage production across environments (Table 8). Furthermore, the observation of relatively high and considerable GCV and PCV values for TFW and TDW in the current study indicates the importance of the genotypic effect in the expression of these traits.

4.3. Genotypic Performance for Feed Nutritional Quality

Nutritional quality of forage crops depends mainly on the digestibility and amount of essential nutrients [38]. Results from the feed quality analyses revealed the presence of genotypic variability both in wet and dry seasons, but the GCV and PCV values were low for feed nutritional quality traits in this study, similar to a previous report [39] that showed low genotypic and phenotypic coefficient of variation for quality traits. In the present study, the mean NDF value of studied genotypes was higher than the maximum expected mean NDF value for forage grasses [40,41]; however, the observed mean value for IVOMD and CP contents were higher than the minimum requirement for maintaining ruminants [42,43]. In livestock production, energy is one of the limiting factors in animal performance [44]. ME is the commonly used trait for evaluating energy content of feed [45]. Napier grass genotypes were within the range of ME content for tropical grasses [44]. Genotypes that had the highest ME content were BAGCE 86, CNPGL 96-24-1, and CNPGL 93-08-1, both in wet and dry seasons. Overall, the observed nutritional performance of genotypes indicated that these genotypes could be an important resource for improving feed quality.
Generally, top biomass yielding genotypes had the highest fiber components, i.e., NDF and ADF, while the respective, CP, IVOMD, and ME values were low. In contrast, low forage biomass yielding genotypes had high CP, IVOMD, and ME, with low fiber components. It is also interesting to note that purple Napier grass genotypes, such as CNPGL 93-18-2, CNPGL 93-08-1, and CNPGL 92-133-3, had high CP and ME contents. These findings were consistent with the observed negative correlation between fiber components and CP, IVOMD, and ME. A previous report [46] also indicated that an increase in fiber components reduces cellular nutrients, such as crude protein and digestibility. Furthermore, a PCA partitioned the genotypes into three cluster groups; for example, genotypes in cluster one showed high CP, IVOMD, and ME values, while genotypes in cluster two showed high fiber components and forage biomass yield in both wet and dry seasons. The observed values of feed nutritional quality traits were highly dependent on the season for all Napier grass genotypes in this study. For example, fiber components NDF and ADF were higher in the wet season, while IVOMD, CP, and ME were lower in the wet season. A decline in organic matter digestibility and metabolizable energy during the wet season is associated with increased phenological development and forage production, which stimulates stem production, resulting in a higher stem proportion [47,48]. Functionally, this decline in digestibility is attributed to an increase in structural components and cell maturation [28]. Therefore, the increased concentration of CP, IVOMD, and ME during the dry season could potentially compensate for reduced forage biomass as reflected by relatively lower TDW and higher LSR in the dry season. However, it should be noted that our findings are not in agreement with the results of Reference [49], who reported a decline in CP, IVOMD, and ME values and an increase in NDF, ADF, and ADL in the dry season. These differences might be attributed to the phenological differences of plants at time of harvest.
In line with the scaling relationship between TDW and feed quality traits, the slopes were significantly different from 1 and tended to increase in the dry season compared to the wet season, which might show a flexible relationship between TDW and feed quality traits. The difference in CP, IVOMD, and ME between wet and dry seasons for the same TDW might indicate: (1) an increased structural development, such as stem elongation and reduced leaf area, which would negatively affect these traits; and (2) accurate comparison of genotypes for feed quality traits can be done by considering the effect of plant size [28]. In addition, the rapid decline in the dry season for CP, IVOMD, and ME as compared to the wet season might be attributed to an abiotic stress response due to increased temperature and reduced soil moisture in the dry season that could trigger fiber deposition within the cell wall [50,51]. The allometry based on TDW explained about 30% of the variation; hence, the residual variation would be an important factor to test the significant variation of feed quality traits among genotypes (Table 7). Furthermore, the observed low R2 value would indicate that prediction based on biomass yield alone might not explain the changes in feed quality traits (Table 7).
Top forage biomass yielding genotypes produced the highest cumulative annual ME yield, indicating increased annual forage biomass yield in high yielding genotypes complements the observed low ME content per kilogram of dry matter. This emphasizes that energy production, per se, coupled with forage biomass production is crucial for characterizing and selecting Napier grass genotypes for livestock/dairy production. Therefore, the efficiency of selection for improved feed quality performance is influenced by how traits are associated. For example, selection only for higher forage biomass yield could compromise CP, IVOMD, and ME. Since no genotypes were entirely high in TDW and ME, exploitation of plant breeding and marker assisted selection (MAS) could be an alternative strategy to develop improved Napier grass for both forage biomass yield and feed quality traits.

4.4. Markers Associated with Dry Weight Yields and Metabolizable Energy

Eighty-two markers (SNPs and SilicoDArTs) associated with annual dry weight yield and metabolizable energy were identified, using both the mixed model (MM) and ANOVA statistical model, in marker-trait association analysis. The MM was corrected with pairwise kinship matrix data, while the ANOVA model did not include any correction. As compared to MM, the ANOVA detected a higher number of markers associated with the traits. However, we report here only on markers detected by both models for robust selection. Many of the identified markers detected most of the high performing genotypes identified in the agronomic performance trial. Ten markers (most of them SNPs) were highly discriminant between high and low yielding genotypes. For example, the heterozygous form of one SNP marker (ID number 23617359) identified the top performing accessions for TDW and ME. However, four additional genotypes (BAGCE_93, BAGCE_1, BAGCE_97, and BAGCE_56, all high yielding) also showed the same heterozygous form of the maker. By using a combination of two SNP markers (ID numbers 23617359 and 30283369), two of the accessions (BAGCE_93 and BAGCE_1) were excluded, showing that the use of a combination of markers could improve the diagnostic ability of the markers.
The DArTseq genotyping platform [52] produces short sequence reads, averaging about 55 nt in length, corresponding to each of the SilicoDArT and SNP markers [12]. In this study, the short sequence reads corresponding to the associated markers were compared with previously reported Napier grass genomic [30] and transcriptome [31] sequences. Very few of the DArTseq sequence reads aligned with the assembled genomic sequences, as only assembled sequences longer than 200 nt were used in the comparison. However, many of the DArTseq reads aligned with the transcriptome sequences, indicating that many of the associated markers are found within the gene coding regions. DNA variation in the coding regions is likely to provide a significant contribution to adaptation and productivity [53]. One of these sequences (corresponding with marker 23644354) was annotated as an ‘enhanced ethylene response protein’, which is one of the genes involved in source-sink communication and sucrose-mediated regulation of starch synthesis [54].
A greater number of associations were detected on chromosome 3, which might indicate the position of quantitative trait locus (QTL) governing biomass yield and metabolizable energy. One of these associated markers was annotated as cytochrome P450. In a previous GWAS analysis in pearl millet [15], cytochrome P450 was associated with plant population, grain number, panicle number, and tiller numbers. Plant cytochrome P450s are involved in a wide range of biosynthetic pathways and play critical roles in the synthesis of lignins and various fatty acid conjugates, hormones, pigments, defense compounds, and signaling molecules [55].
The identified markers could be useful in the implementation of marker assisted selection in Napier grass to improve the efficiency and precision of selecting genotypes for higher dry weight and metabolizable energy. When compared to the field phenotyping and evaluation, the use of the markers is simpler and can save time, resources, and effort, as the selection can be carried out at the seedling stage. In addition, the markers can be important in the identification and mapping of QTLs controlling the traits [56]. In most of the associated markers, the minor allele frequency was associated with higher dry weight yield and metabolizable energy, hence, increasing the frequency of the minor alleles in the population by breeding could improve the productivity of Napier grass with crucial implications for livestock productivity.

5. Conclusions

Napier grass genotypes showed significant variation for forage biomass yield and feed nutritional quality traits under both wet and dry seasons. Furthermore, genotypic performance was highly influenced by season as reflected by higher forage biomass yield (TFW and TDW) in the wet season than in the dry season. It is interesting to note that top forage biomass producing genotypes under wet season conditions were also top yielding in the dry season. This signifies the inherent genotypic potential of Napier grass genotypes for high biomass production under different environments. Thus, the identification of genotypes with stable high yields across environments is essential for small scale livestock production systems. With regard to cumulative annual forage biomass production, genotypes BAGCE 94, BAGCE 100, and BAGCE 53 are identified as top forage biomass producers for the Bishoftu conditions. Feed nutritional quality traits, such as fiber components, were lower in the dry season, while CP, IVOMD, and ME were higher in the dry season due, at least in part, to a higher LSR. Overall, Napier grass genotypes with higher feed qualities in terms of CP and digestibility were identified suggesting the importance of these genotypes for future utilization. However, the results from the scaling relationship between feed quality traits with forage biomass suggested the need for considering structural changes of the genotypes for accurate feed quality evaluation. In terms of ME, the top forage biomass producing genotypes also had the highest ME yield per year. However, the respective ME per unit dry matter of the high biomass yielding genotypes were low to medium. GWAS analysis identified SNP and SilicoDArT markers that discriminate high biomass yielding Napier grass genotypes. The observation of some identified markers aligning with agronomic performance in pearl millet [47] might be important in implementing MAS in Napier grass to improve the efficiency and precision of selection for high dry matter yields and metabolizable energy.

Supplementary Materials

The following are available online at https://www.mdpi.com/2073-4395/10/4/542/s1, Table S1: Genomic and transcriptomic sequences corresponding with the associated DArT seq markers.

Author Contributions

Conceptualization, J.H. and F.J.d.S.L.; Methodology, J.H. and A.A.; Data curation, J.H. and E.H.; Formal analysis, E.H. and M.S.M.; Visualization, E.H., M.S.M., C.S.J. and A.M.S.; Writing—original draft preparation, E.H. and M.S.M.; Writing—review and editing, C.S.J., J.H., A.M.S., A.T.N. and J.C.M. All authors have read and agreed to the published version of the manuscript.

Funding

Financial support was provided by the Deutsche Gesellschaft für Internationale Zuammenarbeit (GIZ), ‘attributed funding’ as a contribution to the genetic resources collections of ILRI 2017 and the CGIAR Research Program on Livestock.

Acknowledgments

The authors would like to thank Tesfaye, Yirsaw Wubete and Fetene Argaw for their contribution to field data collection. The authors would also like to thank EMBRAPA for making their germplasm and breeding lines available for the study through the Africa Brazil Agricultural Innovation Marketplace Project. The authors also would like to thank Linkai Huang for providing genomic sequence of purple Napier grass genotype.

Conflicts of Interest

The authors declare no conflict of interest.

Appendix A

To compare the performance of EMBRAPA Napier grass genotypes with locally adapted Napier grass, best bet accessions from ILRI collections 14984, 16786, and 16837 were planted adjacent to experimental blocks of the current study. All agronomic practices from planting to harvesting and data collection on forage biomass and nutritional quality assessment were carried out simultaneously.
Table A1. Analysis of variance summary of agronomic traits and nutritional quality of best bets Napier grass genotypes between wet and dry season harvests.
TraitsRangeMean
WetDryWetDry
TFW (t/ha)5.92–45.561.4–19.7817.935.69
TDW (t/ha)1.01–8.330.36–4.013.381.2
LSR0.55–11.130.6–18.632.944.96
NDF%62.64–73.2961.23–73.2768.6266.33
CP%7.48–16.9513.25–22.4812.2317.04
ME (MJ/ Kg DM)7.3–9.178.13–9.518.128.74
Total fresh weight = (TFW); Total dry weight = (TDW); Leaf to stem ratio = (LSR); Neutral detergent fiber = (NDF); Crude protein = (CP); Metabolizable energy (ME).
Table A2. Mean values for agronomic traits and nutritional quality of best bets Napier grass genotypes across wet and dry season harvests.
GenotypesTFW (t/ha)TDW (t/ha)LSRNDF%CP%ME (MJ/Kg DM)
WetDryWetDryWetDryWetDryWetDryWetDry
1498423.97.414.261.291.395.868.8265.8212.6218.028.168.91
1678613.214.972.83.053.462.869.3667.7310.9315.797.968.58
1683718.97.273.71.553.815.167.6965.4313.1417.38.238.73
Total fresh weight = (TFW); Total dry weight = (TDW); Leaf to stem ratio = (LSR); Neutral detergent fiber = (NDF); Crude protein = (CP); Metabolizable energy (ME).

Appendix B

Table A3. Mean values of Napier grass genotypes for forage biomass yield traits and leaf to stem ratio.
Number CodesGenotypesTFW (t/ha)TDW (t/ha)LSR
WetDryWetDryWetDry
1BAGCE 120.536.23.561.41.85.62
2BAGCE 10028.17.845.531.642.994.48
3BAGCE 1613.583.832.230.822.513.83
4BAGCE 1720.493.723.240.82.17.86
5BAGCE 2221.75.393.521.111.885.66
6BAGCE 2418.632.572.910.593.626.33
7BAGCE 2513.946.592.621.642.028.39
8BAGCE 3026.737.054.91.461.737.45
9BAGCE 4319.073.973.250.961.678.4
10BAGCE 5322.628.24.291.691.744.8
11BAGCE 5625.347.184.351.461.512.9
12BAGCE 6315.155.112.411.244.875.85
13BAGCE 729.256.764.761.32.5611.42
14BAGCE 757.352.411.220.593.677.47
15BAGCE 8016.433.922.60.884.132.67
16BAGCE 8118.434.394.20.983.214.87
17BAGCE 8628.266.264.341.391.355.83
18BAGCE 9319.624.933.231.111.75.25
19BAGCE 9432.615.865.742.52.467.86
20BAGCE 9720.955.413.651.251.575.77
21CNPGL 00-1-118.694.492.970.951.65.35
22CNPGL 91-06-215.453.822.470.862.264.76
23CNPGL 91-11 -214.864.572.511.212.318.03
24CNPGL 91-25-115.633.52.640.71.734.25
25CNPGL 92-133-314.015.642.221.11.775.51
26CNPGL 92-190-111.172.592.010.651.754.92
27CNPGL 92-198-714.313.142.140.792.434.26
28CNPGL 92-38-214.987.172.51.72.954.82
29CNPGL 92-56-219.165.253.381.371.815.98
30CNPGL 92-66-312.77.352.421.732.237.3
31CNPGL 9279-216.586.542.941.341.915.78
32CNPGL 93 -37-523.015.393.641.142.016.47
33CNPGL 93-01-117.64.352.911.041.816.8
34CNPGL 93-04-221.244.53.781.122.953.87
35CNPGL 93-06-112.454.272.070.882.193.6
36CNPGL 93-08-111.853.291.790.814.947.33
37CNPGL 93-18-221.436.53.431.142.084.34
38CNPGL 93-32-28.963.161.650.73.046.11
39CNPGL 94-07-28.632.831.50.733.294.96
40CNPGL 94-13-121.457.484.041.643.884.3
41CNPGL 96-21-15.791.421.050.322.116.55
42CNPGL 96-23-113.865.642.211.171.917.4
43CNPGL 96-24-118.423.82.760.882.586.86
44CNPGL 96-27-318.816.843.191.372.274.56
45PIONEIRO21.564.973.711.091.467.14
SE0.890.20.791.390.21.6
Total fresh weight (TFW), total dry weight (TDW), leaf to stem ratio (LSR), and SE = standard error.
Table A4. Mean values of Napier grass genotypes for forage quality traits.
Number CodesGenotypesNDFCPIVOMDME
WetDryWetDryWetDryWetDry
1BAGCE 167.5165.7410.6516.1657.9464.218.018.69
2BAGCE 10068.1365.268.9915.4455.5463.67.728.62
3BAGCE 1667.3262.511.8717.8859.8265.128.248.67
4BAGCE 1766.4761.7211.4118.1158.965.358.118.68
5BAGCE 2268.0664.2110.7217.5557.5564.777.958.69
6BAGCE 2466.6362.2410.5918.2457.6965.597.928.72
7BAGCE 2569.0967.159.1414.7656.3362.577.888.49
8BAGCE 3069.7564.239.7516.8556.7263.497.888.5
9BAGCE 4368.4964.579.8516.6456.7764.267.98.69
10BAGCE 5368.5966.7410.0915.6557.2663.237.958.54
11BAGCE 5669.4964.4710.1317.3257.0864.627.938.64
12BAGCE 6367.4464.6310.4314.8257.4661.927.968.34
13BAGCE 76765.8410.9517.0758.0764.0588.6
14BAGCE 7566.5465.739.7414.4857.0662.577.898.52
15BAGCE 8067.4463.2710.8718.0957.8366.167.998.85
16BAGCE 8167.9165.1110.1215.1657.3262.927.918.51
17BAGCE 8667.4363.0910.8417.858.8566.018.178.83
18BAGCE 9368.9965.4610.0115.0457.262.87.938.5
19BAGCE 9468.8964.5210.2217.0357.263.817.928.53
20BAGCE 9769.2266.0210.7516.7558.5765.118.128.78
21CNPGL 00-1-165.5962.9410.5116.5658.5764.988.128.75
22CNPGL 91-06-267.4464.6110.31757.2164.567.918.64
23CNPGL 91-11 -267.5565.5411.2315.8957.9463.587.968.56
24CNPGL 91-25-163.9161.512.2418.3758.5664.777.98.57
25CNPGL 92-133-364.8562.3112.6718.0659.1365.018.068.7
26CNPGL 92-190-165.2764.3410.6516.2656.8163.457.828.55
27CNPGL 92-198-764.4861.3812.2617.2659.2964.238.058.55
28CNPGL 92-38-267.2566.0710.0614.8456.8963.097.858.53
29CNPGL 92-56-266.1864.4210.6415.1758.2163.538.038.58
30CNPGL 92-66-368.0467.6510.1914.5557.0462.247.878.47
31CNPGL 9279-267.6264.7810.817.0958.6564.848.078.67
32CNPGL 93 -37-567.7665.089.9715.357.1563.227.968.54
33CNPGL 93-01-166.3265.4110.6216.0157.6364.517.898.68
34CNPGL 93-04-266.0764.5412.2116.4159.1263.778.068.54
35CNPGL 93-06-166.646411.2716.3257.9863.757.988.54
36CNPGL 93-08-165.4663.0912.0916.2659.5264.468.128.67
37CNPGL 93-18-265.1363.6911.6616.6858.6164.327.998.63
38CNPGL 93-32-267.9466.1310.1314.8156.962.827.878.54
39CNPGL 94-07-266.7463.9210.8915.5458.4864.518.098.73
40CNPGL 94-13-167.5365.4410.7116.3657.7564.347.968.66
41CNPGL 96-21-165.2263.6811.8617.6258.4164.778.028.72
42CNPGL 96-23-166.9865.210.3516.0357.9564.798.048.77
43CNPGL 96-24-166.9664.4911.2217.5258.8766.168.078.85
44CNPGL 96-27-367.0565.3410.2815.9257.4564.17.968.64
45PIONEIRO67.5263.619.8616.8357.7165.688.058.86
SE0.710.750.640.910.750.970.090.11
Neutral detergent fiber (NDF); crude protein (CP); in vitro organic matter digestibility (IVOMD); metabolizable energy (ME); SE = standard error.
Table A5. SilicoDArT and single nucleotide polymorphisms (SNP) markers showing association with total dry weight (TDW) and metabolizable energy (ME), in mixed (MM) and ANOVA models (−Log10(p) > 2.5).
Marker IDTypePos.Marker AlleleMAFTDW (t/ha/yr)ME (MJ/t DM/yr)
MM
(−log10p)
ANOVA
(−log10p)
MM
(−log10p)
ANOVA
(−log10p)
30280861SNP0A/GG (0.46)4.305.184.625.22
30283847SNP0A/GG (0.18)3.583.713.463.48
30285085silicoDArT00/10 (0.27)3.394.543.504.67
23634398silicoDArT00/10 (0.37)3.325.063.405.25
23602557silicoDArT50/10 (0.29)3.275.313.165.20
30288908SNP4G/AA (0.12)3.154.853.245.00
23603266SNP0A/GA (0.36)3.134.803.444.84
23590251SNP4C/GG (0.36)3.335.143.325.15
23642045SNP0A/TA (0.32)3.754.503.824.59
23619626SNP0T/GG (0.32)3.064.033.084.20
23603845SNP0C/GG (0.37)3.634.613.554.56
18160886SNP3G/AG (0.47)3.044.033.054.07
30288066silicoDArT30/11 (0.30)3.035.383.015.43
23617359SNP0G/CC (0.49)2.984.412.954.43
30283369SNP0G/TG (0.49)3.153.003.163.08
23562266silicoDArT00/10 (0.45)2.914.252.884.24
23621857silicoDArT00/10 (0.19)2.904.742.824.50
30272381silicoDArT00/11 (0.16)2.854.912.764.74
23635042SNP4A/GG (0.16)2.835.342.855.44
23592313silicoDArT60/11 (0.41)2.834.352.794.30
23601388silicoDArT00/11 (0.42)2.784.212.794.20
23613458SNP0C/TT (0.40)2.753.052.713.07
23558691silicoDArT30/10 (0.36)2.723.512.663.49
23611461SNP3T/CC (0.19)2.694.432.794.60
30273188silicoDArT20/11 (0.16)2.694.102.563.94
30277167SNP0A/CC (0.27)2.985.102.995.20
23606642silicoDArT00/11 (0.23)2.653.322.563.17
30285860silicoDArT70/11 (0.29)2.655.242.655.30
23551315silicoDArT00/10 (0.39)2.643.152.593.14
23622292SNP3T/GT (0.39)3.304.753.304.73
23623489SNP0T/CC (0.28)2.624.312.684.41
18149799silicoDArT00/11 (0.40)2.624.042.674.09
23553829silicoDArT00/10 (0.20)2.622.832.602.88
23547174silicoDArT00/10 (0.20)2.622.922.602.97
23602556SNP0G/CC (0.36)2.603.532.613.63
23571406silicoDArT00/10 (0.23)2.604.352.664.45
23601207SNP0A/GG (0.43)2.594.342.624.41
23637406SNP1T/CC (0.34)2.583.822.563.92
23554509silicoDArT00/11 (0.27)2.575.342.545.33
23612094SNP0T/CT (0.46)2.562.55NSNS
23559758silicoDArT00/11 (0.27)2.563.59NSNS
17981556SNP5A/GG (0.13)2.564.532.564.58
23561721silicoDArT00/11 (0.44)2.554.042.624.16
30278234SNP0G/AA (0.17)3.064.683.004.62
23593708silicoDArT00/11 (0.35)2.533.752.533.69
23627155SNP0G/AA (0.32)2.524.362.544.41
23643473SNP4G/CG (0.34)2.522.65NSNS
23606518silicoDArT00/11 (0.45)2.513.822.583.95
23570280silicoDArT00/11 (0.45)2.513.822.583.95
23644354SNP0A/GA (0.29)2.804.492.834.64
23617372SNP0C/GC (0.41)2.994.222.964.20
23630423SNP5A/GA (0.17)3.034.522.994.40
23614288SNP3C/TT (0.34)3.005.333.065.41
23601541SNP0C/GG (0.45)2.944.242.994.40
23593756SNP0A/GG (0.38)2.803.682.823.78
23640208SNP3C/TT (0.14)2.914.122.904.14
23634735SNP0A/GG (0.24)NSNS2.535.16
30277688SNP0C/TT (0.38)2.574.012.564.05
23603310SNP0T/CC (0.26)2.605.162.625.23
23644438SNP0C/GG (0.34)2.574.012.604.04
23637089SNP3C/GC (0.30)2.564.72NSNS
23634691SNP0T/CC (0.40)2.803.452.743.37
23610213SNP0G/CG (0.41)2.833.552.823.60
9976877SNP0G/AA (0.45)2.884.392.924.56
23641842SNP5T/AT (0.40)2.874.052.864.24
23641967SNP3A/GG (0.29)2.844.092.864.06
23624048SNP0G/CC (0.47)2.584.872.625.00
23633468SNP5G/AG (0.39)2.773.932.734.02
30284244SNP0A/GA (0.42)2.753.862.794.05
9972908SNP0T/AA (0.30)2.625.072.645.21
23591173SNP4C/TT (0.30)2.814.602.834.74
23633785SNP3A/CA (0.36)2.563.042.573.08
23603083SNP0G/CG (0.36)2.653.392.573.42
23637508SNP4C/GC (0.26)2.764.862.784.80
30275343SNP6A/GG (0.39)2.744.372.744.51
23634506SNP6A/CA (0.46)2.764.152.794.26
23600245SNP0G/AG (0.41)2.624.132.644.24
23639712SNP5A/GG (0.33)2.515.092.535.14
23643649SNP0A/GA (0.50)2.582.77NSNS
23612910SNP7G/AA (0.39)NSNSNSNS
23612265SNP0C/TC (0.35)NSNS2NSNS
23637849SNP2T/CT (0.36)2.713.142.713.20
30290093SNP0C/TC (0.34)2.622.842.622.98
23624218SNP5A/GA (0.37)2.603.812.603.78
23609995SNP2A/GA (0.28)2.602.992.603.07
23598317SNP0T/CC (0.39)2.593.672.593.78
23622543SNP6T/CT (0.40)2.583.802.583.73
23624444SNP3G/CG (0.42)2.583.022.583.07
30286830SNP0A/GG (0.18)2.583.652.583.72
23612073SNP0T/CT (0.40)2.564.052.564.11
23602072SNP0C/TT (0.24)2.524.47NSNS
NA = chromosome position is not known; NS = not significant; MAF = the minor allele and its frequency; MM = mixed model; ANOVA = analysis of variance; Pos = position within chromosome.
Figure A1. Cluster heat-map of 45 Napier grass genotypes and 12 forage biomass and feed quality traits under wet season (right) and dry season (left) conditions. A heat map showing color pattern. Total fresh weight (TFW); total dry weight (TDW); dry matter (DM); organic matter (OM); minerals (ash); neutral detergent fiber (NDF); acid detergent fiber (ADF); acidic detergent lignin (ADL); total nitrogen (N); crude protein (CP); in vitro organic matter digestibility (IVOMD); metabolizable energy (ME).
Agronomy 10 00542 g0a1

References

  1. FAO. Feed Resources. Gateway to Dairy Production and Products. 2019. Available online: http://www.fao.org/dairy-production-products/production/feed-resources/en/ (accessed on 12 November 2019).
  2. Pandey, P.; Irulappan, V.; Bagavathiannan, M.V.; Senthil-Kumar, M. Impact of Combined Abiotic and Biotic Stresses on Plant Growth and Avenues for Crop Improvement by Exploiting Physio-morphological Traits. Front. Plant Sci. 2017, 8, 537. [Google Scholar] [CrossRef] [PubMed] [Green Version]
  3. Raza, A.; Razzaq, A.; Mehmood, S.S.; Zou, X.; Zhang, X.; Lv, Y.; Xu, J. Impact of climate change on crops adaptation and strategies to tackle its outcome: A review. Plants 2019, 8, 34. [Google Scholar] [CrossRef] [PubMed] [Green Version]
  4. Jorge, A.; Lukuyu, B.; Marita, C.; Mwangi, D.M.; Kinuthia, E.; Baltenweck, I.; Poole, J. Assessing the Uptake and Disease Impact of Napier Grass in Kenya; International Livestock Research Institute (ILRI): Nairobi, Kenya, 2014. [Google Scholar]
  5. Fekede, F.; Getnet, A.; Lulseged, G.; Muluneh, M.; Tadesse, T. Evaluation of Napier grass-vetch mixture to improve total herbage yield in the central highlands. In Proceedings of the 13th Annual Conference of the Ethiopian Society of Animal Production (ESAP), Addis Ababa, Ethiopia, 25–26 August 2005. [Google Scholar]
  6. Rusdy, M. Elephant grass as forage for ruminant animals. Livest. Res. Rural. Dev. 2016, 28, 49. [Google Scholar]
  7. Nyambati, E.M.; Muyekho, F.N.; Onginjo, E.; Lusweti, C.M. Production, characterization and nutritional quality of napier grass [Pennisetum purpureum (Schum.)] cultivars in western Kenya. Afr. J. Plant Sci. 2010, 4, 496–502. [Google Scholar]
  8. Bhandari, A.P.; Sukanya, D.H.; Ramesh, C.R. Application of isozyme data in finger printing Napiergrass (Pennisetum purpureum Schum.) for germplasm management. Genet. Resour. Crop Evol. 2006, 53, 253–264. [Google Scholar] [CrossRef]
  9. Singh, B.P.; Singh, H.P.; Obeng, E. Elephant grass. In Biofuel Crops: Production, Physiology and Genetics; Singh, B.P., Ed.; CAB International: Fort Valley, GA, USA, 2013; pp. 271–291. [Google Scholar] [CrossRef]
  10. Negawo, A.; Teshome, A.; Kumar, A.; Hanson, J.; Jones, C. Opportunities for Napier Grass (Pennisetum purpureum) Improvement Using Molecular Genetics. Agronomy 2017, 7, 28. [Google Scholar] [CrossRef] [Green Version]
  11. Samson, R.; Mani, S.; Boddey, R.; Sokhansanj, S.; Quesada, D.; Urquiaga, S.; Reis, V.; Lem, C. The potential of C4 perennial grasses for developing a global bioheat industry. Crit. Rev. Plant Sci. 2005, 24, 461–495. [Google Scholar] [CrossRef]
  12. Muktar, M.S.; Teshome, A.; Hanson, J.; Negawo, A.T.; Habte, E.; Domelevo entfellner, J.; Lee, K.; Jones, C.S. Genotyping by sequencing provides new insights into the diversity of Napier grass (Cenchrus purpureus) and reveals variation in genome-wide LD patterns between collections. Sci. Rep. 2019, 9, 1–15. [Google Scholar] [CrossRef] [Green Version]
  13. Paudel, D.; Kannan, B.; Yang, X.; Harris-Shultz, K.; Thudi, M.; Varshney, R.K.; Altpeter, F.; Wang, J. Surveying the genome and constructing a high-density genetic map of napiergrass (Cenchrus purpureus Schumach). Sci. Rep. 2018, 8, 1–11. [Google Scholar] [CrossRef]
  14. Wang, J.; Chen, Z.; Jin, S.; Hu, Z.; Huang, Y.; Diao, Y. Development and characterization of simple sequence repeat (SSR) markers based on a full-length cDNA library of Napier Grass (Pennisetum purpureum Schum). Genes Genom. 2017, 39, 1297–1305. [Google Scholar] [CrossRef]
  15. Varshney, R.K.; Shi, C.; Thudi, M.; Mariac, C.; Wallace, J.; Qi, P.; Zhang, H.; Zhao, Y.; Wang, X.; Srivastava, R.K.; et al. Pearl millet genome sequence provides a resource to improve agronomic traits in arid environments. Nat. Biotechnol. 2017, 35, 969–976. [Google Scholar] [CrossRef] [PubMed] [Green Version]
  16. Kariuki, I.W.; Mwendia, S.W.; Muyekho, F.N.; Ajanga, S.I.; Omayo, D.O. Biomass production and forage quality of head-smut disease Resistant Napier grass accessions. Afr. Crop Sci. J. 2016, 24, 157–165. [Google Scholar] [CrossRef] [Green Version]
  17. Kabirizi, J.; Muyekho, F.; Mulaa, M.; Kawube, G.; Msangi, R.; Pallangyo, B.; Zziwa, E.; Mugerwa, S.; Ajanga, S.; Lukwago, G.; et al. Napier Grass Feed Resource: Production, Constraints and Implications for Smallholder Farmers in Eastern and Central Africa; EAAPP: Naivasha, Kenya, 2015; ISBN 978-9970-9269-1-6. [Google Scholar]
  18. Wamalwa, N.I.; Midega, C.A.; Ajanga, S.; Omukunda, N.E.; Muyekho, F.N.; Asudi, G.O.; Mulaa, M.; Khan, Z.R. Screening Napier grass accessions for resistance to Napier grass stunt disease using the loop-mediated isothermal amplification of DNA (LAMP). Crop Prot. 2017, 98, 61–69. [Google Scholar] [CrossRef]
  19. Kebede, G.; Feyissa, F.; Assefa, G.; Mengistu, A.; Kehaliew, A.; Melese, K.; Mengistu, S.; Estifanos, T.; Wolde, S.; Abera, M. Agronomic performance, dry matter yield stability and herbage quality of Napier grass (Pennisetum purpureum (L.) Schumach) accessions in different agro-ecological zones of Ethiopia. J. Agric. Crop Res. 2017, 5, 49–65. [Google Scholar]
  20. Gashaw, T.; Asresie, A.; Haylom, M. Climate change and livestock production in Ethiopia. Academia. J. Environ. Sci. 2015, 2, 59–62. [Google Scholar] [CrossRef]
  21. Negawo, A.T.; Jorge, A.; Hanson, J.; Teshome, A.; Muktar, M.S.; Azevedo, A.L.; Ledo, F.J.; Machado, J.C.; Jones, C.S. Molecular markers as a tool for germplasm acquisition to enhance the genetic diversity of a Napier grass (Cenchrus purpureus syn. Pennisetum purpureum) collection. Trop. Grassl. Forrajes Trop. 2018, 6, 58–69. [Google Scholar] [CrossRef] [Green Version]
  22. Sunita Choudhary, S.; Hash, C.T.; Sagar, P.; Prasad, K.V.S.V.; Blümmel, M. Near infrared spectroscopy estimation of pearl millet grain composition and feed quality. In Proceedings of the 14th International Conference on NIR Spectroscopy, Bangkok, Thailand, 7 November 2009; Saranwong, S., Ed.; IM Publications: Chichester, UK, 2010. [Google Scholar]
  23. Velazco, J.G.; Rodriguez, M.X.; Boer, M.P.; Jordans, D.R.; Eilers, P.H.; Malosetti, M.; van Eeuwijk, E. Modelling spatial trends in sorghum breeding field trials using a two-dimensional P-spline mixed model. Theor. Appl. Genet. 2017, 130, 1375–1392. [Google Scholar] [CrossRef] [Green Version]
  24. Cullis, B.R.; Gleeson, A.C. Spatial analysis of field experiments—An extension to two dimensions. Biometrics 1991, 47, 1449–1460. [Google Scholar] [CrossRef]
  25. David, B.; Murray, D.; Payne, R.; Soutar, D. Genstat for Windows: Introduction, 19th ed.; VSN International: Hemel Hempstead, UK, 2017. [Google Scholar]
  26. Singh, R.K.; Chaudhary, B.D. Biometrical Method in Quantitative Genetics Analysis; Kalyani Publishers: New Delhi, India, 1985. [Google Scholar]
  27. Jahufer, M.Z.; Luo, D. DeltaGen: A Comprehensive Decision Support Tool for Plant Breeders. Crop Sci. 2018, 58, 1–14. [Google Scholar] [CrossRef] [Green Version]
  28. Lemaire, G.; Belanger, G. Allometries in Plants as Drivers of Forage Nutritive Value: A. Review. Agriculture 2020, 10, 5. [Google Scholar] [CrossRef] [Green Version]
  29. Rosyara, U.R.; de Jong, W.S.; Douches, D.S.; Endelman, J.B. Software for genome-wide association studies in autopolyploids and its application to potato. Plant Genome 2016, 9, 1–10. [Google Scholar] [CrossRef] [PubMed] [Green Version]
  30. Wang, C.; Yan, H.; Li, J.; Zhou, S.; Liu, T.; Zhang, X.; Huang, L. Genome survey sequencing of purple elephant grass (Pennisetum purpureum Schum Zise) and identification of its SSR markers. Mol. Breed. 2018, 38. [Google Scholar] [CrossRef]
  31. Zhou, S.; Wang, C.; Frazier, T.P.; Yan, H.; Chen, P.; Chen, Z.; Huang, L.; Zhang, X.; Peng, Y.; Yan, Y.; et al. The first Illumina-based de novo transcriptome analysis and molecular marker development in Napier grass (Pennisetum purpureum). Mol. Breed. 2018, 38, 95. [Google Scholar] [CrossRef]
  32. Li, H.; Durbin, R. Fast and accurate short read alignment with Burrows–Wheeler transform. Bioinformatics 2014, 14, 1754–1760. [Google Scholar] [CrossRef] [Green Version]
  33. Shapiro, S.S.; Wilk, M.B. An analysis of variance test for normality (complete samples). Biometrika 1965, 52, 591–611. [Google Scholar] [CrossRef]
  34. Capstaff, N.M.; Miller, A.J. Improving the Yield and Nutritional Quality of Forage Crops. Front. Plant Sci. 2018, 9, 535. [Google Scholar] [CrossRef] [Green Version]
  35. Gemiyo, D.; Jimma, A.; Wolde, S. Biomass Yield and Nutritive Value of Ten Napier Grass (Pennisetum purpureum) Accessions at Areka, Southern Ethiopia. World J. Agric. Sci. 2017, 13, 185–190. [Google Scholar] [CrossRef]
  36. Ball, D.M.; Collins, M.; Lacefield, G.D.; Martin, N.P.; Mertens, D.A.; Olson, K.E.; Putnam, D.H.; Undersander, D.J.; Wolf, M.W. Understanding forage quality. Am. FarmBureau Fed. Publ. 2001, 1, 1–3. [Google Scholar]
  37. Machado, J.C. (Embrapa, Brazil). Personal Communication. 2019. [Google Scholar]
  38. Minson, D.J. The Chemical Composition and Nutritive Value of Tropical Grasses. In Tropical Grasses; Skerman, P.J., Cameroon, D.G., Riveros, F., Eds.; Food and Agriculture Organization of the United Nations: Rome, Italy, 1990; pp. 172–180. [Google Scholar]
  39. Pattanashetti, S.K.; Upadhyaya, H.D.; Blummel, M.; Reddy, K.; Ramanareddy, Y.; Kumar, V.; Singh, S. Genetic variability in Napier grass (Pennisetum purpureum) germplasm conserved at ICRISAT genebank. In Proceedings of the 23rd International Grassland Congress, Delhi, India, 20–24 November 2015. [Google Scholar]
  40. Van Saun, R.J. Determining forage quality: Understanding feed analysis. Lamalink 2006, 3, 18–19. [Google Scholar]
  41. Van Soest, P.J. Nutritional Ecology of the Ruminant; Cornell University Press: Ithaca, NY, USA, 1982. [Google Scholar]
  42. Smith, O.B. Feed Resources for Intensive Smallholder Systems in the Tropics: The Role of Crop Residues. In Proceedings of the XVII International Grassland Congress, Rockhampton, Australia, 18–21 February 1993. [Google Scholar]
  43. Lazzarini, I.E.; Detmann, C.B.; Sampaio, M.F.; Paulino, S.C.V.; Filho, M.A.; Souza Oliveira, F.A. Intake and digestibility in cattle fed low quality tropical forage and supplemented with nitrogenous compounds. Rev. Bras. Zootec. 2009, 38, 2021–2030. [Google Scholar] [CrossRef] [Green Version]
  44. Mlay, P.S.; Pereka, E.C.; Phiri, S.; Balthazary, J.; Igusti, T.; Hvelpund, M.R.; Weisbjerg, J.M. Feed value of selected tropical grasses, legumes and concentrates. Vet. Arhiv 2009, 76, 53–63. [Google Scholar]
  45. Liu, W.; Liu, G.H.; Liao, R.B.; Chang, Y.L.; Huang, X.Y.; Wu, Y.B.; Yang, H.M.; Yan, H.J.; Cai, H.Y. Apparent metabolizable and net energy values of corn and soybean meal for broiler breeding cocks. Poult. Sci. 2017, 96, 135–143. [Google Scholar] [CrossRef]
  46. Silva, V.B.; Daheri, R.F.; Menzes, B.R.; Oliveira, M.L.; Araujo, M.S.; Novo, A.A. Different stability methods for cultivar recommendation in elephant-grass for energy purposes in Brazil. Cerne 2017, 23, 507–515. [Google Scholar] [CrossRef]
  47. Khaled, R.A.; Duru, M.; Cruz, P. Are leaf traits suitable for assessing the feeding value of native grass species? In Proceedings of the 20th International Grassland Congress, Dublin, Ireland, 26 June–1 July 2005; O’Mara, F.P., Wilkins, R.J., Mannetje’t, L., Lovett, D.K., Rogers, P.A.M., Boland, T.M., Eds.; Wageningen Academic Publishers: Wageningen, The Netherlands, 2005. [Google Scholar]
  48. Peiretti, P.G.; Gai, F.; Tassone, S. Nutritional value and fatty acid profile of Niger (Guizotia abyssinica) plant during its growth cycle. Livest. Res. Rural Dev. 2015, 27, 1–10. [Google Scholar]
  49. Evitayani, L.; Warly, A.; Fariani, T.; Fujihara, T. Seasonal changes in nutritive value of some grass species in west Sumatra, Indonesia. Asian Australas. J. Anim. Sci. 2004, 17, 1663–1668. [Google Scholar] [CrossRef]
  50. Ford, C.; Morrison, I.; Wilson, J. Temperature effects on lignin, hemicellulose and cellulose in tropical and temperate grasses. Aust. J. Agric. Res. 1979, 30, 621–633. [Google Scholar] [CrossRef]
  51. Liu, Y.; Wu, Q.; Ge, G.; Han, G.; Jia, Y. Influence of drought stress on afalfa yields and nutritional composition. BMC Plant Biol. 2018, 18, 13. [Google Scholar] [CrossRef] [Green Version]
  52. Kilian, A.; Wenzl, P.; Huttner, E.; Carling, J.; Xia, L.; Blois, H.; Aschenbrenner-Kilian, M. Diversity arrays technology: A generic genome profiling technology on open platforms. Methods Mol. Biol. 2012, 888, 67–89. [Google Scholar] [CrossRef]
  53. Victoria, L.S. Genomic Studies of Local Adaptation in Natural Plant Populations. J. Hered. 2018, 109, 3–15. [Google Scholar] [CrossRef] [Green Version]
  54. Lauria, M.; Molinari, F.; Motto, M. Genetic Strategies to Enhance Plant Biomass Yield and Quality-Related Traits for Bio-Renewable Fuel and Chemical Productions. In Book Plants for the Future; Intech Open: London, UK, 2015; pp. 99–133. [Google Scholar] [CrossRef] [Green Version]
  55. Schuler, M.A.; Werck-Reichhart, D. Functional Genomics of P450s. Annu. Rev. Plant Biol. 2003, 54, 629–667. [Google Scholar] [CrossRef]
  56. Kumar, S.; Hash, C.T.; Nepolean, T.; Satayayathi, C.T.; Singh, G.; Mahendrakar, M.D.; Yadav, R.S.; Srivastava, R.K. Mapping QTLs controlling flowering time and important agronomic traits in pearl millet. Front. Plant Sci. 2017, 8. [Google Scholar] [CrossRef] [PubMed] [Green Version]
Figure 1. Monthly temperature and precipitation data for 2016 and 2017. Source: Debrezeit Agricultural Research Center.
Agronomy 10 00542 g001
Figure 2. Biplots of pattern analysis of the first two principal components showing three cluster groups of the 45 Napier grass genotypes for 11 biomass yield and feed quality traits under: (a) wet season and; (b) dry season conditions. Total fresh weight (TFW); total dry weight (TDW); dry matter (DM); organic matter (OM); inorganic matter (ash); neutral detergent fiber (NDF); acid detergent fiber (ADF); acidic detergent lignin (ADL); crude protein (CP); in vitro organic matter digestibility (IVOMD); metabolizable energy (ME). Feed quality traits are expressed on dry matter bases (%DM) and forage yields are expressed in (t/ha). The blue, green, and pink colors depict the three cluster groups of Napier genotypes.
Agronomy 10 00542 g002
Figure 3. Relationship between neutral detergent fibre (NDF), crude protein (CP), invitro organic matter digestibility (IVOMD) and metabolizable energy (ME) with total dry weight (TDW) of 45 Napier grass genotypes during wet season (purple) and dry season (blue) harvests of observed data (a) and fitted data using allometric relationship (b) under Bishoftu, Ethiopia. Feed quality traits are expressed on dry matter bases (%DM) and TDW is expressed in (t/ha).
Agronomy 10 00542 g003
Figure 4. Histogram showing the normal distribution of the traits in the collection: (a) for annual dry weight yield and (b) metabolizable energy.
Agronomy 10 00542 g004
Table 1. Napier grass genotypes used in the study.
GenotypesScientific NameOriginCollectionGenotypesScientific NameOriginCollection
BAGCE 1Cenchrus purpureusColombiaEMBRAPA_
Collection
CNPGL 91-25-1Cenchrus purpureusNAEMBRAPA_
elite_line
BAGCE 7Cenchrus purpureusBrazilEMBRAPA_
Collection
CNPGL 92-133-3 *Cenchrus purpureusNAEMBRAPA_
elite_line
BAGCE 16Cenchrus purpureusBrazilEMBRAPA_
Collection
CNPGL 92-190-1Cenchrus purpureusNAEMBRAPA_
elite_line
BAGCE 17Cenchrus purpureusCosta RicaEMBRAPA_
Collection
CNPGL 92-198-7Cenchrus purpureusNAEMBRAPA_
elite_line
BAGCE 22Cenchrus purpureusNAEMBRAPA_
Collection
CNPGL 92-38-2Cenchrus purpureusNAEMBRAPA_
elite_line
BAGCE 24Cenchrus purpureusNAEMBRAPA_
Collection
CNPGL 92-56-2Cenchrus purpureusNAEMBRAPA_
elite_line
BAGCE 25Cenchrus purpureusIndiaEMBRAPA_
Collection
CNPGL 92-66-3Cenchrus purpureusNAEMBRAPA_
elite_line
BAGCE 30Cenchrus purpureusBrazilEMBRAPA_
Collection _
CNPGL 9279-2Cenchrus purpureusNAEMBRAPA_
elite_line
BAGCE 34Cenchrus purpureusBrazilEMBRAPA_
Collection
CNPGL 93 -37-5Cenchrus purpureusNAEMBRAPA_
elite_line
BAGCE 53Cenchrus purpureusBrazilEMBRAPA_
Collection
CNPGL 93-01-1Cenchrus purpureusNAEMBRAPA_
elite_line
BAGCE 56Cenchrus purpureusBrazil EMBRAPA_
Collection
CNPGL 93-04-2Cenchrus purpureusNAEMBRAPA_
elite_line
BAGCE 63Cenchrus purpureusCubaEMBRAPA_
Collection
CNPGL 93-06-1Cenchrus purpureusNAEMBRAPA_
elite_line
BAGCE 75Cenchrus purpureusBrazilEMBRAPA_
Collection
CNPGL 93-08-1 *Cenchrus purpureusNAEMBRAPA_
elite_line
BAGCE 80Cenchrus purpureusBrazilEMBRAPA_
Collection
CNPGL 93-18-2 *Cenchrus purpureusNAEMBRAPA_
elite_line
BAGCE 81Cenchrus purpureusBrazilEMBRAPA_
Collection
CNPGL 93-32-2Cenchrus purpureusNAEMBRAPA_
elite_line
BAGCE 86Cenchrus purpureusNAEMBRAPA_
Collection
CNPGL 94-07-2Cenchrus purpureusNAEMBRAPA_
elite_line
BAGCE 93Cenchrus purpureusNAEMBRAPA_
Collection
CNPGL 94-13-1 *Cenchrus purpureusNAEMBRAPA_
elite_line
BAGCE 94Cenchrus purpureusNAEMBRAPA_
Collection
CNPGL 96-21-1 *Cenchrus purpureusNAEMBRAPA_
elite_line
BAGCE 97Cenchrus purpureusNAEMBRAPA_
Collection
CNPGL 96-23-1Cenchrus purpureusNAEMBRAPA_
elite_line
BAGCE 100Cenchrus purpureusBrazilEMBRAPA_
Collection
CNPGL 96-24-1Cenchrus purpureusNAEMBRAPA_
elite_line
CNPGL 00-1-1Cenchrus purpureusNAEMBRAPA_
elite_line
CNPGL 96-27-3 *Cenchrus purpureusNAEMBRAPA_
elite_line
CNPGL 91-06-2Cenchrus purpureusNAEMBRAPA_
elite_line
PIONEIROCenchrus purpureusNAEMBRAPA_
elite_line
CNPGL 91-11 -2Cenchrus purpureusNAEMBRAPA_
elite_line
* Purple Napier grass genotypes. EMBRAPA = Empresa Brasileira de Pesquisa Agropecuária; NA = Not available.
Table 2. Analysis of variance summary of agronomic traits of Napier grass genotypes between wet and dry season harvests.
TraitStatisticsGenotypeSeasonG * SCV%
TFW (t/ha)MS295.25 ***45,668.33 ***150.65 ***49
R2%10355
TDW (t/ha)MS11.32 ***1015.35 ***4.26 ***41
R2%17367
LSRMS25.45 ***196.17 ***18.44 *52
R2%221723
Total dry weight (TDW), total fresh weight (TFW), leaf to stem ratio (LSR), mean square (MS), coefficient of determination (R2); genotype by season interaction (G * S); coefficient of variation (CV); * p < 0.05 (5%), ** p < 0.01 (1%), and *** p < 0.001 (0.1%).
Table 3. Ranges and genotypic and phenotypic coefficient of variation for agronomic traits of Napier grass genotypes across wet and dry season harvests.
TraitsRangeMeanGCV%PCV%
WetDryWetDryWetDryWetDry
TFW (t/ha)5.79–32.611.42–8.218.035.0230.3027.8230.8943.76
TDW (t/ha)1.05–5.740.32–2.53.081.1431.5226.3632.5134.29
LSR1.35–4.942.67–11.422.415.8739.2937.0490.5793.57
Total dry weight (TDW), total fresh weight (TFW), leaf to stem ratio (LSR), genotypic coefficient of variation (GCV), and phenotypic coefficient of variation (PCV).
Table 4. Analysis of variance summary of feed qualities of Napier grass genotypes across wet and dry season harvests.
TraitLeaf and StemLeaf
StatisticsGenotypeSeasonG * SCV%GenotypeSeasonG*SCV%
DMMS0.3 *0.15 *0.1 ns0.60.34 *0.01 ns0.08 ns0.6
R2%752712
OMMS6.31 ***3.43 ns2.14 ns1.77.07 ***14.35 **1.43 ns1.9
R2%14151413
ashMS6.30 ***10.75 **2.17 ns7.47.07 ***27.81 ***1.46 ns7.7
R2%13151413
NDFMS28.05 ***1446.82 ***7.04 ns3.728.37 ***1582.81 ***6.47 ns3.7
R2%1619417214
ADFMS23.28 ***4517.62 ***5.82 ns6.122.61 ***4346.15 ***5.79 *5.8
R2%1149312513
ADLMS0.61 ***93.3 ***0.15 ns10.50.64 ***96.89 ***0.14 ns10.7
R2%72427242
NMS0.35 *170.81 ***0.10 ns26.50.25 *163.38 ***0.11 ns26.2
R2%54023401
CPMS13.44 *6648.85 ***3.92 ns26.39.97 *6362.67 ***4.17 ns26
R2%44023401
IVOMD%MS13.36 *8109.84 ***3.79 ns6.39.57 *8014.08 ***4.18 ns6.4
R2%34112411
MEMS0.16*85.81 ***0.05 ns1.50.13 *83.56 ***0.05 ns5.7
R2%33522331
Feed quality traits are expressed on a dry matter basis (%DM); dry matter (DM); organic matter (OM); minerals (ash); neutral detergent fiber (NDF); acid detergent fiber (ADF); acidic detergent lignin (ADL); total nitrogen (N); crude protein (CP); in vitro organic matter digestibility (IVOMD); metabolizable energy (ME); mean square (MS), coefficient of determination (R2); genotype by season interaction (G * S); coefficient of variation (CV); ns = non-significant, * p < 0.05 (5%), ** p < 0.01 (1%), and *** p < 0.001 (0.1%).
Table 5. Ranges and genotypic and phenotypic coefficient of variation for feed qualities of Napier grass genotypes.
SeasonTraitLeaf and StemLeaf
RangeMeanGCV%PCV%RangeMeanGCV%PCV%
Wet SeasonDM91.00–91.8091.370.190.3490.90–91.6491.380.180.31
OM79.06–82.4281.091.071.6478.17–82.5880.941.061.64
ash17.70–21.0719.054.627.0217.53–21.9619.194.516.95
NDF63.91–69.7567.152.283.1963.29–69.2867.162.083.19
ADF34.70–40.1237.53.34534.35–39.4537.523.114.81
ADL4.26–5.274.684.688.794.27–5.314.744.998.85
N1.44–2.031.71815.081.53–1.991.76.5813.48
CP9.00–12.6710.717.9815.049.57–12.4410.636.7612.96
IVOMD55.54–59.8257.841.573.1655.92–59.5757.471.412.85
ME7.72–8.247.981.232.627.72–8.157.921.132.46
Dry SeasonDM91.06–91.7591.40.150.2891.02–91.6791.370.190.29
OM79.42–82.1480.960.761.2579.02–81.7480.670.771.32
ash18.09–20.7319.283.125.1818.46–21.1219.573.125.37
NDF61.38–67.6564.482.553.5560.90–67.1264.362.693.63
ADF29.57–35.6232.784.866.8629.66–35.7132.884.926.87
ADL3.41–4.2944.5610.583.62–4.434.044.3810.24
N2.32–2.942.636.7813.52.30–2.902.66.7412.21
CP14.48–18.3716.446.7713.5114.38–18.1516.246.6812.42
IVOMD61.92–66.1664.171.493.5362.04–66.1063.771.443.24
ME8.34–8.868.631.1538.32–8.818.561.112.84
Feed quality traits are expressed on a dry matter basis (%DM); genotypic coefficient of variation (GCV); phenotypic coefficient of variation (PCV); dry matter (DM); organic matter (OM); minerals (ash); neutral detergent fiber (NDF); acid detergent fiber (ADF); acidic detergent lignin (ADL); total nitrogen (N); crude protein (CP); in vitro organic matter digestibility (IVOMD); metabolizable energy (ME).
Table 6. Correlation between agronomic and forage quality traits in the wet season (below diagonal) and dry season (upper diagonal) harvests.
TraitsTDWTFWLSRNDFADFADLDMOMashCPNIVOMDME
TDW 0.86 ***−0.32 *0.52 ***0.63 ***0.180.140.23−0.24−0.30 * −0.30 * −0.31 * −0.26
TFW0.96 *** −0.280.55 ***0.66 ***0.130.110.24−0.25−0.30 * −0.30 * −0.26−0.18
LSR−0.47 **−0.38 * −0.36 *−0.14−0.07−0.170.140.130.31 *0.31 *0.37 *0.31 *
NDF0.51 ***0.44 ** −0.48 ** 0.94 ***0.29 * 0.080.68 ***−0.69 ***−0.75 ***−0.75 ***−0.62 ***−0.36 *
ADF0.67 ***0.62 ***−0.120.83 *** 0.38 ** 0.070.50 ***−0.52 ***−0.74 ***−0.74 ***−0.68 ***−0.48 ***
ADL0.47 ** 0.40 ** −0.36 *0.42 ** 0.57 *** 0.240.15-0.19−0.29−0.29−0.59 ***−0.67 ***
DM0.240.11−0.150.38 * 0.20.46 ** −0.270.270.030.03−0.13−0.30 *
OM0.39 ** 0.38 * −0.130.83 ***0.67 ***0.33 * −0.02 −1.00 ***−0.27−0.27−0.140.12
ash−0.41 ** −0.39 ** 0.18−0.83 ***−0.67 ***−0.34 * 0−1.00 *** 0.280.290.18−0.08
CP−0.36 * −0.270.22−0.73 ***−0.56 ***−0.31 * −0.27−0.58 ***0.59 *** 1.00 ***0.84 ***0.59 ***
N−0.36 * −0.270.22−0.73 ***−0.56 ***−0.31 * −0.27−0.58 ***0.59 ***1.00 *** 0.84 ***0.59 ***
IVOMD−0.29−0.170.12−0.57 ***−0.51 ***−0.50 ***−0.38 *−0.40 ** 0.42 ** 0.87 ***0.87 *** 0.91 ***
ME−0.18−0.050.11−0.26−0.33 * −0.58 ***−0.46 **−0.020.040.60 ***0.60 ***0.89 ***
Feed quality traits are expressed on dry matter bases (%DM) and forage yields are expressed in (t/ha); total dry weight (TDW); total fresh weight (TFW); leaf to stem ratio(LSR); neutral detergent fiber (NDF); acid detergent fiber (ADF); acidic detergent lignin (ADL); dry matter (DM); organic matter (OM); minerals (ash); crude protein (CP); in vitro organic matter digestibility (IVOMD); metabolizable energy (ME); * p < 0.05 (5%), ** p < 0.01 (1%), and *** p < 0.001 (0.1%).
Table 7. Allometric relationships between feed quality and leaf to stem ratio traits with total dry weight of Napier grass genotypes in wet and dry harvest seasons.
Response VariableHarvest SeasonFixed VariableLinear RegressionTest1 (p-Value)R2 (%)
LSRWetTDWy = −1.23x + 2.080.1922
LSRDryTDWy = −3.1x + 4.46<0.00129
NDFWetTDWy = 1.04x + 1.82<0.00123
NDFDryTDWy = 1.04x + 1.81<0.00122
CPWetTDWy = −1.20x + 1.030.00438
CPDryTDWy = −1.32x + 1.21<0.00136
IVOMDWetTDWy = −1.04x + 1.770.00431
IVOMDDryTDWy = −1.07x + 1.81<0.00132
MEWetTDWy = −1.02x + 0.910.01333
MEDryTDWy = −1.04x + 0.94<0.00138
All data were log10-transformed before analysis; Leaf to stem ratio (LSR), neutral detergent fiber (NDF), crude protein (CP) in vitro organic matter digestibility (IVOMD), metabolizable energy (ME), total dry weight (TDW), R2, determination coefficient, standard error (S.E.). Test1 (p-value) indicates the statistical significance of the slope value being different from 1.
Table 8. Annual total dry weight and metabolizable energy of the 45 Napier grass genotypes.
GenotypeTDWMEME YieldGenotypeTDWMEME Yield
(t/ha/year)(MJ/Kg DM/year)(MJ/ha/Year)(t/ha/year)(MJ/Kg DM/year)(MJ/ha/Year)
BAGCE 9424.51a51.351258.59aBAGCE 9310.42lm51.28534.39klm
BAGCE 10020.25b51.021033.16bCNPGL 00-1-110.38lm52.59545.93lmn
BAGCE 5318.29c51.46941.2cCNPGL 93-01-110.38lm51.73536.95lmn
CNPGL 94-13-116.13d51.88836.82dBAGCE 179.89mn52.39518.14mno
BAGCE 3016.07d51.15822.05deCNPGL 96-23-19.82mn52.45515.06mno
BAGCE 715.75d51.79815.62deBAGCE 809.73mn52.5510.83mno
BAGCE 5615.65d51.73809.53 deCNPGL 91-11-29.73mn51.56501.68mnop
BAGCE 8615.57d52.99825.13deBAGCE 639.71mn50.91494.34mnop
BAGCE 8115d51.27769.05eCNPGL 92-133-39.06no52.27473.59nopq
CNPGL 96-27-313.53e51.8700.85fCNPGL 91-25-19.06no51.42465.82nopq
CNPGL 93-04-213.4ef51.78693.85fCNPGL 96-24-19.04no52.75476.88opq
CNPGL 93 -37-513.22efg51.51680.94fCNPGL 91-06-28.83no51.66456.16opq
BAGCE 9713.06efgh52.72688.47fgBAGCE 168.49op52.72447.59pqr
BAGCE 112.99efgh52.09676.65fghCNPGL 93-06-18.14opq51.54419.54qrs
BAGCE 2212.83efghi51.89665.75fghBAGCE 247.64pq51.93396.75rs
PIONEIRO12.47efghij52.72657.42fghiCNPGL 92-198-77.22qr51.8374st
CNPGL 92-66-312.23fghijk51.03624.15ghijCNPGL 92-190-16.56rs48.25316.54tu
CNPGL 92-56-212.12ghijk51.83628.23ghijCNPGL 93-08-16.48rs52.39339.49tu
CNPGL 93-18-211.93hijk51.85618.57hijCNPGL 93-32-26.22rs51.23318.66u
BAGCE 2511.74ijk51.13600.27ijkCNPGL 94-07-25.56s52.48291.79u
BAGCE 3411.49jkl51.77594.84jklBAGCE 754.53t51.23232.07v
CNPGL 92-38-211.41jkl51.13583.39jklCNPGL 96-21-13.34u52.22174.41w
CNPGL 9279-211.13kl52.22581.21jkl
ME yield is the product of the annual TDW and the annual ME; means with different letters in the same column are significantly different at p < 0.05.
Table 9. Estimated generalized heritability (H2g), ANOVA and normal distribution of the phenotypic traits used in marker-trait association analysis.
FactorsTDW (t/ha/yr)ME (MJ/t DM/yr)
Generalized heritability (H2g)0.640.65
ANOVA-p-value (geno)2.2 × 10⁻¹⁶ ***2.2 × 10⁻¹⁶ ***
ANOVA-p-value (rep)2.2 × 10⁻¹⁶ ***1.89 × 10⁻¹⁰ ***
p-value for Shapiro-Wilk normality test0.19970.2677
Total dry weight = (TDW); Metabolizable energy = (ME). *** p < 0.001 (0.1%).

