Article

Agronomic Responses of Soybean Genotypes to Starter Nitrogen Fertilizer Rate

1
Institute for Animal Husbandry, Autoput 16, 11080 Belgrade-Zemun, Serbia
2
Agrounik doo, Milana Uzelca 11, 11080 Belgrade-Zemun, Serbia
3
Faculty of Agriculture, University of Belgrade, Nemanjina 6, 11080 Belgrade-Zemun, Serbia
4
Maize Research Institute “Zemun Polje”, Slobodana Bajića 1, 11185 Belgrade-Zemun, Serbia
*
Author to whom correspondence should be addressed.
Agronomy 2020, 10(4), 535; https://doi.org/10.3390/agronomy10040535
Submission received: 9 March 2020 / Revised: 3 April 2020 / Accepted: 5 April 2020 / Published: 9 April 2020

Abstract

:
The main nitrogen (N) sources in soybean production originate from soil fixing bacteria Bradyrhizobium spp. and from mineralization of soil organic N. These sources of N are often not sufficient to cover the N needs of the soybean. The present two-year field study aimed to evaluate the effects of soybean genotypes (Valjevka and Galina) and rates of starter fertilizer N (0, 30, 60, and 90 kg ha−1) on quantitative and qualitative parameters and on rain use efficiency (RUE) under contrasting weather conditions in the Pannonian region of Serbia. A field study conducted during two different growing seasons: first year with unfavorable weather conditions and second year with favorable weather conditions. As expected, the quantitative parameters, oil content, and RUE were higher in the year with favorable growing season, the second one. According to measured parameters, the genotype Valjevka performed higher yield potential as compared to the genotype Galina. The highest values of quantitative parameters and RUE were recorded at 60 kg N ha−1, protein content at 90 kg N ha−1 and oil content 0 kg N ha−1 (control). This study suggests that proper genotype selection and application of 60 kg N ha−1 as a starter dose with rhizobial inoculation could contribute to the high yield, while protein could be altered by N amount, independently on genotype.

1. Introduction

Soybean (Glycine max [L.] Merr.) is one of the most essential most important annual legumes worldwide and considered as the top-traded commodities due to its multiple uses for human and animal nutrition as well as industrial processing (source of protein and oil and biodiesel component) [1,2]. In Serbia, the soybean is grown on about 200,000 ha with an average yield of 3.3 t ha−1 and with a production of 645,607 tons in 2018 [3]. On average, seed yields of soybean in the world and Europe are lower than in Serbia for 0.5 t ha−1 and 1.2 t ha−1, respectively [3]. In Serbia, domestic cultivars with a high yield potential of about 6 t ha−1 dominate in the sowing structure [4]. However, average soybean seed yield in Serbia is unstable and could vary between 1.2 t ha−1 (2000) to 3.6 t ha−1 (2014), as a result of insufficient and unequal precipitation during the growing season [5]. The exploitation of genetic potential is possible with cultivation of genotypes suitable to different climatic conditions and application and adoption of modern agro-technology in production. Soybean production is based on the utilization of N from the soil and from the atmosphere by nitrogen-fixing bacteria as inoculants. The biological N fixation in soybean plants provides 50–60% of the N needs [6]. These sources of N are often not sufficient to cover the N needs of the soybean as the plants requirements for N increase after R5 stage of development, when the N fixation activity decreases [7]. What is more, the plants have greater requirements for photosynthesis products, which can cause nodule ageing [8]. Thus, Hoshi [9] estimated that for production of 1 t of soybean seeds, 70 to 90 kg of N needs to be applied. The biological N fixation and starter mineral N fertilization can increase seed yield, protein content and nutrient uptake [10]. Thus, Salih et al. [11] reported that inoculation of seeds with Bradyrhizobium spp. simultaneously with 36 kg N ha−1 promoted plant growth and produced higher soybean yield. Janagard and Ebadi-Segherloo [12] also found the highest plant height, stem dry weight per plant, pods dry weight per plant, biological yield, seeds per plant and seed yield with the application of 50 kg N ha−1 urea + seed inoculation. Ntambo et al. [13] found no significant differences between 50 kg N ha−1 + seed inoculated with Bradyrhizobium japonicum and 200 kg N ha−1 + seed non-inoculated under field conditions in Zimbabwe for plant height, pods number, pods dry weight and seed yield. Taylor et al. [14] concluded that the rate of 60 to 70 kg N ha−1 maximized yield and dry matter accumulation at the R1 stage grown of soybean. Gai et al. [15] found that the 50 kg N ha−1 applied as starter fertilizer promoted root activity, leaf photosynthesis and seed yield of soybean. Also, it should be noted that the starter N fertilization may reduce nodulation, N2 fixation and yield of soybean [16] and that it is not always an acceptable solution to increase soybean yield.
The objectives of this study were to determine the impact of climatic conditions and starter N fertilization rate on quantitative and qualitative parameters of two soybean genotypes and to determine the correlation between studied parameters. It was hypothesized that N fertilization at the sowing time enables better N supplies to soybean plants during the growing season. Appropriate agronomic management, including starter N input, could reflect positively on the increase of quantitative and qualitative parameters of the soybean crop, particularly in the years with variable weather conditions.

2. Materials and Methods

2.1. Experimental Details and Treatments

The experiments were carried out under rain fed at an experimental station in the northwestern Serbia (Latitude: 44° 99′ N, Longitude: 19° 97′ E, Altitude; 110 m) during the 2009 and 2010 growing seasons. Two soybean genotypes Valjevka and Galina (indeterminate plant growth habit erect, maturity group 0) were tested at four starter rates of N (0, 30, 60 and 90 kg ha−1). In both research years, preceding crop was winter wheat. Phosphorus and potassium were applied in autumn at a rate of 60 kg P ha−1 and 60 kg K ha−1, while N fertilizer urea (46% of N in amide form) was applied at sowing at a rate of 0, 65.2, 130.4 and 195.7 kg ha−1, respectively. Planting was done in the first half of April. Plant density was 500.000 plants ha−1. Plot size was 5 m × 2 m (4 rows), with a 0.5 m inter-row spacing. Seeds were treated with the inoculant which contains 3 × 10⁹ cells of Bradyrhizobium japonicum per gram prior to sowing. Bradyrhizobium japonicum strain is isolated from the root nodules soybeans and belongs to the Agrounik collection of microorganisms.

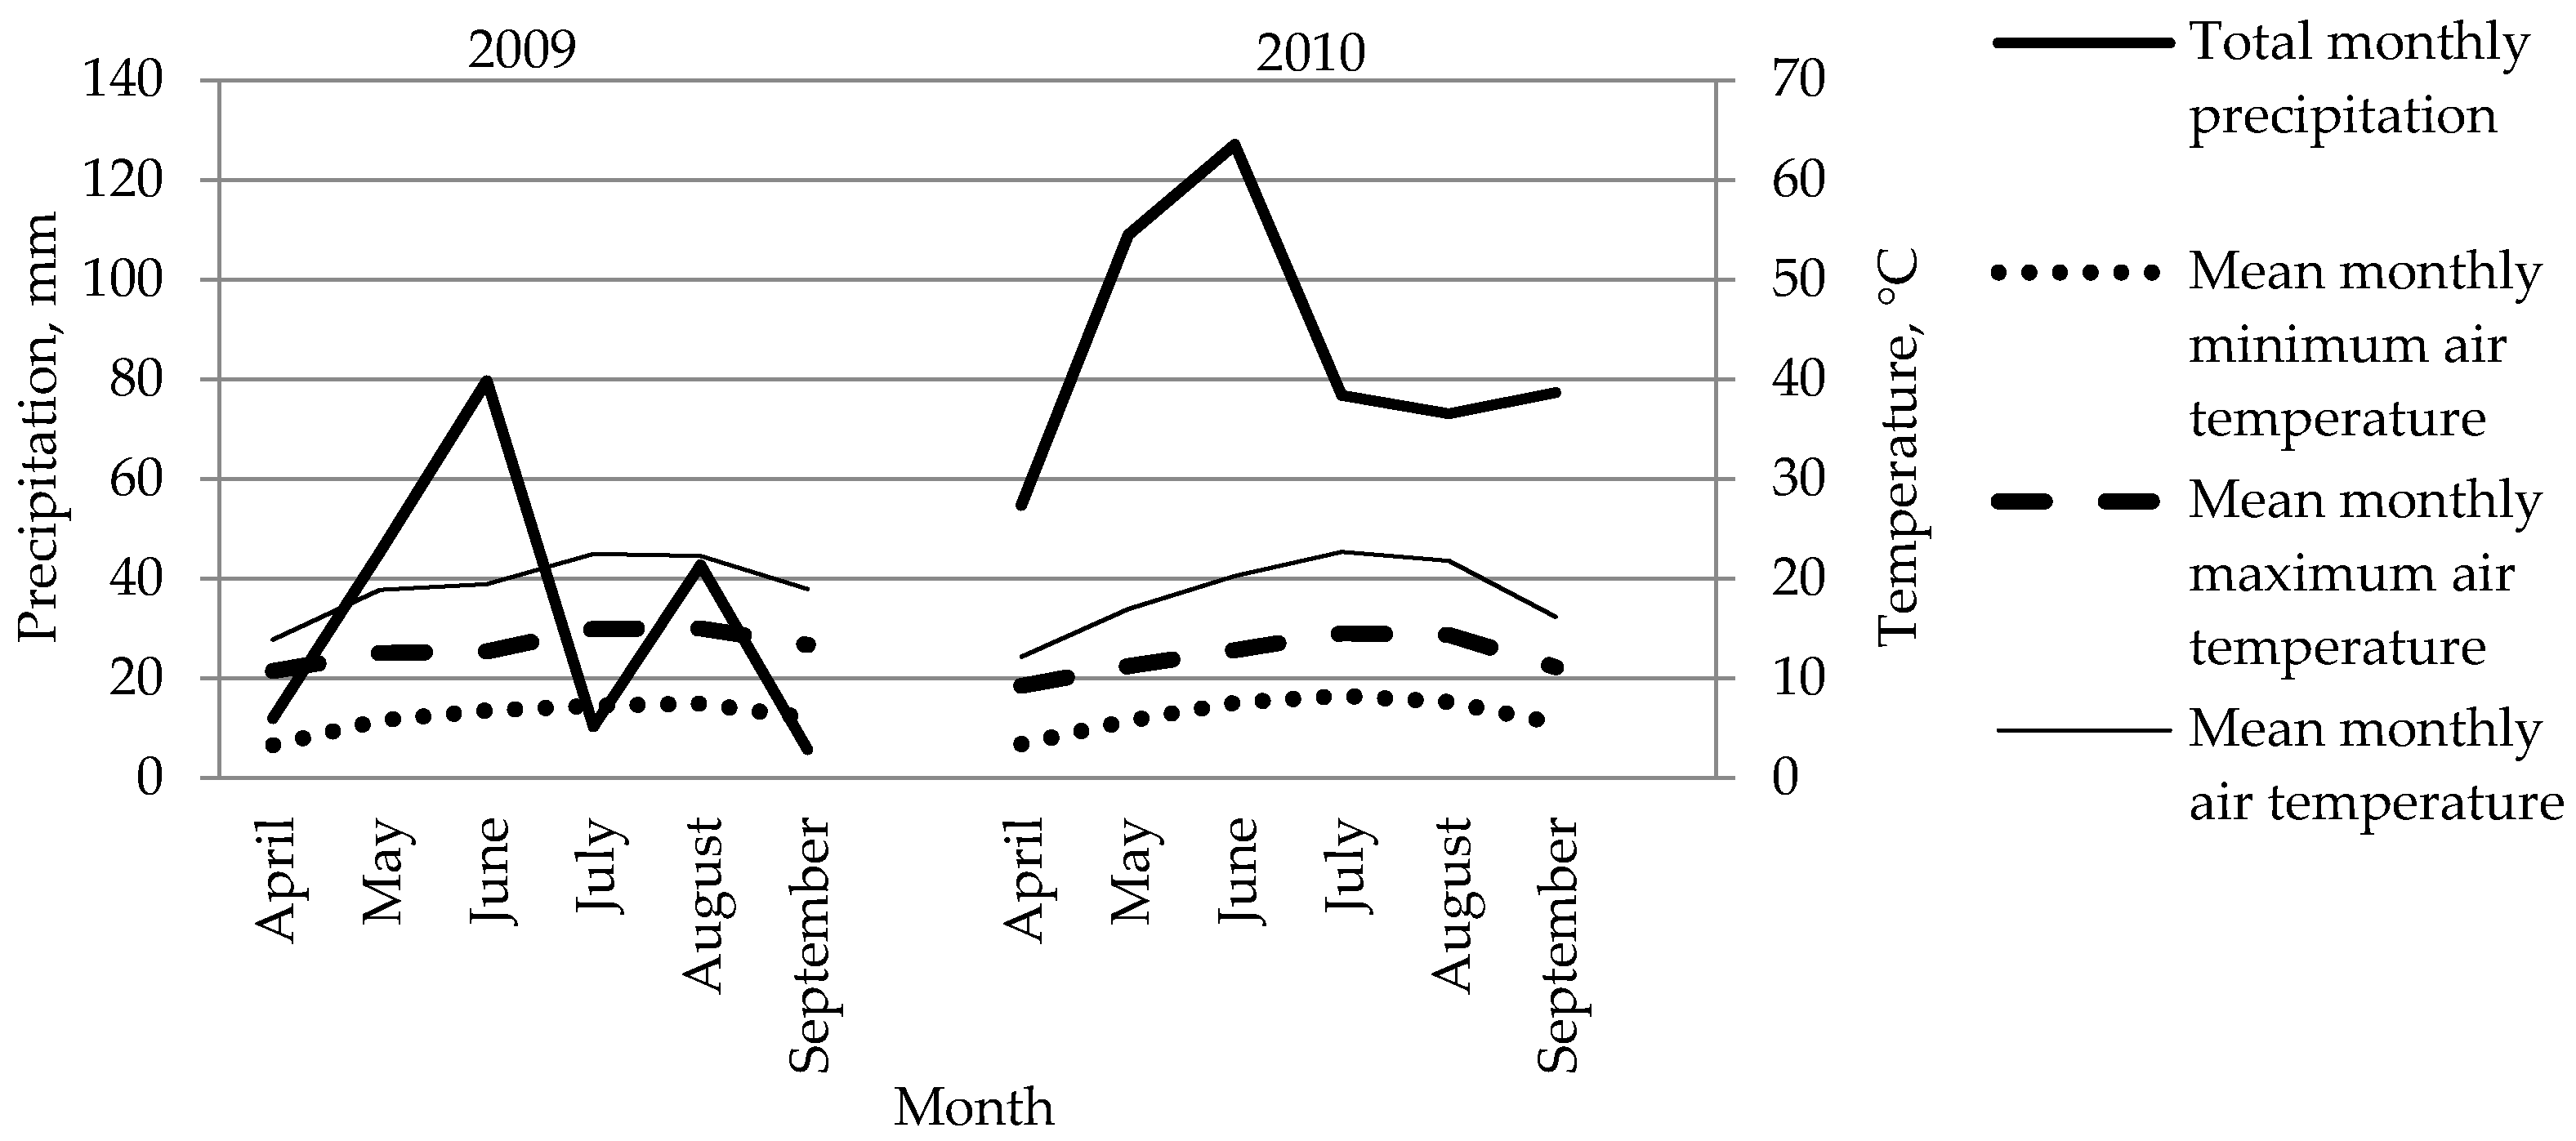
2.2. Meteorological Conditions and Agrochemical Soil Characteristics

The climate is mild continental. Climate diagram showed that in the first year was drier when compared to the second experimental year (Figure 1). In 2009, dry periods were in April and first decade of May and from July to end of the growing season. The precipitation totals and mean monthly temperatures for the 2009 and 2010 growing seasons (April-September) were 196.1 mm and 19.4 °C, and 518.2 mm and 18.4 °C, respectively.
The soil was analyzed by following methods: soil pH in KCl was determined in a 1:2.5 soil−1 M KCl suspension after a half-hour equilibration period, CaCO3 by the Scheibler calcimeter method, organic matter content by Kotzmann’s method, total N by the Kjeldahl method and the available phosphorus (P2O5) and potassium (K2O) content by the standard Al-method according to Egner-Riehm. The soil was a chernozem [18] with the following parameters: pH in KCl = 6.5, CaCO3 = 7.8%; organic matter = 3.81%, total N = 0.11%, P = 7.1 mg 100 g−1 soil and K = 15.4 mg 100 g−1 soil.

2.3. Data Collection

Seed yield (SY, t ha−1) was determined for each plot at the ripening stage and adjusted to 13% moisture content, after harvest and converted into per hectare. Plant height (PH, cm), first pod height (FPH, cm), number of nodes (NN), number of pods per plant (NP), seed weight per plant (SWP, g) and 1000-seed weight (TSW, g) were recorded from ten plants in the central part of each sub plot. Protein content (PC, %) and oil content (OC, %) in seed were determined by near-infrared reflectance (NIR) using a DICKEY-john Instalab 660 analyzer (Dickey-John Corporation, Auburn, IL, USA). The crude protein yield (CPY, t ha−1) was calculated according to formula: SY × PC, while crude oil yield (COY, t ha−1) by formula: SY × OC. Rain use efficiency (RUE) calculated by formula SY/total seasonal precipitation, kg ha−1 mm−1.

2.4. Statistical Analysis

The experiment was a 3-factorial fitted into completely randomized block system design with four replicates. Data were processed by ANOVA using STATISTICA version 10 (StatSoft, Tulsa, OK, USA). The p < 0.05 and p < 0.01 were set as significance level. The Tukey’s test at p < 0.05 was used for the difference between parameter means. Pearson correlation coefficients were used for the relationship between obtained parameters. Also, the regression analysis was used for explain the relationship between some parameters, especially SY and its components.

3. Results

3.1. Morphological and Productive Parameters and RUE

The year had highly significant effect on morphological parameters, some yield components, SY, and RUE (Table 1). The values of these parameters were significantly higher in the second year, except RUE. On average, genotype Valjevka had higher values of PH for 0.9%, NN for 10.7%, NP for 11.8%, SWP for 6.7%, TSW for 2.3%, SY for 2.1% and RUE for 2.3% and lower FPH for 9.7% than genotype Galina. The N rate also expressed highly significant effect on measured parameters, and the highest values were recorded in treatment with 60 kg N ha−1. However, no significant differences were found between 60 and 90 kg N ha−1 for FPH and 30 and 60 kg N ha−1 for SWP. Genotype in interaction with year showed very significant differences for FPH, NN, SWP, TSW, SY, and RUE. N rate × year was very significant for all examined traits. N rate × genotype was very significant for NN, NP, SWP, TSW, SY, and RUE. The year × genotype × N rate interaction was significant only for NN, NP and SWP. The Tables S1–S4 show results of interaction between factors for SY.

3.2. Qualitative Parameters, Protein and Oil Yield

The year and N rate were highly substantial for variation of qualitative parameters, CPY and COY (Table 2). Values of OC, CPY and COY in the first year were significantly lower for 0.7%, 0.37 t ha−1 and 0.24 t ha−1, while PC was considerably higher for 0.2% than in the second year (21.3%, 1.65 t ha−1, 0.94 t ha−1 and 37.4%, respectively). Also, genotype Valjevka had higher values of OC, CPY and COY than genotype Galina. The PC was highest at 90 kg N ha−1, while OC at control. COY and CPY were highest at 60 kg N ha−1, but no significant differences were found between 60 and 90 kg N ha−1 for CPY. Genotype effects in interaction with the year were highly substantial for CPY and COY. Year × N rate effect was very significant for all qualitative parameters. Genotype × N rate expressed very considerable influence for CPY and COY. The year × genotype × N rate interaction was significant only for PC.

3.3. Correlation between Studied Parameters

SY significantly and positively correlated with PH, CPY, COY, FPH, and NN, moderate positive with NP, SWP, TSW and OC and very strong negative correlation with RUE was present (Table 3). The significant strong positive correlations were established between the NN, CPY and COY with the PH, and CPY with COY. The RUE was in a strong negative relationship with PH and COY.
Regression analysis showed that PH, FPH, NN, NP, SWP and TSW can explain more than 80.8%, 54.8%, 54.5%, 34.3%, 25.6% and 34.6% of the total variability of SY (Table 4).

4. Discussion

4.1. Genotype Affected Quantitative and Qualitative Parameters and RUE

The selection of proper genotype is a key factor in profitable soybean production. In general, achievements of high soybean yields depend not only on the genotype selection but also on agro-ecological conditions and applied agricultural technology. Selection of proper genotype should be based on yield potential and its stability, maturity group, lodging, and disease resistance, weed control measures. The use of early soybean genotypes allows sowing of winter wheat genotypes after, what is the practice in Serbia. This study showed that examined genotypes responded significantly different to all investigated parameters, except PC. The Valjevka had higher values of all examined parameters, except for FPH, when compared to the Galina. So it is obvious that Valjevka has adapted better to the variable production environments when compared to the Galina. The differences between genotype for the SY and its components are highly related to the genetic potential and their intrinsic characteristics [19]. Parente et al. [20] also reported significant differences between two soybean genotypes for TSW and SY under different N fertilization.

4.2. The Climatic Condition Affected Quantitative and Qualitative Parameters and RUE

Beside the genotype, our study showed that year expressed highly significant effect on all investigated parameters. The higher values of studied parameters, except PC and RUE were obtained during the second growing season, which was favorable for soybean. Contrary, in the first year, the higher air temperatures and lower precipitation amounts were present, presenting unfavorable environmental conditions for soybean growth. The dry period from April to second decade of May induced drying of the soil surface, thus having as a consequence, prolonged sprouting and initial crop growth (vegetative stages). Further, in the same season, the soybean plants were shorter and had FPH was low. This could be considered as the main reason for the lower yield achieved in the first year effect [21]. What is more, the drought stress present from July to September, i.e., during the reproductive stage of soybean, caused pod abortion and reduced seed size, similarly to Mandić et al. [4]. Accordingly, NP, SWP and TSW were reduced, leading to lower SY. These traits are highly correlated, and NP, SWP and TSW are the important traits for SY potential expression. Essentially, soybean SY was reduced by 24% to 54% under unfavorable climatic conditions [22]. According to Ghassemi-Golezani and Lotfi [23] drought stress at reproductive stage shortens seed filling period and reduces yield components (NP, number seed per plant, SWP and TSW), thus resulting in SY reduction. The high variability in precipitation distribution and its amount during growing season explained 62% and 36% of inter-annual variability of soybean yield worldwide [24,25], and so in Serbia 57.2% [5]. Besides, soybean is sensitive to lower relative air humidity, which was due to the drought, also present in the first year (data not shown). From that reason, the PC was higher while OC was lower in the first year. The long dry period during seed filling resulted in increased protein accumulation in seed and reduced oil content, proving their inverse relationship. Many studies showed similar results [23,26]. Since only 0.3 billion ha of the total 1.3 billion ha total global cultivated is irrigated [27], the RUE monitoring is important for efficient crop management under dryland conditions. RUE value was higher in the first year when the drought was present, indicating better rainfall utilization compared to the second year. In general, RUE was conversely connected to the precipitation amount, i.e., it decreased with precipitation increase.

4.3. N Applications Affected Quantitative and Qualitative Parameters and RUE

The values of all studied parameters, except OC were higher in treatments with applied N fertilization, in comparison to control. The highest values of PH, NN, NP, SY, COY and RUE were recorded at 60 kg N ha−1. No significant differences were found between 60 and 90 kg N ha−1 for FPH, 30 and 60 kg N ha−1 for SWP and 60 and 90 kg N ha−1 for CPY. The PC was highest at 90 kg N ha−1. As it was expected, the application of starter N fertilizer positively affected seedling development by providing readily available N for initial plant growth, which could be ultimately reflected SY increase [28]. Up to fertilizer rate of 60 kg N ha−1 vegetative development of soybean plants was improved, as was indicated by higher values of PH, FPH, and NN parameters. Average PH was progressively increased with increasing N rate due to the elongation of the internodes. It can be assumed that at the rate of 60 kg N ha−1 the more intensive translocation of assimilates from leaves to the pods is present, so TSW and SY had the highest values. SY, CPY and COY have a similar trend regarding N treatments, so increased N rates are also reflected on increased CPY and COY. Our results showed that the N fertilizer inputs could alter the quality of soybean seed. However, there is no economic incentive to farmers for CPY or COY increase. Perhaps increase in quantity (SY) and quality (CPY and COY) could be adopted as a basis for profit on farms, worldwide. The rates of 90 kg N ha−1 significantly increased PC compared the other N rates. Contrary, higher N rates reduced the OC, but with no differences between rates of 60 and 90 kg ha−1. What is more, our results indicated that increased N inputs could substantially increase RUE value. Many studies concerned the impact of N fertilizers on the quantitative and qualitative parameters soybean traits. According to Ohyama et al. [29], the slow-release N urea promoted the plant growth, yield and seed quality of soybean without a reduction in N fixation. Also, results of Seneviratne et al. [30] showed that the seed inoculation and the application of N fertilizers at rate of 23 kg ha−1 before sowing and 23 kg ha−1 at the end of the flowering phase increased SY and do not inhibit soybean nodulation and N fixation. Caliskan et al. [31] also found that leaf area index, numbers of branches, NN, NP and SY of soybean significantly increased with increasing N rate from 0 to 80 kg ha−1. Kumawat et al. [32] found that SY, stover yield, PC, CPY and COY significantly increased with increasing N rate from 20 to 60 kg ha−1, while OC decreased.

4.4. Interaction of Factors Affected Quantitative and Qualitative Parameters and RUE and Correlation between Studied Parameters

As it was previously mentioned, the growing season is an important factor, which caused variability in examined parameters, particularly its interaction with N fertilization, inducing significant variation of all parameters, as well as interaction with genotype which was important for FPH, NN, SWP, TSW, SY, CPY, COY, and RUE. This is of particular importance, considering early soybean growth, especially during stressful periods, when germination and sprouting are difficult [4,5,21], reflecting further on vegetative growth through low FPH, NN, and NP values, and yield parameters, such as SWP, TSW and SY. This study in parallel showed that observed trend did not affect only growth and yield parameters, but also seed quality, by lower CPY, COY, as it was previously described by Ghassemi-Golezani and Lotfi [23]. In parallel, the presence of significant interaction among the studied factors indicated that the soybean genotypes have a different response to the applied N rates for NN, NP, SWP, TSW, SY, CPY, COY and RUE. The year × genotype × N rate interaction was significant for three investigated parameters (NN, NP and PC), giving the opportunity to improve some traits by application of agricultural practices, such as optimal N fertilization, that could facilitate soybean crop to achieve higher values of quantitative and qualitative traits, even in unfavorable conditions, such as drought [33].
In the present study, SY correlated strong and positive with PH, CPY, COY, FPH and NN and moderate positive with NP, SWP, TSW and OC. This suggests that yield components (NN, NP, SWP and TSW) are significant factors that contribute to the expression of SY potential. Several researchers, Boroomandan et al. [10], Showkat and Tyagi [34] and Shahkoohmahally and Shahkoohmahally [35] found a positive and significant correlation between SY and NP and SY and TSW. What is the more negative but non-significant relationship between PC and OC indicates the opposite trend of the protein and oil accumulation in response to the increased N rate. According to Pípolo et al. [36] this, negative correlation complicates the breeding process of soybean and requires considerable investment in time and effort, to achieve high yields, without affecting seed quality. Nevertheless, breeding for high PC or OC in soybean seed is mainly directed by its further purpose [37].

5. Conclusions

Results showed that the starter N fertilization could improve quantitative parameters, PC and RUE, without affecting N2 fixation ability. Nevertheless, N2 fixation was insufficient to supply optimal amount of N for soybean crop in agro-ecological conditions of northwestern Serbia. The reason may lay in scarce of N being released from the soil organic matter or biological antagonism between microorganisms present in indigenous soil microbiome. The highly significant effect on improving quantitative and qualitative values of soybean was expressed by 60 kg N ha−1 level and this N rate can be recommended for optimum soybean production in rain-fed conditions. Applying urea fertilizer in optimal amount may be a promising alternative for achieving high yielding potential, as well as seed quality, by increased CPY.

Supplementary Materials

The following are available online at https://www.mdpi.com/2073-4395/10/4/535/s1, Table S1: Interaction effect of year and genotype on SY (p < 0.05), Table S2: Interaction effect of year and N rate on SY (p < 0.05), Table S3: Interaction effect of genotype and N rate on SY (p < 0.05), Table S4: Interaction effect of year, genotype and N rate on SY (p < 0.05).

Author Contributions

Conceptualization, V.M. and S.Đ.; Investigation, V.M., Z.B., V.K., V.P. and A.S.; Methodology, V.M. and S.Đ.; Writing—original draft, V.M. and V.D. All authors have read and agreed to the published version of the manuscript.

Funding

This research was supported by the Ministry of Education, Science and Technological Development, Institute for Animal Husbandry Belgrade-Zemun and Agrounik doo from Serbia.

Conflicts of Interest

The authors declare no conflict of interest.

References

  1. Qiu, L.J.; Chang, R.Z. The origin and history of soybean. In The Soybean Botany, Production and Uses, 1st ed.; Singh, G., Ed.; CAB International: Wallingford, UK, 2010; pp. 1–23. [Google Scholar]
  2. Hartman, G.L.; West, E.D.; Herman, T.K. Crops that feed the World 2. Soybean: Worldwide production, use, and constraints caused by pathogens and pests. Food Sec. 2011, 3, 5–17. [Google Scholar] [CrossRef]
  3. FAO. Food and Agriculture Organisation of the United Nations. 2019. Available online: http://www.fao.org/faostat/en/#data (accessed on 22 March 2020).
  4. Mandić, V.; Simić, A.; Krnjaja, V.; Bijelić, Z.; Tomić, Z.; Stanojković, A.; Ruzić-Muslić, D. Effect of foliar fertilization on soybean grain yield. Biotechnol. Anim. Husb. 2015, 31, 133–143. [Google Scholar] [CrossRef]
  5. Mandić, V.; Bijelić, Z.; Krnjaja, V.; Simić, A.; Ružić-Muslić, D.; Dragičević, V.; Petričević, V. The rainfall use efficiency and soybean grain yield under rainfed conditions in Vojvodina. Biotechnol. Anim. Husb. 2017, 33, 475–486. [Google Scholar] [CrossRef]
  6. Salvagiotti, F.; Cassman, K.G.; Specht, J.E.; Walters, D.T.; Weiss, A.; Dobermann, A. Nitrogen uptake, fixation and response to fertilizer N in soybeans—A review. Field Crops Res. 2008, 108, 1–13. [Google Scholar] [CrossRef] [Green Version]
  7. Takahashi, Y.; Toshiaki, C.; Tomio, N.; Ohyama, T. Evaluation of N2-fixation and N absorption activity by relative ureide method in field grown soybean plants with deep placement of coated urea. J. Soil Sci. Plant Nutr. 1992, 38, 699–708. [Google Scholar] [CrossRef] [Green Version]
  8. Albareda, M.; Rodriguez-Navarro, D.N.; Temprano, F.J. Soybean inoculation: Dose, N fertilizer supplementation and rhizobia persistence in soil. Field Crops Res. 2009, 113, 352–356. [Google Scholar] [CrossRef]
  9. Hoshi, S. Nitrogen fixation, growth and yield of soybean. In Nitrogen Fixation in Root Nodules—For Improvement of Soybean Production; Hattori, T., Baba, T., Ouhira, K., Eds.; Hakuyusha: Tokyo, Japan, 1982; pp. 5–33. [Google Scholar]
  10. Boroomandan, P.; Khoramivafa, M.; Haghi, Y.; Ebrahimi, A. The effects of nitrogen starter fertilizer and plant density on yield, yield components and oil and protein content of soybean (Glycine max, Merr.). Pak. J. Biol. Sci. 2009, 12, 378–382. [Google Scholar] [CrossRef] [Green Version]
  11. Salih, S.H.; Hamd, S.A.M.; Dagash, Y.M.I. The effects of Rhizobium, Mycorrhizal inoculations and diammonium phosphate (DAP) on nodulation, growth and yield of soybean. Univ. J. Agric. Res. 2015, 3, 11–14. [Google Scholar]
  12. Janagard, M.S.; Ebadi-Segherloo, A. Inoculated soybean response to starter nitrogen in conventional cropping system in Moghan. Agron. J. 2016, 15, 26–32. [Google Scholar] [CrossRef] [Green Version]
  13. Ntambo, M.S.; Chilinda, I.S.; Taruvinga, A.; Hafeez, S.; Anwar, T.; Sharif, R.; Chambi, C.; Kies, L. The effect of rhizobium inoculation with nitrogen fertilizer on growth and yield of soybeans (Glycine max L.). Int. J. Biosci. 2017, 10, 163–172. [Google Scholar]
  14. Taylor, S.R.; Weaver, B.D.; Wood, C.W.; Van Santen, E. Nitrogen application increases yield and early dry matter accumulation in late-planted soybean. Crop Sci. 2005, 45, 854–858. [Google Scholar] [CrossRef]
  15. Gai, Z.; Zhang, J.; Li, C. Effects of starter nitrogen fertilizer on soybean root activity, leaf photosynthesis and grain yield. PLoS ONE 2017, 12, e0174841. [Google Scholar] [CrossRef] [PubMed] [Green Version]
  16. Beard, H.B.; Hoover, R.M. Effect of nitrogen on nodulation and yield of irrigated soybean. Agron. J. 1971, 63, 815–816. [Google Scholar] [CrossRef]
  17. Walter, H.; Lieth, H. Klimadiagram-Weltatlas; VEB Gustav Fischer Verlag: Jena, Germany, 1967. [Google Scholar]
  18. IUSS Working Group Wrb. World Reference Base for Soil Resources International soil classification system for naming soils and creating legends for soil maps. In World Soil Resources Reports, 106; FAO: Rome, Italy, 2014. [Google Scholar]
  19. Soares, I.; de Rezende, P.; Bruzi, A.; Zuffo, A.; Zambiazzi, E.; Fronza, V.; Teixeira, C. Interaction between soybean cultivars and seed density. Am. J. Plant. Sci. 2015, 6, 1425–1434. [Google Scholar] [CrossRef] [Green Version]
  20. Parente, T.L.; Lazarini, E.; Caioni, S.; Pivetta, R.S.; Souza, L.G.M.; Bossolani, J.W. Adubação nitrogenada em genótipos de soja associada à inoculação em semeadura direta no Cerrado. Rev. Bras. de Ciênc. Agrár. 2015, 10, 249–255. [Google Scholar] [CrossRef] [Green Version]
  21. Popović, V.; Vidić, M.; Jocković, Đ.; Ikanović, J.; Jakšić, S.; Cvijanović, G. Variability and correlations between yield components of soybean [Glycine max (L.) Merr.]. Genetika 2012, 44, 33–45. [Google Scholar] [CrossRef]
  22. Kobraee, S.; Shamsi, K. Effect of drought stress on dry matter accumulation and morphological traits in soybean. Int. J. Biosci. 2012, 10, 73–79. [Google Scholar]
  23. Ghassemi-Golezani, K.; Lotfi, R. Influence of water stress and pod position on oil and protein accumulation in soybean grains. Int. J. Plant Prod. 2013, 4, 2341–2345. [Google Scholar]
  24. Penalba, O.C.; Bettolli, M.L.; Vargas, W.M. The impact of climate variability on soybean yields in Argentina. Multivariate regression. Meteor. Appl. 2007, 14, 3–14. [Google Scholar] [CrossRef]
  25. Ray, D.K.; Gerber, J.S.; Macdonald, G.K.; West, P.C. Climate variation explains a third of global crop yield variability. Nat. Commun. 2015, 6, 1–9. [Google Scholar] [CrossRef] [Green Version]
  26. Mertz-Henning, L.M.; Ferreira, L.C.; Henning, F.A.; Mandarino, J.M.G.; Santos, E.D.; Oliveira, M.C.N.D.; Nepomuceno, A.L.; Farias, J.R.B.; Neumaier, N. Effect of water deficit-induced at vegetative and reproductive stages on protein and oil content in soybean grains. Agronomy 2018, 8, 3. [Google Scholar] [CrossRef] [Green Version]
  27. FAO (Food outlook). Biannual Report on Food Markets. 2019. Available online: http://www.fao.org/publications (accessed on 20 January 2020).
  28. Osborne, S.L.; Riede, W.E. Soybean growth response to low rates of nitrogen applied at planting in the Northern Great Plains. J. Plant Nutr. 2006, 29, 985–1002. [Google Scholar] [CrossRef]
  29. Ohyama, T.; Tewari, K.; Ishikawa, S.; Tanaka, K.; Kamiyama, S.; Ono, Y.; Hatano, S.; Ohtake, N.; Sueyoshi, K.; Hasegawa, H.; et al. Role of nitrogen on growth and seed yield of soybean and a new fertilization technique to promote nitrogen fixation and seed yield, soybean. In Soybean—the Basis of Yield, Biomass and Productivity; Kasai, M., Ed.; IntechOpen Limited: London, UK, 2017; pp. 154–185. [Google Scholar]
  30. Seneviratne, G.; Van Holm, L.H.J.; Ekanayake, E.M.H.G.S. Agronomic benefits of rhizobial inoculant use over nitrogen fertilizer application in tropical soybean. Field Crops Res. 2000, 68, 199–203. [Google Scholar] [CrossRef]
  31. Caliskan, S.; Ozkaya, I.; Caliskan, M.E.; Arslan, M. The effects of nitrogen and iron fertilization on growth, yield and fertilizer use efficiency of soybean in a Mediterranean-type soil. Field Crops Res. 2008, 108, 126–132. [Google Scholar] [CrossRef]
  32. Kumawat, S.M.; Dhakar, L.L.; Maliwal, P.L. Effect of irrigation regimes and nitrogen on yield, oil content and nutrient uptake of soybean (Glycine max). Indian J. Agron. 2000, 45, 361–366. [Google Scholar]
  33. Cerezini, P.; Harumi, K.B.; Bartosa, D.S.M.; Terassi, F.; Hungaria, M.; Nogueira, M.A. Strategies to promote early nodulation in soybean under drought. Field Crops Res. 2016, 196, 160–167. [Google Scholar] [CrossRef]
  34. Showkat, M.; Tyagi, S. Correlation and path coefficient analysis of some quantitative traits in soybean (Glycine max L. Merrill). Res. J. Agric. Sci. 2010, 1, 102–106. [Google Scholar]
  35. Shahkoohmahally, E.; Shahkoohmahally, S. Investigating of N and K fertilizers on yield and components of soybean (Glycine max (L.) Merr.). J. Agric. Sci. 2017, 9, 85–94. [Google Scholar] [CrossRef] [Green Version]
  36. Pípolo, A.E.; Hungria, M.; Franchini, J.C.; Balbinot, A.A., Jr.; Debiasi, H.; Mandarino, J.M.G. Teores de Óleo e Proteína em Soja: Fatores Envolvidos e Qualidade Para a Indústria; Embrapa Soybean: Londrina, Brazil, 2015; pp. 1–15. [Google Scholar]
  37. Eskandari, M.M.; Cober, E.R.; Rajcan, I. Genetic control of soybean seed oil: II. QTL and genes that increase oil concentration without decreasing protein or with increased seed yield. Theor. Appl. Genet. 2013, 126, 1677–1687. [Google Scholar] [CrossRef]
Figure 1. Climate diagram according to Walter and Lieth [17] during the soybeans growing seasons.
Agronomy 10 00535 g001
Table 1. Year, genotype and N rate effects on morphological and productive parameters and RUE.
FactorPHFPHNNNPSWPTSWSYRUE
Year
(A)
2009103.8b14.1b13.5b43.0b12.2b154.3b3.41b17.4a
2010122.6a16.3a16.0a47.0a12.7a159.0a4.41a8.5b
F testA****************
Genotype
(B)
Galina112.7b15.9a14.0b42.5b12.0b154.9b3.87b12.8b
Valjevka113.7a14.5b15.5a47.5a12.8a158.4a3.95a13.1a
F testB****************
N rate,
kg ha−1
(C)
0109.5d13.5c13.7d42.8c11.1c152.3c3.58d11.9c
30114.1b15.4b15.0b44.2bc13.2a153.7c3.93c13.0b
60116.8a16.0a15.8a48.1a13.2a163.0a4.11a13.8a
90112.4c15.9a14.4c44.9b12.2b157.6b4.03b13.2b
F testC****************
F testA ×Bns****ns********
A × C****************
B × Cnsns************
A × B × Cnsns******nsnsns
Mean113.215.214.845.012.4156.73.9113.0
PH—plant height (cm); FPH—first pod height (cm); NN—number of nodes; NP—number of pods per plant; SWP—seed weight per plant (g); TSW—1000-seed weight (g); SY—seed yield (t ha−1); RUE—rain use efficiency (kg ha−1 mm−1); Different letters within columns indicate significant differences by Tukey’s test at the 5% level; Means followed by the same letter within a column are not significantly different by Tukey’s test at the 5% level; ** Significant at 1%.
Table 2. Year, genotype and N rate effects on qualitative parameters, protein, and oil yield.
FactorPCOCCPYCOY
Year
(A)
200937.6a20.6b1.28b0.70b
201037.4b21.3a1.65a0.94a
F testA********
Genotype
(B)
Galina37.420.5b1.45b0.80b
Valjevka37.521.3a1.48a0.84a
F testBns******
N rate,
kg ha−1
(C)
037.3b21.4a1.34c0.77c
3037.4b21.0b1.47b0.82b
6037.4b20.8bc1.54a0.86a
9037.7a20.7c1.52a0.83b
F testC********
F testA × Bnsns****
A × C********
B × Cnsns****
A × B × C*nsnsns
Mean37.520.91.470.82
PC—protein content (%); OC—oil content (%); CPY—crude protein yield (t ha−1); COY—crude oil yield (tha−1); Different letters within columns indicate significant differences by Tukey’s test at the 5% level; Means followed by the same letter within a column are not significantly different by Tukey’s test at the 5% level; ** Significant at 1%; * significant at 5%; ns-not significant.
Table 3. Correlation matrix (Pearson) between studied parameters (n = 64).
PHFPHNNNPSWPTSWSYPCOCCPYCOY
FPH0.65**
NN0.81**0.46**
NP0.37**0.27*0.53**
SWP0.37**0.41**0.52**0.61**
TSW0.47**0.44**0.59**0.60**0.58**
SY0.90**0.74**0.74**0.59**0.51**0.59**
PC−0.35**0.00ns−0.21ns0.09ns0.03ns−0.05ns−0.11ns
OC0.47**−0.16ns0.49**0.36**0.08ns0.18ns0.40**−0.24ns
CPY0.88**0.74**0.73**0.60**0.51**0.59**1.00**−0.05ns0.39**
COY0.91**0.64**0.77**0.60**0.48**0.57**1.00**−0.15ns0.56**0.98**
RUE−0.88**−0.51**−0.59**−0.25*−0.09ns−0.19ns−0.80**0.38**−0.55**−0.79**−0.84**
PH—plant height; FPH—first pod height; NN—number of nodes; NP—number of pods per plant; SWP—seed weight per plant; TSW—1000-seed weight; SY—seed yield; PC—protein content; OC—oil content; CPY—crude protein yield; COY—crude oil yield; RUE—rain use efficiency; **—significant at 1% level of probability, *—significant at 5% level of probability and ns—not significant.
Table 4. Regression analysis between some parameters.
ParameterRegression EquationParameterRegression Equation
SYPH
PHy = 16.71x + 47.80.808FPHy = 0.110x + 2.6960.414
FPHy = 2.363x + 5.9570.548NNy = 0.146x − 1.8470.650
NNy = 2.493x + 4.9730.545NN
NPy = 5.553x + 23.290.343NPy = 1.476x + 23.270.276
SWPy = 1.045x + 8.3430.256SWPy = 0.315x + 7.7930.265
TSWy = 7.173x + 128.60.346TSWy = 2.111x + 125.50.342
PH—plant height; FPH—first pod height; NN—number of nodes; NP—number of pods per plant; SWP—seed weight per plant; TSW—1000-seed weight; SY—seed yield.

