Article

Efficient Physiological and Nutrient Use Efficiency Responses of Maize Leaves to Drought Stress under Different Field Nitrogen Conditions

Agricultural Green Development Engineering Technology Research Center, College of Resources and Environment, Henan Agricultural University, Zhengzhou 450002, China
*
Author to whom correspondence should be addressed.
These authors contributed equally to this work.
Agronomy 2020, 10(4), 523; https://doi.org/10.3390/agronomy10040523
Submission received: 19 February 2020 / Revised: 4 April 2020 / Accepted: 5 April 2020 / Published: 6 April 2020

Abstract

:
Inadequate water and nitrogen (N) supplies can limit the productivity of maize. Climate change will likely increase drought in many regions on a global scale. The determination of N fertilizer rates under field drought conditions will be critical toward the reduction of agricultural risk. For this study, drought-resistant/sensitive cultivars were selected as experimental samples. Our results revealed that drought stress reduced the relative water content (RWC) of leaves, which resulted in leaf curling, while decreasing photosynthesis levels and N accumulation. In contrast to those without N treatments, the application of N significantly increased grain yields by 26.8% during the wet year but increased only by 5.4% during the dry year. Under the same N levels, the reduction in yield caused by drought increased with the increased application of N. This was because the application of the N fertilizer translated to increase the leaf area and transpiration, exacerbated the soil water loss and induced a leaf curling state in maize, which had deleterious effects on photosynthesis and N absorption. During the dry year, the yields of drought-sensitive cultivars were even less than those without the application of N. Compared with those of drought-sensitive cultivars, the RWCs of drought-resistant cultivars decreased more rapidly, and they entered the state of leaf curling earlier. Thus, N fertilizer inputs should be reduced, and the extent of N fertilization for drought-sensitive cultivars should be reduced even further.

1. Introduction

As an extremely important cereal crop worldwide, maize (Zea mays L.) is extensively consumed as food and livestock feed and for biofuel production [1,2]. In terms of human food supply, maize is predicted to become the most important crop globally by 2050 [3]. Maize is comparatively sensitive to drought stress in contrast to other summer crops, such as soybean and peanut [4]. Summer precipitation events in Northern China are projected to decrease in volume and/or frequency [5]. Furthermore, groundwater levels continue to recede due to intense water extraction by industry and agriculture [6], where many wells need to be drilled to a depth of 80–100 meters to produce water. Currently, drought stress is rapidly becoming a critical abiotic factor that translates to immense maize yield losses [7]. A conclusion derived from collected peer-reviewed publication data between 1980 and 2015 revealed that the reduction in maize yield in response to drought was 39.3% [8].
Episodes of intense and prolonged drought are projected to surge worldwide due to future global warming/climate change [9]. Under drought stress, the inhibition of carbohydrate assimilation or its export from sources organs may result in superfluous photosynthetic light energy, which may consequently induce the intense generation of reactive oxygen species (ROS) in leaves [10,11]. Subsequently, drought stress induces alterations in physiological status and disturbances in metabolism homeostasis, which deleteriously influence plant growth and development, including a marked suppression in the photosynthetic efficiencies of plants [12] and the depolarization of plasma membranes [13]. Therefore, the cumulative negative impacts of little rainfall, low groundwater levels, high evapotranspiration during summer months, and improper water management practices will result in extreme drought stress events, leading to severe economic losses that encompass all of Northern China.
Since nitrogen (N) is a vital component required for the synthesis of chlorophyll and photosynthetic enzymes in plants, which directly and indirectly impact the photosynthesis of crops, its presence or absence can determine the overall yields of crops [14]. Drought stress strongly affects growth and N metabolism, while the application of N can contribute to drought resistance to a certain extent in many plants [15]. Under water deficits, N supplies can be conducive toward the enhancement of the drought resistance of crops by protecting photosynthetic apparatus, activating antioxidant defense systems and improving osmoregulation [16].
Most crops require N within an appropriate range that optimally aligns with their physiological requirements; however, the excessive application of N results in decreased crop yields [17]. Previous studies have shown that the addition of N can improve the drought resistance of plants through pot, pool, or hydroponic simulation experiments [18,19]. Hence, we wondered if we could improve the drought resistance of maize by regulating the amount of N fertilizer in fields and determine the optimal amount of N fertilizer under drought stress conditions. In this study, we examined the yields, N use efficiencies, and a number of physiological leaf trait responses to maize during contrasting rainfall years under different field-based N regimes. These data might be employed as a scientific basis for guiding the correct application of N fertilizers for maize in water-deficient regions.

2. Materials and Methods

2.1. Site Description

Field experiments were conducted during maize-growing seasons (June–October) in 2017 and 2018 in Yuzhou County (113°34′ E, 34°27′ N), Henan Province, in Central China. During the maize-growing seasons, the total precipitation and the mean temperature were 210.9 mm and 27.1 °C, respectively, in the dry year (2017), and they were 530.9 mm and 27 °C, respectively, in the wet year (2018) (Figure 1). Prior to the investigation, soil samples were extracted from the upper 30 cm layer for chemical analyses. Averaged over these two years, the soil type was fluvoaquic at pH 7.8, the organic matter content was 20.45 g kg−1, the total N concentration was 1.04 g kg−1, the available phosphorus concentration was 20.16 mg kg−1, the available potassium concentration was 142.38 mg kg−1, and the bulk density was 1.25 g cm−3.

2.2. Experimental Design and Management

Two cultivars of Keyu 188 (KY188) and Denghai 605 (DH605) were used for the experiments over the growing seasons in 2017 and 2018. These two maize cultivars have been widely cultivated by Henan’s farmers due to their high yields and extensive adaptability. The growth duration of KY188 is about 103 day, and that of DH605 is about 101 day. KY188 belongs to a high-temperature-resistant cultivar, whereas DH605 belongs to a high-temperature-sensitive cultivar. Seeds were mechanically sown on the 10 June (2017), 8 June (2018), at a hill spacing of 0.60 m × 0.27 m with 61,725 plants per hectare (ha−1), and the dimensions of each plot was 4 m × 10 m.
The proposed study was laid out in a randomized, complete, split-split-plot block design with two water regimes (dry year (2017) and wet year (2018)) as the main plots, the two cultivars (KY188 and DH605) as the subplots, and five N treatment rates (0, 120, 180, 240, and 360 kg N ha−1) as the sub-subplots. Urea served as the source of element N, which was applied in two splits, with 50% at basal and 50% at the 10-leaf stage (45 days after sowing). Phosphate (P2O5; 90 kg ha−1) in the form of calcium superphosphate and potassium chloride (KCl; 90 kg ha−1) were applied as basal. The basal fertilizer was applied to the ground following manual broadcasting, whereas N topdressing was applied by means of side dressing. Nicosulfuron and atrazine were applied at the three-leaf stage to control weeds, and thiophanate-methyl and lambda-cyhalothrin were applied at the eight-leaf stage to prevent diseases and insects.

2.3. Remote Sensing Image

Remote sensing images of maize at the elongating stage were acquired by a digital camera (Hasselblad, L1D-20c, Sweden) installed on an unmanned aircraft (DJI, Mavic 2 Pro, China), and the flying height was set at 150 m for vertical shooting. On 1 August 2017, the first shooting was performed at 10:00 a.m., and no leaf curling was observed on this day (see Figure 2a, left); the second shooting was performed at 10:00 a.m. on 20 August 2017, and the leaves of the maize treated with higher N concentrations appeared curling (see Figure 2a, right).

2.4. Leaf Curling, Thickness and Relative Water Content (RWC) Measurements

Ten ear leaves from each plot were selected in the morning (10:00 a.m.–11:30 a.m.). The leaf curl ratio was calculated from the leaf width with natural curling divided by its extended [20]. In the present study, leaf curling was defined as the curl ratio below 0.8.
Five ear leaves from each plot were selected and divided by leaf margins (3 cm inward from the edge) and leaf centers (except for the leaf margins). The leaf margin and the leaf center were cut into 1 cm2 squares, and 30 leaf squares were stacked to measure the leaf thickness. These leaf squares were used for RWC measurements. The equation to calculate RWC (%) was written as: (FW − DW) / (SW − DW) × 100%, where FW refers to the fresh weight, DW is short for the dry weight, and SW represents the saturated weight. The SW was determined after soaking the leaves in distilled water for 24 h in the dark [21].

2.5. Field Soil Water Consumption Measurements

From 1 August to 25 August 2017 (dry year), 20 soil samples (0–20 cm) of N application treatments for the cultivar DH605 were randomly collected by soil drilling at 6:00 p.m. and then weighted. These fresh soils were used for soil water consumption rate measurements. The soil water consumption rate (%) was written as: (soil weight in first day − soil weight in next day)/soil weight on the first day.

2.6. Determination of the Net Photosynthetic Rate and the Transpiration Rate

Eight ear leaves from each plot were selected in the morning (10:00 a.m.–11:30 a.m.) after 15 days without the addition of water, to quantify the net photosynthetic rate (Pn) and the transpiration rate (E) using a portable photosynthesis apparatus, which was equipped with a transparent leaf chamber (LI-6400, Li-Cor, Lincoln, NE, USA). The middle portion of the ear leaf was enclosed within the leaf chamber, and the Pn and the E were recorded following equilibration to steady-state.

2.7. Plant N Measurements

At maturity (115 days after sowing), five plants from each plot were sampled and then dissected into leaf, stem, cob, and grain. These fresh materials were oven-dried at 105 °C for 30 min and then at 75 °C until a constant mass was obtained. The yield of corn grain was adjusted to a 13% moisture content. The plant materials were ground, sifted through a 1 mm mesh screen and then digested by H2SO4 and H2O2. The total N concentration of the digested samples was determined using an automated continuous flow analyzer (Seal, Norderstedt, Germany).

2.8. Data Analysis

The equations for calculating the N utilization efficiency parameters were introduced as follows:
NAE   ( % ) = N   uptake   of   N   applied N   uptake   of   N   omission N   applied   rate × 100 ,
NPFP   ( kg   kg 1 ) = Yield N   applied   rate ,
NHI   ( % ) = N   accumulation   in   corn   grain N   uptake   in   whole   plant × 100 ,
where NAE is the N absorption efficiency, NPFP is the N partial factor productivity, and NHI is the N harvest index.
Data were statistically analyzed using SPSS for Windows (v19.0, Chicago, IL, USA). All data were previously tested for normality using the Shapiro–Wilk method, and homoscedasticity was tested by using a Levene’s test. Two-way analyses of variance (ANOVA) was used to test the significance of main effects (N levels and drought conditions) and their interactions with physiological leaf parameters, N use efficiencies, and yields. Subsequently, the mean values of the treatments were compared on the basis of the least significant difference (LSD) test. The graphs were plotted using the Origin 9.0 software program.

3. Results

3.1. Leaf Morphology

From an aerial perspective, the test plots that suffered from drought had a tan color, as the drought stress caused the leaves to curl and dry (Figure 2a). In addition, higher N fertilizer application rates resulted in a greater degree of leaf rolling in maize leaves (Figure 2b).
Leaf rolling was associated with the dehydration of the leaf margins and centers. The thicknesses of the DH605 leaf centers and margins were much greater than those of the KY188 leaf centers and margins over the two years (Table 1). During the wet year, the thickness of the leaf margin of KY188 was decreased with higher N treatment rates, while the thickness of the leaf center of DH605 was increased with higher N treatment rates. During the dry year, the thicknesses of the leaf margins and centers were reduced under higher N application rates, except for the leaf center of DH605. In addition, compared with in the wet year, the thicknesses of both the leaf margins and centers were significantly decreased. Further, the thicknesses of the leaf centers were reduced more than those of the leaf margins after suffering from drought, which increased the thickness ratios between the leaf margins and centers under drought conditions.

3.2. Soil Water Consumption Rate

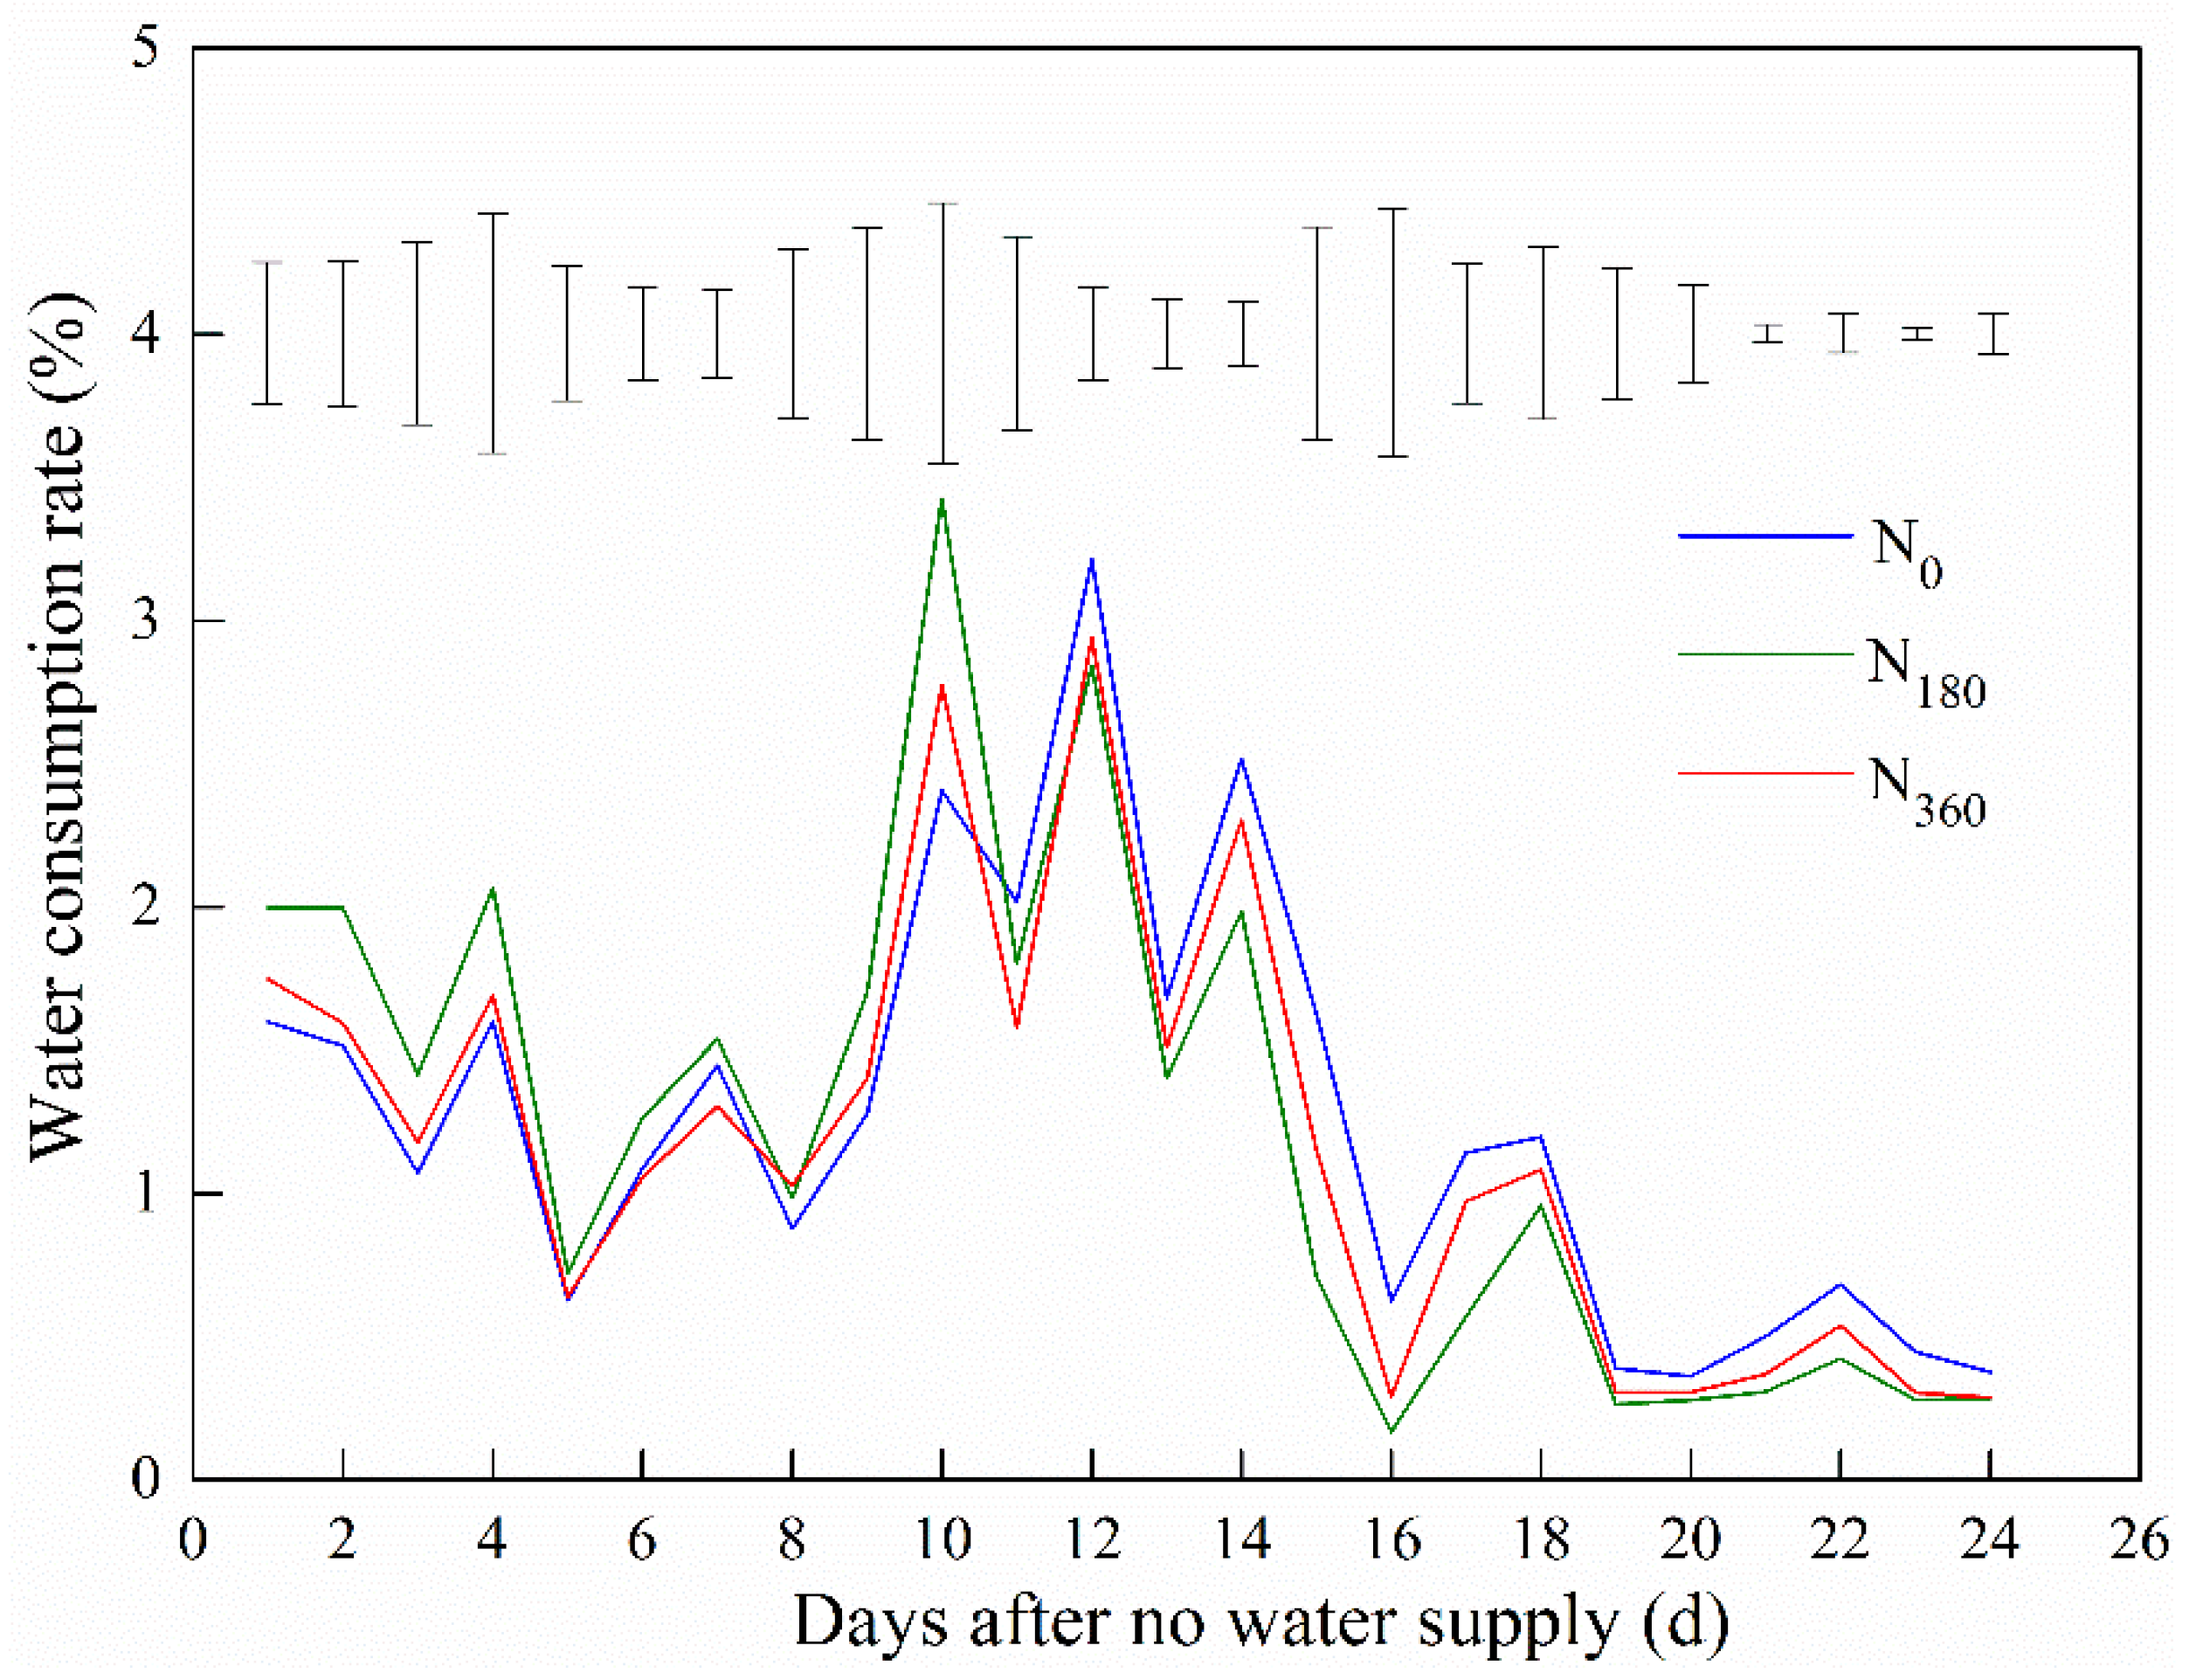
The soil water consumption rates for the N treatment rates of 180, 360, and 0 kg N ha−1) were shown in descending order in the first 10 days without water in the dry year (Figure 3). From 11 to 25 days without water, the soil water consumption rates for the N treatment rates of 0, 360, and 180 kg N ha−1 were shown in descending order. It is worth noting that following 19 days without water, the soil water consumption rate of each treatment was ≤1.0% and there was no obvious difference between the different N treatments.

3.3. RWC of Leaves

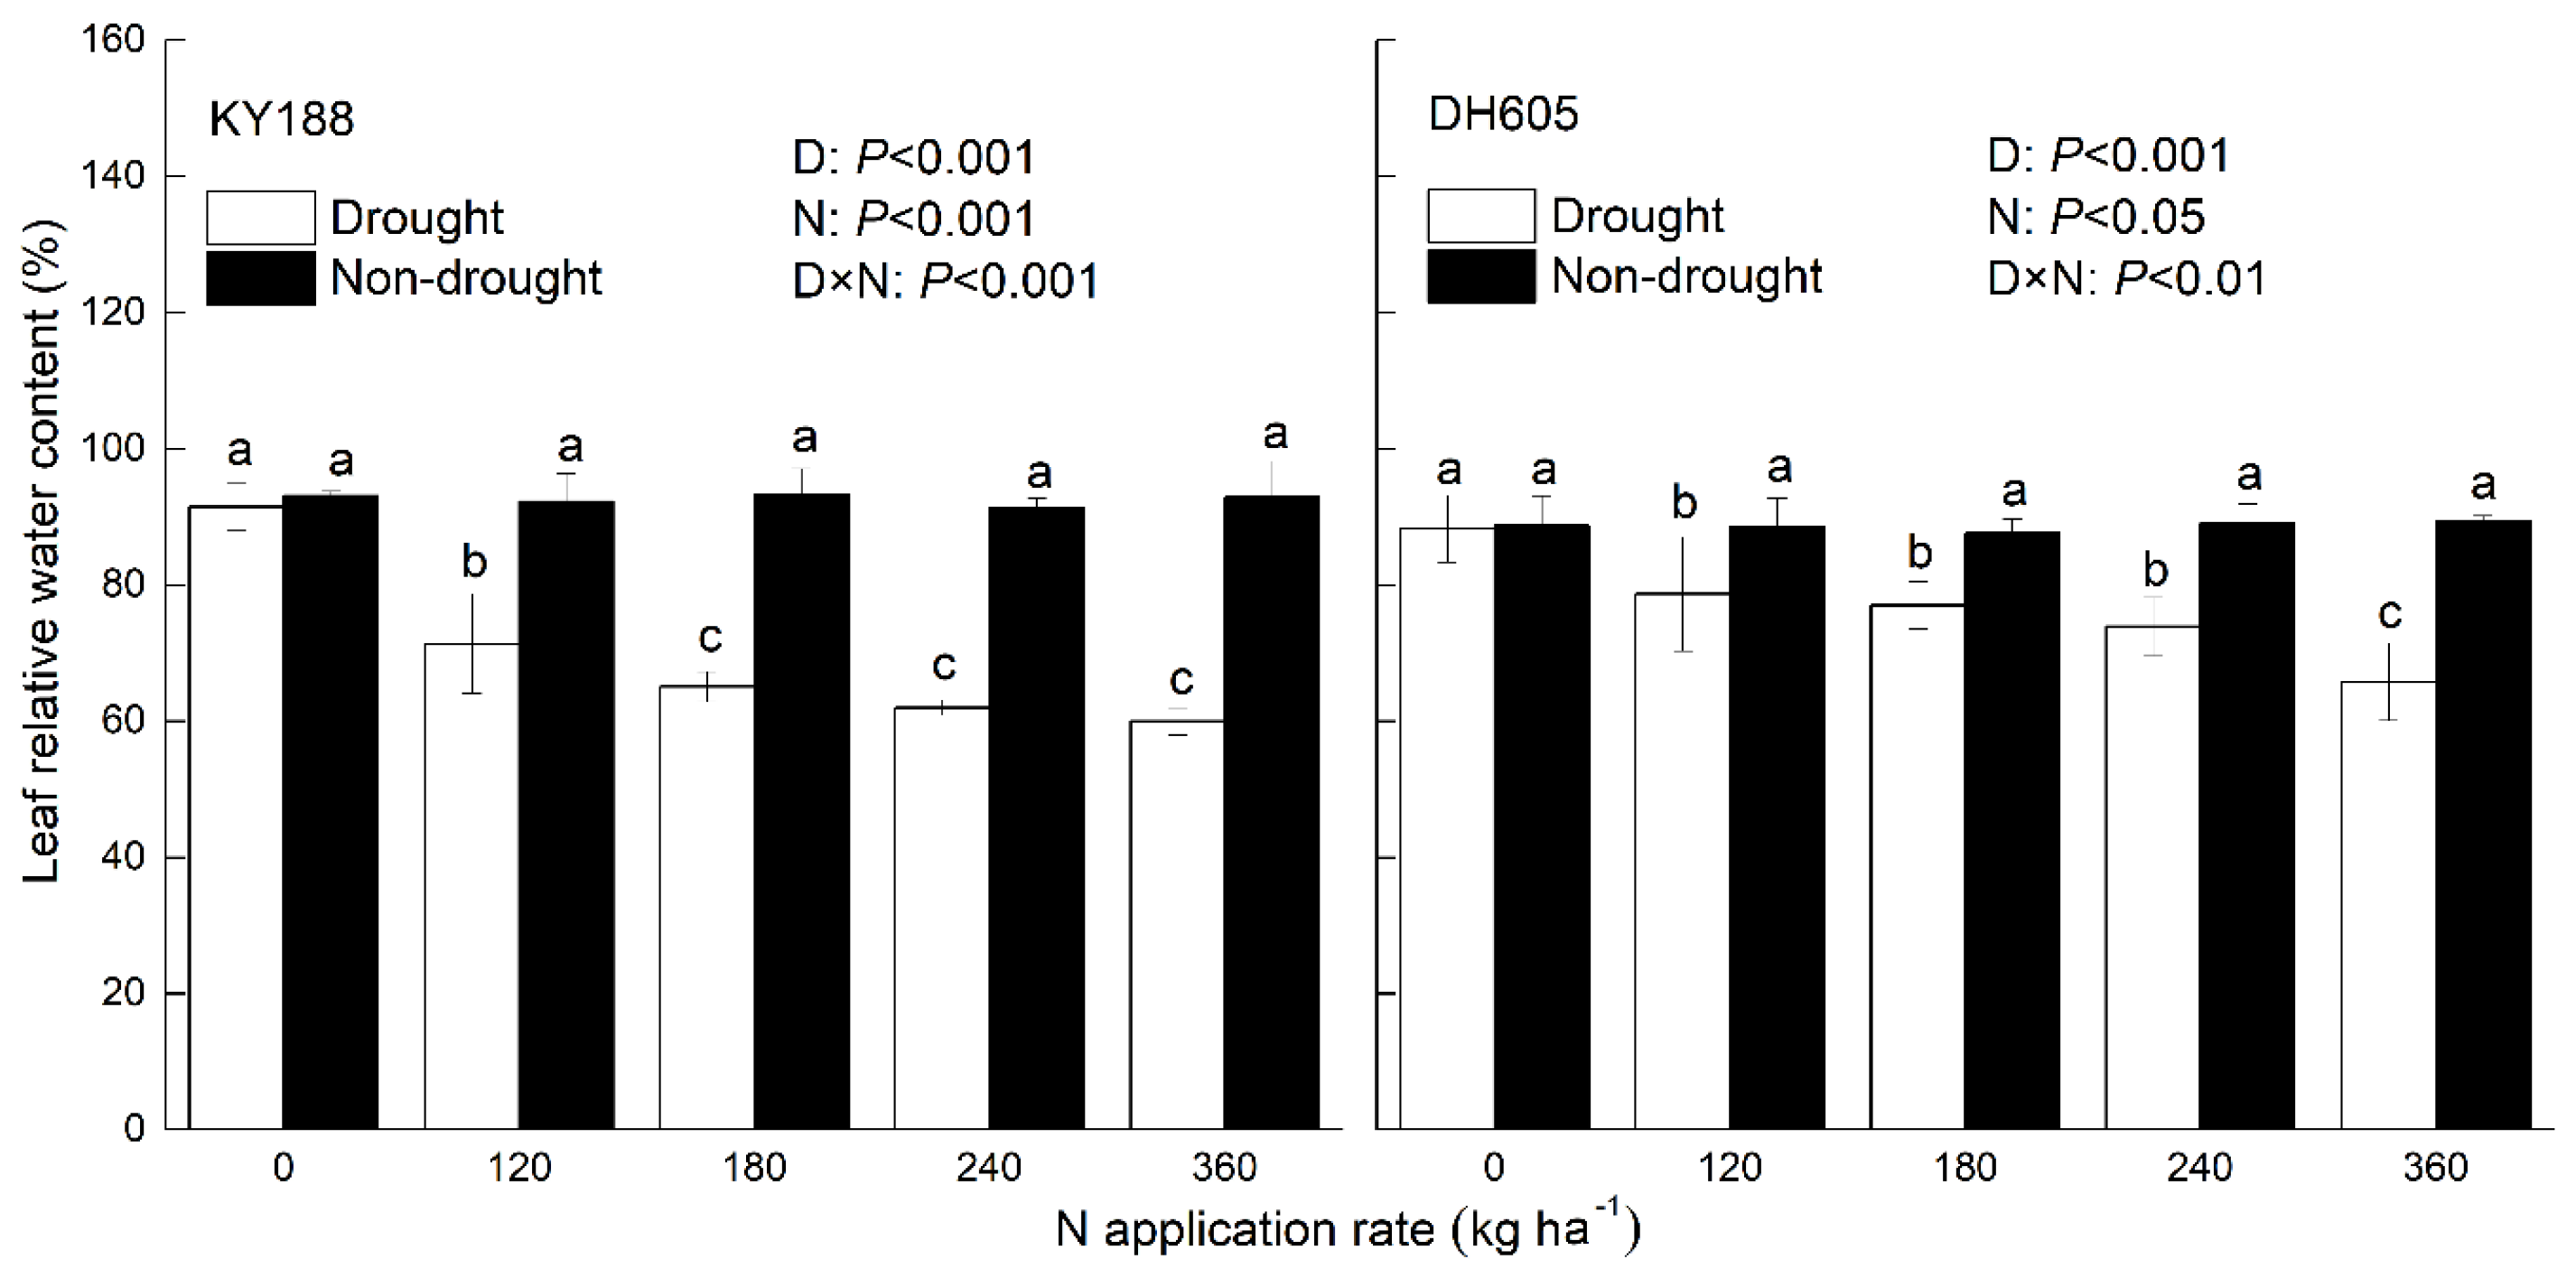
No significant differences in the leaf RWC were observed for the same cultivar between the different N treatment rates during the nondrought-stress year (Figure 4). However, in the drought-stress year, the RWC of the maize leaves was significantly decreased with higher N treatment rates for both cultivars. There were maximum reductions in RWC of 35.4% (KY188) and 26.5% (DH605) at the N treatment rate of 360 kg N ha−1 for the drought stress treatments compared to for the nondrought-stress treatments.

3.4. Gas Exchange Parameters

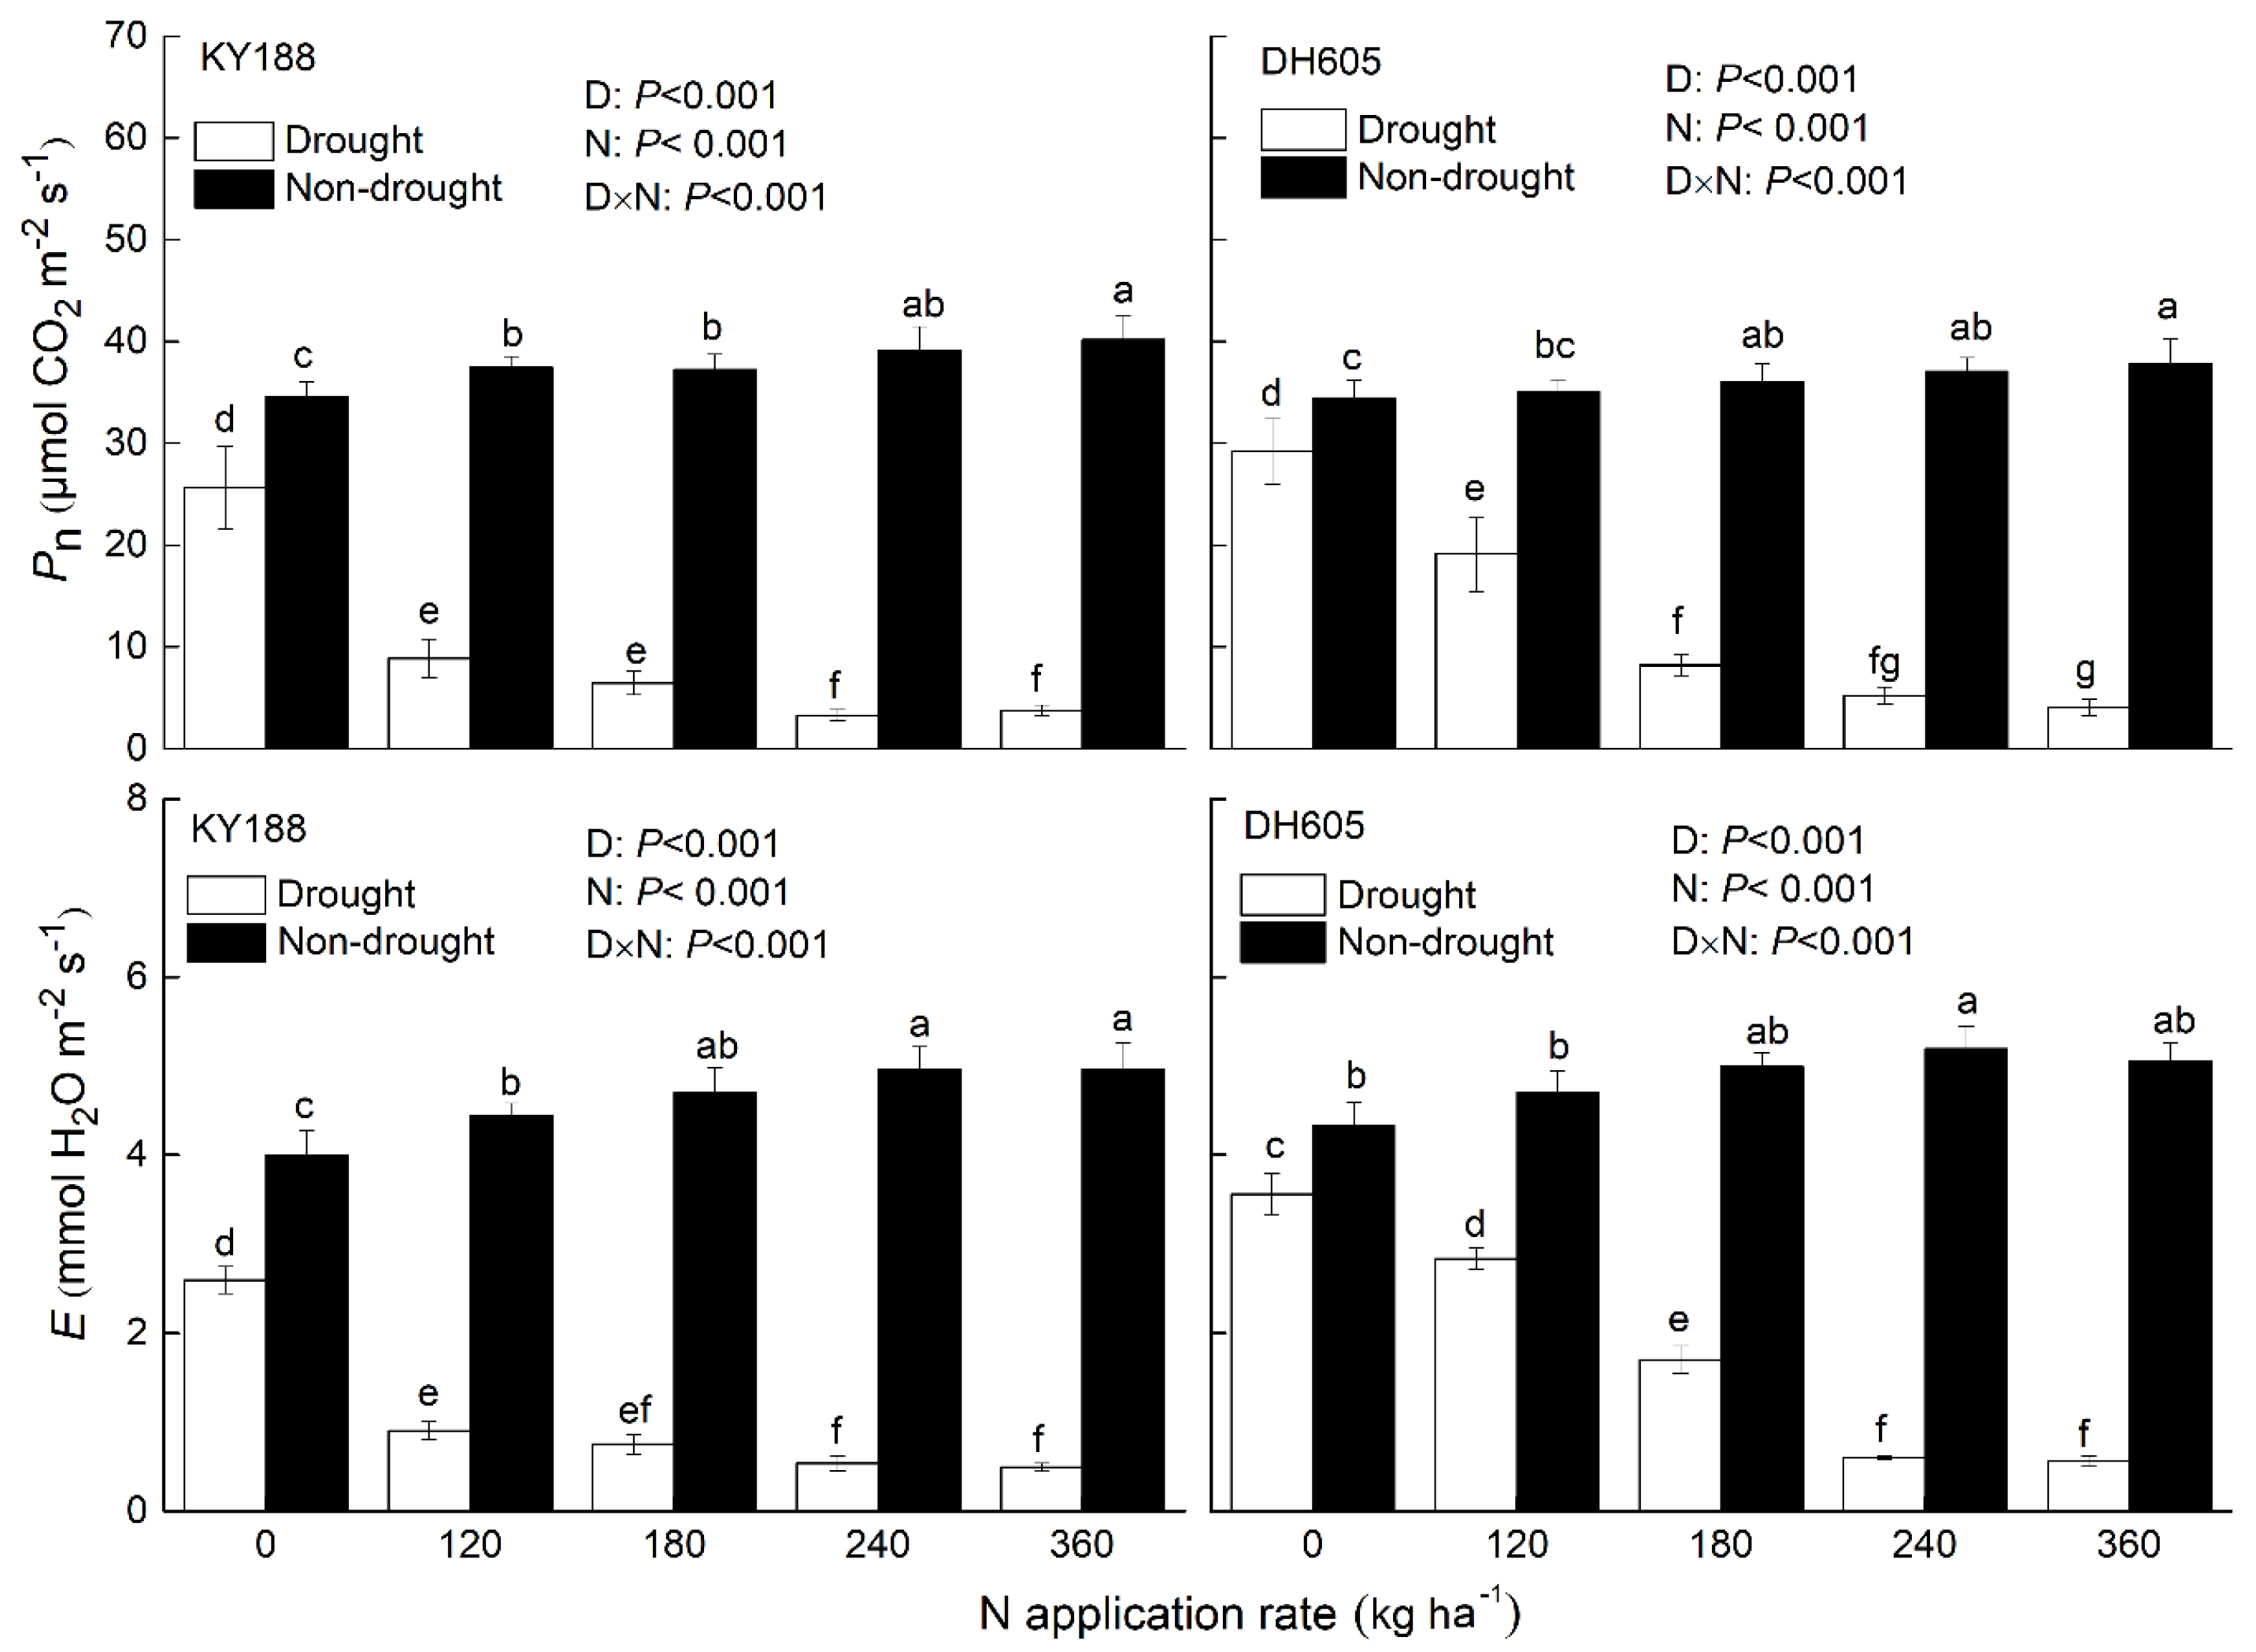
The leaf Pn was enhanced with higher N application rates under the nondrought conditions; however, this trend was reversed under exposure to drought stress (Figure 5). Compared with in the nondrought stress plots, the leaf Pn decreased by 25.8–90.7% in KY188 and 15.2–89.4% in DH605 in drought conditions, where the difference in the leaf Pn between the treatments increased as the N fertilizer rate increased. The trends of the transpiration rates of the two cultivars under different N levels and water conditions were consistent with those of Pn of the two cultivars.

3.5. Corn Grain Yield

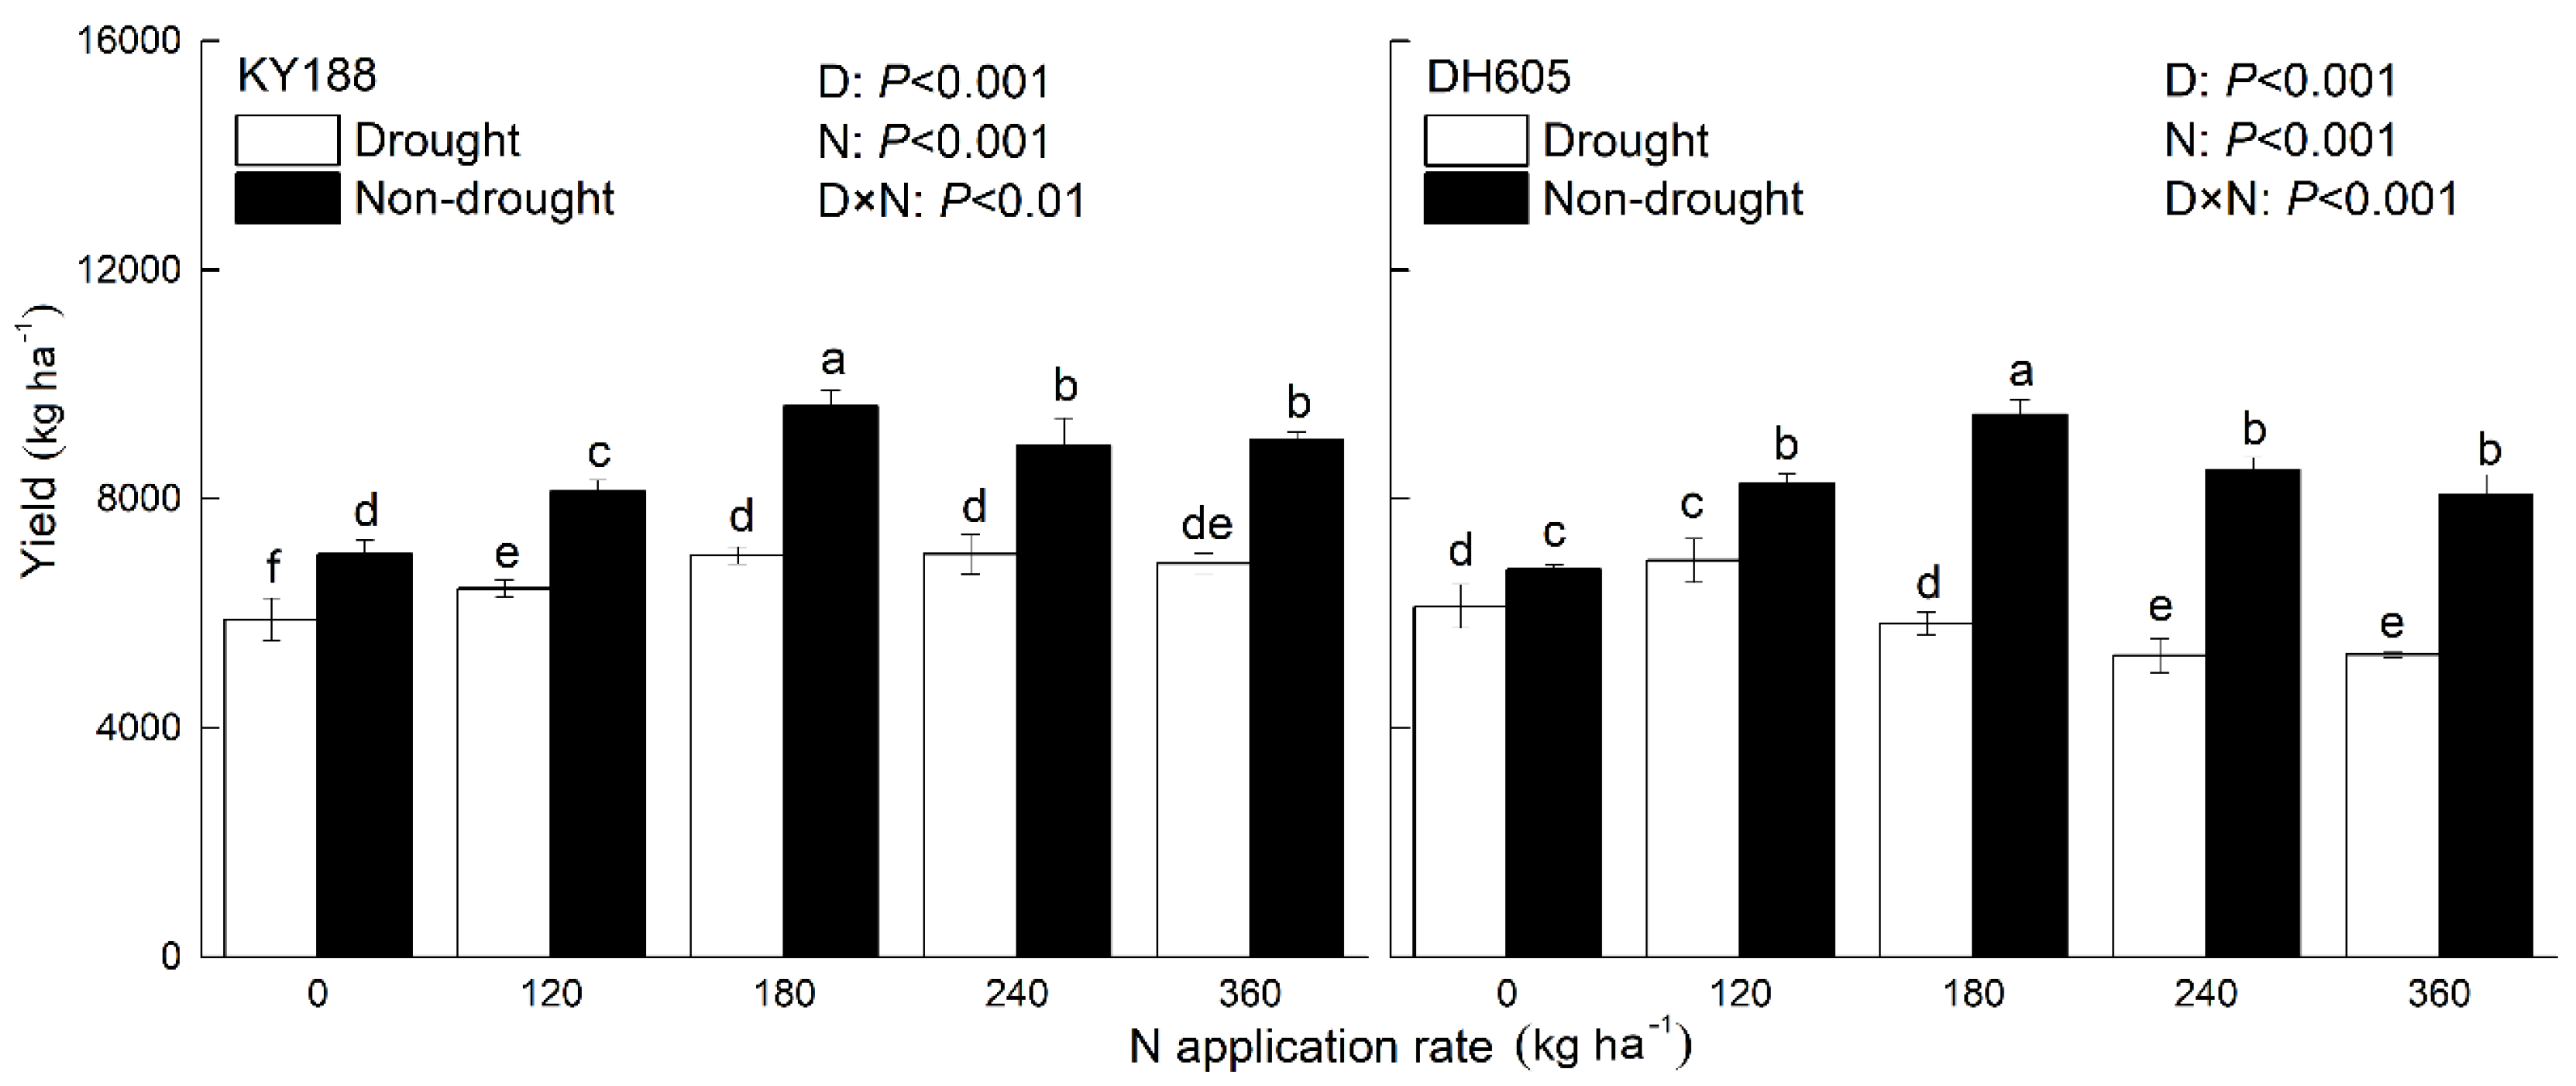
During the wet year, the grain yields for both cultivars exhibited a similar trend, where the yield continued to increase until the N application rate reached 180 kg N ha−1 and then decreased under higher N applications (Figure 6). During the dry year, the grain yield of KY188 were enhanced with higher N application rates, but there were no significant differences between the 180 kg N ha−1 and 360 kg N ha−1 treatment. In contrast to those of KY188, the grain yield of DH605 decreased with the increasing N treatment rate from 120 to 360 kg N ha−1. Drought was observed to significantly reduce maize yields grown under the same N application levels, whereas the yield reduction without N treatment was relatively minimal.

3.6. N Use Efficiency

N utilization efficiencies (as shown by NAE, NPFP, and NHI) were decreased with higher N application rates during the different rainfall years (Table 2). Compared with those in the wet year, the mean NAE and NPFP in the dry year were decreased by 27.4% and 25.8%, respectively. It is worth noting that compared to those in the wet year, the NAE of DH605 under the N treatment rates of 240 and 360 kg N ha−1 decreased by 65.4% and 64.7%, respectively, and the NPFP under the N treatment rates of 240 and 360 kg N ha−1 decreased by 31.4% and 34.8%, respectively, when subjected to drought stress. In contrast to the mean NAE and NPFP, the mean NHIs during these two years were consistent.

4. Discussion

4.1. Physiological Performance Response of Maize Leaves to Drought Stress Under Different N Conditions

Drought and soil water deficits are increasingly limiting factors for plant growth in many regions of the world [22]. In our study, the total precipitation of the maize-growing season in 2017 was only 39.5% of that in 2018 (Figure 1); thus, 2017 was considered the dry year, and 2018 was considered the wet year.
Soil water evaporation and plant transpiration are the main sources of soil water consumption, where evaporation loss is dominant [23]. Furthermore, transpiration increases with higher seasonal rainfall [24]. The application of N fertilizers can expand the canopies of plants leaves, which act to shade the soil surface. Although closed canopy reduces the evaporation of moisture from the soil, it exacerbates water consumption for plant transpiration [25]. In the present study, the soil water consumption rates for the N treatment rates of 180, 360, and 0 kg N ha−1 were shown in the descending order; however, the water consumption rates for the N treatment rates of 0, 360, and 180 kg N ha−1 were shown in the descending order, following 10 consecutive days of drought.
After 10–15 days of no water supply, the maize leaves at 120, 180, 240, and 260 kg N ha−1 treatment rates gradually began to curl from 10:00 a.m. to 5:00 p.m. daily, and the leaves were unfurled for the rest time of the day (Figure 2a). Several studies have shown that N deficiency exacerbated the sensitivity of stomata to drought [15,26]; however, we did not observe the leaf curling in the absence of N treatments, which was found under higher N treatment rates. This might be the case, as the application of N fertilizers increased plant water transpiration (Figure 5), causing the plants treated with higher N treatment rates to enter the drought state earlier, which masked the increased resistance to drought stress with additional N treatments for the maize.
The RWC was used to quantify the extent of dehydration [21]. Soil water deficits and high temperatures reduced the leaf RWC, and the decrease in RWC increased with increasing N fertilizer rates (Figure 4). The degree of leaf curling was closely related to the RWC [27]; thus, we observed severe leaf curling at higher N application rates (Figure 2b). In the present study, the reduction of RWC was mainly due to the water loss of leaf centers for both maize cultivars (Table 1). Additionally, the ratio of the leaf center water loss of DH605 was higher than that of KY188, while the ratio of the leaf margin water loss was lower than that of KY188 (Table 1). The water loss in the leaf center likely contributed more to the degree of leaf curling than the water loss at the leaf margin. Leaf water limitation induced the reduction of bulliform cell turgor, which is involved in rolling and unrolling leaves under drought conditions [28]. Further, leaf curling decreases leaf transpiration, temperature, and incident irradiance, which decrease the potential for photoinhibition, prolong physiological activity and increase survival during drought [29].
The photosynthetic capacities of leaves may be improved with N, as it can enhance the activities of photosynthesis-related enzymes [14]. In the present study, the application of N enhanced the leaf photosynthetic capacities under nondrought stress conditions, but the Pn values decreased with higher N treatment rates under drought stress conditions (Figure 5). Soil moisture deficits decreased the leaf RWC, which might trigger the de novo synthesis of abscisic file://D:\Users\pc\AppData\Local\Youdao\Dict\Application\7.5.2.0\resultui\dict\?keyword=acid (ABA) in the leaves, where the generation of ABA resulted in a decline in stomatal conductance [30]. Further, stomatal closure may contribute to the reduced Pn values [31].

4.2. Yield and N Use Efficiency of Maize Subjected to Drought Under Different N Treatement Conditions

Drought stress is one of the most significant abiotic stresses that limit crop production [32,33], as it initiates an imbalance of the electron transfer chain and promotes the production of ROS, including superoxide radicals and hydrogen peroxide. This can result in the autocatalytic peroxidation of membrane lipids, triggering the loss of membrane semipermeability and the modification of functionality [34]. Previous studies found that N supply enhanced the activities of some antioxidant enzymes and decreased malonaldehyde contents [16,35].
Currently, a broadly accepted perspective is that higher N levels of leaves are associated with delayed leaf senescence, which confers improved drought tolerance [11,36,37]. The decrease of yield between drought and nondrought stress increased with increasing N treatment rates. Furthermore, increased applications of N did not alleviate drought stress in the present study (Figure 6). This may be due to the moisture content always being artificially maintained within a stable range for hydroponic (added polyethylene glycol) and pot (water weight method) experiments [15,18,38]. In field production, the soil moisture levels were variable, where the supply of N exacerbated water consumption in the absence of water (Figure 3), which transitioned the maize with higher N concentrations to the drought status. Furthermore, from the belowground perspective, excessive N has been observed to reduce root biomass, which might increase drought susceptibility [39].
Drought stress inhibited the uptake of N in plants, while reducing N absorption efficiencies and N partial factor productivity for the maize under the same N conditions (Table 2). Lower N use efficiencies may result in additional N being retained in the soil; thus, N fertilizer levels could likely be reduced for the next crop season. However, we also found that water stress did not reduce the NHI and even improved the efficiency of N transfer from straw to grain for the cultivar KY188 (Table 2). This might be because drought stress upregulated the glutamine synthetase and asparagine synthetase genes, which might contribute to the degradation and remobilization of leaf N levels [19].

5. Conclusions

In the well-water condition, the application of N fertilizers enhanced plant water transpiration and net photosynthetic rates, further increasing corn yields. In the absence of water, soil water consumption was greater at lower N treatment rates, and the application of N fertilizers decreased the leaf RWC, which led to leaf curling and the further reduction of photosynthesis. Thus, the recommended quantity of N fertilizers for plants under drought stress should be appropriately reduced to align with local conditions.

Author Contributions

Conceptualization, Y.Y., Y.W., and Y.H.; field experiment arrangement, W.F., and Y.W.; plant investigation and sample measurements, W.F., W.G., N.R., Y.H., and Y.W.; writing of the original draft preparation, Y.W.; writing of review and editing, Y.Z. and Y.Y.; funding acquisition, Y.Y. All authors have read and agreed to the published version of the manuscript.

Funding

This work was financially supported by the National Key Research and Development Program of China (No. 2017YFD0200100).

Conflicts of Interest

The authors declare no conflicts of interest.

References

  1. Campos, H.; Cooper, A.; Habben, J.E.; Edmeades, G.O.; Schussler, J.R. Improving drought tolerance in maize: A view from industry. Field Crop. Res. 2004, 90, 19–34. [Google Scholar] [CrossRef]
  2. Min, H.W.; Chen, C.X.; Wei, S.W.; Shang, X.L.; Sun, M.Y.; Xia, R.; Liu, X.G.; Hao, D.Y.; Chen, H.B.; Xie, Q. Identification of drought tolerant mechanisms in maize seedlings based on transcriptome analysis of recombination inbred lines. Front. Plant Sci. 2016, 7, 1080. [Google Scholar] [CrossRef] [PubMed]
  3. Pingali, P.L. CIMMYT 1999–2000 Facts and Trends. Meeting World Maize Needs: Technological Opportunities and Priorities for the Public Sector; CIMMYT: Mexico City, Mexico, 2001. [Google Scholar]
  4. Ertiro, B.T.; Beyene, Y.; Das, B.; Mugo, S.; Olsen, M.; Oiken, S.; Juma, C.; Labuschagne, M.; Prasanna, B.M. Combining ability and testcross performance of drought-tolerant maize inbred lines under stress and non-stress environments in Kenya. Plant Breed. 2017, 136, 197–205. [Google Scholar] [CrossRef] [PubMed]
  5. Hao, L.S.; Min, J.Z.; Ding, Y.H. Relationship between reduction of summer precipitation in North China and atmospheric circulation anomalies. J. Water Resour. Prot. 2010, 2, 569–576. [Google Scholar] [CrossRef] [Green Version]
  6. Shen, H.; Leblanc, M.; Tweed, S.; Liu, W.Z. Groundwater depletion in the Hai River Basin, China, from in situ and GRACE observations. Hydrolog. Sci. J. 2015, 60, 671–687. [Google Scholar] [CrossRef] [Green Version]
  7. Curá, J.A.; Franz, D.R.; Filosofía, J.E. Inoculation with Azospirillum sp. and Herbaspirillum sp. Bacteria increases the tolerance of maize to drought stress. Microorganisms 2017, 5, 41. [Google Scholar] [CrossRef] [Green Version]
  8. Daryanto, S.; Wang, L.X.; Pierre-André, J. Global synthesis of drought effects on maize and wheat production. PLoS ONE 2016, 11, e0156362. [Google Scholar] [CrossRef]
  9. Dai, A.G. Increasing drought under global warming in observations and models. Nat. Clim. Chang. 2013, 3, 52–58. [Google Scholar] [CrossRef]
  10. Gururani, M.A.; Venkatesh, J.; Tran, L.S.P. Regulation of photosynthesis during abiotic stress-induced photoinhibition. Mol. Plant 2015, 8, 1304–1320. [Google Scholar] [CrossRef] [Green Version]
  11. Checovich, M.L.; Galatro, A.; Moriconi, J.I.; Simontacchi, M.; Dubcovsky, J.; Santa-María, G.E. The stay-green phenotype of TaNAM-RNAi wheat plants is associated with maintenance of chloroplast structure and high enzymatic antioxidant activity. Plant Physiol. Biochem. 2016, 104, 257–265. [Google Scholar] [CrossRef] [Green Version]
  12. Albacete, A.A.; Martínez-Andújar, C.; Pérez-Alfocea, F. Hormonal and metabolic regulation of source-sink relations under salinity and drought: From plant survival to crop yield stability. Biotechnol. Adv. 2014, 32, 12–30. [Google Scholar] [CrossRef] [PubMed]
  13. Liu, T.; Zhu, L.; Wang, J.; Wang, J.; Xie, H. The genotoxic and cytotoxic effects of 1-butyl-3-methylimidazolium chloride in soil on Vicia faba seedlings. J. Hazard. Mater. 2015, 285, 27–36. [Google Scholar] [CrossRef] [PubMed]
  14. Kaur, G.; Asthir, B.; Bains, N.; Farooq, M. Nitrogen nutrition, its assimilation and remobilization in diverse wheat genotypes. Int. J. Agric. Biol. 2015, 17, 531–538. [Google Scholar] [CrossRef]
  15. Wang, X.B.; Wang, L.F.; Shangguan, Z.P. Leaf gas exchange and fluorescence of two winter wheat varieties in response to drought stress and nitrogen supply. PLoS ONE 2016, 11, e0165733. [Google Scholar] [CrossRef] [Green Version]
  16. Gou, W.; Zheng, P.F.; Tian, L.; Gao, W.; Zhang, L.X.; Akram, N.A.; Ashraf, M. Exogenous application of urea and a urease inhibitor improves drought stress tolerance in maize (Zea mays L.). J. Plant Res. 2017, 130, 599–609. [Google Scholar] [CrossRef]
  17. Jin, L.; Cui, H.; Li, B.; Zhang, J.W.; Dong, S.T.; Liu, P. Effects of integrated agronomic management practices on yield and nitrogen efficiency of summer maize in North China. Field Crop. Res. 2012, 134, 30–35. [Google Scholar] [CrossRef]
  18. Wu, Z.Z.; Ying, Y.Q.; Zhang, Y.B.; Bi, Y.F.; Wang, A.K.; Du, X.H. Alleviation of drought stress in Phyllostachys edulis by N and P application. Sci. Rep. 2018, 8, 228. [Google Scholar] [CrossRef] [Green Version]
  19. Li, Y.J.; Wang, M.; Zhang, F.X.; Xu, Y.D.; Chen, X.H.; Qin, X.L.; Wen, X.X. Effect of post-silking drought on nitrogen partitioning and gene expression patterns of glutamine synthetase and asparagine synthetase in two maize (Zea mays L.) varieties. Plant Physiol. Biochem. 2016, 102, 62–69. [Google Scholar] [CrossRef]
  20. Entringer, G.C.; Guedes, F.L.; Oliveira, A.A.; Nascimento, J.P.; Souza, J.C. Genetic control of leaf curl in maize. Genet. Mol. Res. 2014, 13, 1672–1678. [Google Scholar] [CrossRef]
  21. Guo, J.Y.; Yang, Y.; Wang, G.X.; Yang, L.D.; Sun, X.Y. Ecophysiological responses of Abies fabri seedlings to drought stress and nitrogen supply. Physiol. Plant. 2010, 139, 335–347. [Google Scholar]
  22. Kübert, A.; Götz, M.; Kuester, E.; Piayda, A.; Werner, C.; Rothfuss, Y.; Dubbert, M. Nitrogen loading enhances stress impact of drought on a semi-natural temperate grassland. Front. Plant Sci. 2019, 10, 1051. [Google Scholar] [CrossRef] [PubMed] [Green Version]
  23. Copper, P.J.M.; Gregory, P.J.; Tully, D.; Harris, H.C. Improving water use efficiency of annual crops in the rainfed farming systems of West Asia and North Africa. Exp. Agric. 1987, 23, 113–158. [Google Scholar] [CrossRef] [Green Version]
  24. Pilbeam, C.J.; Simmonds, L.P.; Kavilu, A.W. Transpiration efficiencies of maize and beans in semi-arid Kenya. Field Crop. Res. 1995, 41, 179–188. [Google Scholar] [CrossRef]
  25. Ferreira, T.C.; Carr, M.K.V. Responses of potatoes (Solanum tuberosum L.) to irrigation and nitrogen in a hot, dry climate: I. Water use. Field Crop. Res. 2002, 78, 51–64. [Google Scholar] [CrossRef]
  26. Waraich, E.A.; Ahmad, R.; Saifullah; Ahmad, A. Water stress and nitrogen management effects on gas exchange, water relations, and water use efficiency in wheat. J. Plant Nutr. 2011, 34, 1867–1882. [Google Scholar] [CrossRef]
  27. Peña-Rojas, K.; Aranda, X.; Joffre, R.; Fleck, J. Leaf morphology, photochemistry and water status changes in resprouting Quercus ilex during drought. Funct. Plant Biol. 2005, 32, 117–130. [Google Scholar] [CrossRef]
  28. Grigore, M.N.; Toma, C. Bulliform cells. In Anatomical Adaptations of Halophytes; Springer: Cham, Switzerland, 2017. [Google Scholar]
  29. Heckathorn, S.A.; DeLucia, E.H. Effect of leaf rolling on gas exchange and leaf temperature of andropogon gerardii and spartina pectinata. Bot. Gaz. 1991, 152, 263–268. [Google Scholar] [CrossRef]
  30. Bahrun, A.; Jensen, C.R.; Asch, F.; Mogensen, V.O. Drought-induced changes in xylem pH, ionic composition, and ABA concentration act as early signals in field-grown maize (Zea mays L.). J. Exp. Bot. 2002, 53, 251–263. [Google Scholar] [CrossRef]
  31. Yin, C.Y.; Berninger, F.; Li, C.Y. Photosynthetic responses of Populus przewalski subjected to drought stress. Photosynthetica 2006, 44, 62–68. [Google Scholar] [CrossRef]
  32. Zhu, X.C.; Song, F.B.; Liu, S.Q.; Liu, T.D.; Zhou, X. Arbuscular mycorrhizae improve photosynthesis and water status of Zea mays L. under drought stress. Plant Soil Environ. 2012, 58, 186–191. [Google Scholar] [CrossRef] [Green Version]
  33. Bista, D.R.; Heckathorn, S.A.; Javawardena, D.M.; Mishra, S.; Boldt, J.K. Effects of drought on nutrient uptake and the levels of nutrient-uptake proteins in roots of drought-sensitive and -tolerant Grasses. Plants 2018, 7, 28. [Google Scholar] [CrossRef] [Green Version]
  34. Chang, Z.; Liu, Y.; Dong, H.; Teng, K.; Han, L.; Zhang, X. Effects of cytokinin and nitrogen on drought tolerance of Creeping Bentgrass. PLoS ONE 2016, 11, e0154005. [Google Scholar] [CrossRef] [PubMed] [Green Version]
  35. Song, J.Y.; Wang, Y.; Pan, Y.H.; Pang, J.Y.; Zhang, X.; Fan, J.F.; Zhang, Y. The influence of nitrogen availability on anatomical and physiological responses of Populus alba × P. glandulosa to drought stress. BMC Plant Biol. 2019, 19, 63. [Google Scholar] [CrossRef] [PubMed] [Green Version]
  36. Pan, X.; Lada, R.R.; Caldwell, C.D.; Falk, K.C. Water-stress and N-nutrition effects on photosynthesis and growth of Brassica carinata. Photosynthetica 2011, 49, 309–315. [Google Scholar] [CrossRef]
  37. Yang, M.; Geng, M.Y.; Shen, P.F.; Chen, X.H.; Li, Y.J.; Wen, X.X. Effect of post-silking drought stress on the expression profiles of genes involved in carbon and nitrogen metabolism during leaf senescence in maize (Zea mays L.). Plant Physiol. Biochem. 2019, 135, 304–309. [Google Scholar] [CrossRef]
  38. Shi, H.L.; Ma, W.J.; Song, J.Y.; Lu, M.; Rahman, S.U.; Bui, T.T.X.; Vu, D.D.; Zheng, H.F.; Wang, J.H.; Zhang, Y. Physiological and transcriptional responses of Catalpa bungei to drought stress under sufficient- and deficient-nitrogen conditions. Tree Physiol. 2017, 37, 1457–1468. [Google Scholar] [CrossRef]
  39. Dziedek, C.; Oheimb, G.; Calvo, L.; Fichtner, A.; Kriebitzsch, W.U.; Marcos, E.; Pitz, W.T.; Hardtle, W. Does excess nitrogen supply increase the drought sensitivity of European beech (Fagus sylvatica L.) seedlings? Plant Ecol. 2016, 217, 393–405. [Google Scholar] [CrossRef]
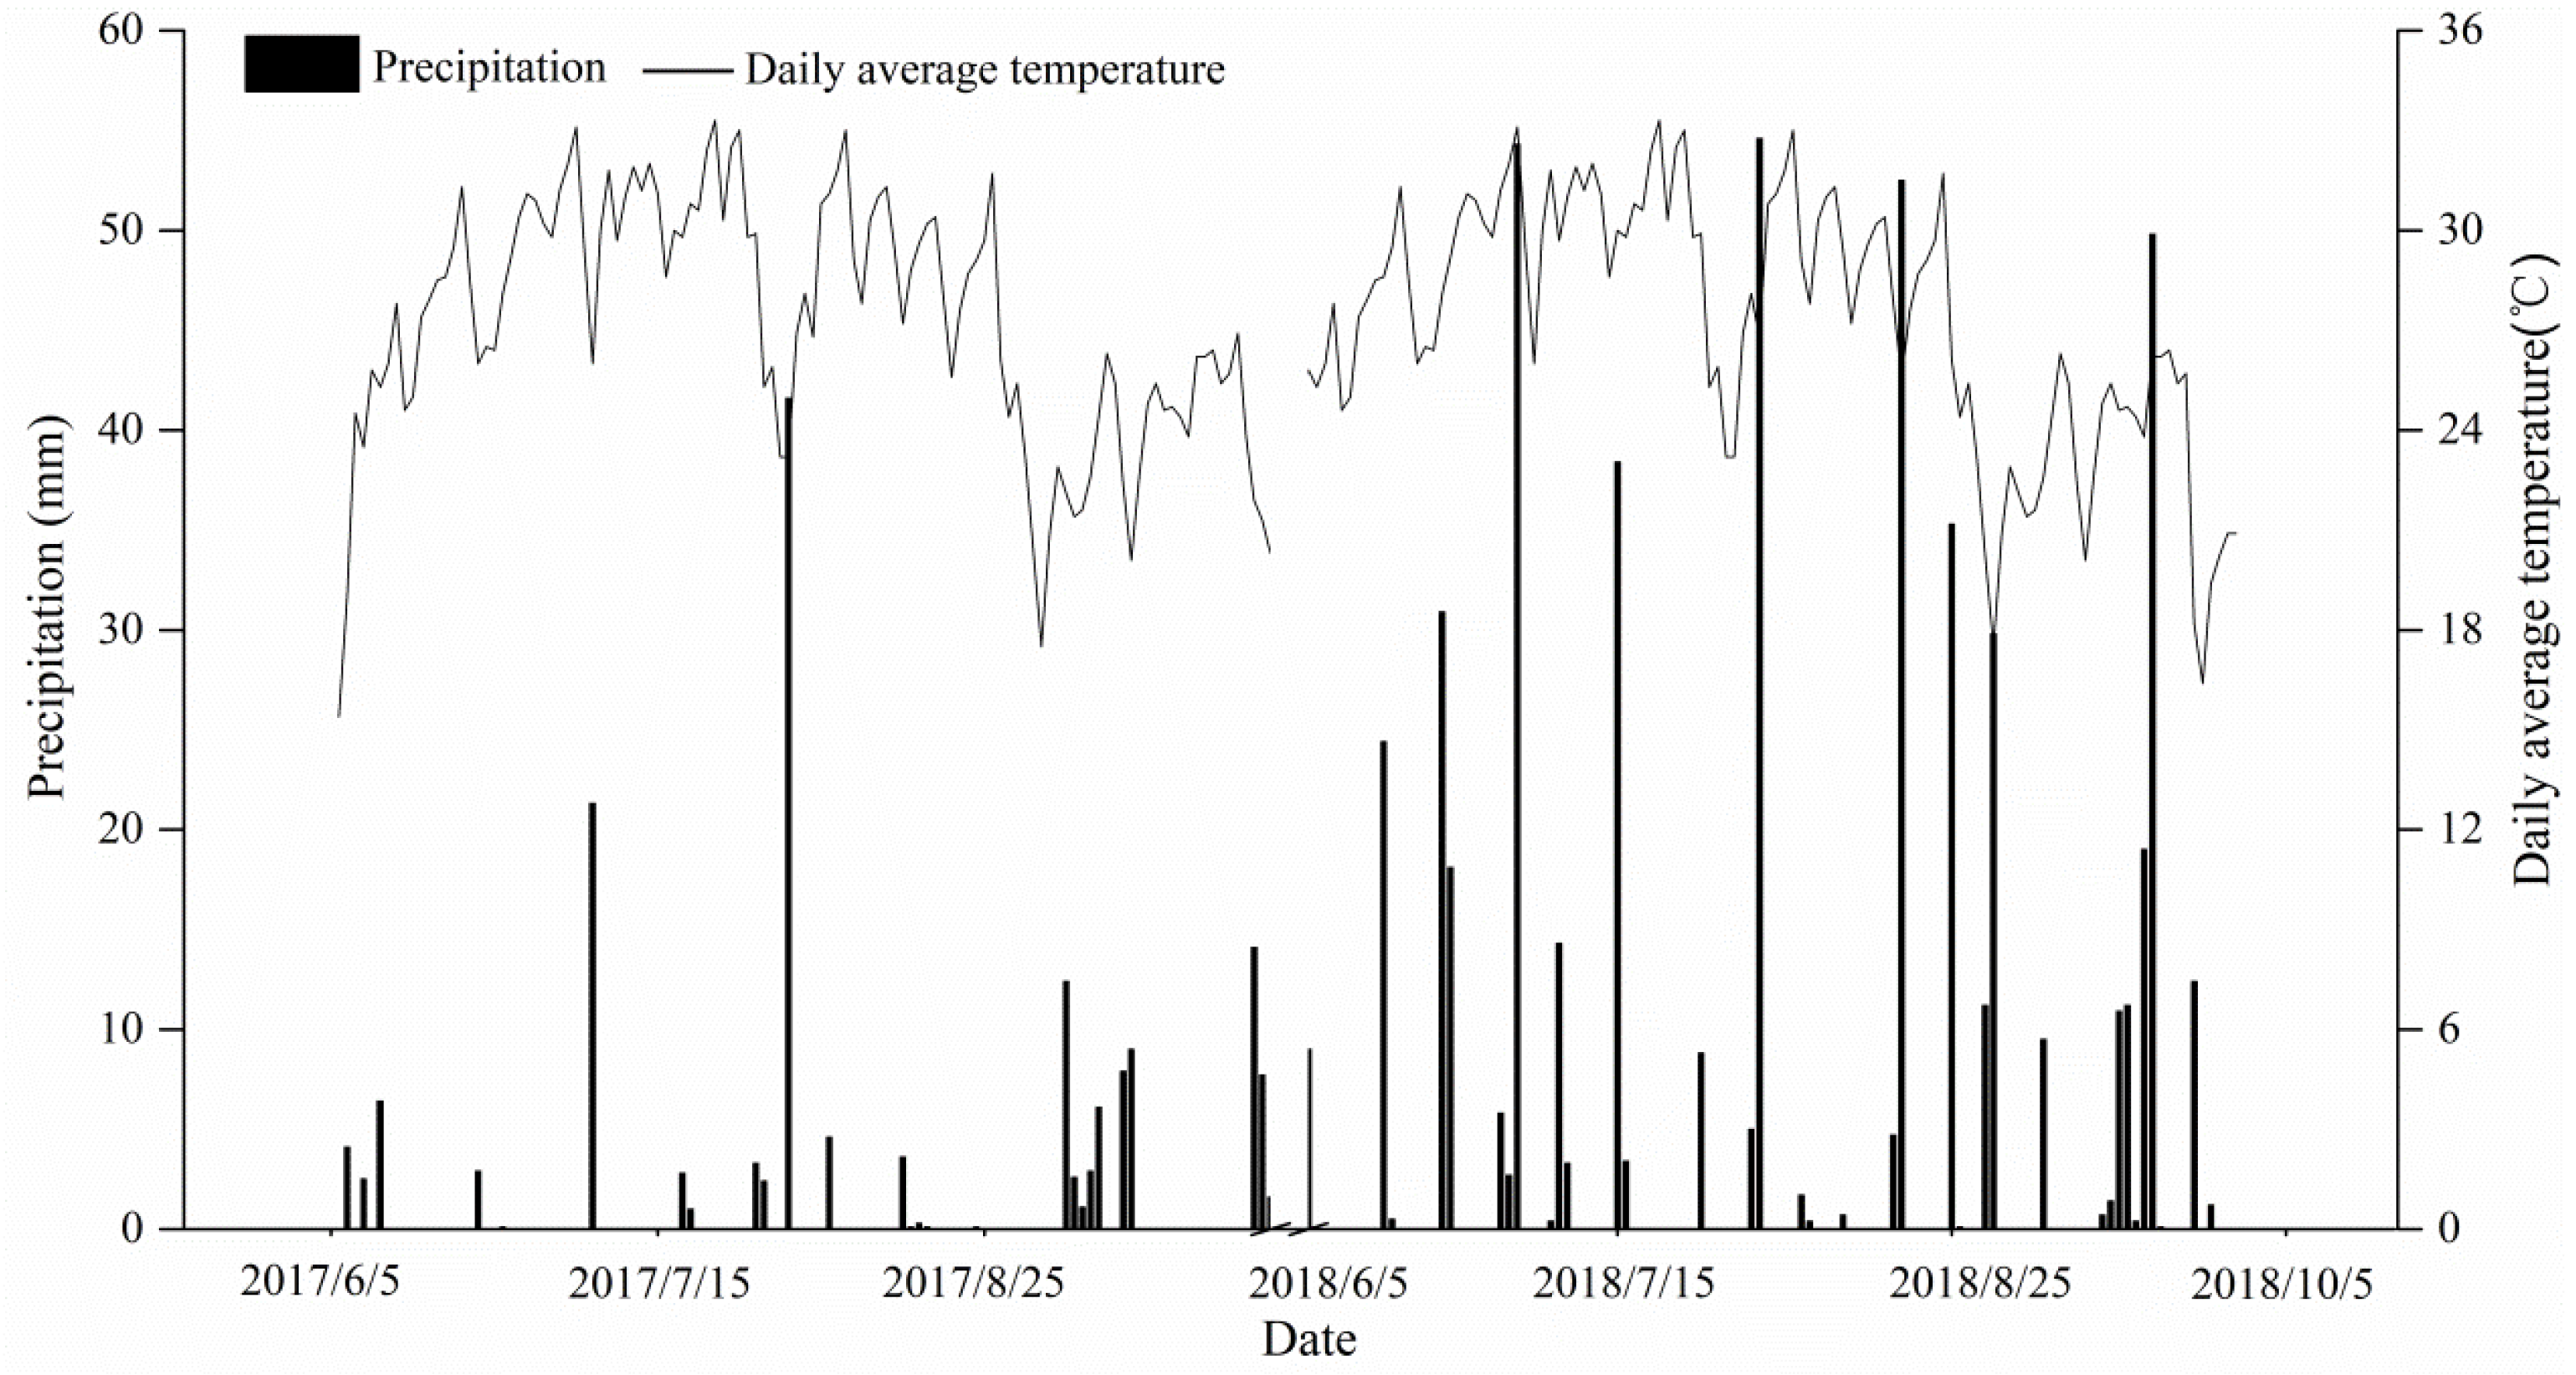
Figure 1. Daily air temperatures and precipitations during the maize-growing seasons in 2017 and 2018.
Agronomy 10 00523 g001
Figure 2. (a) Aerial drone photography of maize under nondrought stress conditions (left) and under drought stress (right); (b) leaf morphology of the cultivar Denghai 605 (DH605) subjected to drought stress with different nitrogen (N) levels.
Agronomy 10 00523 g002
Figure 3. Water consumption rates of the maize field grown subjected to drought stress under different N levels. The vertical bars represent the least significant difference (LSD) at p = 0.05.
Agronomy 10 00523 g003
Figure 4. Relative water content of maize leaves grown subjected to drought and nondrought stress under different N levels. Significant differences between two water conditions at the same N level are indicated by ns (no significance), * (p < 0.05), and ** (p < 0.01). Different letters in the same column denote significant differences between different treatments for the same cultivar (p < 0.05). Each bar represents the mean ± SD (n = 3).
Agronomy 10 00523 g004
Figure 5. Net photosynthetic rates (Pn) and transpiration rates (E) of maize grown subjected to drought and nondrought stress under different N levels. Significant differences between two water conditions at the same N level are indicated by ns (no significance), * (p < 0.05), and ** (p < 0.01). Different letters in the same column denote significant differences between different treatments for the same cultivar (p < 0.05). Each bar represents the mean ± SD (n = 3).
Agronomy 10 00523 g005
Figure 6. Grain yields of maize grown subjected to drought and nondrought stress under different N levels. Significant differences between two water conditions at the same N level are indicated by ns (no significance), * (p < 0.05), and ** (p < 0.01). Different letters in the same column denote significant differences between different treatments for the same cultivar (p < 0.05). Each bar represents the mean ± SD (n = 3).
Agronomy 10 00523 g006
Table 1. Thicknesses of the leaf margin and center of maize grown under different N levels subjected to drought and nondrought stress.
CultivarN Rate (kg ha−1)Leaf Margin (mm)Leaf Center (mm)Margin/Center Ratio
KY188
Drought02.16 ± 0.12 ab1.68 ± 0.08 b1.29 ± 0.06 ab
1201.69 ± 0.04 d1.29 ± 0.03 c1.31 ± 0.06 a
1801.55 ± 0.07 de1.22 ± 0.03 c1.27 ± 0.06 ab
2401.44 ± 0.09 e1.15 ± 0.09 c1.26 ± 0.05 ab
3601.38 ± 0.11 e1.13 ± 0.08 c1.22 ± 0.03 b
Nondrought02.23 ± 0.04 a2.35 ± 0.03 a0.95 ± 0.02 c
1202.07 ± 0.04 abc2.35 ± 0.15 a0.88 ± 0.04 cd
1801.99 ± 0.16 bc2.23 ± 0.09 a0.89 ± 0.04 cd
2401.98 ± 0.14 c2.41 ± 0.23 a0.82 ± 0.04 de
3601.96 ± 0.10 c2.46 ± 0.23 a0.80 ± 0.03 e
Mean1.85 ± 0.02 B1.83 ± 0.06 B1.07 ± 0.02 A
Drought (D)******
Nitrogen (N)******
D × N****ns
DH605
Drought02.03 ± 0.11 a1.29 ± 0.08 d1.57 ± 0.04 a
1201.85 ± 0.07 b1.31 ± 0.07 d1.42 ± 0.09 b
1801.78 ± 0.08 b1.30 ± 0.06 d1.37 ± 0.12 b
2401.75 ± 0.03 b1.29 ± 0.04 d1.36 ± 0.02 b
3601.48 ± 0.10 c1.24 ± 0.05 d1.20 ± 0.09 c
Nondrought02.10 ± 0.05 a2.60 ± 0.02 c0.81 ± 0.03 d
1202.07 ± 0.11 a2.73 ± 0.16 abc0.76 ± 0.02 d
1802.05 ± 0.13 a2.65 ± 0.13 bc0.77 ± 0.07 d
2402.14 ± 0.05 a2.78 ± 0.14 ab0.77 ± 0.05 d
3602.17 ± 0.04 a2.86 ± 0.10 a0.76 ± 0.01 d
Mean1.94 ± 0.03 A2.00 ± 0.01 A1.08 ± 0.01 A
Drought (D)******
Nitrogen (N)**ns**
D × N**ns**
Values are mean ± SD (n = 3). Different lower-case letters within a column denote significant differences between different treatments for the same cultivar (p < 0.05). Different capital letters within a column denote significant differences between different cultivars for average N rates (p < 0.05). The level of significance in univariate ANOVA (analyses of variance) is denoted by ** (p < 0.01) and ns (no significance).
Table 2. N use efficiency of maize grown under different N levels subjected to drought and nondrought stress.
CultivarN rate (kg ha−1)NAE (%)NPFP (kg kg−1)NHI (%)
KY188
Drought0--64.3 ± 2.4 a
12034.9 ± 3.2 c53.6 ± 1.3 b61.8 ± 1.4 ab
18032.4 ± 3.9 cd39.0 ± 0.8 c60.0 ± 1.3 b
24029.7 ± 4.2 cd29.3 ± 1.5 d60.7 ± 1.4 b
36027.6 ± 2.4 de19.1 ± 0.5 f60.2 ± 1.1 b
Nondrought0--64.3 ± 2.6 a
12049.5 ± 2.1 a67.8 ± 1.7 a62.5 ± 1.8 ab
18045.9 ± 3.5 ab53.5 ± 1.5 b53.6 ± 2.4 c
24040.8 ± 4.1 b37.2 ± 2.0 c54.4 ± 2.7 c
36023.7 ± 2.5 e25.1 ± 0.4 e 54.3 ± 0.6 c
Mean35.6 ± 1.2 A40.6 ± 0.4 A59.6 ± 0.5 B
Drought (D)******
Nitrogen (N)******
D × N******
DH605
Drought0--70.0 ± 1.8 a
12057.1 ± 4.5 a51.0 ± 3.2 b66.0 ± 1.2 b
18040.0 ± 3.7 c38.5 ± 2.1 c58.8 ± 0.5 d
24016.3 ± 4.4 e24.3 ± 0.8 e57.8 ± 2.9 d
36010.6 ± 4.5 e14.6 ± 0.8 f60.3 ± 1.8 cd
Nondrought0--68.2 ± 2.6 ab
12056.7 ± 2.9 a69.0 ± 1.4 a69.8 ± 0.7 a
18049.1 ± 3.8 b52.6 ± 1.5 b62.8 ± 1.8 c
24047.0 ± 4.8 b35.4 ± 0.9 d61.0 ± 1.5 cd
36030.0 ± 3.2 d22.4 ± 1.0 e60.5 ± 2.8 cd
Mean38.3 ± 3.2 A38.5 ± 0.9 B63.5 ± 0.6 A
Drought (D)*****
Nitrogen (N)******
D × N*****
NAE, N absorption efficiency; NPFP, N partial factor productivity; NHI, N harvest index. Values are mean ± SD (n = 3). Different lower-case letters within a column denote significant differences between different treatments for the same cultivar (p < 0.05). Different capital letters within a column denote significant differences between different cultivars for average N rates (p < 0.05). The level of significance in univariate ANOVA (two-way analysis of variance) is denoted by * (p < 0.05) and ** (p < 0.01).