Article

Assessment of High Temperature Effects on Grain Yield and Composition in Bread Wheat Commercial Varieties

1
Linking Landscape, Environment, Agriculture and Food (LEAF), Instituto Superior de Agronomia, Universidade de Lisboa, 1349-017 Lisboa, Portugal
2
Centro de Estudos Florestais (CEF), Instituto Superior de Agronomia, Universidade de Lisboa, 1349-017 Lisboa, Portugal
*
Author to whom correspondence should be addressed.
Agronomy 2020, 10(4), 499; https://doi.org/10.3390/agronomy10040499
Submission received: 7 March 2020 / Revised: 29 March 2020 / Accepted: 29 March 2020 / Published: 2 April 2020

Abstract

:
Wheat is one of the most important cereals for food and feed, and it is, therefore, necessary to determine the effects of short-term high temperature events (heatwaves) during grain filling. These heatwave events are increasingly common, especially in Portugal. In this work, seven commercial varieties recommended for production in Portugal were submitted to one-week high temperature (HT) treatment ten days after anthesis to evaluate heat effects on grain yield and quality. Grain yield parameters, such as grain number and weight, were evaluated as well as grain composition through attenuated total reflection Fourier transform infrared (ATR-FTIR) spectroscopy. Variation in HT response between varieties was detected. Grain number and weight tended to decrease in most varieties analyzed. However, two varieties proved to be more resilient since grain number and weight remain unaltered in the Bancal variety, which is the one with better yield results, and even increased in the Pata Negra variety. Regarding grain composition, the comparison between ATR-FTIR spectra of milled grains from control and HT plants revealed alterations in peaks assigned to polysaccharides and proteins. Additionally, a model was built based on nitrogen elemental analysis to predict protein content in flour samples through spectral data that corroborated the differences identified by spectra profile comparison. Moreover, both analyses showed that the intervarietal diversity observed in control conditions was significantly reduced in HT treated plants. The results obtained highlight the intervarietal diversity of wheat response to HT, regarding grain yield parameters, grain composition, and particularly, protein content.

1. Introduction

Wheat (Triticum aestivum L.) represents 25% of the world’s cereal production and constitutes one of the main food sources of carbohydrates, proteins, fibers, amino acids, and vitamins, providing 20% of the calories and 25% of proteins consumed worldwide on a daily basis [1,2]. Although being produced worldwide under diverse environmental conditions, the required optimum temperature for wheat anthesis and grain filling is from 12 to 22 °C [3]. Each degree Celsius increase reduces wheat yield by 4.1% to 6.4% [4]. Several yield parameters are affected by high temperatures as vegetative weight and grain number and weight, as reviewed in [5]. Grain number is strongly affected by high temperatures, especially between spike initiation and anthesis [6]. Grain mass is reduced with high temperature after anthesis, particularly when the treatment is imposed in early stages [7,8]. Heat stress also shortens grain filling duration, as reviewed in [9], affecting starch and storage protein deposition. During grain filling, the activity of starch synthesis enzymes is moreover reduced with temperatures above 30 °C [10,11], decreasing even more starch content. On the other hand, during grain filling, high temperature has been reported to increase protein grain content, as kernel size is smaller, and this augment seems to be higher when high temperatures are imposed in early stages of grain filling [8,12,13].
The study of wheat grain composition is fundamental since it could be associated with variations in breadmaking performance and nutritional quality. However, classical analytical methods are usually time consuming and laborious. Infrared spectroscopy, on the other hand, is a rapid, non-invasive methodology that can detect a range of functional groups and changes in molecular structure. Chemical mapping using ATR-FTIR (attenuated total reflection Fourier transform infrared) spectra have clear and easily identifiable peaks that correspond to specific bonds and functional groups and has been successfully applied to a wide range of cereals and food and feed products [14,15,16,17,18,19]. This technique was already used in wheat to assess endosperm cell-wall composition, grain infection, and flours quality control [14,16,20,21].
Wheat is one of the crops most affected by the increase in mean temperature during the growth season [22,23]. Climate changes enhance the frequency of extreme heat events in Portugal [24]. Thus, it is becoming urgent to acquire a deeper understanding of their effects in yield and nutritional parameters, such as protein content of wheat varieties, to enrich breeding programs. In the present work, we aim to evaluate the effect of a short-term high temperature, impose at the initial stages of grain filling, on grain yield and quality in distinct bread wheat varieties recommended to be produced in Portugal. Comparative analysis of both yield and ATR-FTIR spectra provide evidence of intervarietal diversity in high temperature response, with alterations on grain number, weight and macro components, such as starch and protein. In addition, a model based on ATR-FTIR was established to allow the expeditious estimation of protein content based on elemental analysis data.

2. Materials and Methods

2.1. Plant Material

The bread wheat (Triticum aestivum L., 2n = 6x = 42, AABBDD) commercial varieties studied in this work were selected from the List of Bread Wheat Varieties Recommended for Portugal [25]. This list was established, considering the phenological, agronomic, and technological traits. Varieties used were Almansor, Antequera, Bancal, Estero, Nabão, Pata Negra, and Roxo, and seeds were gently supplied by INRB/INIAV Portugal (National Institute of Biological Resources) and ANSEME, Portugal (National Association of Seed Producers and Traders). Twenty seeds (obtained after two years of controlled propagation) from each variety were germinated and grown in control conditions—8 h of darkness at 20 °C and a 16 h light period divided into 6 h with increasing temperature to 25 °C, 4 h at 25 °C, and 6 h decreasing to 20 °C. Three-week old plants were transferred to soil pots and maintained in greenhouse conditions.
When the first anther was observed in the first spike (anthesis), plants were again transferred to growth chambers with the previously described conditions. Ten days after anthesis (daa) subsets of ten plants each were submitted to two different growth conditions for seven days. Ten plants were maintained in the same (control) conditions, and another ten were submitted to a high temperature (HT) treatment in which the 16 h daylight period was initiated by a gradual increase in temperature from 20 to 40 °C during 6 h, followed by exposure to 40 °C for 4 h, and a subsequent gradual decrease to 20 °C during 6 h (Supplementary Material, Figure S1). After treatments, all plants were transferred to the greenhouse and maintained until the end of the growing cycle. All further analyses were performed only in seeds from the first spike to guarantee identical developmental stages during HT treatments. For grain ATR-FTIR spectra analyses and nitrogen content quantification, the embryo was removed, simulating germen industrial removal procedure for flour production.

2.2. Yield Evaluation

Yield parameters were evaluated in all plants of the seven varieties studied in both control and treatment conditions. The number of grains/spike and grain weight/spike (g/spike) were assessed in the first spike of each plant. The average weight of 10 grain (g/10 kernels) was deduced from the last two.

2.3. ATR-FTIR Spectroscopy

Before ATR-FTIR spectra acquisition, grains were previously weighted, ball-milled in a Cryomill (Retsch GmbH, Haan, Germany), and lyophilized overnight. Spectra were acquired on a minimum of eight single kernels per variety and per condition (control and high temperature treated).
Single kernel flours FTIR spectra were recorded with a Bruker-P Alpha spectrometer (Bruker, Ettlingen, Germany) equipped with a single reflection diamond ATR accessory. The spectra were obtained between 4000 cm−1 to 400 cm−1 with a resolution of 4 cm−1. Each spectrum was the average of 24 scans. Processing of the spectra was performed with OPUS software V. 8.0 (Bruker Optics, Ettlingen, Germany). For comparison of the average spectra by variety, spectra were Min-Max normalized between the minimum at 1800 cm−1 (set to zero) and the maximum (set to 2) bellow 895 cm−1.
Partial least squares (PLS) regression models were calculated by regressing the vector normalized spectra information against nitrogen concentration for 42 samples (calibration), using OPU/QUANT V 8.0 (Bruker Optics, Ettlingen, Germany). Vector normalization normalizes a spectrum by first calculating the average intensity value and subsequent subtraction of this value from the spectrum. Then the sum of the squared intensities is calculated, and the spectrum is divided by the square root of this sum. The vector norm of the resulting spectrum is always 1. The number of principal components was selected according to the minimum root-mean-square error of cross-validation (RMSECV) by the “leave one out” method, i.e., each sample is left out of the model formulation and predicted once. The nitrogen content of the remaining samples was predicted, and 14 samples, covering the range of predicted nitrogen values, were selected for further reference analysis and model validation. The quality of the model was assessed by the statistics of the validation including the coefficient of determination (R2), the random mean square error of prediction (RMSEP), and the residual prediction deviation or ratio of performance to deviation (RPD), calculated as the ratio of two standard deviations; the standard deviation of the reference data for the validation set [26]. The nitrogen content values obtained were used to calculate the protein content using the conversion factor of 5.7×.

2.4. Elemental Analysis

The nitrogen content was quantified in the flour of three individual grains per variety/condition, at the REQUIMTE@UCIBIO-FCT-UNL analytical laboratory using a Flash EA1112 CHNS analyzer (Thermo Finnigan CE Instruments, Milan, Italy) equipped with a gas chromatography column and a thermal conductivity detector.

2.5. Data Analysis

To compare yield parameters and protein content between varieties, values were fitted to a linear model (ANOVA with one factor with fixed effects) and analyzed through a multiple means comparison test (Tukey test). The individual effect of the HT treatment in comparison with control condition for each variety was tested using t-test. Models were fitted in R using aov and Tukey. HSD functions.

3. Results and Discussion

Yield and grain composition parameters were comparatively evaluated between the varieties for control and high temperature treated plants.

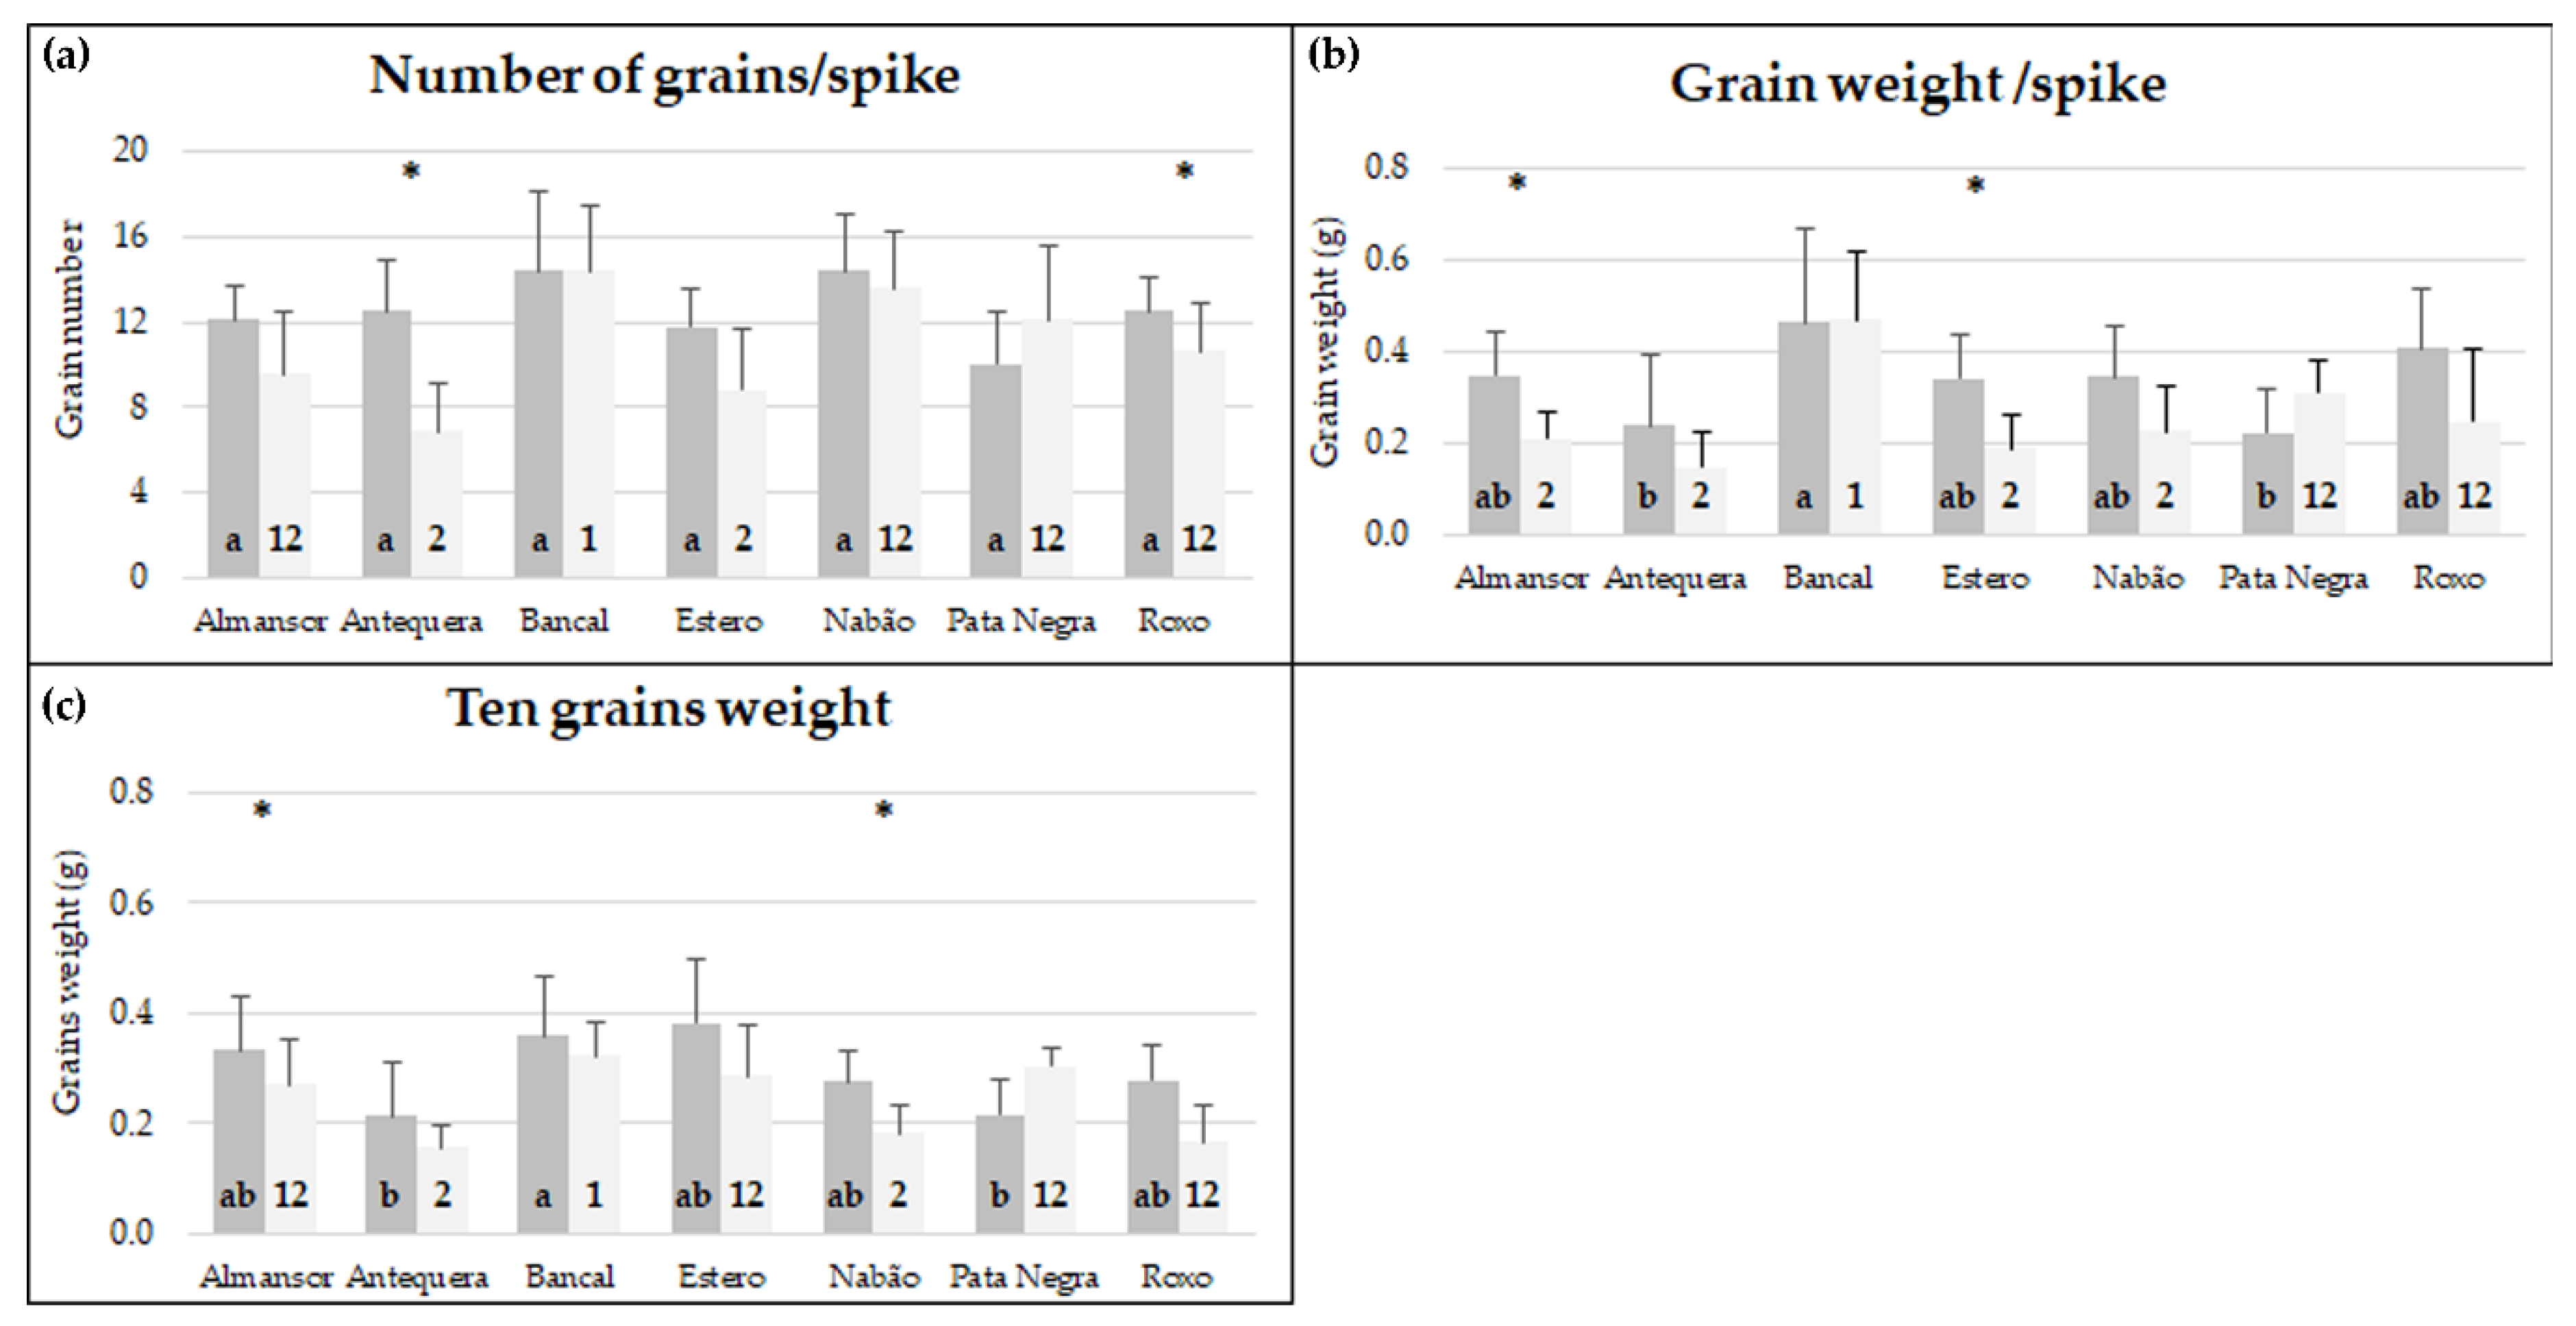
3.1. HT Treatment Effects on Grain Yield Parameters Disclosed Intervarietal Diversity

The number of grains/spike, grain weight/spike (g/spike), and the average weight of ten grain (g/10 kernels) of both control and treatment plants are presented in Figure 1.
The mean number of grains/spike in control conditions revealed no significant differences between varieties, with values ranging between 10 (Pata Negra) and 14.43 (Nabão). On the other hand, under control conditions, first spike grain weight revealed significant differences between varieties. Bancal presented a value significantly higher (0.49 g) than Antequera (0.22 g) and Pata Negra (0.21 g), and Bancal ten grains’ weight (0.32 g) was also significantly higher than Antequera (0.19 g).
The evaluation of high temperature treatment effects on each variety revealed that the number of grains per spike was not significantly affected (p < 0.05) in most of the varieties analyzed except in Almansor and Antequera that denoted a decrease. Previous works indicated that major differences in grain number are caused by heat treatments before or during anthesis, as reviewed in [6], as they affect meiosis and fertilization. In fact, grain abortions and reduction in grain number resulting from heat before and during anthesis were documented for a few cultivars [27,28]. However, our results suggest that the effect of heat stress on grain number depends not only on the developmental phase affected but is also influenced by the differential tolerance of each variety to heat stress. Regarding grain weight parameters, significant differences were observed in grain weight/spike of Almansor, Estero, and Pata Negra and ten grains weight of Nabão and Pata Negra. Interestingly, both grain weight parameters evaluated consistently increased in HT treated Pata Negra plants.
The comparison between varieties after imposition of high temperature revealed that Bancal was the least affected variety. It recorded higher values in all the three parameters assessed in comparison with all the other varieties. The mean number of grains/spike of Bancal (14.38) was significantly higher than Antequera (6.86) and Estero (8.8). In addition, Bancal grain weight/spike (0.49 g) was significantly higher than Almansor (0.21 g), Antequera (0.11 g), Estero (0.19 g), and Nabão (0.23 g). Regarding ten grains weight, Bancal also exhibited a value (0.32 g) significantly higher than Almansor (0.24 g), Antequera (0.15 g), Estero (0.23 g), and Nabão (0.16 g).
Although in most varieties, the values of the grain yield parameters studied tended to diminish, different responses to HT treatment were revealed. Bancal and Pata Negra seem to be the most promising varieties for wheat breeding strategies considering high temperature conditions since the former presented superior yield parameters in such conditions in comparison with all other varieties and the latter presented higher grain yield after HT treatment.

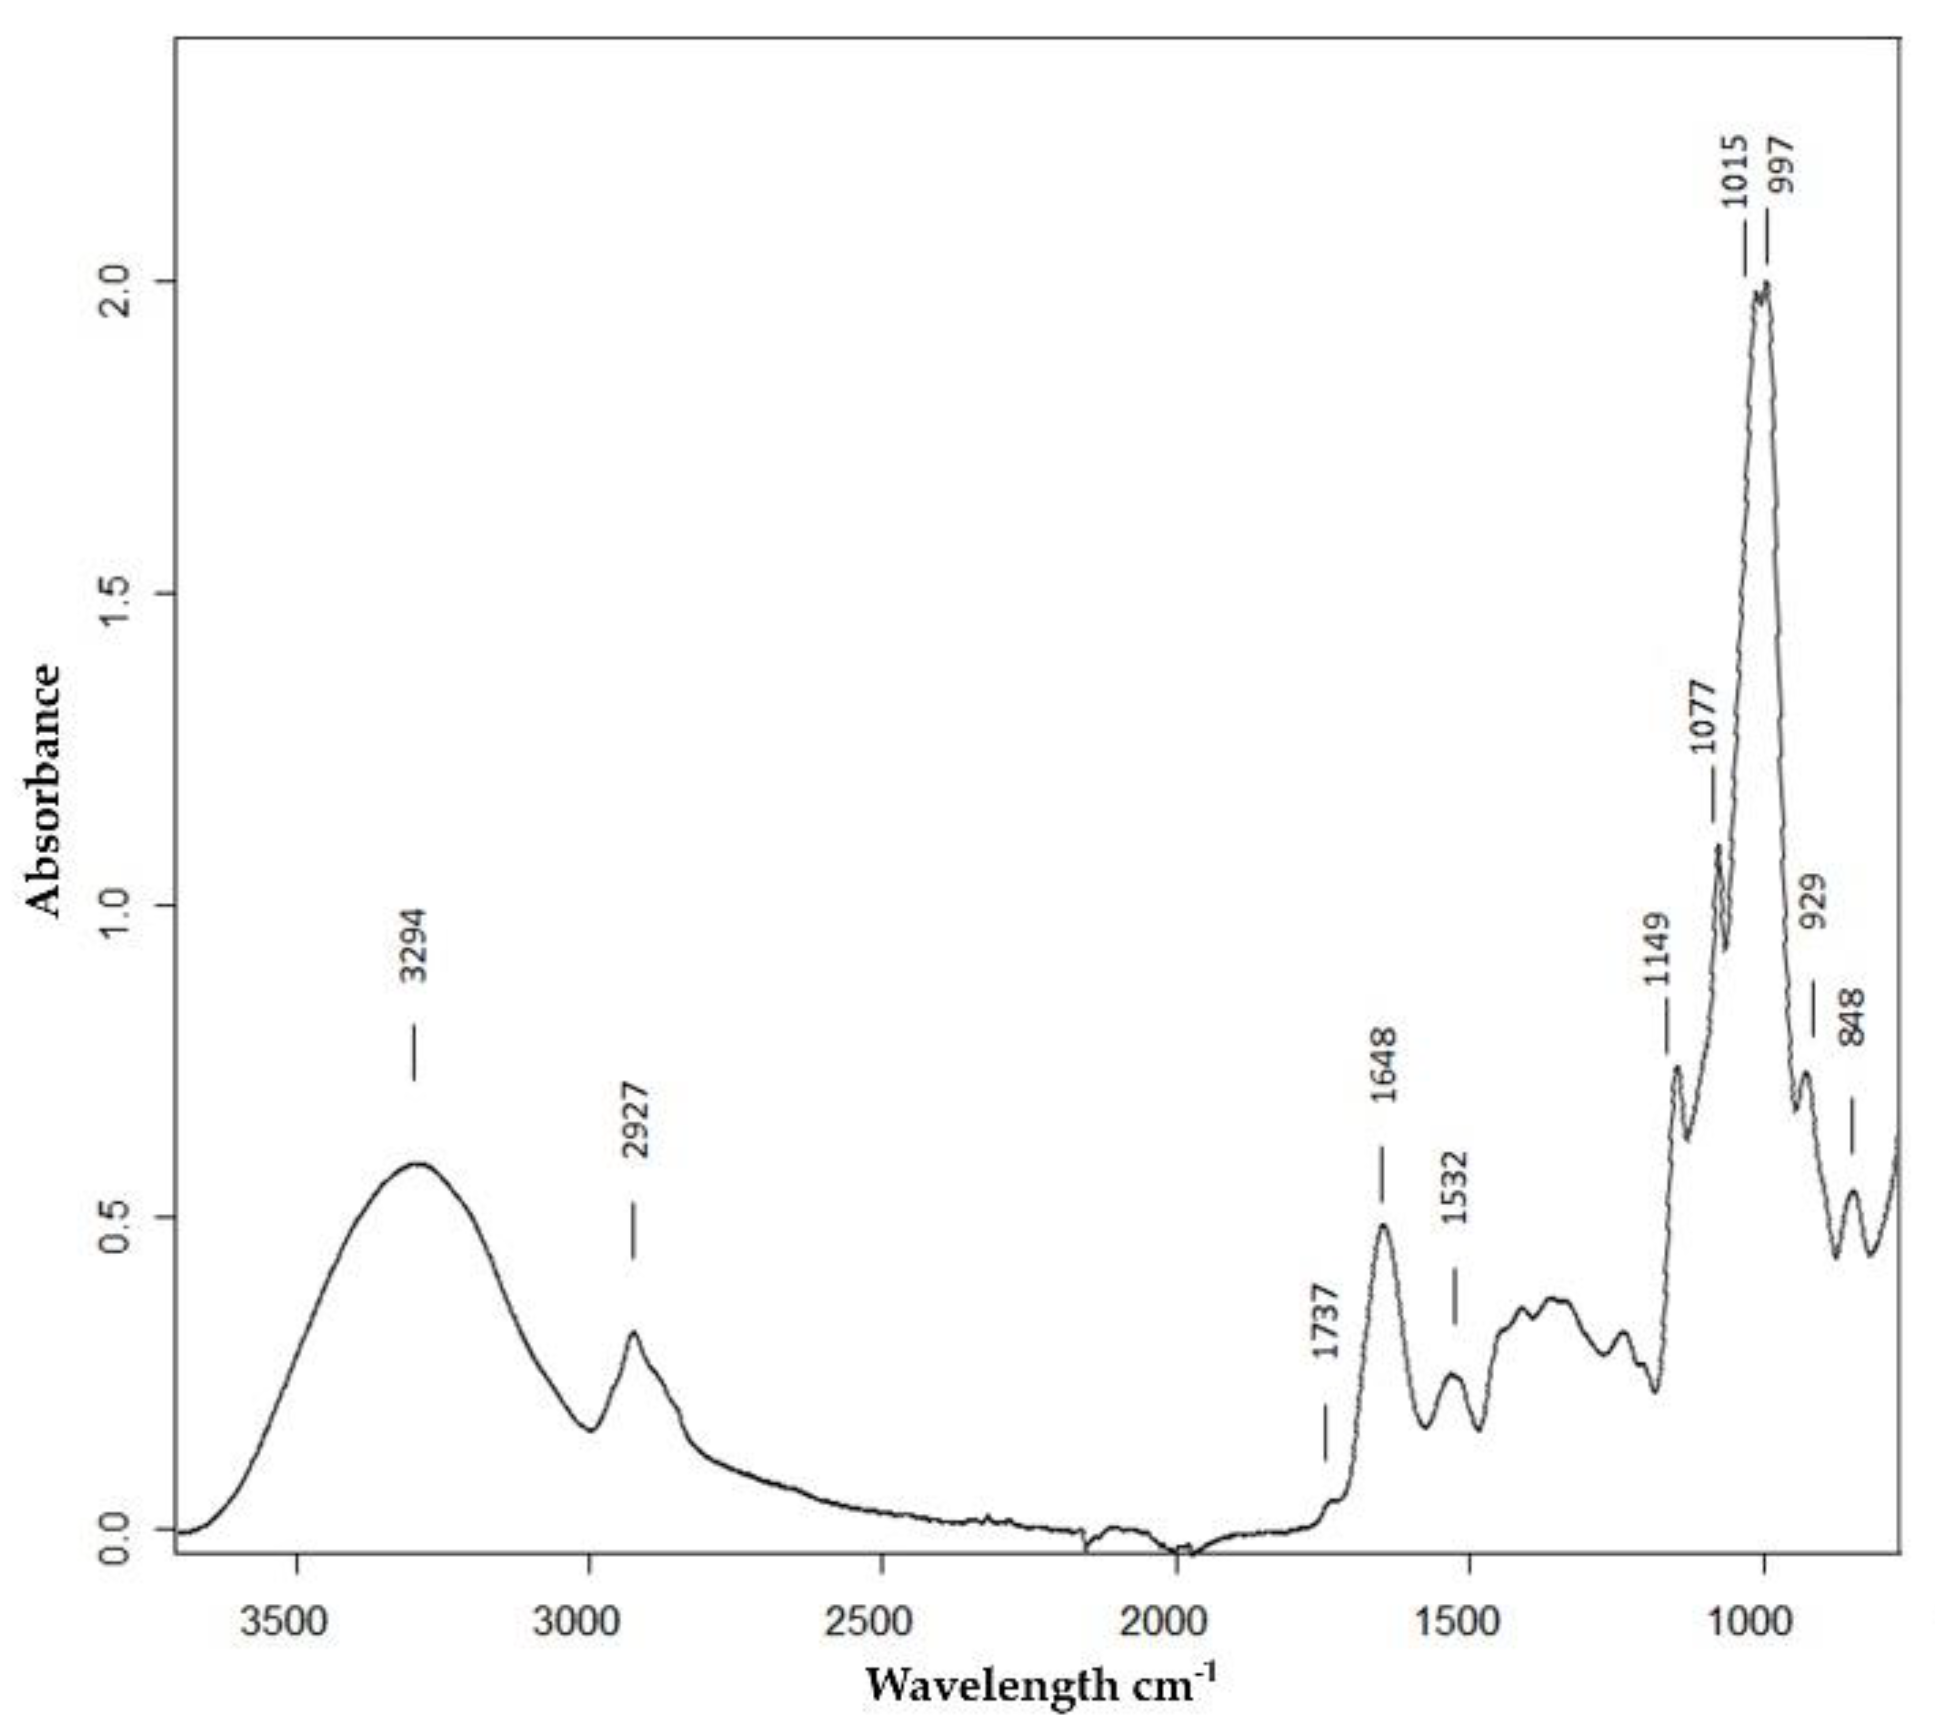
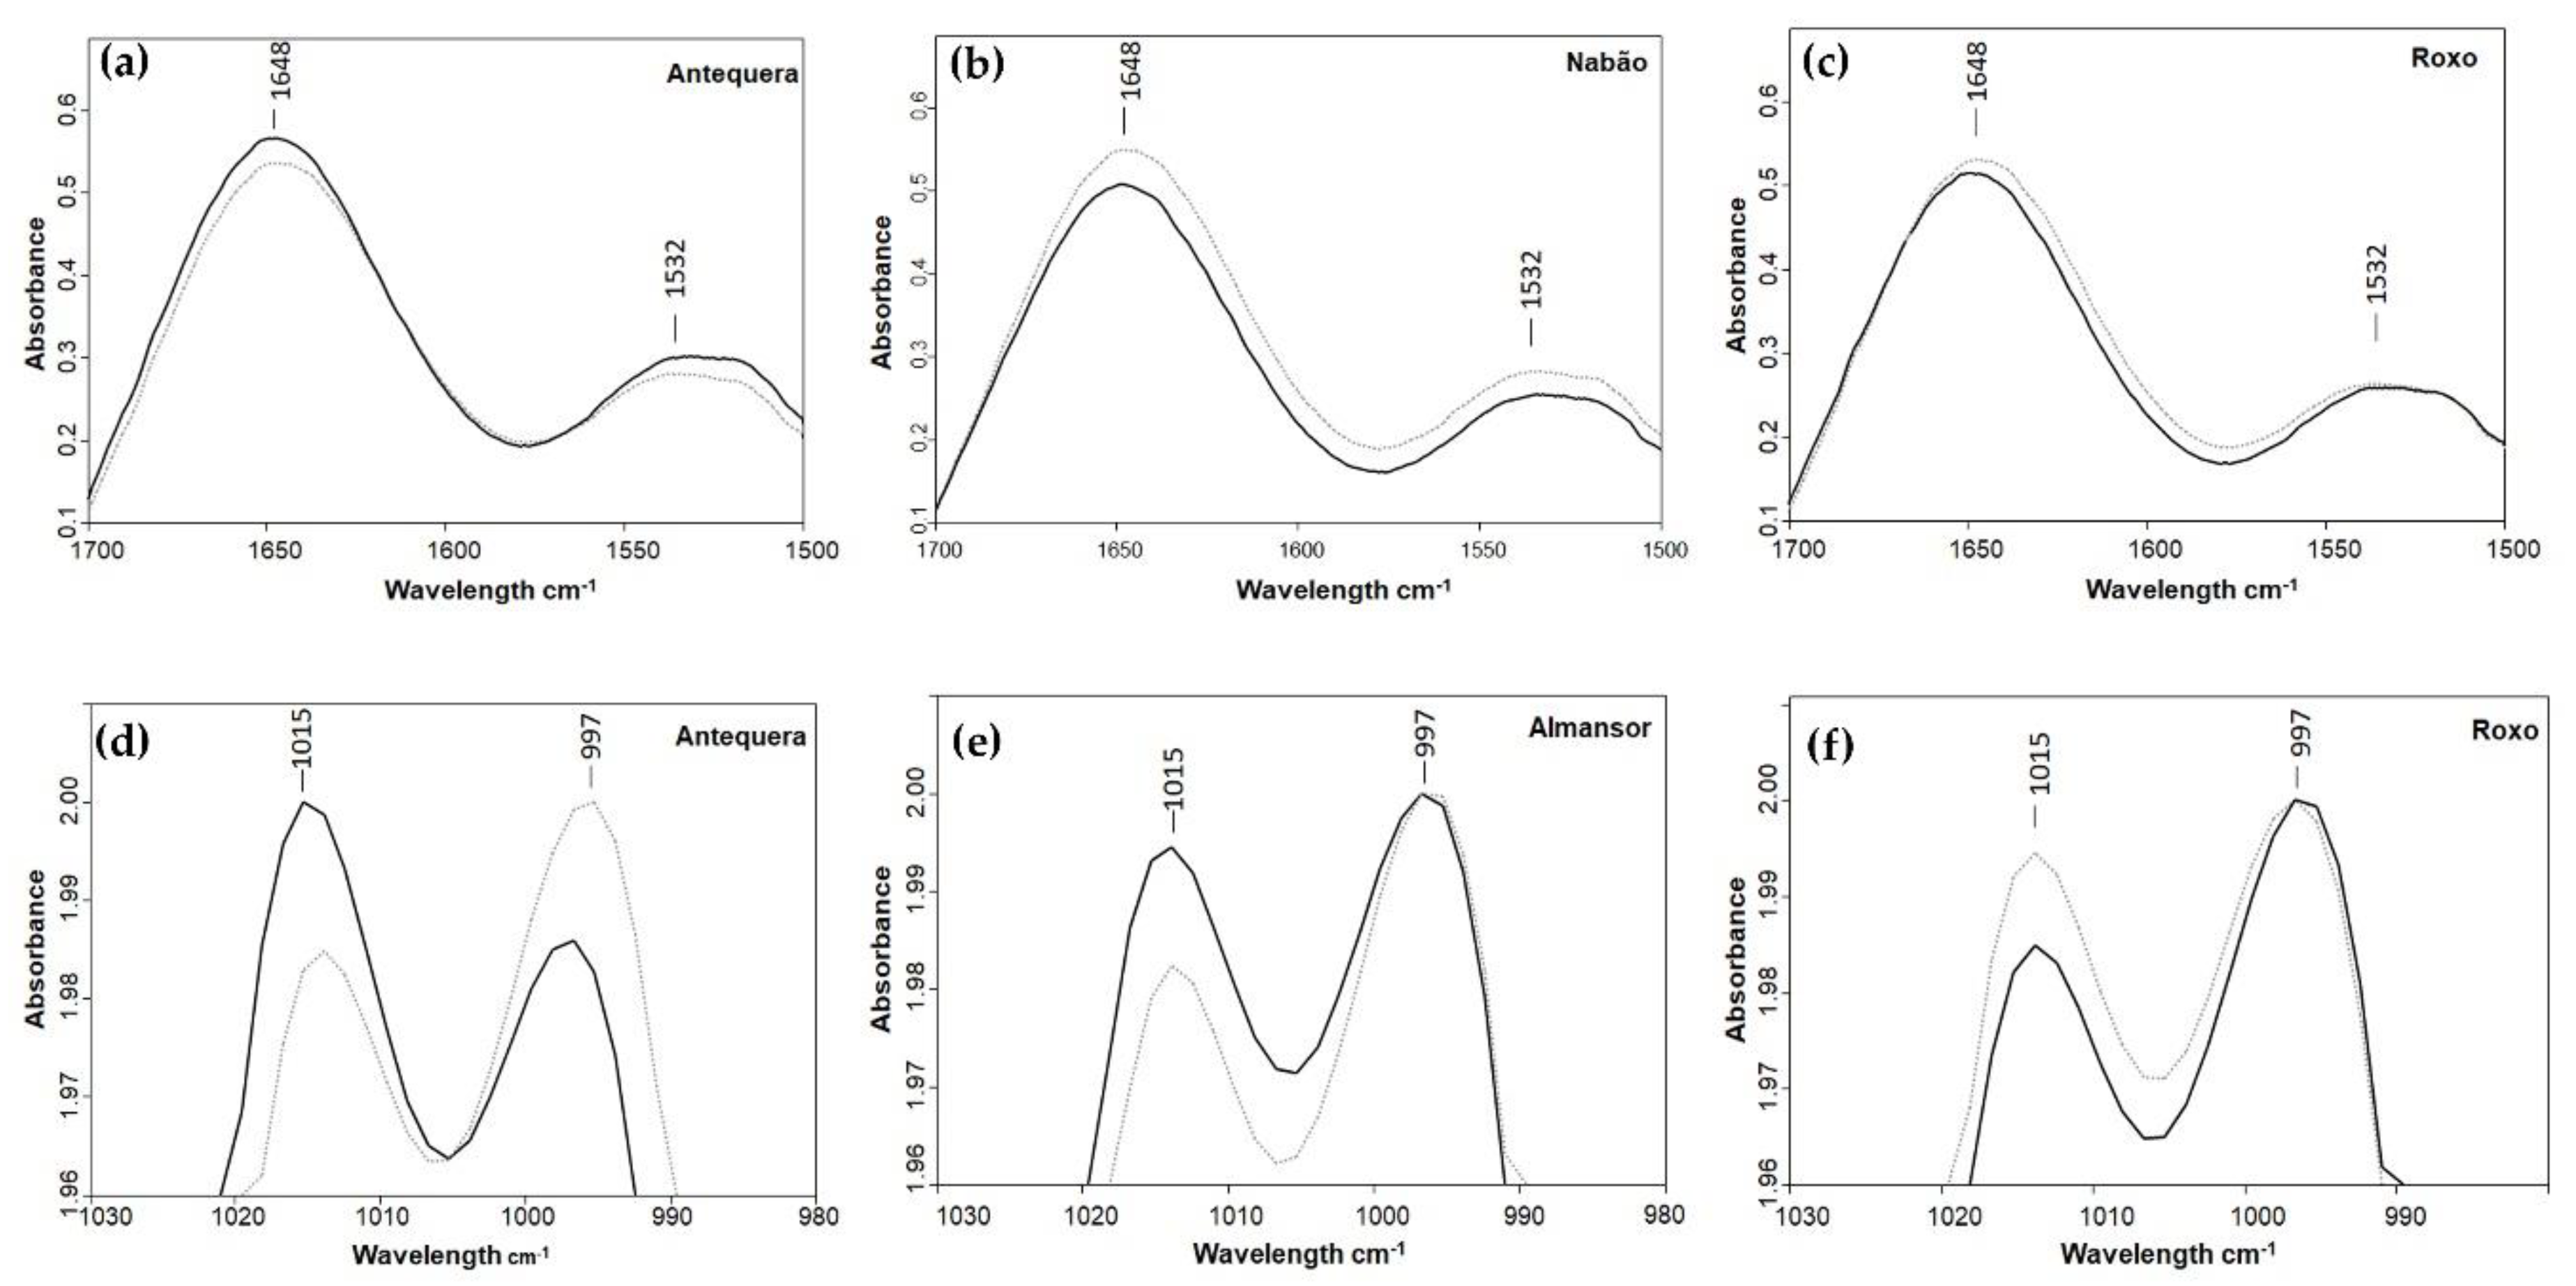
3.2. ATR-FTIR Comparison of Control and HT Treated Grains Revealed Complex Responses

In this work, we have performed single kernel ATR-FTIR spectroscopy spectra from at least eight kernels per variety. Figure 2 shows the average spectrum in the wavenumber region 3700–780 cm−1 from Roxo variety control samples. All the spectra from the remaining varieties in both conditions presented the same bands with variations in intensities.
The wheat flour spectra obtained were dominated by a large envelope with two intense bands with maxima at 1015 and 997 cm−1, arising from C–O valence vibration in starch, and lower intensity ones at 1149, 1077, and 929 cm−1, all typical saccharide bands arising mainly from starch that is the main component (60%–75%) of the wheat grains [29]. The band with a maximum at 2927 cm−1 assigned to the stretch vibration of CH2 is also mainly from starch. The contribution of the proteins, the second most important component of wheat grain [29], is clearly seen in the spectrum as two bands with maxima at 1648 and 1532 cm−1 from amide I and amide II, respectively. The contribution of N-H stretching from proteins molecules was detected around 3200, but in our spectra was masked by the broad band with a maximum at 3294 cm−1, mainly assigned to O–H stretching from the starch polymer. A very weak band, in some cases only a shoulder, located at 1737 cm−1 could be from C=O stretching from lipids that, if present, would be in a small percentage.
The comparison of the intensity maxima at selected wavenumber bands between the average spectra of treatment vs. control for each variety is shown in Table 1. For the majority of varieties, spectra were normalized at 997 cm−1 (maximum) with three exceptions from control groups (Antequera, Estero, and Pata Negra), where maximum (normalization) occurred at 1015 cm−1.
Since the spectra were normalized for the most intense starch bands (1015 or 997 cm−1), it was expected that changes would occur in the two bands from proteins, the second most abundant component of wheat grain [29]. In fact, differences between control and HT for each variety occurred in the intensity of amide I and II bands (1641 and 1532 cm−1, respectively), particularly a reduction in Antequera, Estero, Almansor, Bancal, and Pata Negra, was observed although less intense in the last three varieties. The opposite pattern was observed in Nabão, presenting more intense bands in samples from HT plants than in samples from control. For Roxo, no discernible difference was observed between control and HT spectra (Table 1 and Figure 3).
Considering starch bands from spectra, in Almansor, Bancal, Nabão, and Roxo, the maximum of both control and HT samples spectra was in 997 cm−1 (Table 1, Figure 3e,f). On the other hand, in Antequera, Estero, and Pata Negra, it was possible to observe a shift between both conditions in the maxima of the spectra, in which the maximum was in 1015 cm−1 in control samples. In treated grains, the maximum was in the 997 cm−1, and this variation was more pronounced in Antequera, as observed in Figure 3d. These results represent the absence of intervarietal differences in polysaccharides composition previously observed in control conditions, clearly indicating a marked effect of HT in polysaccharides synthesis. This was already obtained in transcription levels of genes associated with grain quality traits and protein fractions evaluations after high temperature treatment during grain filling developmental phase [30]. Furthermore, bands with maxima at 929 and 848 cm−1 have higher relative absorbance in grains from HT plants of Antequera, Nabão, Pata Negra, and Roxo in comparison to the ones obtained from control plants, while the opposite was observed in Almansor and one Estero peak. On the other hand, bands with the maxima at 1149 and 1077 cm−1 were only slightly affected by HT, since relative absorption of one or both peaks diminished in Almansor, Antequera, Bancal, and Estero and was enhanced in Nabão, Pata Negra, and Roxo. Using those peaks as an inference for the amount of starch, we can speculate that HT induced in Nabão and Roxo an unexpected increase in these grains’ constituent. This novel result obtained through ATR-FTIR spectra analysis and predicted protein content contrasts with Hurkman et al.’s [11] report of starch content decrease induced by longer periods at 37 °C in only one wheat variety, or a slower deposition rate observed in plants of different varieties submitted to similar temperatures [10].
It is also possible to see the bands that are indicative of the presence of lipids, namely, the C–H stretch at ~2927 cm−1 and a peak from the ester linkage at ~1737 cm−1 [31]. Both peaks presented lower relative absorption in samples from treated grains of Almansor, Bancal, Estero, and Pata Negra, while in Antequera and Nabão, the 2927 cm−1 peak was more intense in treated plants spectra, and the 1737 cm−1 peak was very similar in both conditions (Table 1). Again, Roxo appeared to be less affected, having both spectra very similar relative absorptions. The contribution of these lipids fraction peaks should be negligible as it constitutes 3%–4% of the whole grain. Moreover, the embryo, which is responsible for one-third of the wheat grain lipid fraction [32], was removed before grain milling. Even so, four varieties presented less intense peaks in treated grains. Interestingly, as already observed in amide I and II protein peaks, no significant variation was detected in Roxo lipids fraction peaks revealing higher stability coping with high temperatures treatments.

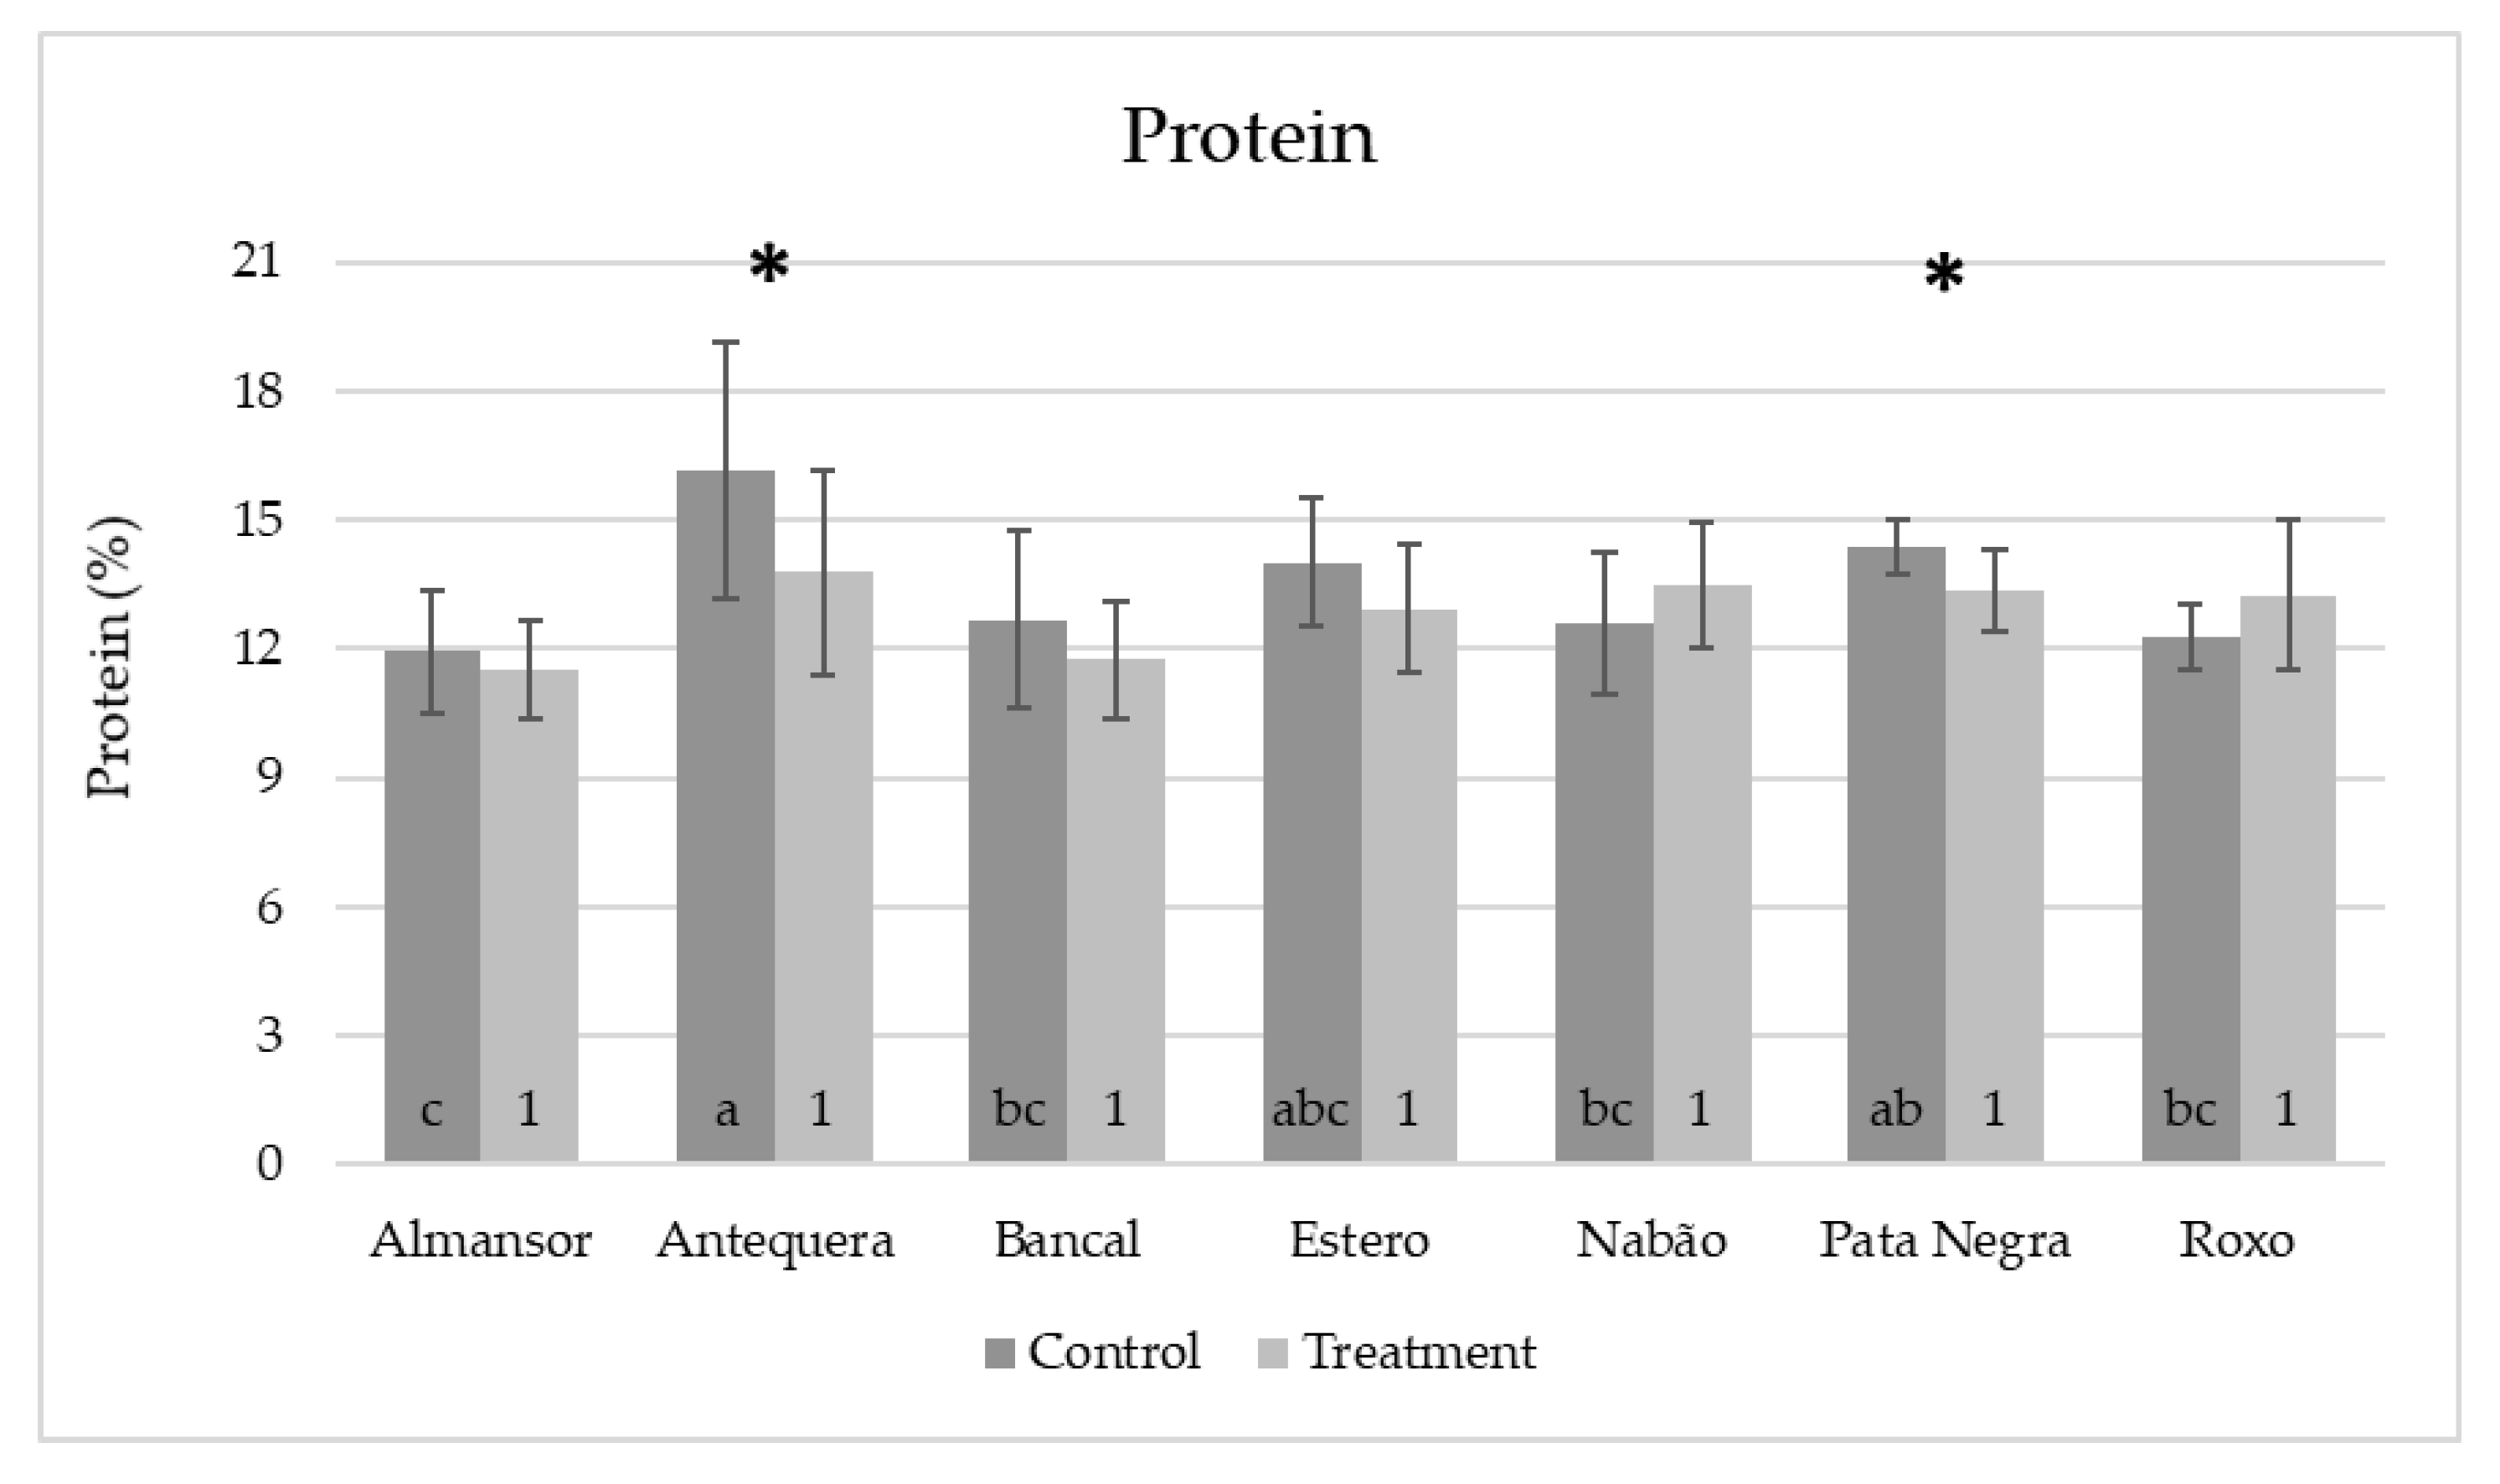
3.3. Calibration and Validation of the Model for Nitrogen Content Based on ATR-FTIR Spectra

High correlations were obtained between spectral data and nitrogen content both for cross-validation and validation (Figure 4). The nitrogen content values obtained by elemental analysis (Supplementary Material, Table S1) for calibration set ranged between 1.7 and 2.7 mg of N/100 mg of flour. The model obtained had good statistics: R2 = 0.91, RMSECV = 0.10, RPD 3.5. Validation set samples, comprising thirteen single kernels, were selected covering the entire range of nitrogen values predicted by the model and additionally four outsider samples with values above the range in the model. The predicted nitrogen values ranged from 1.8 to 3.2 mg of N/100 mg of flour. The validation statistics (R2 = 0.95, RMSEP = 0.10, and RPD = 4.3) show that the model correctly predicts the nitrogen content, including the four outsider samples. Mean protein values of each variety (Figure 5) and conditions were obtained from nitrogen values predicted by the model established multiplied by the conversion factor of 5.7× [33].
Protein content values obtained in all samples analyzed in this study (control or HT treated) ranged between 9.5 and 21.4%. These values are in accordance with a recent report [33] that surveyed protein contents ranged from 6.2 to 19.8% in samples from the UK, Canada, France, Italy, Germany, and Eastern Europe grown under a wide diversity of agronomic and climatic conditions. The global results obtained from plants control or HT treated (Figure 6, dark grey and light grey bars, respectively) revealed a tendency to average protein content reduction induced by HT (from 13.4% and 12.9%, respectively).
The comparative analysis between varieties maintained in control conditions (Figure 5, dark grey bars) revealed that the protein content of Antequera was significantly higher than the ones obtained in Almansor, Bancal, Estero, Nabão, and Roxo. In Almansor, this value was also significantly lower than Pata Negra. However, as can be seen through the analysis of light gray bars in Figure 5, such significant intervarietal differences were no longer observed in grains from HT treatment plants. However, as can be seen through the analysis of light gray bars in Figure 5, such significant intervarietal differences were no longer observed after HT treatment, which was also evidenced by the lower range of average protein content per variety in grains from treated plants (2.0%) in comparison with the range observed in control ones (4.2%). Again, the comparison of all control vs. HT values obtained, regardless the genotype presented in Figure 6, show that the dispersion of protein content values was lower in the treatment dataset, as well as the standard deviation values obtained, which diminished from 2.20 in control condition to 1.76 in HT treated plants.
The comparison between the average protein content of each variety control and HT samples showed significant variation in Antequera and Pata Negra varieties corresponding to a decrease in the predicted protein contents (from 16.3% to 13.4% and 14.7% to 13.7%, respectively, Figure 5). These results were in accordance with the ones obtained for amide I and II bands peaks described above, validating ATR-FTIR comparative assessment consistency. Moreover, single-seed analysis possible with this methodology unraveled intervarietal quality diversity that may be valuable across variable climatic conditions, as suggested by [34].
Considering the relation between changes in protein content and grain weight, previous works suggested that rising temperature during grain-filling results in shrunken grain with increased protein content [8,12,35]. However, we only observed significant variation in both parameters in the Pata Negra variety that revealed an increase in grain weight and a decrease in protein content. This result highlights once again the novelty of the present work disclosing intervarietal diversity in plant response to cope with heat stress.

4. Conclusions

This work contributes to understanding the distinct response of different varieties to heatwave events that are increasingly common and intense in Portugal. Altogether our results clearly unravel that HT treatment impact on grain composition parameters leads to lower intervarietal diversity. A similar effect of short-term HT treatment, imposed during grain filling, was previously reported not only regarding transcription levels of genes related to grain quality but also in the proportions of distinct protein fractions [30].

Supplementary Materials

The following are available online at https://www.mdpi.com/2073-4395/10/4/499/s1, Figure S1. Wheat plants’ growth conditions and Table S1. Single grain nitrogen content quantification by elemental analysis in mature grains.

Author Contributions

Conceptualization, M.S.; methodology, D.T., J.C.R., and M.S.; validation, D.T. and M.S.; formal analysis, D.T. and J.C.R.; investigation, D.T.; writing—original draft preparation, D.T. and J.C.R.; writing—review and editing, W.V. and M.S.; visualization, D.T.; supervision, M.S.; project administration, M.S.; funding acquisition, M.S. All authors have read and agreed to the published version of the manuscript.

Funding

Diana Tomás was funded by a Fundação para a Ciência e a Tecnologia, Portugal (FCT) doctoral scholarship (SFRH/BD/93156/2013), Manuela Silva by the FCT Investigator Programme (IF/00834/2014) and the research work was financed by LEAF Unit (Linking Landscape, Environment, Agriculture and Food) (UID/AGR/04129/2013) and CEF Unit (Forest Research Centre, UIDB/00239/2020).

Acknowledgments

We would like to thank Eng. José Coutinho (INRB/INIAV Portugal) and Eng. Joana Aleixo (ANSEME Portugal) for the seeds used in the present study. We would like to acknowledge the support of Ana Alves from Centro de Estudos Florestais, ISA-Ulisboa on ATR-FTIR spectra acquisition.

Conflicts of Interest

The authors declare no conflict of interest.

References

  1. FAO FAOSTAT. Available online: http://www.fao.org/faostat/en/#data/QC (accessed on 9 September 2019).
  2. FAO FAOSTAT. Available online: http://www.fao.org/faostat/en/#data/FBS (accessed on 9 September 2019).
  3. Tewolde, H.; Fernandez, C.J.; Erickson, C.A. Wheat Cultivars Adapted to Post-Heading High Temperature Stress. J. Agron. Crop Sci. 2006, 120, 111–120. [Google Scholar] [CrossRef]
  4. Liu, B.; Asseng, S.; Müller, C.; Ewert, F.; Elliott, J.; Lobell, D.B.; Martre, P.; Ruane, A.C.; Wallach, D.; Jones, J.W.; et al. Similar estimates of temperature impacts on global wheat yield by three independent methods. Nat. Clim. Chang. 2016, 6, 1130–1136. [Google Scholar] [CrossRef]
  5. Akter, N.; Islam, M.R. Heat stress effects and management in wheat. A review. Agron. Sustain. Dev. 2017, 37, 37. [Google Scholar] [CrossRef]
  6. Farooq, M.; Bramley, H.; Palta, J.A.; Siddique, K.H.M. Heat Stress in Wheat during Reproductive and Grain-Filling Phases. CRC Crit. Rev. Plant Sci. 2011, 30, 491–507. [Google Scholar] [CrossRef]
  7. Gibson, L.R.; Paulsen, G.M. Yield Components of Wheat Grown under High Temperature Stress. Crop Sci. 1994, 39, 1841–1846. [Google Scholar] [CrossRef]
  8. Castro, M.; Peterson, C.J.; Rizza, M.D.; Dellavalle, P.D.; Vázquez, D.; IbáÑez, V.; Ross, A. Influence of Heat Stress on Wheat Grain Characteristics and Protein Molecular Weight Distribution. In Wheat Production in Stressed Environments; Springer: Dordrecht, The Netherlands, 2007; pp. 365–371. [Google Scholar]
  9. Altenbach, S.B. New insights into the effects of high temperature, drought and post-anthesis fertilizer on wheat grain development. J. Cereal Sci. 2012, 56, 39–50. [Google Scholar] [CrossRef]
  10. Jenner, C. Starch Synthesis in the Kernel of Wheat under High Temperature Conditions. Aust. J. Plant Physiol. 1994, 21, 791. [Google Scholar] [CrossRef]
  11. Hurkman, W.J.; McCue, K.F.; Altenbach, S.B.; Korn, A.; Tanaka, C.K.; Kothari, K.M.; Johnson, E.L.; Bechtel, D.B.; Wilson, J.D.; Anderson, O.D.; et al. Effect of temperature on expression of genes encoding enzymes for starch biosynthesis in developing wheat endosperm. Plant Sci. 2003, 164, 873–881. [Google Scholar] [CrossRef]
  12. Corbellini, M.; Mazza, L.; Ciaffi, M.; Lafiandra, D.; Borghi, B. Effect of heat shock during grain filling on protein composition and technological quality of wheats. Euphytica 1998, 100, 147–154. [Google Scholar] [CrossRef]
  13. Daniel, C.; Triboi, E. Effects of temperature and nitrogen nutrition on the accumulation of gliadins analysed by RP-HPLC. Funct. Plant Biol. 2001, 28, 1197–1205. [Google Scholar] [CrossRef]
  14. Philippe, S.; Robert, P.; Barron, C.; Saulnier, L.; Guillon, F. Deposition of cell wall polysaccharides in wheat endosperm during grain development: Fourier transform-infrared microspectroscopy study. J. Agric. Food Chem. 2006, 54, 2303–2308. [Google Scholar] [CrossRef] [PubMed]
  15. Antunes, C.; Mendes, R.; Lima, A.; Barros, G.; Fields, P.; Da Costa, L.B.; Rodrigues, J.C.; Silva, M.J.; Correia, A.M.; Carvalho, M.O. Resistance of rice varieties to the stored-product insect, sitophilus zeamais (Coleoptera: Curculionidae). J. Econ. Entomol. 2016, 109, 445–453. [Google Scholar] [CrossRef] [PubMed]
  16. Sujka, K.; Koczoń, P.; Ceglińska, A.; Reder, M.; Ciemniewska-Żytkiewicz, H. The Application of FT-IR Spectroscopy for Quality Control of Flours Obtained from Polish Producers. J. Anal. Methods Chem. 2017, 2017. [Google Scholar] [CrossRef] [PubMed]
  17. Prates, L.L.; Lei, Y.; Refat, B.; Zhang, W.; Yu, P. Effects of heat processing methods on protein subfractions and protein degradation kinetics in dairy cattle in relation to protein molecular structure of barley grain using advanced molecular spectroscopy. J. Cereal Sci. 2018, 80, 212–220. [Google Scholar] [CrossRef]
  18. Syahariza, Z.A.; Che Man, Y.B.; Selamat, J.; Bakar, J. Detection of lard adulteration in cake formulation by Fourier transform infrared (FTIR) spectroscopy. Food Chem. 2005, 92, 365–371. [Google Scholar] [CrossRef]
  19. Che Man, Y.B.; Syahariza, Z.A.; Mirghani, M.E.S.; Jinap, S.; Bakar, J. Analysis of potential lard adulteration in chocolate and chocolate products using Fourier transform infrared spectroscopy. Food Chem. 2005, 90, 815–819. [Google Scholar] [CrossRef]
  20. Singh, V.K.; Devi, A.; Pathania, S.; Kumar, V.; Tripathi, D.K.; Sharma, S.; Chauhan, D.K.; Singh, V.K.; Zorba, V. Spectroscopic investigation of wheat grains (Triticum aestivum) infected by wheat seed gall nematodes (Anguina tritici). Biocatal. Agric. Biotechnol. 2017, 9, 58–66. [Google Scholar] [CrossRef] [Green Version]
  21. Toole, G.A.; Wilson, R.H.; Parker, M.L.; Wellner, N.K.; Wheeler, T.R.; Shewry, P.R.; Mills, E.N.C. The effect of environment on endosperm cell-wall development in Triticum aestivum during grain filling: An infrared spectroscopic imaging study. Planta 2007, 225, 1393–1403. [Google Scholar] [CrossRef]
  22. Semenov, M.A.; Shewry, P.R. Modelling predicts that heat stress, not drought, will increase vulnerability of wheat in Europe. Sci. Rep. 2011, 1, 66. [Google Scholar] [CrossRef]
  23. Teixeira, E.I.; Fischer, G.; van Velthuizen, H.; Walter, C.; Ewert, F. Global hot-spots of heat stress on agricultural crops due to climate change. Agric. For. Meteorol. 2013, 170, 206–215. [Google Scholar] [CrossRef]
  24. Cardoso, R.M.; Soares, P.M.M.; Lima, D.C.A.; Miranda, P.M.A. Mean and extreme temperatures in a warming climate: EURO CORDEX and WRF regional climate high-resolution projections for Portugal. Clim. Dyn. 2019, 52, 129–157. [Google Scholar] [CrossRef]
  25. ANPOC; INIAV; IpBeja; Ceres; Germen. Cerealis Lista de Variedade Recomendadas Sementeiras Trigo Mole; Lisboa, Portugal, 2014. [Google Scholar]
  26. Williams, P.C.; Sobering, D.C. Comparison of Commercial near Infrared Transmittance and Reflectance Instruments for Analysis of Whole Grains and Seeds. J. Near Infrared Spectrosc. 1993, 1, 25–32. [Google Scholar] [CrossRef]
  27. Stone, P.J.; Nicolas, M.E. A survey of the effects of high temperature during grain filling on yield and quality of 75 wheat cultivars. Aust. J. Agric. Res. 1995, 46, 475–492. [Google Scholar] [CrossRef]
  28. Hays, D.B.; Do, J.H.; Mason, R.E.; Morgan, G.; Finlayson, S.A. Heat stress induced ethylene production in developing wheat grains induces kernel abortion and increased maturation in a susceptible cultivar. Plant Sci. 2007, 172, 1113–1123. [Google Scholar] [CrossRef]
  29. Shewry, P.R. Wheat. J. Exp. Bot. 2009, 60, 1537–1553. [Google Scholar] [CrossRef]
  30. Tomás, D.; Viegas, W.; Silva, M. Effects of Post-Anthesis Heat Waves on the Grain Quality of Seven European Wheat Varieties. Agronomy 2020, 10, 268. [Google Scholar] [CrossRef] [Green Version]
  31. Warren, F.J.; Perston, B.B.; Galindez-najera, S.P.; Edwards, C.H.; Powell, P.O.; Mandalari, G.; Campbell, G.M.; Butterworth, P.J.; Ellis, P.R. Infrared microspectroscopic imaging of plant tissues: Spectral visualization of Triticum aestivum kernel and Arabidopsis leaf microstructure. Plant J. 2015, 84, 634–646. [Google Scholar] [CrossRef] [Green Version]
  32. Carver, B.F. The Biochemical and Molecular Basis of Wheat Quality. In Wheat: Science and Trade; World Agriculture Series; Wiley: Hoboken, NJ, USA, 2009; pp. 495–520. [Google Scholar]
  33. Caporaso, N.; Whitworth, M.B.; Fisk, I.D. Protein content prediction in single wheat kernels using hyperspectral imaging. Food Chem. 2018, 240, 32–42. [Google Scholar] [CrossRef]
  34. Mitchell, J.; Johnston, I.G.; Bassel, G.W.; Penfield, S. Variability in seeds: Biological, ecological, and agricultural implications. J. Exp. Bot. 2016, 68, 809–817. [Google Scholar] [CrossRef]
  35. Daniel, C.; Triboi, E. Effects of temperature and nitrogen nutrition on the grain composition of winter wheat: Effects on gliadin content and composition. J. Cereal Sci. 2000, 32, 45–56. [Google Scholar] [CrossRef]
Figure 1. Number of grains/spike (a), grain weight/spike (b), and ten grains weight (c) of plants kept in control conditions (dark gray) and high temperature treatment (light gray). Means ± standard deviation (represented as bars). Different letters (control) and numbers (treatment) inside bars indicate ANOVA significant differences between varieties detected by multiple means comparison test. (*) indicates t-test statistical differences between control and treatment in each variety (p < 0.05).
Agronomy 10 00499 g001
Figure 2. Average attenuated total reflection Fourier transform infrared (ATR-FTIR) spectrum between 3700 and 780 cm−1 of the Roxo variety of milled grains in control conditions with the assignment of relevant bands.
Agronomy 10 00499 g002
Figure 3. ATR-FTIR spectra of wheat milled grains representing different variations between control (dark lines) and HT treated (light lines) plants obtained in amide I and II bands associated with protein (ac), and in 1015 and 997 cm−1 bands associated with starch (df).
Agronomy 10 00499 g003
Figure 4. Correlation between predicted nitrogen content in flour from single wheat kernels using ATR-FTIR spectral region 1800–500 cm−1 and nitrogen content determined by elemental analysis. Calibration dataset (n = 42) in black and validation dataset (n = 14) in white.
Agronomy 10 00499 g004
Figure 5. Mean values of predicted protein contents in single milled grains from control (dark gray) and high temperature treated (light gray) plants. Means and standard deviation values (represented as bars). Different letters (control) and numbers (treatment) inside bars indicate ANOVA significant differences between varieties detected by multiple means comparison test. (*) indicates t-test statistical differences between control and treatment in each variety (p < 0.05).
Agronomy 10 00499 g005
Figure 6. Distribution of single grains protein content from untreated (black) and high temperature treated (light gray) plants.
Agronomy 10 00499 g006
Table 1. Comparison between peaks’ high of control and treated average spectra of wheat milled grains after Min-Max normalization.
VarietyConditionWavelength (cm−1)
Protein/Saccharides
O–H; N–H
~3294
Fat/Saccharides
CH2
~2927
Fat
C=O
~1737
Amide I
~1648
Amide II
~1532
Saccharides
~1149~1077C–H ~1015C–H ~997~929~848
AlmansorC+++++++=2++
HT+=2
AntequeraC~++++++=2++−−−−
HT++~−−−−−−=2++++
BancalC=++++=++=2~~
HT===2~~
EsteroC+++++++~+=2~~+
HT−−−−~~=2~
NabãoC~−−−−+=2−−−−
HT++~++++++=2++++
Pata NegraC+++++~=2~
HT+~~=2++
RoxoC~~~~=2−−−−
HT+~~~~+++=2++++
Note: (+) and (−) refers to higher and lower intensity, respectively (more than one symbol means bigger difference of intensities); =2 identifies the maximum at which the spectrum was normalized (1015 or 997 cm−1).

