Real-Time Localization Approach for Maize Cores at Seedling Stage Based on Machine Vision


Abstract
:1. Introduction
2. Materials and Methods
2.1. Design of Image Recognition System
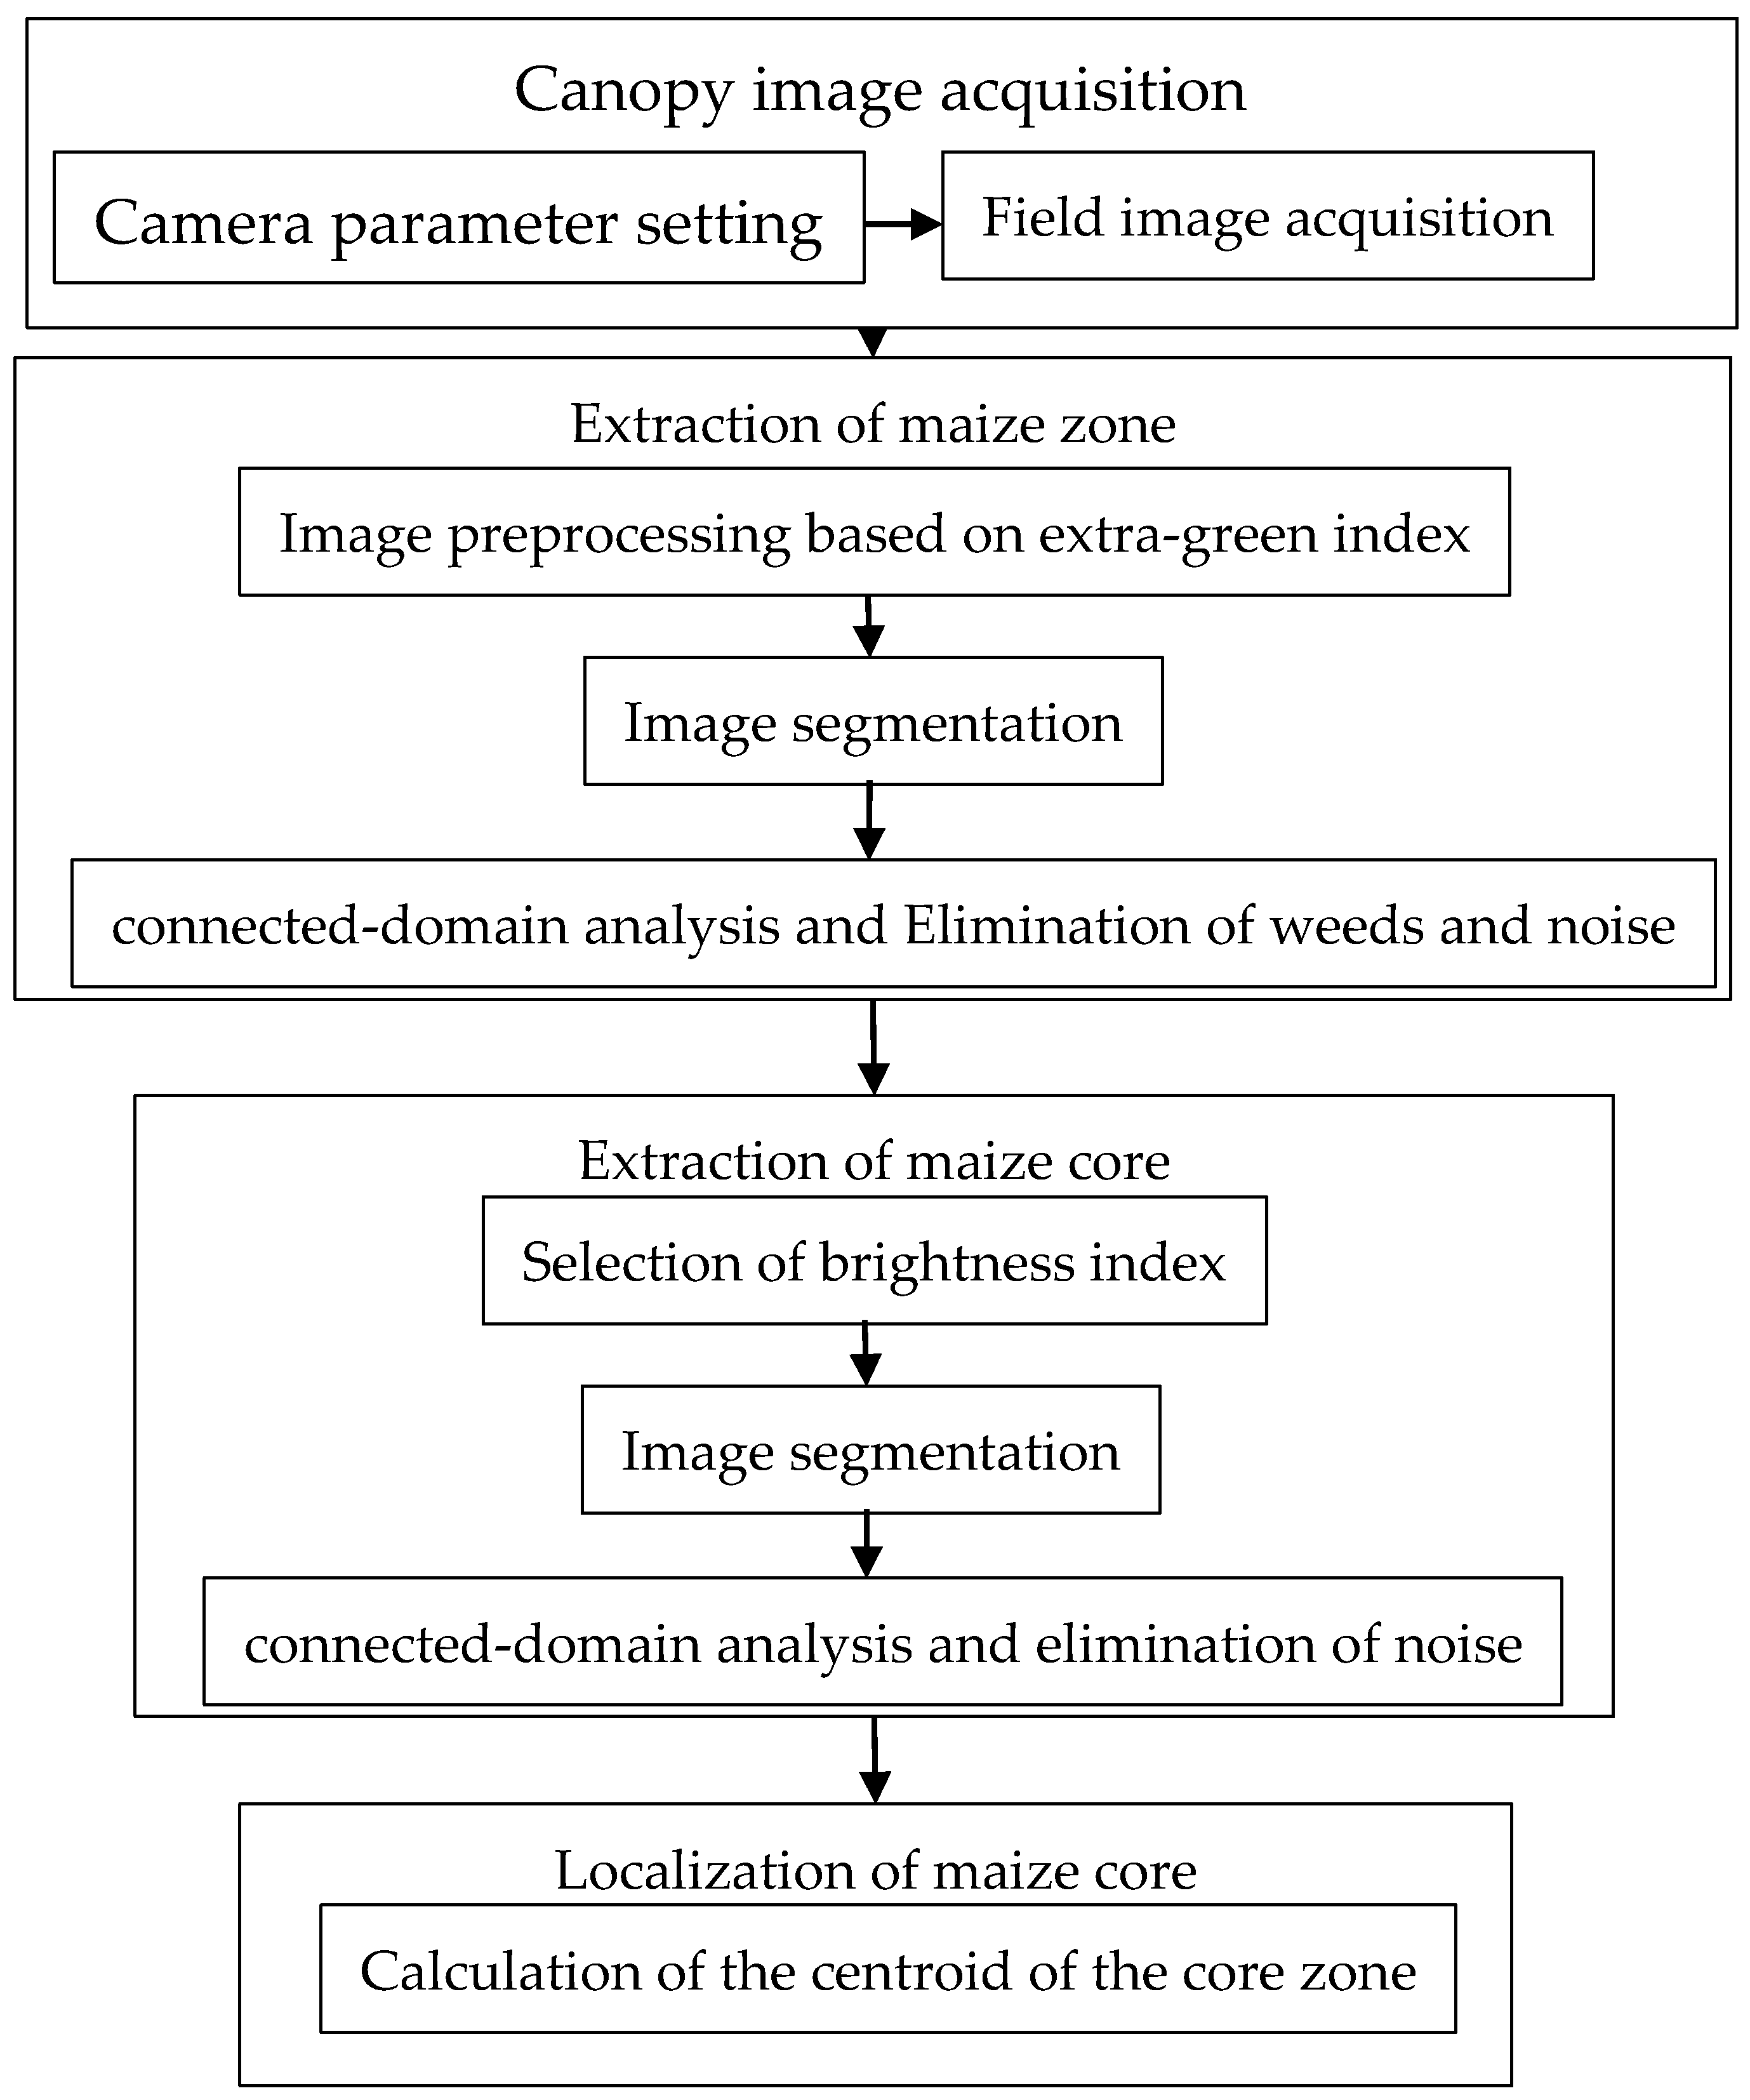
2.2. Real-time Recognition Algorithm for Maize Cores at Seedling Stage
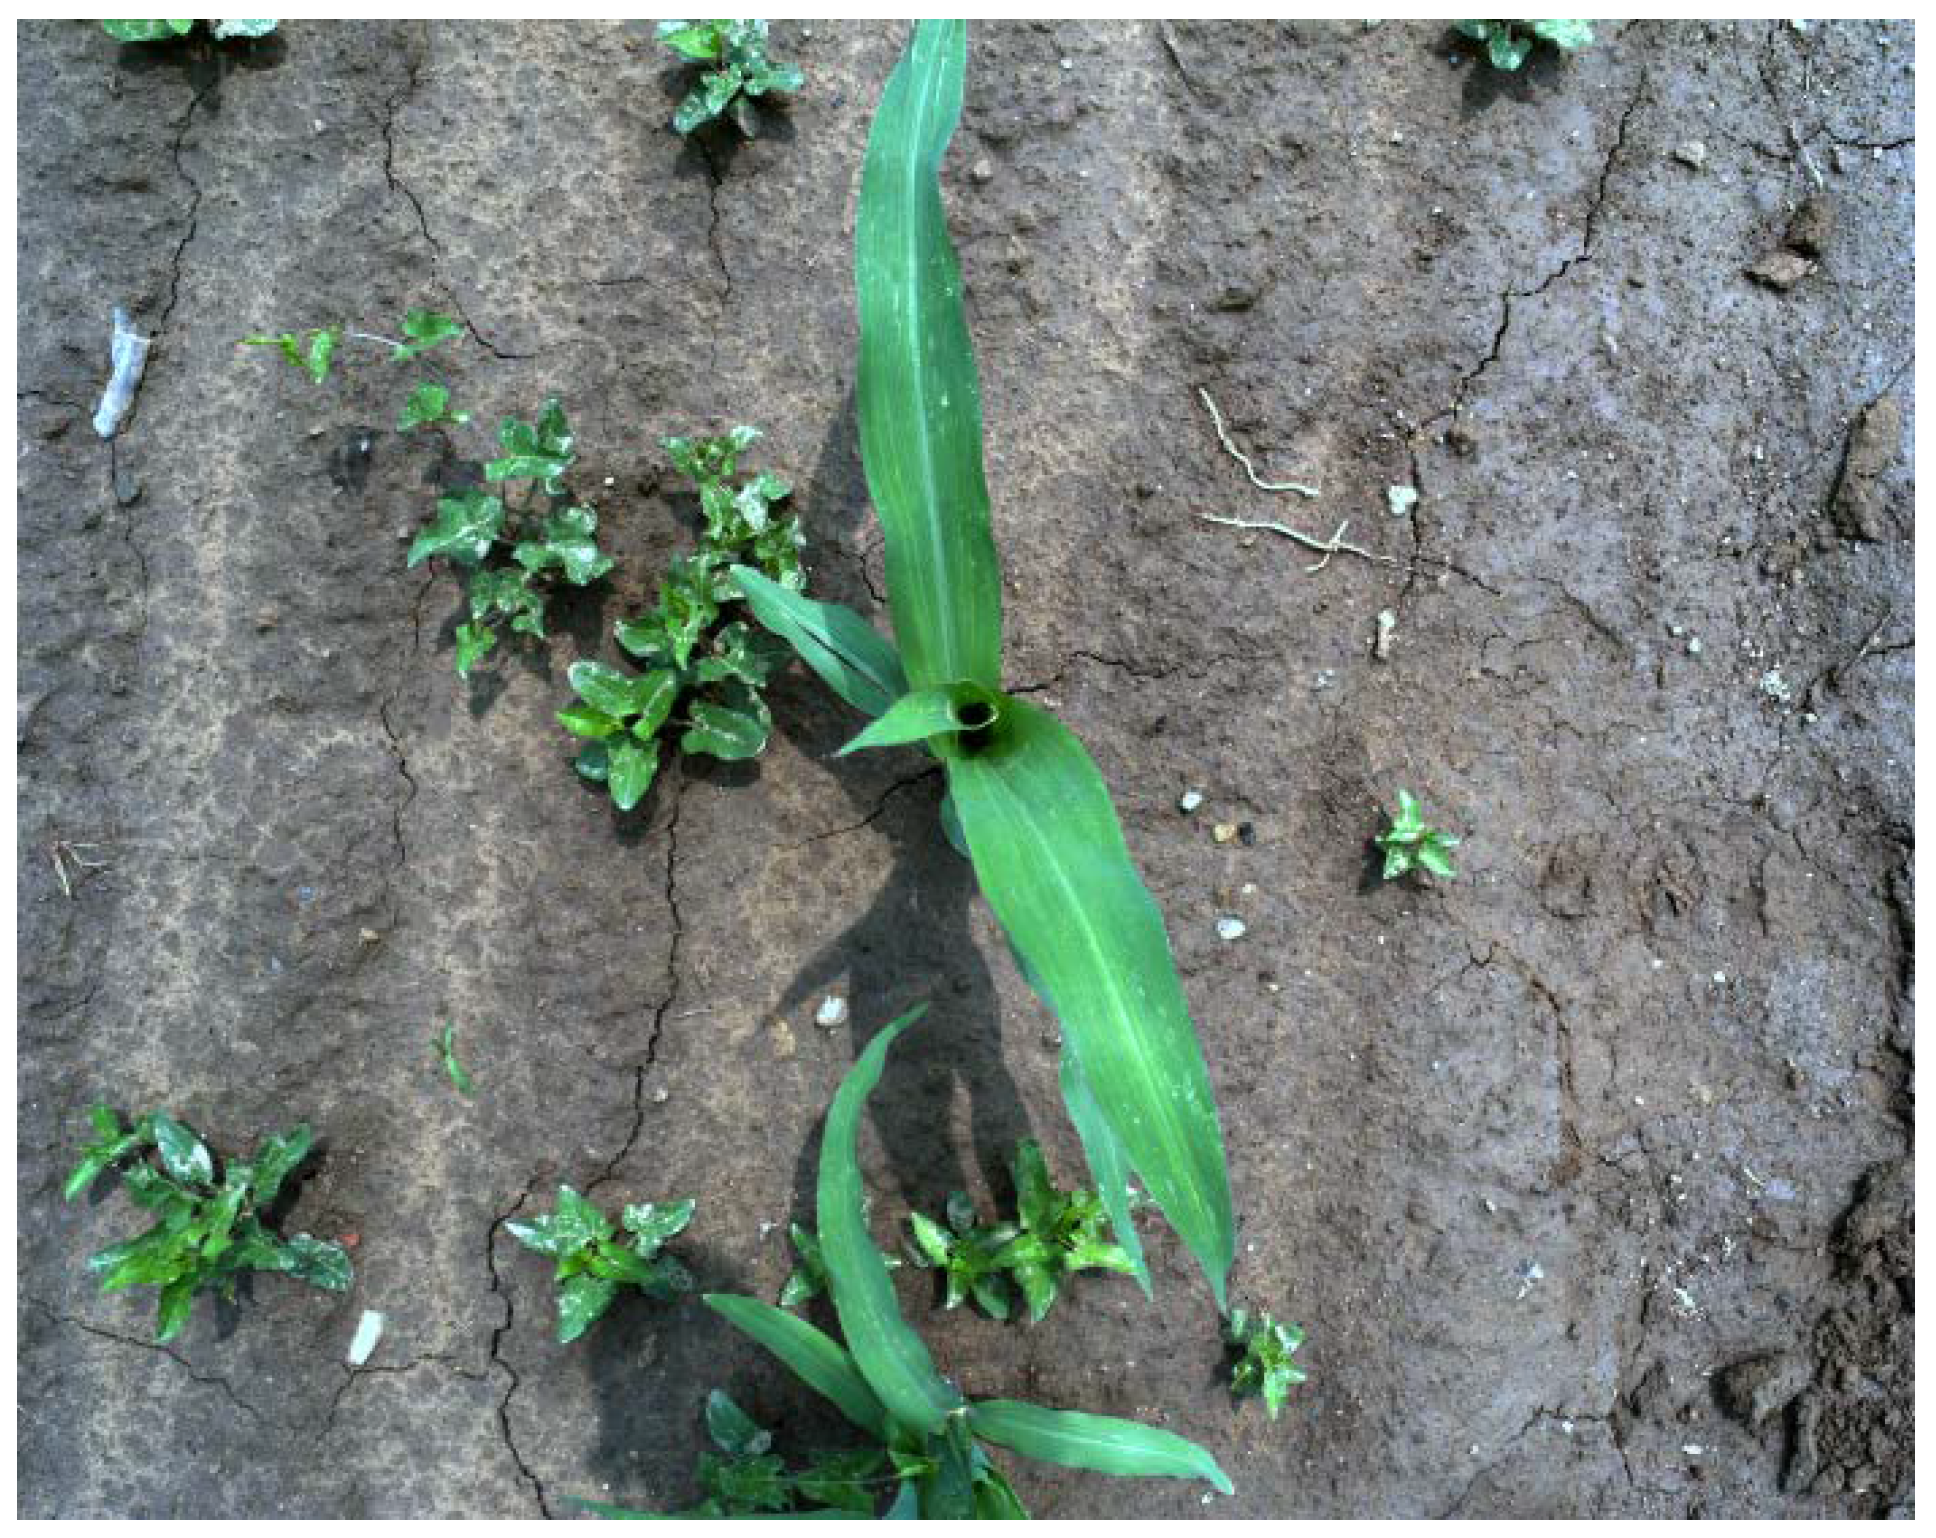
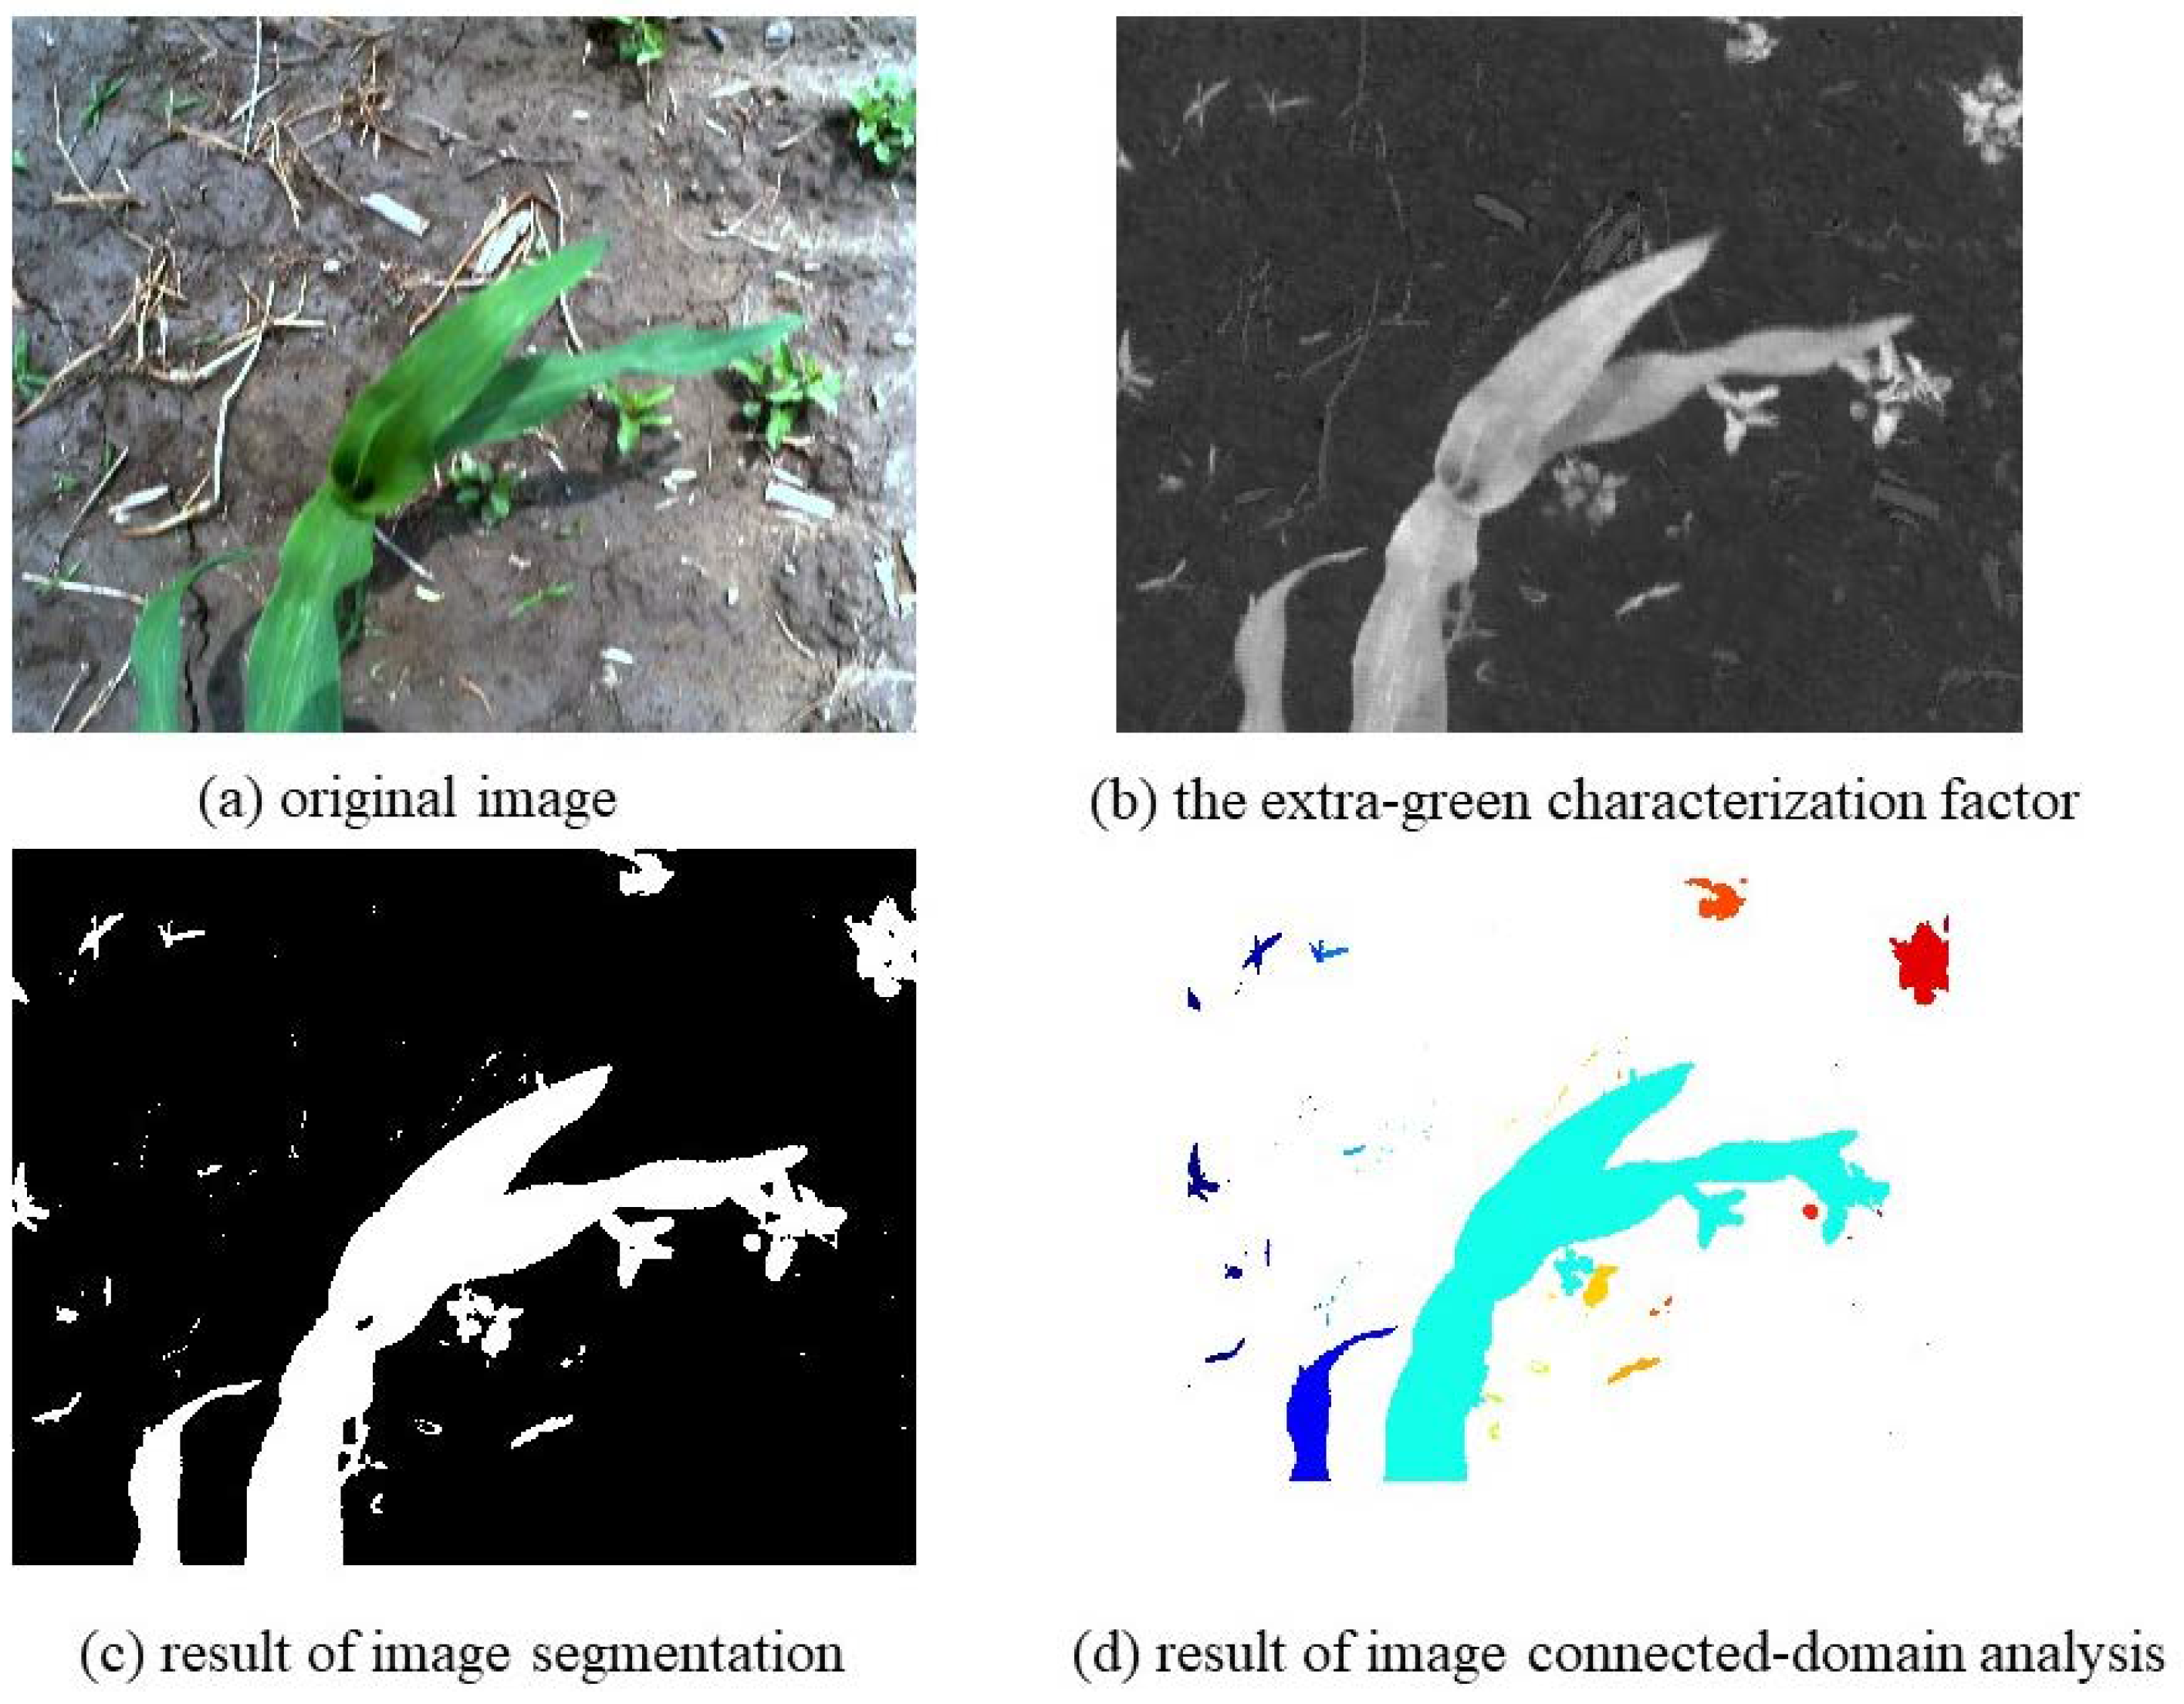
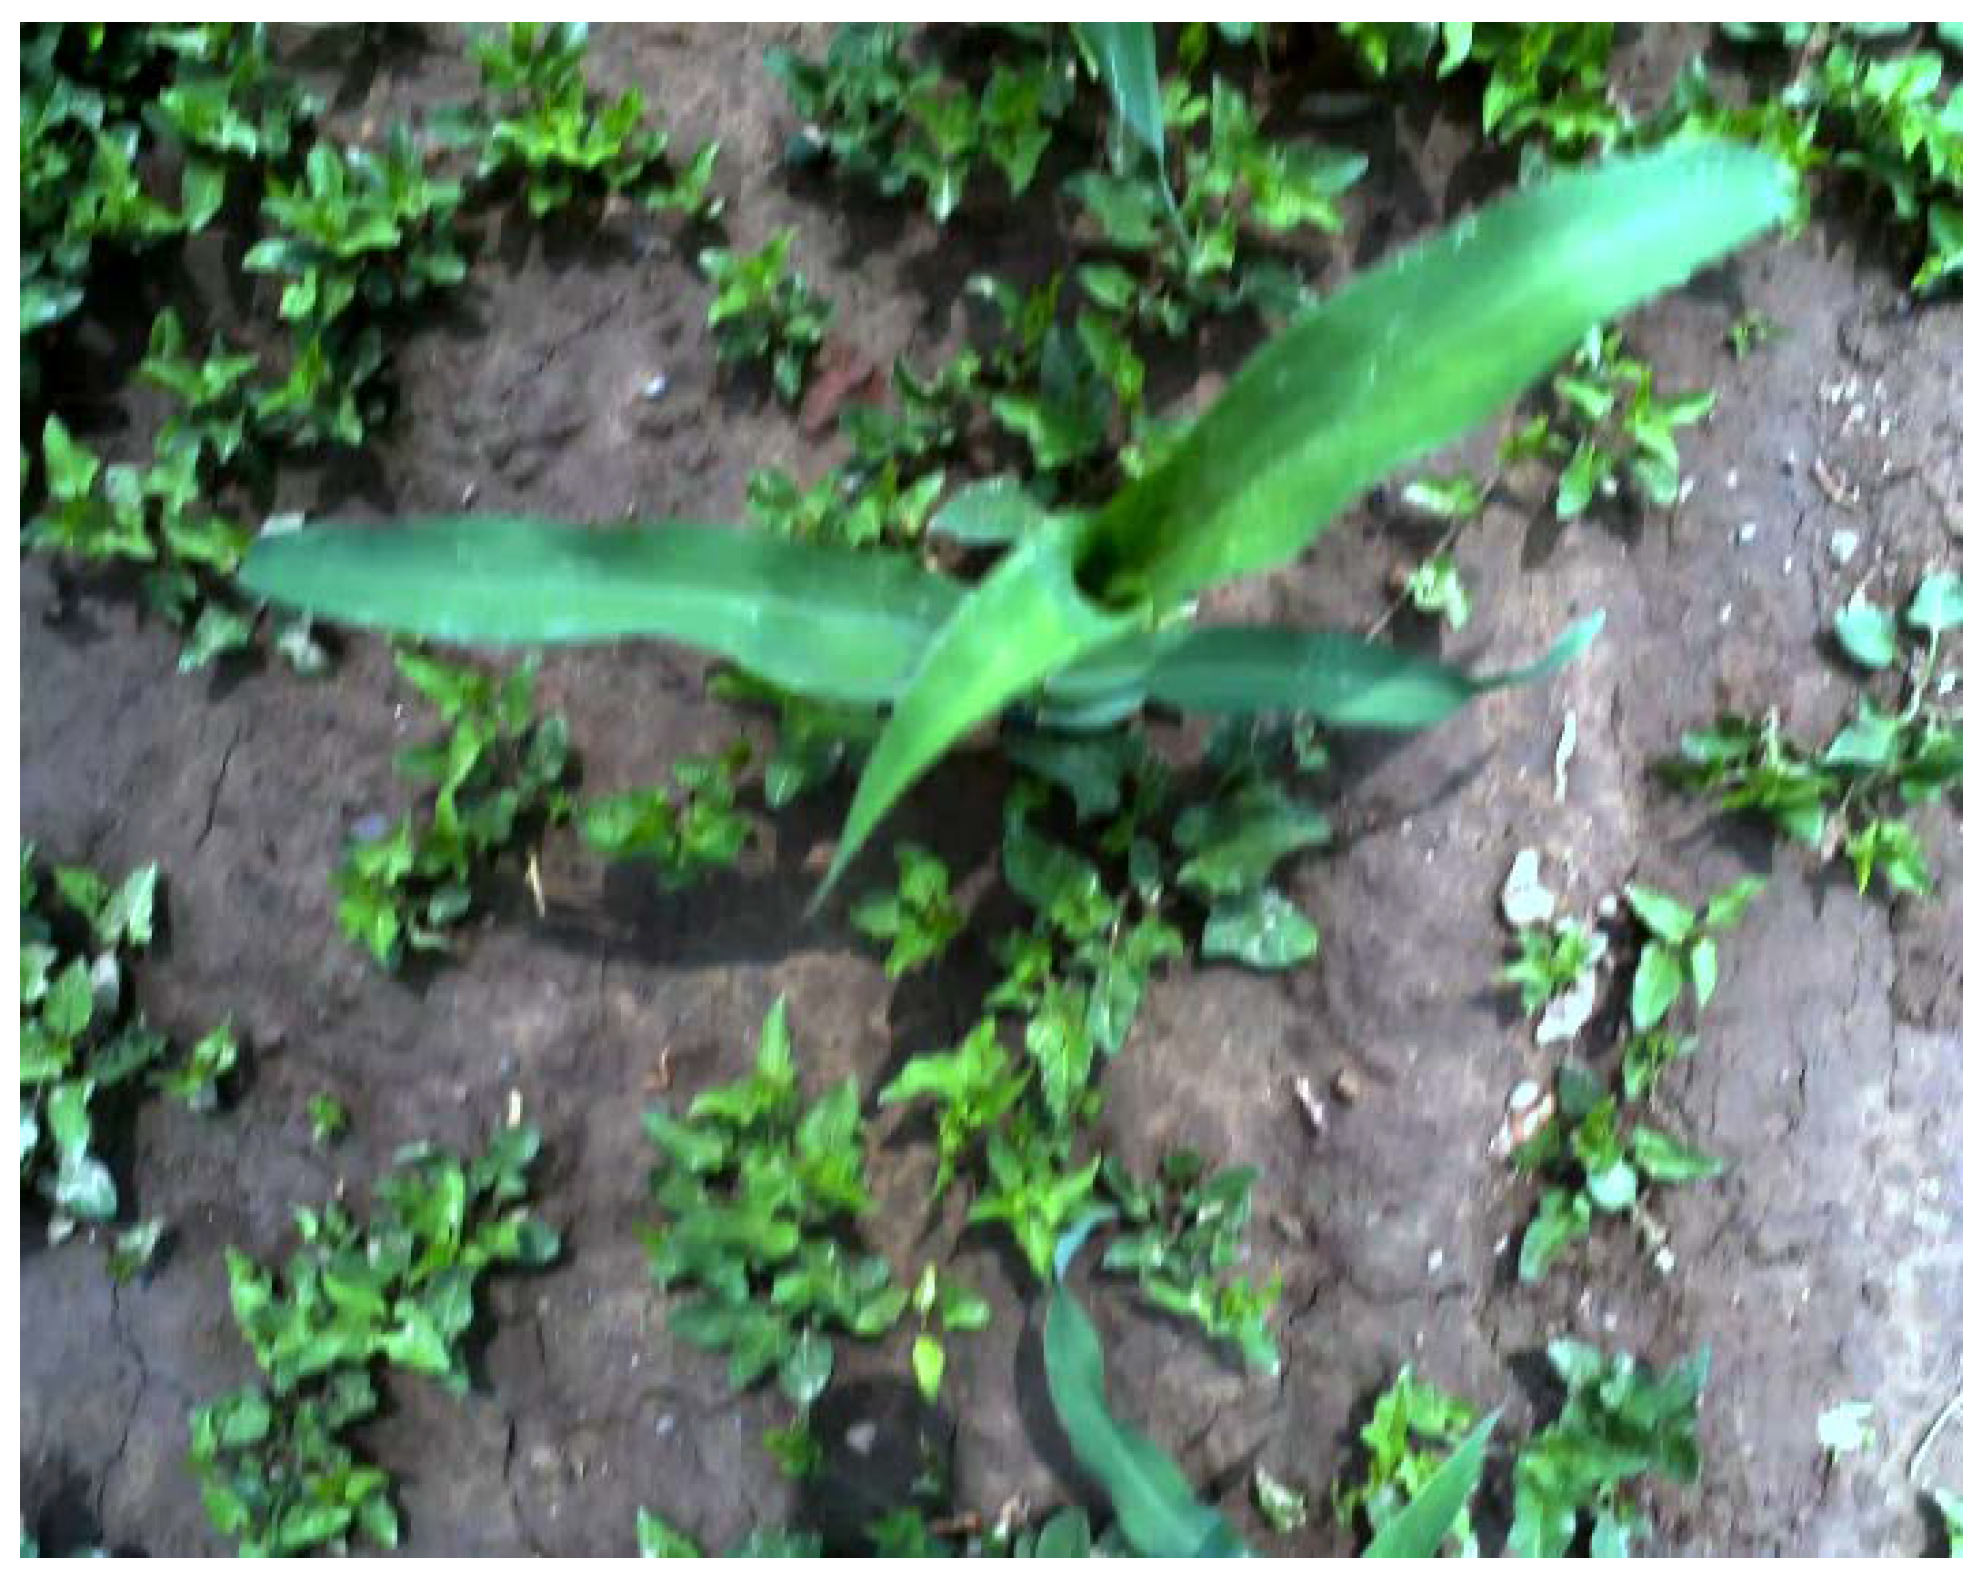
2.2.1. Extraction of Maize Zone at Seedling Stage
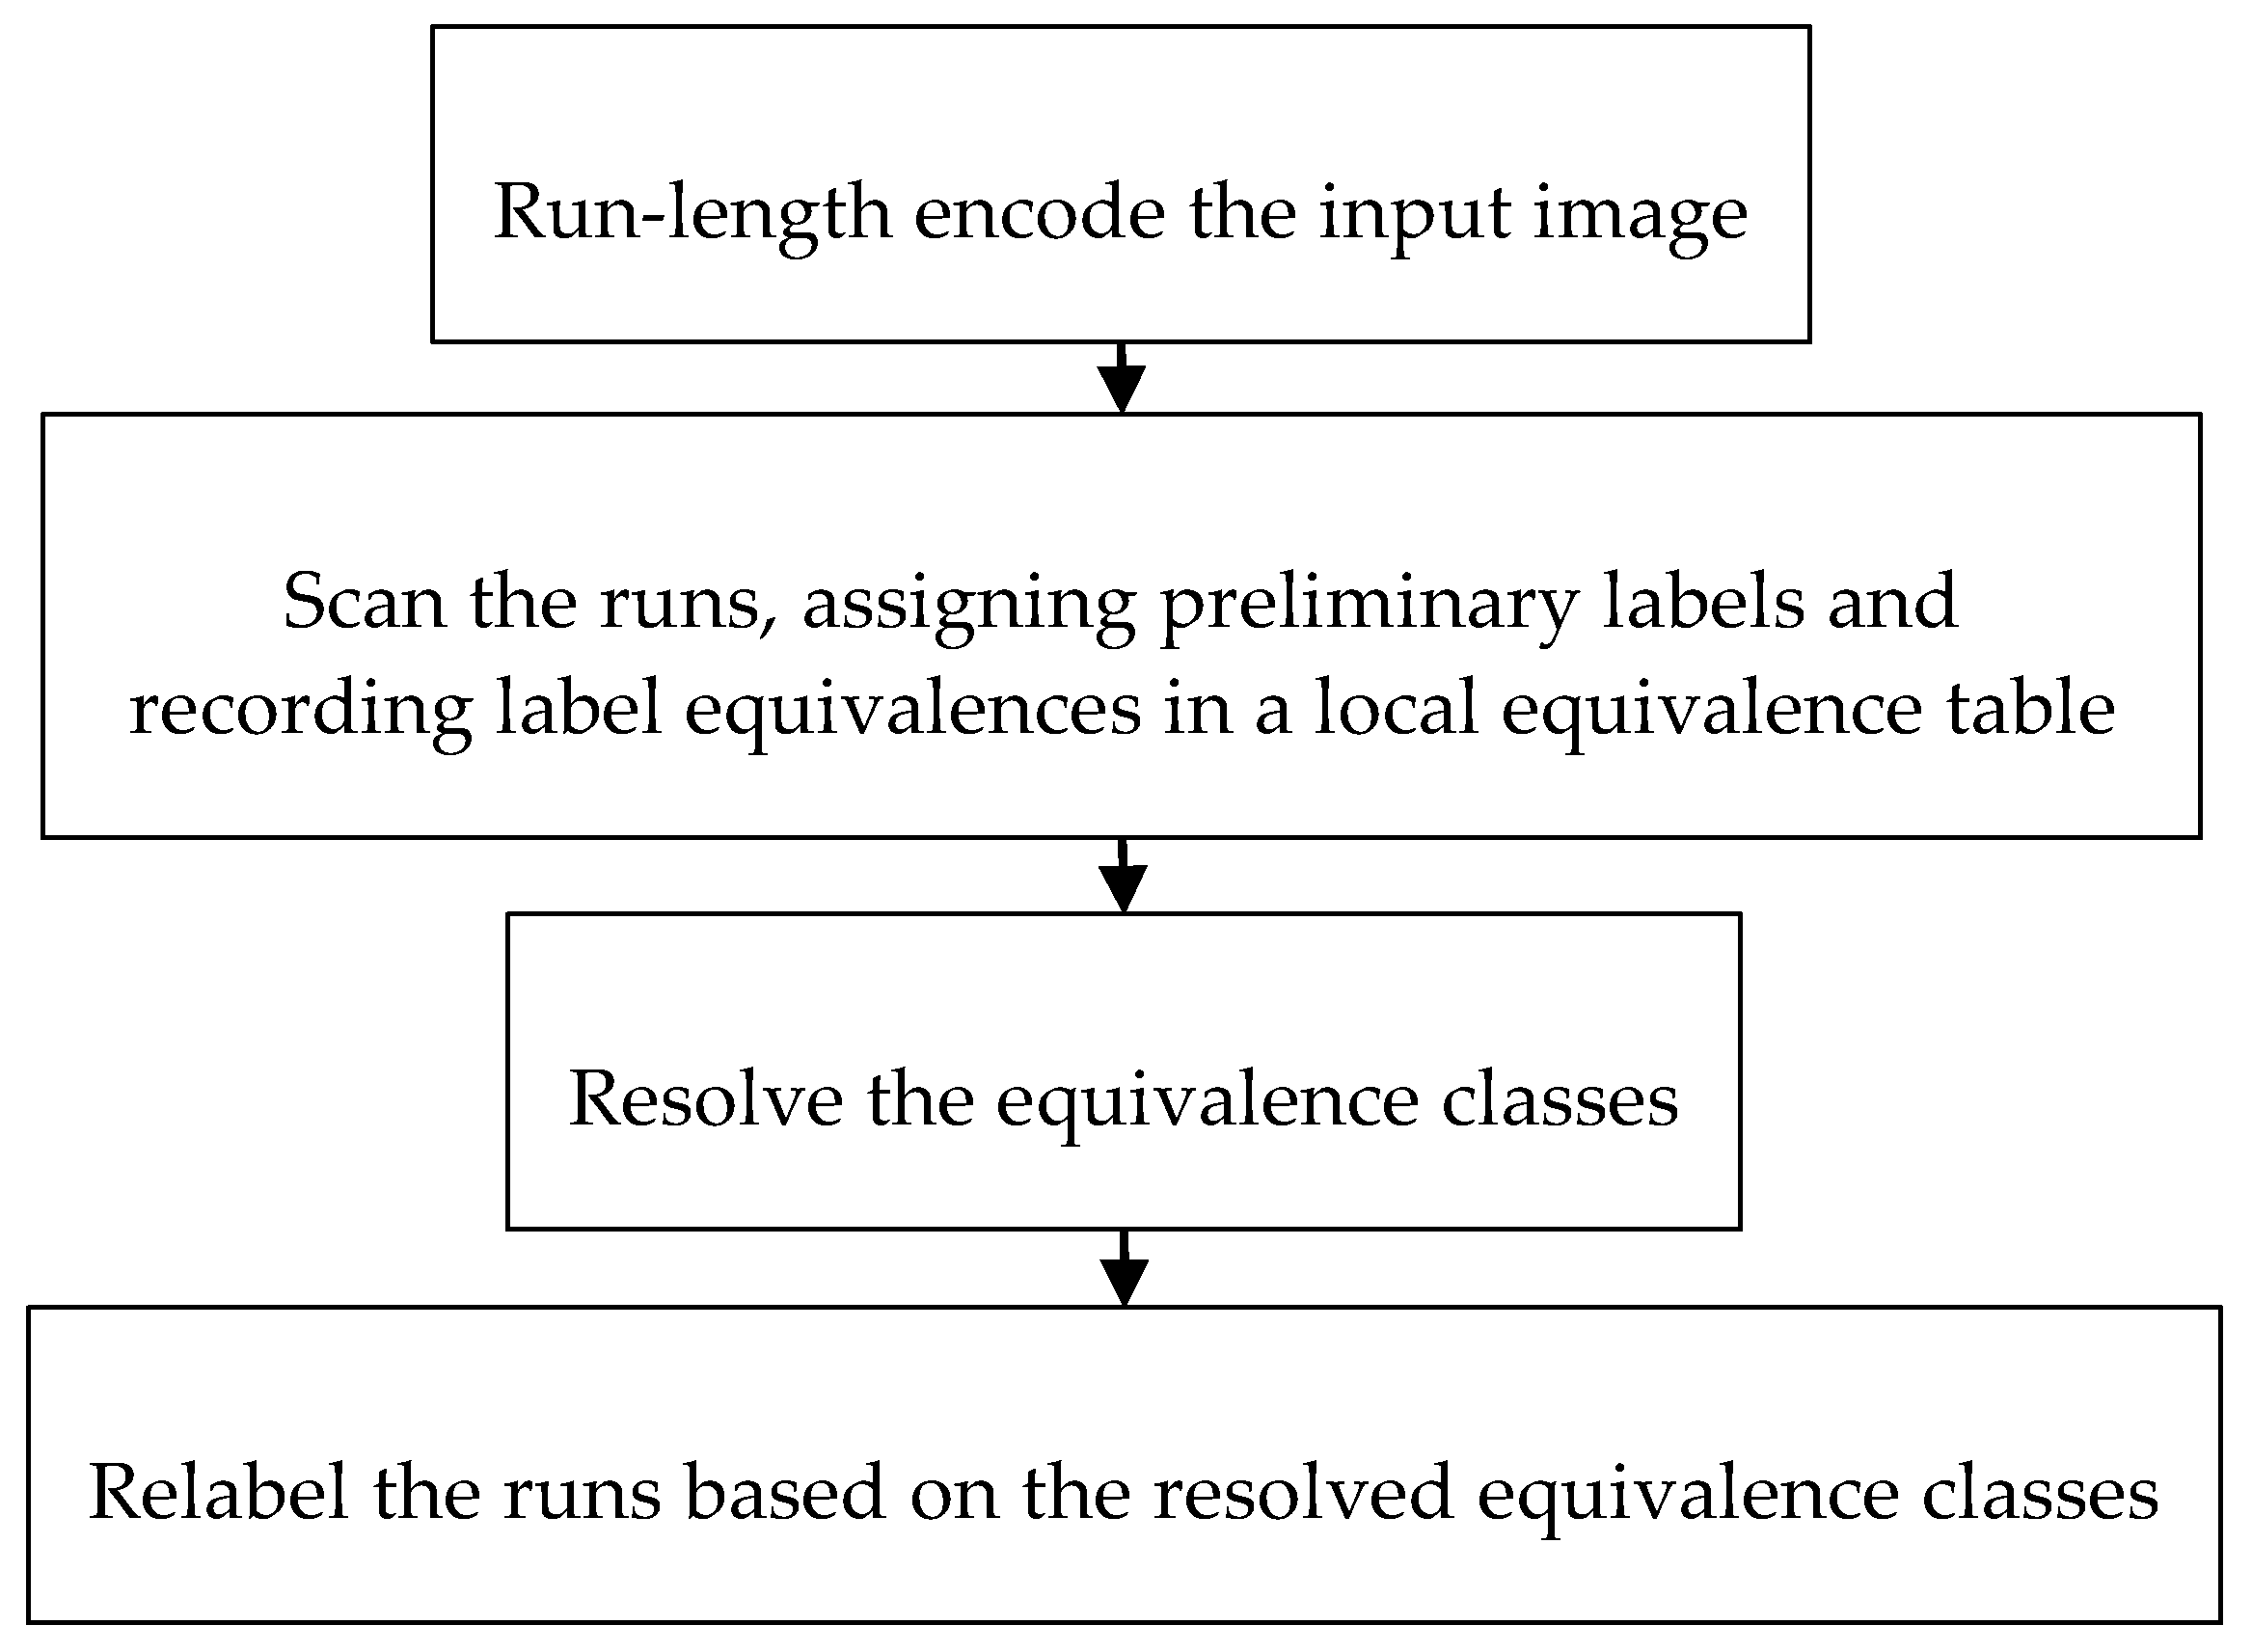
Index Structure
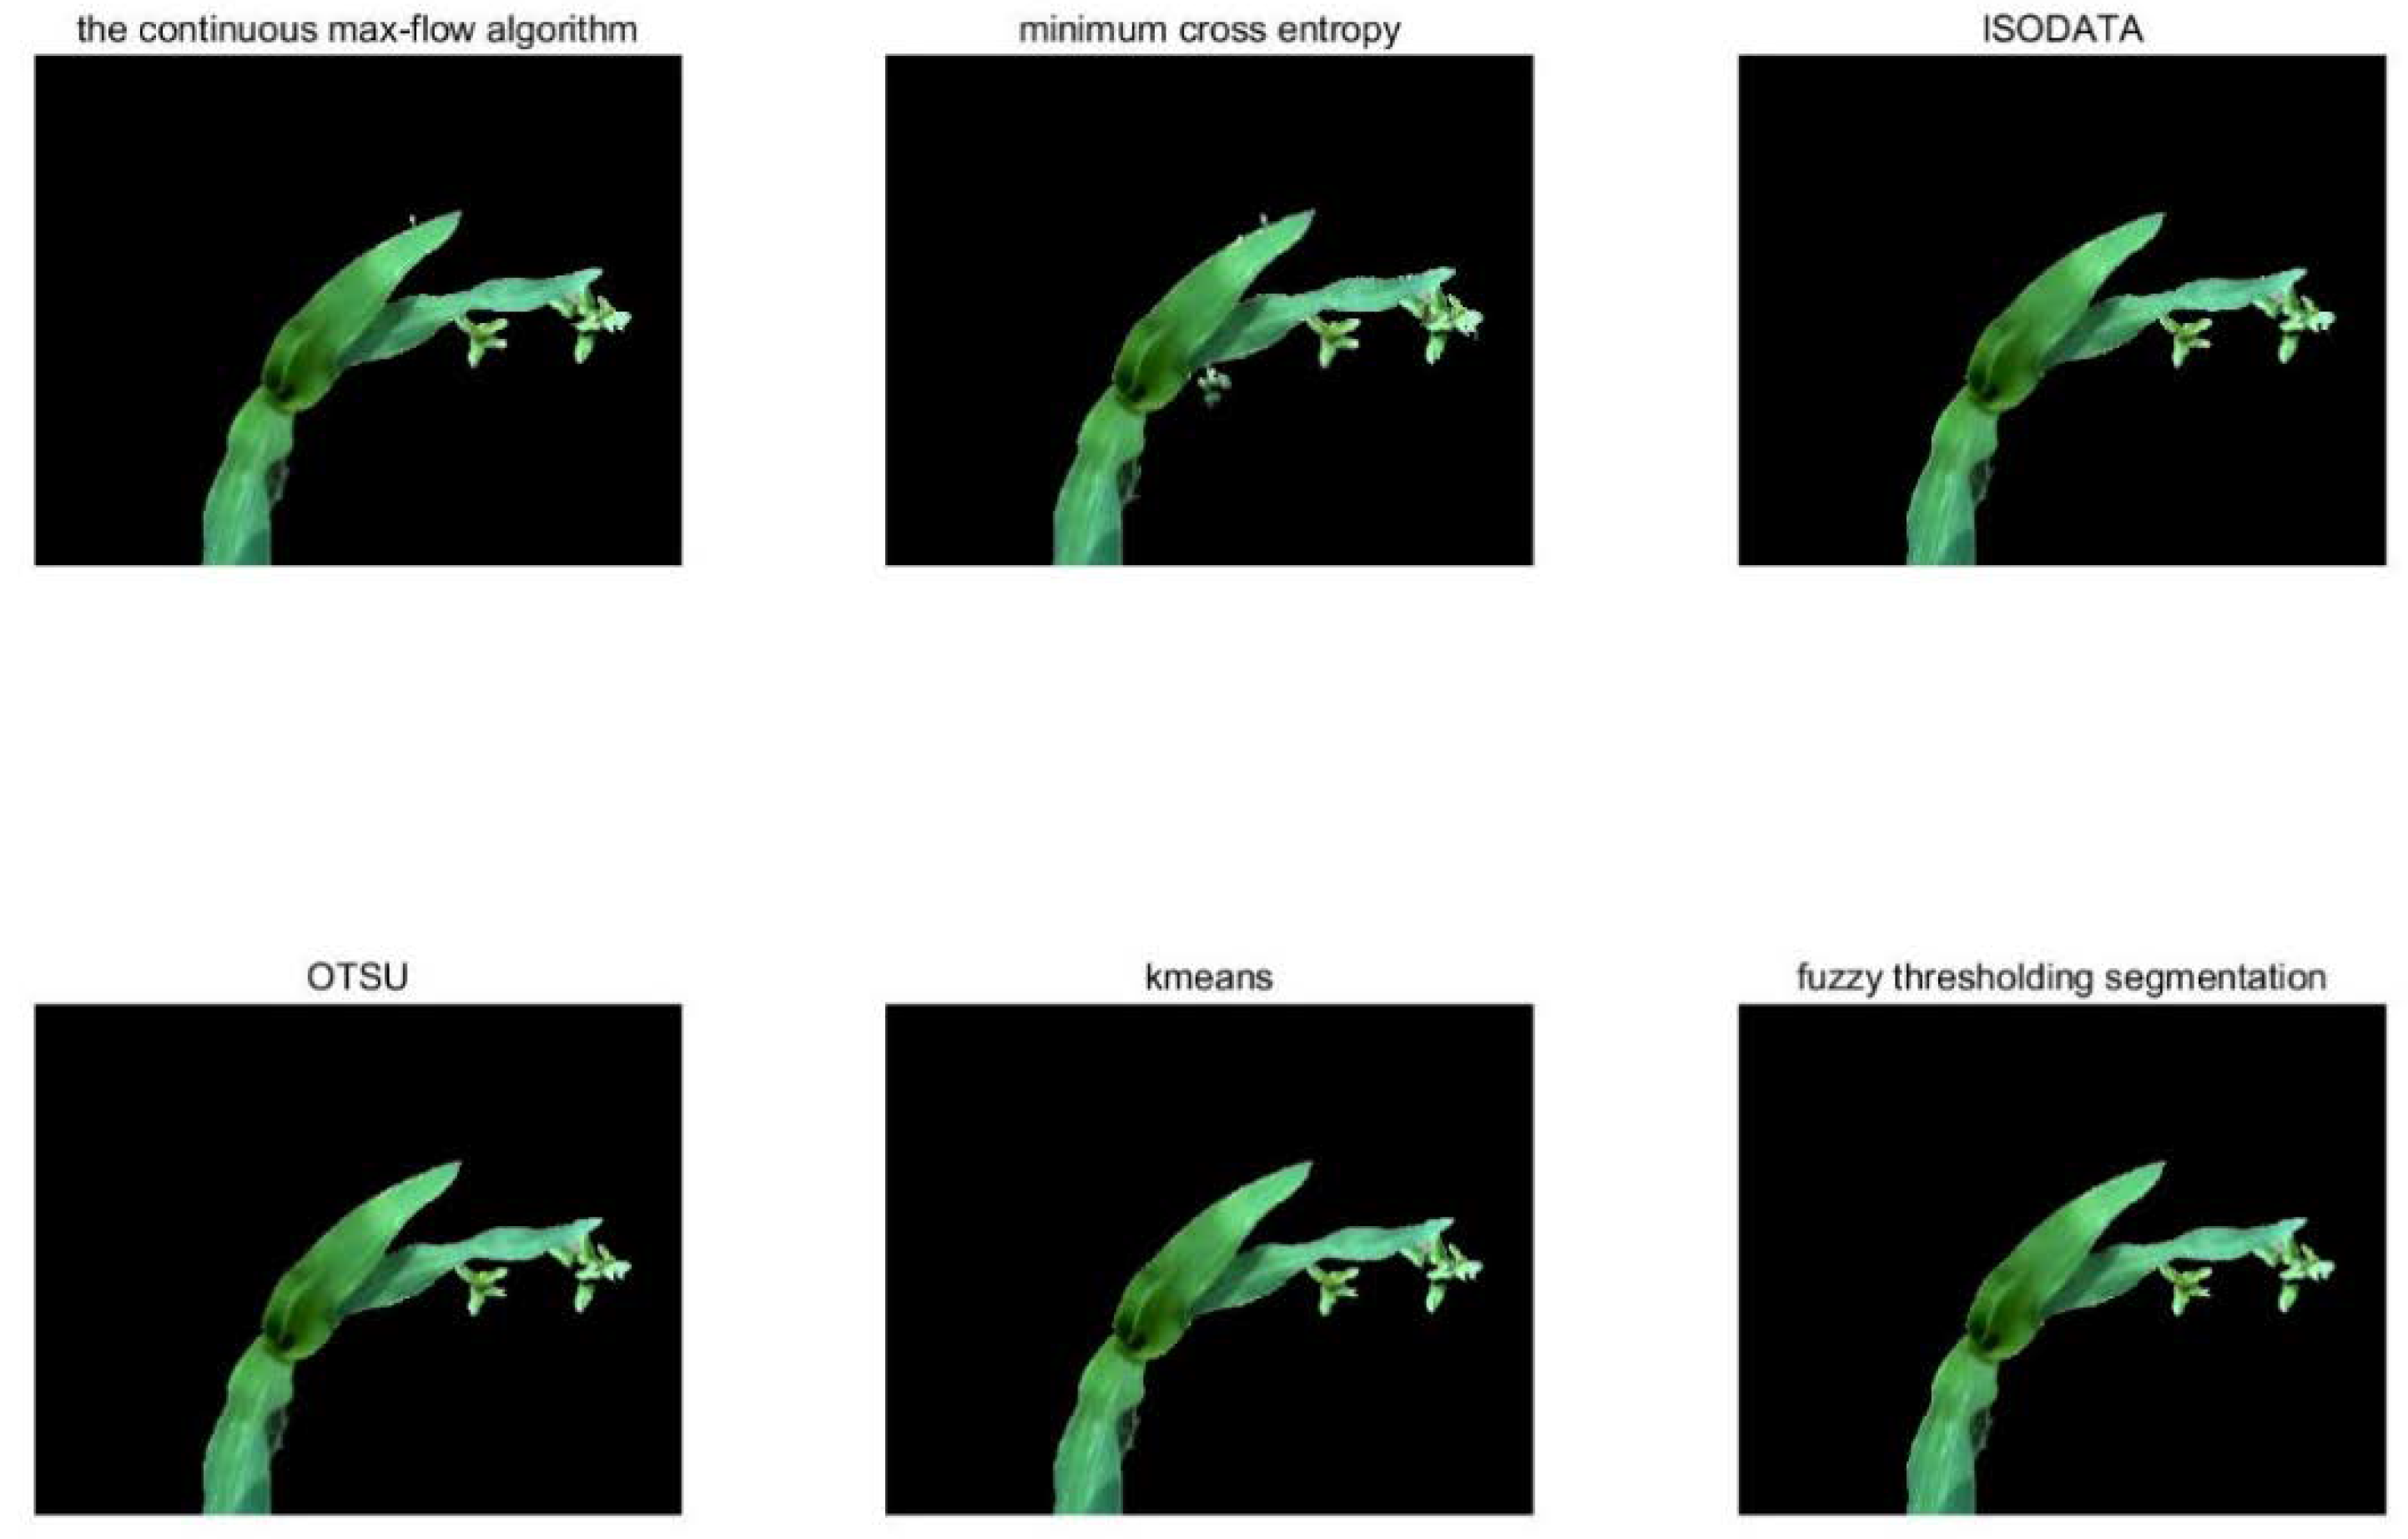
Image Segmentation
- Continuous Max-flow Model and Algorithm
- b.
- Minimum Cross Entropy
- c.
- ISODATA
- d.
- Otsu algorithm
- e.
- k-means clustering
- f.
- Fuzzy thresholding segmentation
Extraction of Maize Zone
2.2.2. Recognition and Localization of Maize Cores
Selection of Brightness Index
- Gray
- b.
- Y
- c.
- vHSV
- d.
- Extra-green
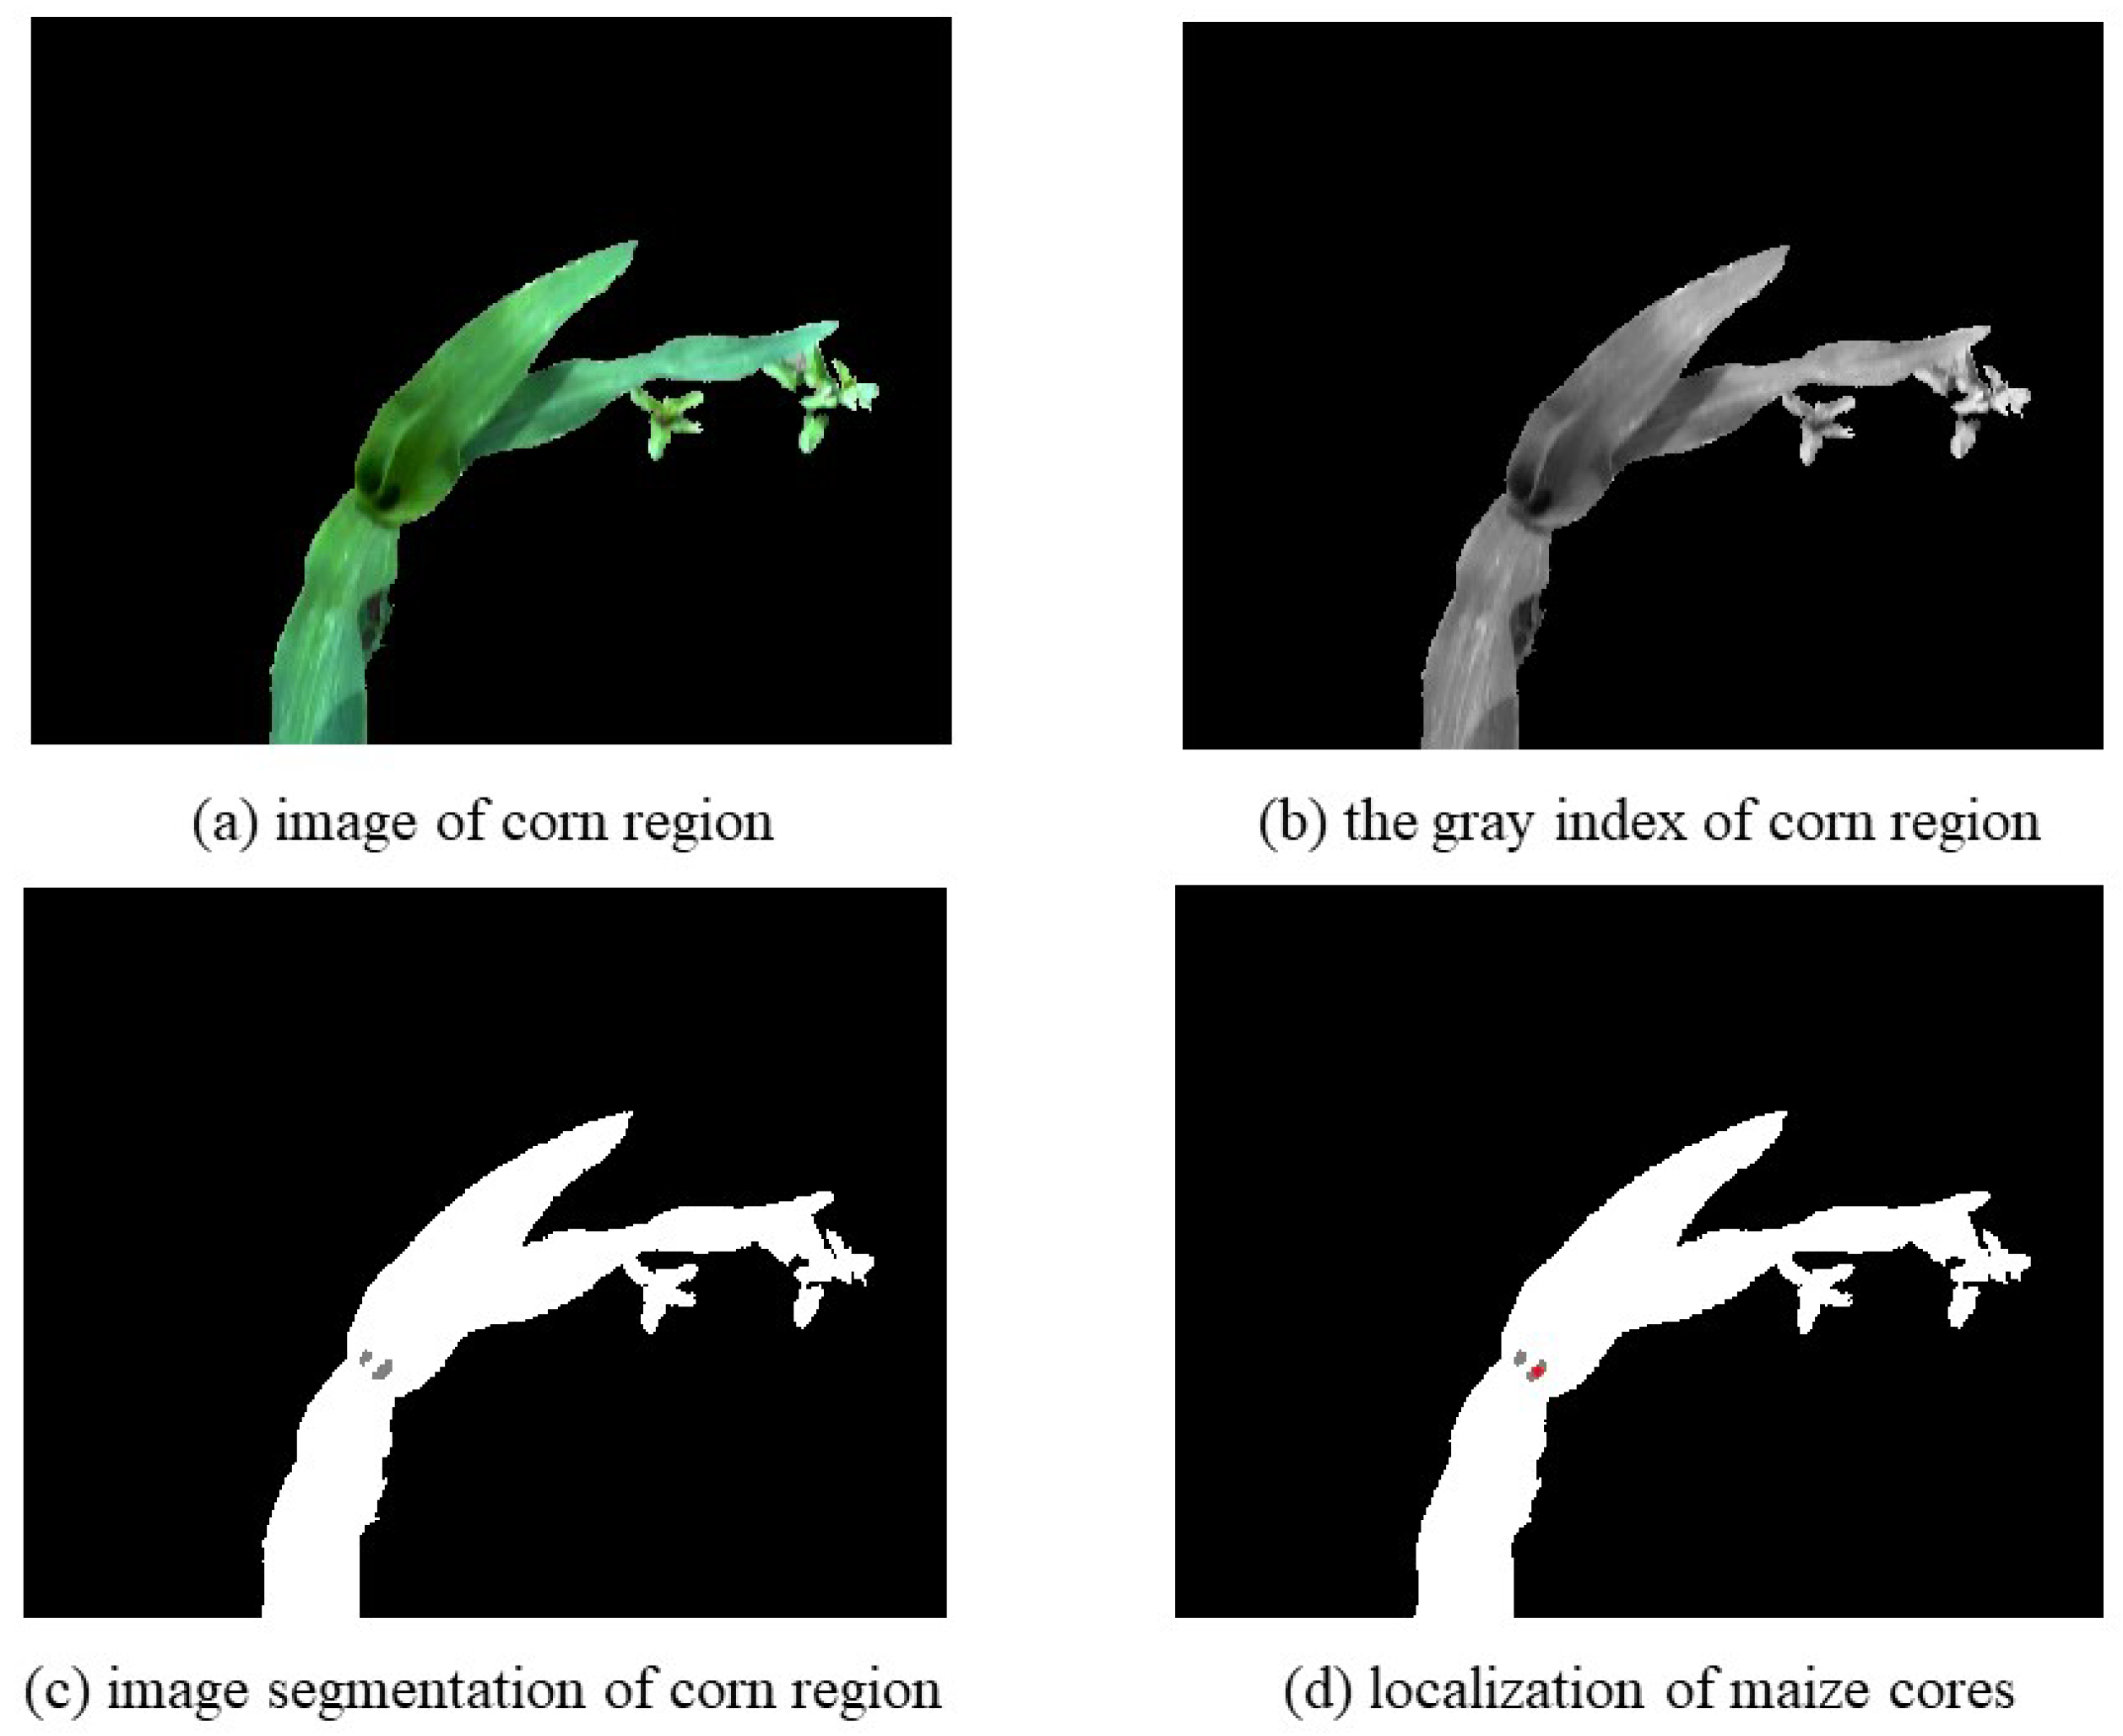
Extraction of Maize Core
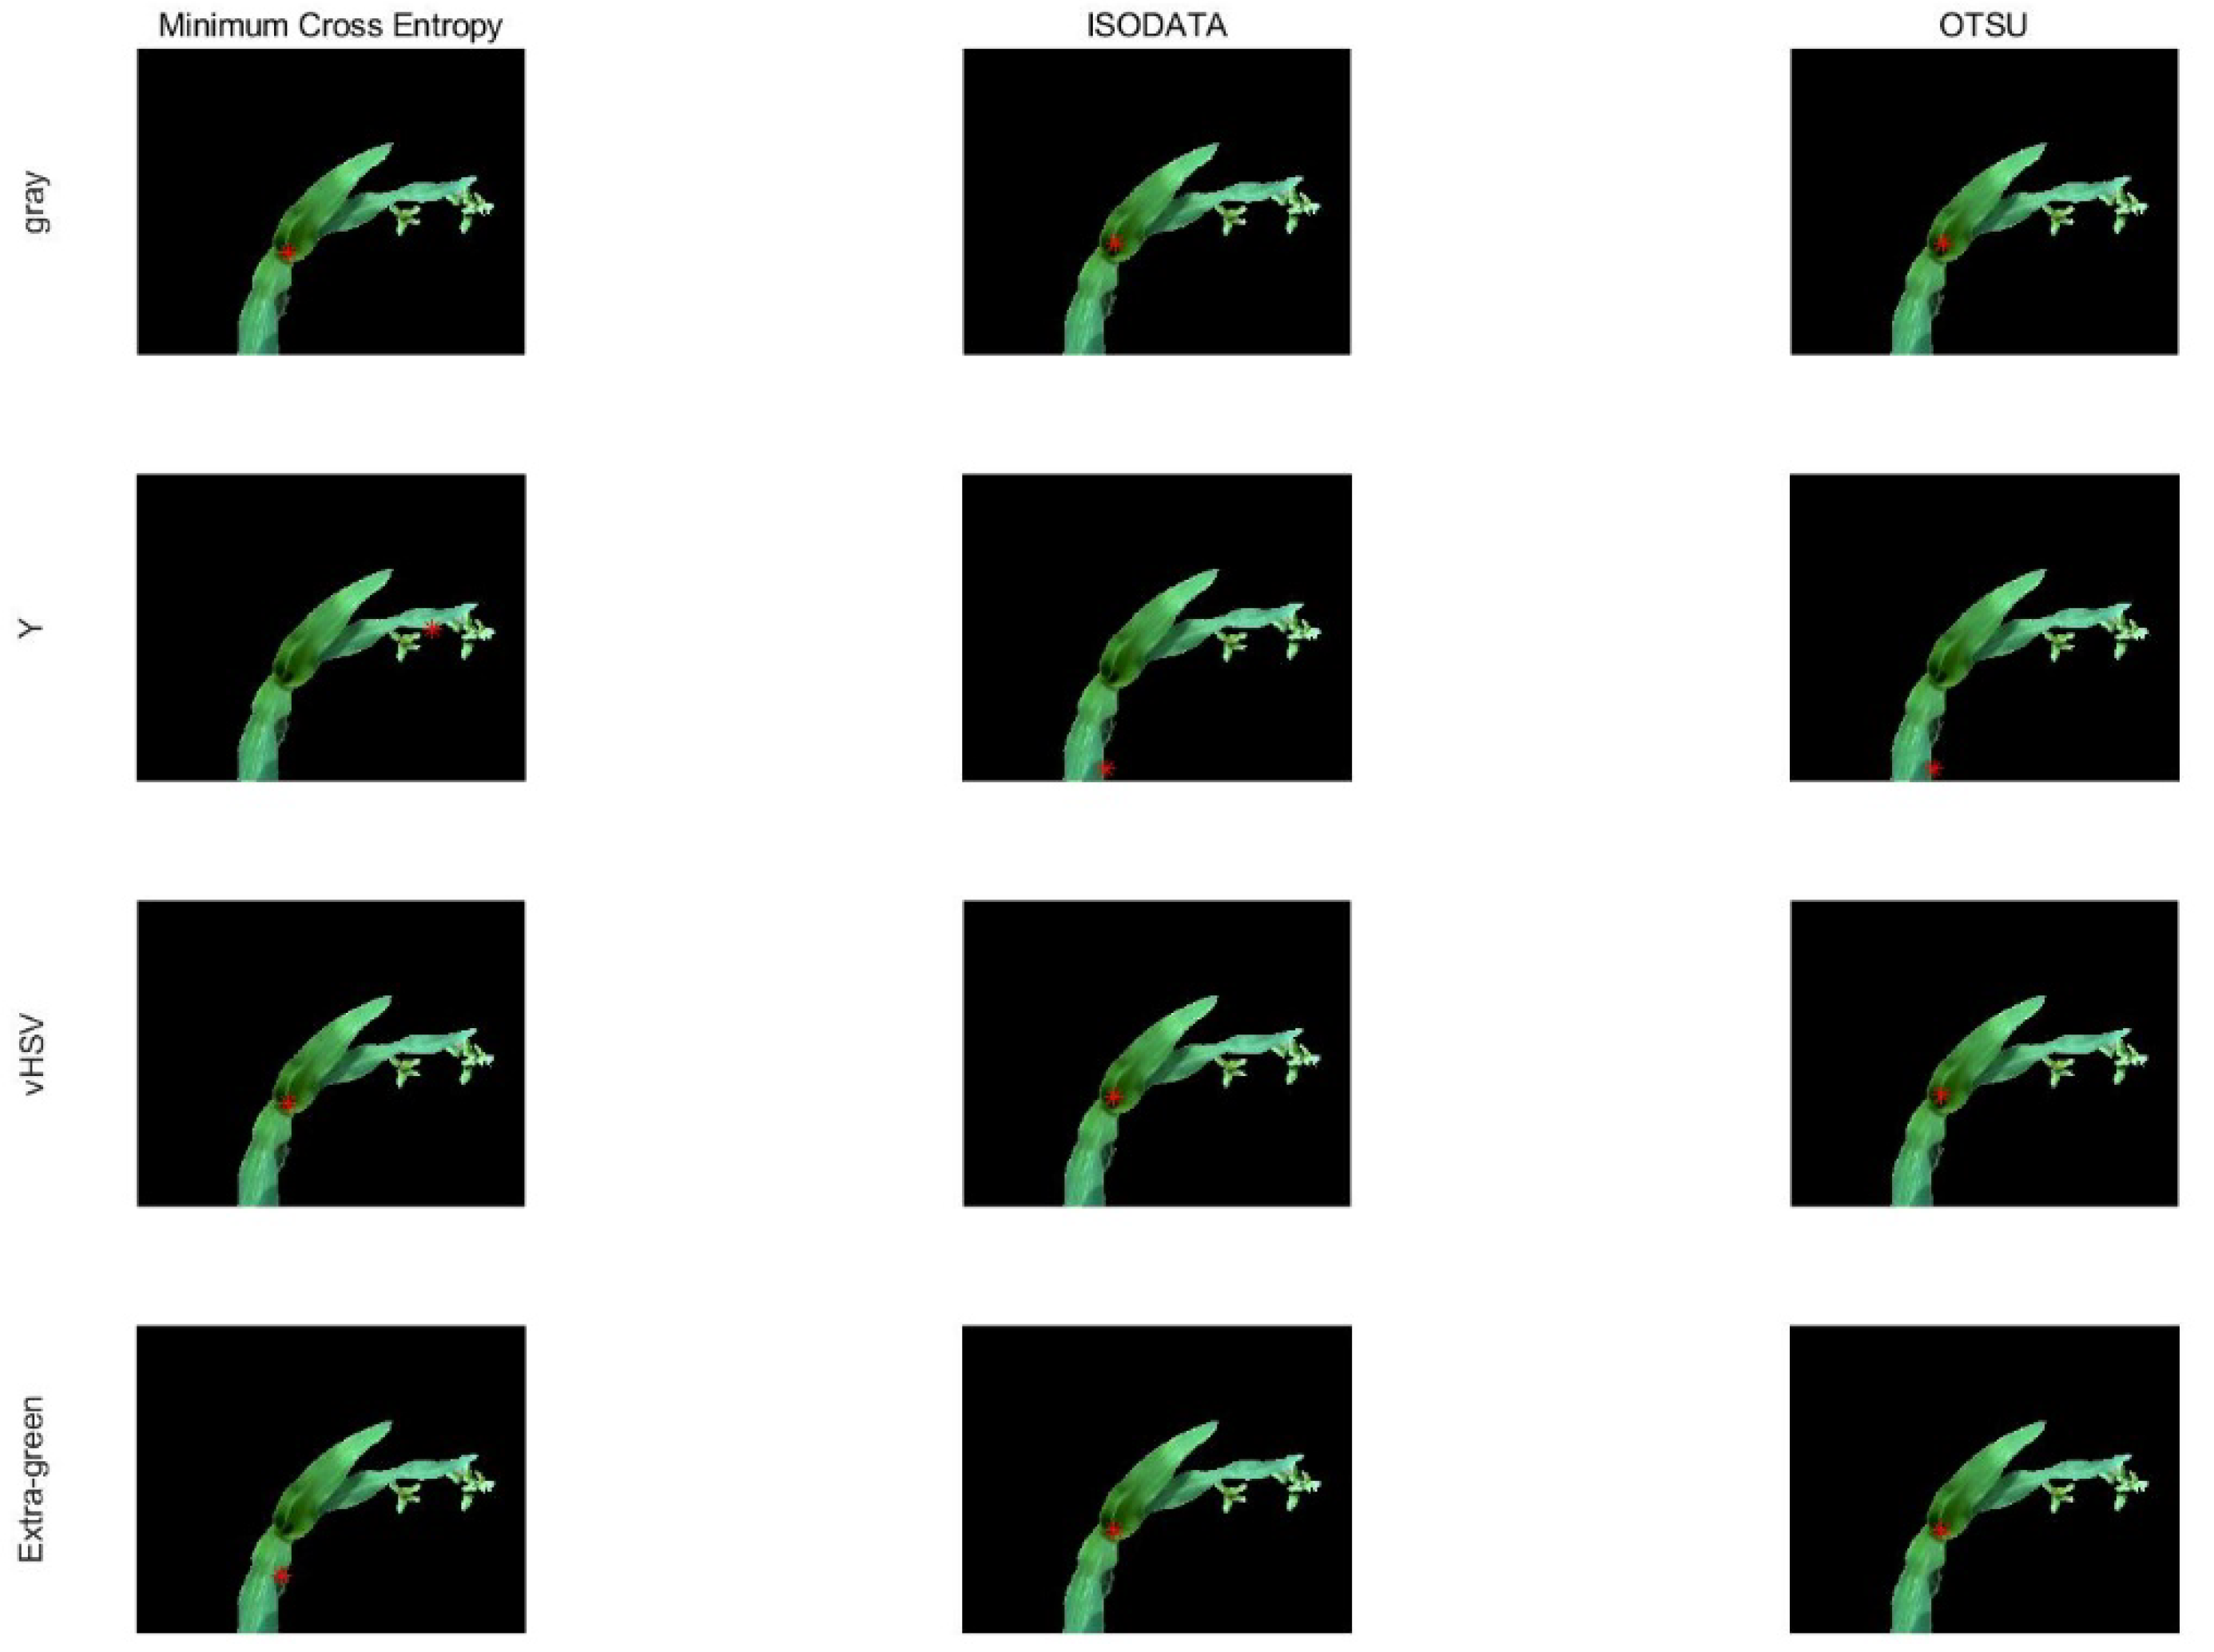
Core Recognition and Localization
3. Results and Discussion
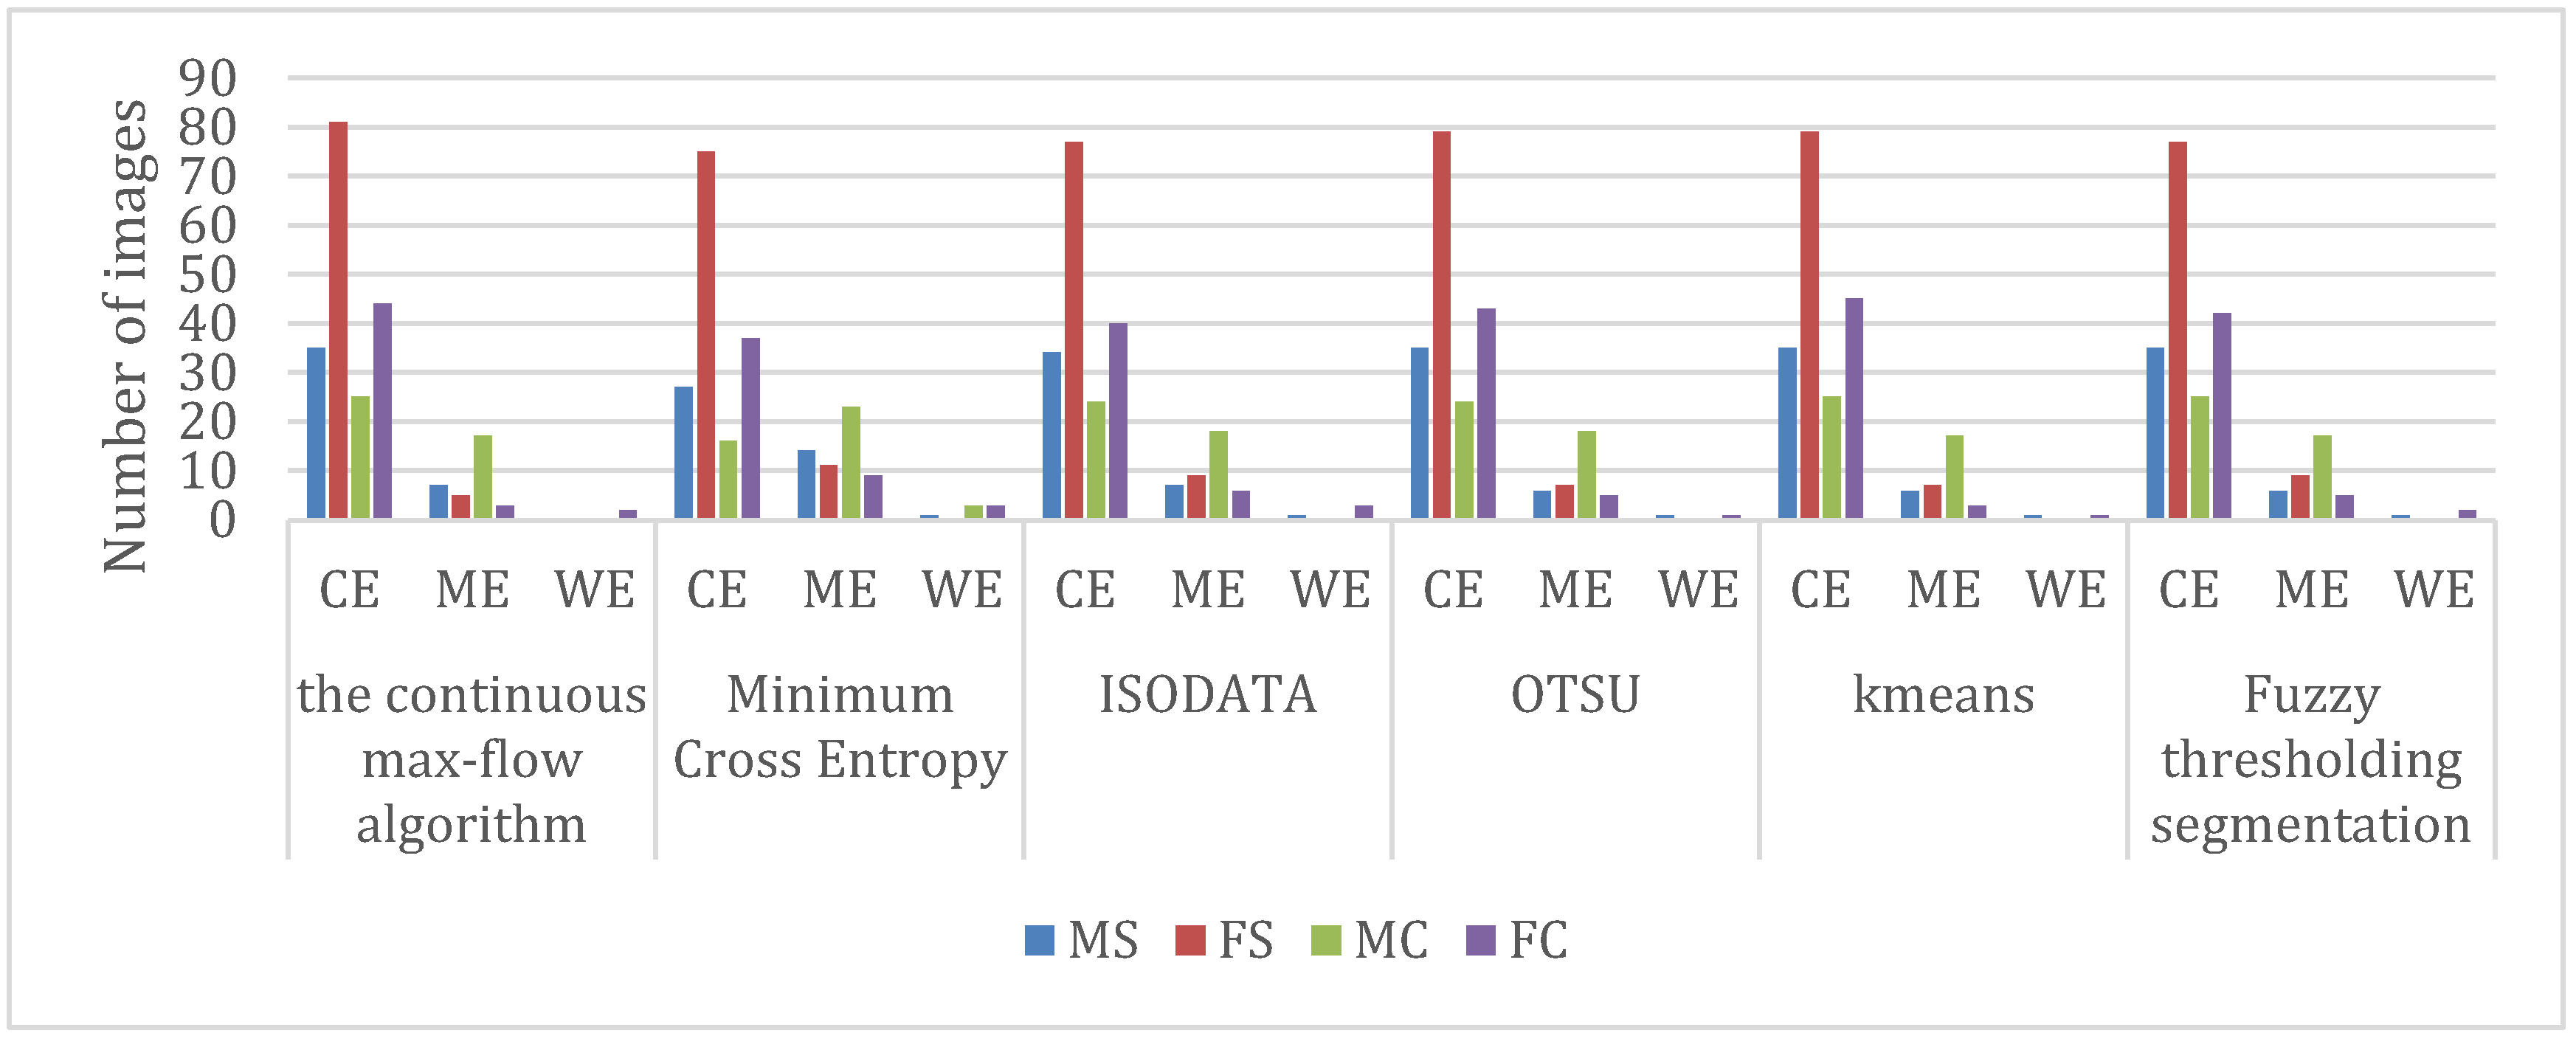
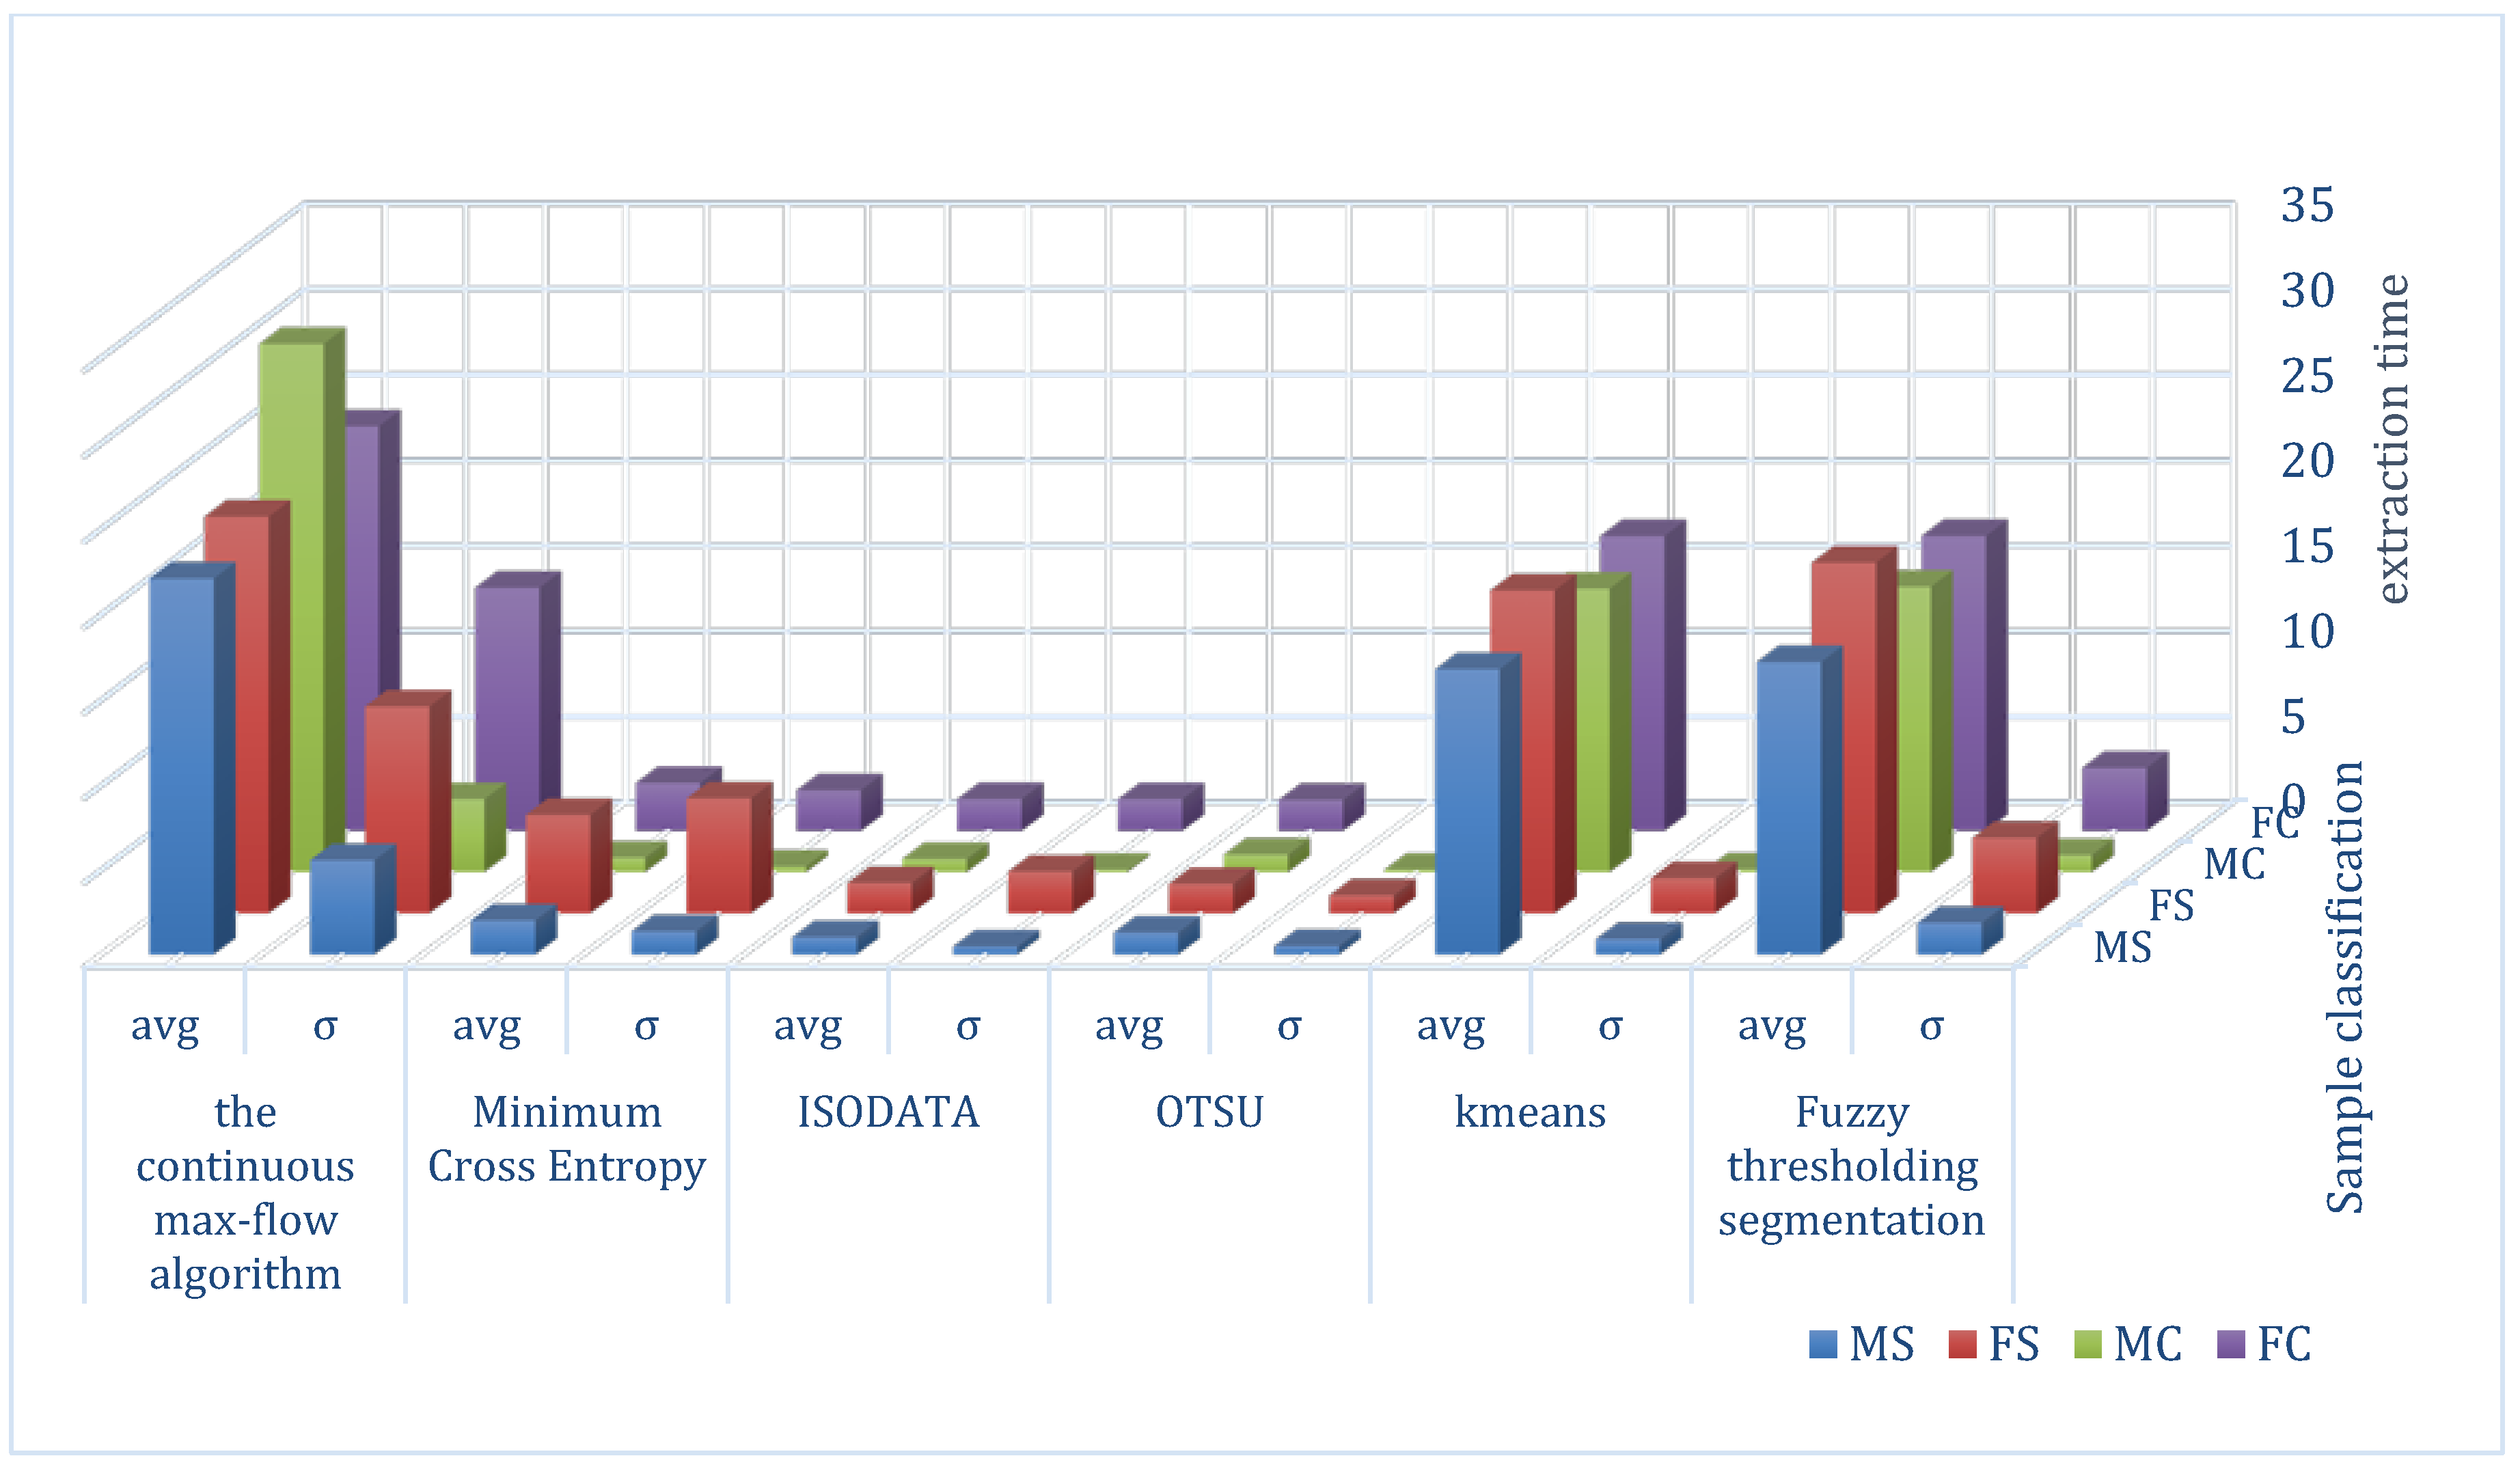
3.1. Effects of Segmentation for Maize Zone at Seedling Stage
3.2. Evaluation of Effectiveness of Core Localization
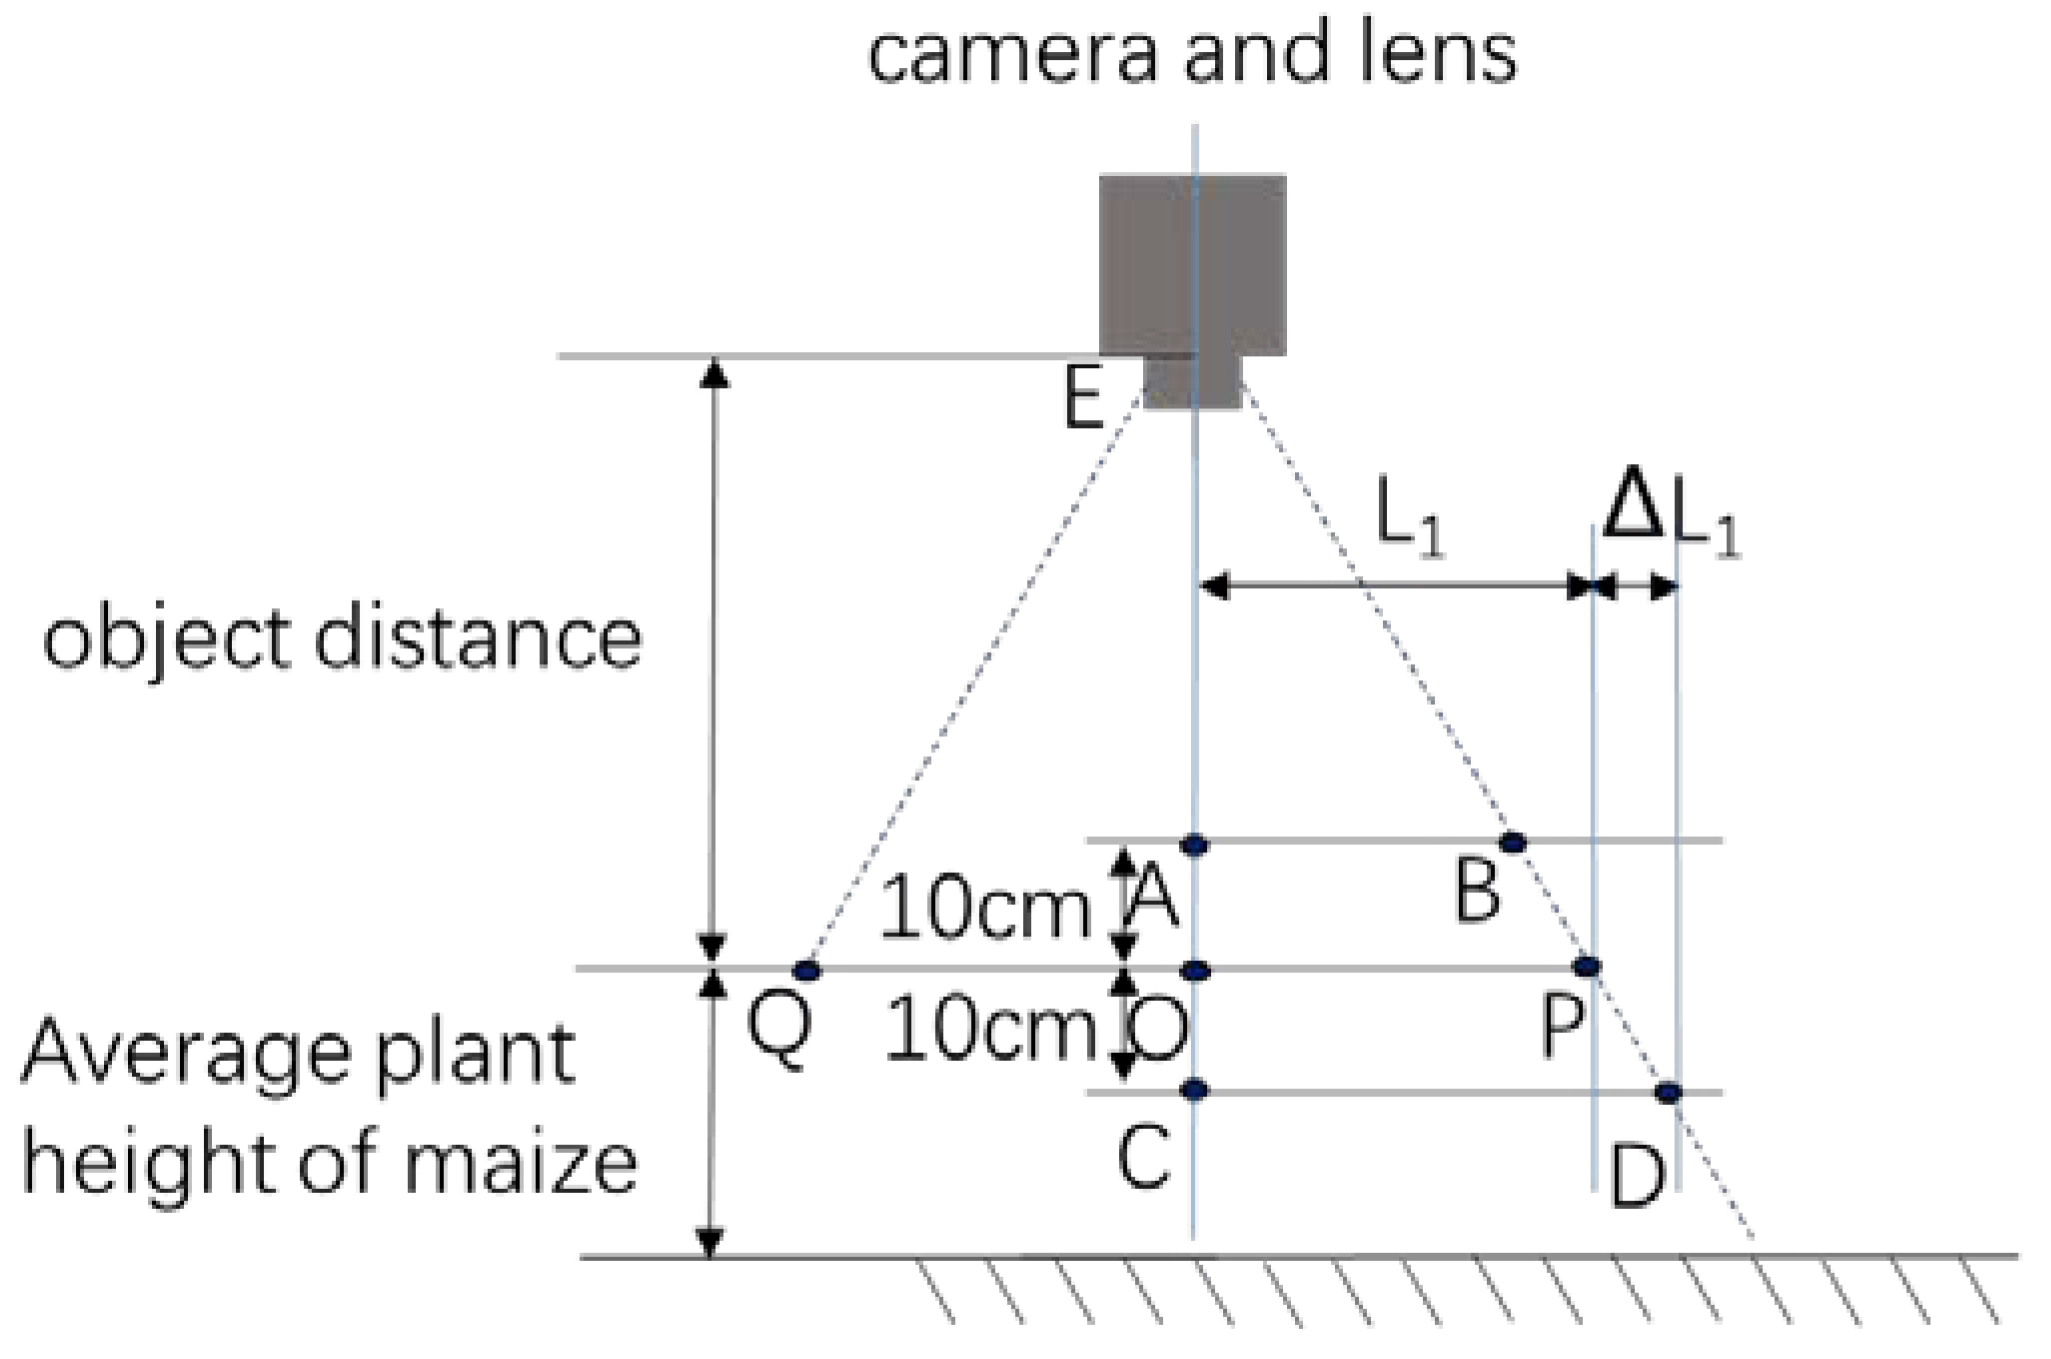
3.3. Spatial Orientation of the Maize Core
4. Conclusions
Author Contributions
Funding
Acknowledgments
Conflicts of Interest
References
- Quebrajo, L.; Pérez-Ruiz, M.; Rodriguez-Lizana, A.; Agüera, J. An approach to precise nitrogen management using hand-held crop sensor measurements and winter wheat yield mapping in a Mediterranean environment. Sensors 2015, 15, 5504–5517. [Google Scholar] [CrossRef] [PubMed] [Green Version]
- de Lara, A.; Longchamps, L.; Khosla, R. Soil water content and high-resolution imagery for precision irrigation: Maize yield. Agronomy 2019, 9, 174. [Google Scholar] [CrossRef] [Green Version]
- Hou, M.J.; Tian, F.; Zhang, L.; Li, S.E.; Du, T.S.; Huang, M.S.; Yuan, Y.S. Estimating crop transpiration of soybean under different irrigation treatments using thermal infrared remote sensing imagery. Agronomy 2019, 9, 8. [Google Scholar] [CrossRef] [Green Version]
- Maes, W.H.; Steppe, K. Perspectives for remote sensing with unmanned aerial vehicles in precision agriculture. Trends Plant. Sci. 2019, 24, 152–164. [Google Scholar] [CrossRef] [PubMed]
- Bai, J.; Xu, Y.; Wei, X.; Zhang, J.; Shen, B. Weed identification from winter rape at seedling stage based on spectrum characteristics analysis. Trans. Chin. Soc. Agric. Eng. 2013, 29, 128–134. [Google Scholar]
- Sun, J.; He, X.; Tan, W.; Wu, X.; Shen, J.; Lu, H. Recognition of crop seedling and weed recognition based on dilated convolution and global pooling in CNN. Trans. Chin. Soc. Agric. Eng. 2018, 34, 159–165. [Google Scholar]
- Wang, C.; Li, Z. Weed recognition using SVM model with fusion height and monocular image features. Trans. Chin. Soc. Agric. Eng. 2016, 32, 165–174. [Google Scholar]
- Utstumo, T.; Urdal, F.; Brevik, A.; Dørum, J.; Netland, J.; Overskeid, Ø.; Berge, T.W.; Gravdahl, J.T. Robotic in-row weed control in vegetables. Comput. Electron. Agric. 2018, 154, 36–45. [Google Scholar] [CrossRef]
- Bogue, R. Domestic robots: Has their time finally come? Ind. Robot. 2017, 44, 129–136. [Google Scholar] [CrossRef]
- Meng, Q.; Zhang, M.; Yang, G.; Qiu, R.; Xiang, M. Guidance line recognition of agricultural machinery based on particle swarm optimization under natural illumination. Trans. Chin. Soc. Agric. Mach. 2016, 47, 11–20. [Google Scholar]
- Lottes, P.; Hörferlin, M.; Sander, S.; Stachniss, C. Effective vision-based classification for separating sugar beets and weeds for precision farming. J. Field Robot. 2017, 34, 1160–1178. [Google Scholar] [CrossRef]
- Thorp, K.R.; Tian, L.F. A review on remote sensing of weeds in agriculture. Precis Agric. 2004, 5, 477–508. [Google Scholar] [CrossRef]
- Van Der Weide, R.Y.v.d.; Bleeker, P.O.; Achten, V.T.J.M.; Lotz, L.A.P.; Fogelberg, F.; Melander, B. Innovation in mechanical weed control in crop rows. Weed Res. (Oxf) 2008, 48, 215–224. [Google Scholar] [CrossRef]
- Cordill, C.; Grift, T.E. Design and testing of an intra-row mechanical weeding machine for corn. Biosyst. Eng. 2011, 110, 247–252. [Google Scholar] [CrossRef]
- Usha, K.; Singh, B. Potential applications of remote sensing in horticulture—A review. Sci. Hortic. 2013, 153, 71–83. [Google Scholar] [CrossRef]
- Mao, W.; Wang, H.; Zhao, B.; Zhang, Y.; Zhou, P.; Zhang, X. Weed detection method based the centre color of corn seedling. Nongye Gongcheng Xuebao Trans. Chin. Soc. Agric. Eng. 2009, 25, 161–164. [Google Scholar]
- Wei, S.; Zhang, Y.E.; Mei, S. Fast recognition method of maize core based on top view image. Nongye Jixie Xuebao Trans. Chin. Soc. Agric. Mach. 2017, 48, 136–141. [Google Scholar]
- Hu, L.; Luo, X.; Zeng, S.; Zhang, Z.; Chen, X.; Lin, C. Plant recognition and localization for intra-row mechanical weeding device based on machine vision. Nongye Gongcheng Xuebao Trans. Chin. Soc. Agric. Eng. 2013, 29, 12–18. [Google Scholar]
- Song, Y.; Liu, Y.; Liu, L.; Zhu, D.; Jiao, J.; Chen, L. Extraction method of navigation baseline of corn roots based on machine vision. Trans. Chin. Soc. Agric. Mach. 2017, 48, 38–44. [Google Scholar]
- Hamuda, E.; Glavin, M.; Jones, E. A survey of image processing techniques for plant extraction and segmentation in the field. Comput. Electron. Agric. 2016, 125, 184–199. [Google Scholar] [CrossRef]
- Woebbecke, D.M.; Meyer, G.E.; Von Bargen, K.; Mortensen, D.A. Color indices for weed identification under various soil, residue, and lighting conditions. Trans. ASAE 1995, 38, 259–269. [Google Scholar] [CrossRef]
- Burgos-Artizzu, X.P.; Ribeiro, A.; Guijarro, M.; Pajares, G. Real-time image processing for crop/weed discrimination in maize fields. Comput. Electron. Agric. 2011, 75, 337–346. [Google Scholar] [CrossRef] [Green Version]
- Honggen, L.U.O.; Limin, Z.H.U.; Han, D. A survey on image segmentation using active contour and level set method. J. Image Graph. 2006, 11, 301–309. [Google Scholar]
- Wang, X.; Fang, L. Survey of image segmentation based on active contour model. Pattern Recognit. Artif. Intell. 2013, 26, 751–760. [Google Scholar]
- Yuan, J.; Bae, E.; Tai, X.C. A study on continuous max-flow and Min-cut approaches. In Proceedings of the IEEE Conference on Computer Vision and Pattern Recognition, San Francisco, CA, USA, 13–18 June 2010; pp. 2217–2224. [Google Scholar]
- Li, C.H.; Lee, C.K. Minimum cross entropy thresholding. Pattern Recognit. 1993, 26, 617–625. [Google Scholar] [CrossRef]
- Ridler, T.W.; Calvard, S. Picture thresholding using an iterative selection method. IEEE Trans. Syst. Man Cybern. 1978, 8, 630–632. [Google Scholar]
- Otsu, N. A threshold selection method FROM gray-level histograms. IEEE Trans. Syst. Man Cybern. 1979, 9, 62–66. [Google Scholar] [CrossRef] [Green Version]
- Arthur, D.; Vassilvitskii, S. k-means ++: The Advantages of Careful Seeding; SIAM: Philadelphia, PA, USA, 2007; pp. 1027–1035. [Google Scholar]
- Gavioli, A.; de Souza, E.G.; Bazzi, C.L.; Schenatto, K.; Betzek, N.M. Identification of management zones in precision agriculture: An evaluation of alternative cluster analysis methods. Biosyst. Eng. 2019, 181, 86–102. [Google Scholar] [CrossRef]
- Aja-Fernández, S.; Curiale, A.H.; Vegas-Sánchez-Ferrero, G. A local fuzzy thresholding methodology for multiregion image segmentation. Knowl. Based. Syst. 2015, 83, 1–12. [Google Scholar] [CrossRef]
- Haralick, R.M.; Shapiro, L.G. Computer and Robot Vision, Vol. I.; Addison-Wesley: Boston, MA, USA, 1992; pp. 28–48. [Google Scholar]
- Song, K.; Ren, X. Image segmentation of disease speckle of corn leaf based on YCbCr color space. Nongye Gongcheng Xuebao Trans. Chin. Soc. Agric. Eng. 2008, 24, 202–205. [Google Scholar]
- Li, Z.; Wang, S.; Sun, J. Image segmentation in object recognition of mature eggplant. Nongye Jixie Xuebao Trans. Chin. Soc. Agric. Mach. 2009, 40, 105–108+196. [Google Scholar]
- Zheng, X.; Wang, X. Leaf vein extraction based on gray-scale morphology. Int. J. Image Graph. Signal Process. 2010, 2, 25–31. [Google Scholar] [CrossRef]
- Su, W.; Jiang, K.; Yan, A.; Liu, Z.; Zhang, M.; Wang, W. Monitoring of planted lines for breeding corn using UAV remote sensing image. Trans. Chin. Soc. Agric. Eng. 2018, 34, 92–98. [Google Scholar]
- Zhang, Z.Y. A flexible new technique for camera calibration. IEEE Trans. Pattern Anal. Mach. Intell. 2000, 22, 1330–1334. [Google Scholar] [CrossRef] [Green Version]


© 2020 by the authors. Licensee MDPI, Basel, Switzerland. This article is an open access article distributed under the terms and conditions of the Creative Commons Attribution (CC BY) license (http://creativecommons.org/licenses/by/4.0/).
Share and Cite
Zong, Z.; Liu, G.; Zhao, S. Real-Time Localization Approach for Maize Cores at Seedling Stage Based on Machine Vision. Agronomy 2020, 10, 470. https://doi.org/10.3390/agronomy10040470
Zong Z, Liu G, Zhao S. Real-Time Localization Approach for Maize Cores at Seedling Stage Based on Machine Vision. Agronomy. 2020; 10(4):470. https://doi.org/10.3390/agronomy10040470
Chicago/Turabian StyleZong, Ze, Gang Liu, and Shuo Zhao. 2020. "Real-Time Localization Approach for Maize Cores at Seedling Stage Based on Machine Vision" Agronomy 10, no. 4: 470. https://doi.org/10.3390/agronomy10040470
APA StyleZong, Z., Liu, G., & Zhao, S. (2020). Real-Time Localization Approach for Maize Cores at Seedling Stage Based on Machine Vision. Agronomy, 10(4), 470. https://doi.org/10.3390/agronomy10040470