Article

Comparison of Greenhouse Energy Requirements for Rose Cultivation in Europe and North Africa

1
Department of Agricultural and Environmental Sciences–Production, Landscape, Agroenergy, Università degli Studi di Milano, Via Celoria 2, 201333 Milan, Italy
2
Department of Agriculture, Food and Environment, Università degli Studi di Catania, Via Valdisavoia 5, 95123 Catania, Italy
*
Authors to whom correspondence should be addressed.
Agronomy 2020, 10(3), 422; https://doi.org/10.3390/agronomy10030422
Submission received: 13 February 2020 / Revised: 15 March 2020 / Accepted: 18 March 2020 / Published: 20 March 2020

Abstract

:
The ornamental plant production in greenhouses is widespread. A quantitative assessment of greenhouse energy consumption and its variability in space and time is strategic to improve the sustainability of the cultivation. The specific environmental features of the cultivation areas can strongly affect the sustainability of the production. A dynamic simulation model of greenhouse energy balance with an hourly time step was developed and parameterized for a state-of-the-art greenhouse to evaluate the heating requirements for cut-flower roses. This ornamental crop has been used as model species for its high energy requirement for flower production. The energy demand for rose production has been analyzed with an energy balance model with an hourly time step. After a preliminary analysis on the period 1973–2019, the final analysis was carried out on the 30-year period (1990–2019), representative of the current climate. Results show a gradient southwest–northeast of energy needs with relevant effects on economic and environmental sustainability. More specifically, four large sub-areas are identified, namely the central-southern Mediterranean (yearly requirements below 600 MJ m−2 year), the northern Mediterranean, and the area influenced by the mitigating effect of the Atlantic Ocean (600–1200), the central-European area (requirements of 1200–1800), and the Northern European area (above 1800).

1. Introduction

Greenhouse rose cultivation is worldwide as well as the commercialization of cut-flower roses (Table 1). Rose flowers are the most appreciated among the cut flowers. The demand follows a specific trend during the year with the increase on the occasion of specific fests (e.g., Valentine’s Day, Mother’s Day, etc.) [1]. The satisfaction of the consumer’s demand requires accurate planning and management of the cultivation. The rose crops can be cultivated for at least two years in intensive protected cultivations. The rose cultivation can be directly carried out in soil or in soilless systems [2]. The planning of rose production can be performed by monitoring the environmental conditions (temperature, relative humidity, light intensity) and controlling them. In different geographical areas, the winter cultivation can be carried out with adequate temperature control inside the greenhouse. During winter, the optimal temperature to maintain continuous flower production is between 16 and 22 °C. The growing temperature is very important for flower development and morphological parameters [3]. In general, the temperature during the night should be lowered to reduce the crop metabolism, since respiration consumes sugars that could be used for growth and flower production. On the contrary, during daytime, temperature should be increased up to the optimal for the best photosynthesis activity. The highest performance of crops should be obtained by combining the optimal temperature with optimal light availability.
Several models have been used for monitoring and controlling the rose production under protected cultivations. There are models that work on mineral nutrition and others related to temperature or radiation [5,6,7].
The greenhouse area destined to rose cultivation increased significantly during the previous decades, and at present, it is estimated at 405,000 ha, spread over all continents except Antarctica [8]. The protected cultivation allows the control of environmental parameters and enhances the yield and quality of cut flowers. Therefore, it is very important to assess, at a territorial scale, the impact of climate variability and change on greenhouse cultivation and the energy requirements for heating and cooling during cultivation. Protected cultivations are extremely important for winter cut flower production to maintain constant market supply. The high energy demand for cut rose production induced different farms to delocalize the cultivation to warmer areas, especially for the winter market supply. At present, most of the cultivation has been delocalized to Africa and Latin America, where the most important cut flower production countries are Kenya, Ethiopia, Ecuador, and Colombia. The cut flower production in developing countries shows important social benefits regarding the employment of local people and technology transfer in agriculture [9]. Europe’s cut flower imports mainly come from Africa and South America [10]. The environmental impact of rose production in Northern Europe and South America were compared and evaluated using a Life Cycle Assessment (LCA). The LCA, revealed that, in Ecuador, rose production is environmentally friendlier compared to the Netherlands productions, especially in winter when heating and lighting are required [11]. Rose production in the Netherlands has negative ecological consequences due to high-energy consumption of the greenhouses. On the contrary, in Ecuador, the favorable environmental conditions, in terms of thermal and radiative, reduce the heating costs, with positive effects on environment. The heating requirement is one of the major limiting factors in rose production and climate plays an important role in the production costs. The energy balance modeling can be useful for rose production and flowering prediction.
The most limiting factor of protected crops is the heating cost [12]. In fact, a substantial requisite for greenhouses, in order to guarantee the growth and development of crops, is an efficient control of temperature, which can be obtained using active modifiers (heating and cooling devices) and light in winter (using supplemental lighting).
The sustainability of rose production depends on the environmental conditions and the energy requirements for maintaining the temperature in the optimal range. The climatization costs depend also on the fuel used and the efficiency of the heating system. The rose cultivation is often delocalized to areas with lower climatization needs and lower labor costs. The cultivation in warmer areas can be economically convenient, but environmental sustainability depends on the transportation system and the distance to the target market. The aim of this work was to evaluate the energy requirement for climatization of greenhouse with optimized temperature range for rose cultivation.

2. Materials and Methods

2.1. Meteorological Data

The greenhouse energy balance needs hourly values of temperature and global solar radiation.
Fifty-six weather stations, representative of different environmental conditions, were chosen from the Global Summary of the Day dataset (GSOD) from the National Oceanic and Atmospheric Administration of the United States (NOAA) [13], collecting daily maximum and minimum temperatures for the period 1973–2019.
Missing data were reconstructed with the geostatistical approach described in Mariani et al. [14]. For each unknown missing point, neighbor points temperatures were homogenized to the same altitude of the unknown point (−0.5 °C for 100 m increase in altitude) and then the missing temperature was obtained with a weighted average of the values available at the known points using an inverse squared-distance weight.
The hourly values of air temperature were obtained with the Parton and Logan generator [15].
Following the approach proposed by Cola et al. [16], the daily global solar radiation (GSR) was estimated by means of the Hargreaves model [17] on the basis of the daily thermal range and site-specific geographic coordinates and height, while hourly values were obtained with the sinusoidal approach of Williams et al. [18].
The analysis was referred (i) to the longer period 1973–2019 in order to highlight recent trends in energy requirements for rose greenhouses and (ii) to the last 30 years (1990–2019) in order to obtain the most recent climate normal [19].

2.2. The Greenhouse Energy Balance

The physical properties of the glass covering strongly affects the greenhouse radiation balance. In fact, the glass covering transmittance (GCT) is about 70% in the visible (VIS) and near infrared (NIR) wavelengths, but only 3% in the far infrared (IR). As a result, while a relevant part of the global solar radiation (GSR) enters the greenhouse, the sky long waver radiation (SKLR) cannot enter and is discarded from the radiation balance. In the same way, Albedo (A – the fraction of GSR reflected by surfaces inside the greenhouse) can exit without interference, while the long wave radiation emitted inside cannot exit from the greenhouse. Therefore, used in place of the SKLR, is the greenhouse cladding long wave radiation (GCLR) emitted toward the ground from the upper and sidewalls of the greenhouse (cladding surface). Cladding surface emits in function of its temperature, according to the Stefan–Boltzmann law. The latter will be partly balanced by the radiation emitted upward from the surface (SULR), which is also estimated with the Stefan–Boltzmann law.
The greenhouse energy balance model applied in this work is based on the former work of Mariani et al. [14]. The model works with an hourly time step and all the fluxes are expressed in Wm−2. The fluxes directed towards the greenhouse ground surface are assumed positive.
The greenhouse net radiation (GNR) at the ground surface inside the greenhouse is expressed as:
GNR = CTGSR GSR (1 − A) − CTLR SULR + GCLR
Where:
GNR is the greenhouse net radiation and is used in place of the standard radiation budget of earth’s surface suitable for field crops.
CTGSR is the transmittance for global solar radiation
CTLR is the transmittance for far infra-red radiation.
The term GNR is used both for the energy balance of the greenhouse and as a term of net radiation equation of the Penman–Monteith model, for the simulation of the reference crop evapotranspiration (ET0).
More specifically, the energy balance equation (all terms are in W m−2) is expressed as:
GNR + G + LE + FV + FW = ΔQS + ΔQP
where G is the ground heat flux, LE is the latent heat evapotranspiration flux, FV is the flux through the vent-holes (term of flow by convection—chimney effect—and advection through the openings in a closed greenhouse), and FW is the flux through the windows (heat flow through the cladding surface of the greenhouse). Finally, ΔQS is the accumulation of heat in the greenhouse and ΔQP is the accumulation term of photosynthesis.
The convention adopted is that fluxes directed towards the greenhouse ground surface are positive while the others are negative. To moderate the excessive summer heat, the aeration (term Qvent) is adopted, while shading is avoided.
The equations adopted to simulate the different terms of the energy balance are hereafter described.
G is expressed as function of GNR:
G = − 0.05 × GNR for GNR > 0 while G = − 0.5 × GNR for GNR < 0.
FW = Kr Sc (t2 − t1) /S [W m−2]
Where:
Sc is the greenhouse cover area,
S is the greenhouse floor area,
Kr is the coefficient of heat transmission [W m−2 °C−1],
t1 and t2 are the temperatures, respectively, inside and outside the greenhouse [°C] (being the working hypothesis, outer surface with t = t2 while inner surface t = t1).
FV = (R V (t2 − t1) Cs/3600)/S [W m−2]
Where:
V is the greenhouse volume [m−3],
R is the number of air volumes exchanged per hour
Cs is the specific heat of the humid air [J kg−1 °C−1] and is calculated with the equation Cs = cpm rom where cpm is the enthalpy of the humid air (cpm = 1005 + 1820 rms), rms is the mixing ratio [kg of water vapor per kg of air], and rom is the density of the humid air [kg m−3] (rom: = ro × (1 + rms(1013,t1)/1000)/(1 + 1.609 × rms(1013,t1)/1000).
The latent heat flux equation is:
LE0 = − ET0 kc ((2450 1000)/3600)
where:
ET0 is the Penman–Monteith reference crop evapotranspiration [mm h−1] [17]
kc is the crop coefficient for rose.
The terms of the balance described above are used for the following equations
Ie_min = GNRTLn + FWTLn + FVTLn + GTLn + LETLn + AW
Ie_max:= GNRTLx + FWTLx + FVTLx + GTLx + LETLx + AC
where TLn and TLx are equal to 21 and 23 °C during day (period between sunrise and sunset) and to 15 and 17 °C during night. AW and AC [W m−2] are air heating and air conditioning of the previous hour. The operational rule adopted is that if Ie_min < 0 the negative value is compensated by heating, while if Ie_max is >0 the positive value is compensated by air conditioning.
In the present work, only the heating needs will be considered. The model works with an hourly step due to the fact that the variability of rate variables is strong enough to request an hourly approach.
The scheme described was already calibrated and validated by Mariani et al. [14] in order to obtain the heating requirements for tomato production.

2.3. Model Test

The model was tested in a farm dedicated to rose cultivation and located close to Vittoria (South-East of Sicily, Italy, −36°55′19.2″ N, 14°32′56.7″ E), where heating requirement data were available (Table 2). The validation was performed on the growing cycle from October 2018 to March 2019, covering the colder period.
The total greenhouse area where the study was conducted has an area of 7000 m2, with a single module of 200 m × 35 m. The height is 6 m at the top and 4.3 m at the eaves (see Figure S1 as pictured, is semi-circular).
The greenhouses were covered with an 18-month polyethylene film with a thickness of 0.1 mm. The study was conducted with the 5-year-old-roses pink ‘Red Naomi’ in 30-L perlite bags (8 plants/sack). Plants were daily treated with a nutrient solution that consisted of potassium, potassium nitrate, calcium nitrate, nitro34, monopotassium, magnesium sulfate, iron, and microelements; conductivity: 2 mS cm−1. Temperatures were kept at 16 °C at night and at more than 22 °C during the day.

2.4. Analysis of Energy Requirements for Heating

The World Meteorological Organization (WMO) states the current climate can be obtained by analyzing for the following statistical analysis of weather over a 30-year, usually starting with the first year of a decade (from 1 January, 1981 to 31 December, 2010; from 1 January, 1991 to 31 December, 2020, and so on) [20]. In light of these regulations, the following steps were carried out:
-
the hourly greenhouse energy balance model was applied to the temperature time series of the 56 sites for the period 1973–2019;
-
the analysis of the heating requirements of the 56 sites was presented and discussed, focusing on the heating requirements for the 30 years 1990–2019, very close to the 1991–2020 period adopted by the WMO;
-
a comparison with the former phase (1973–1989) was carried out to show the changes in terms of energy requirements for climatization;
-
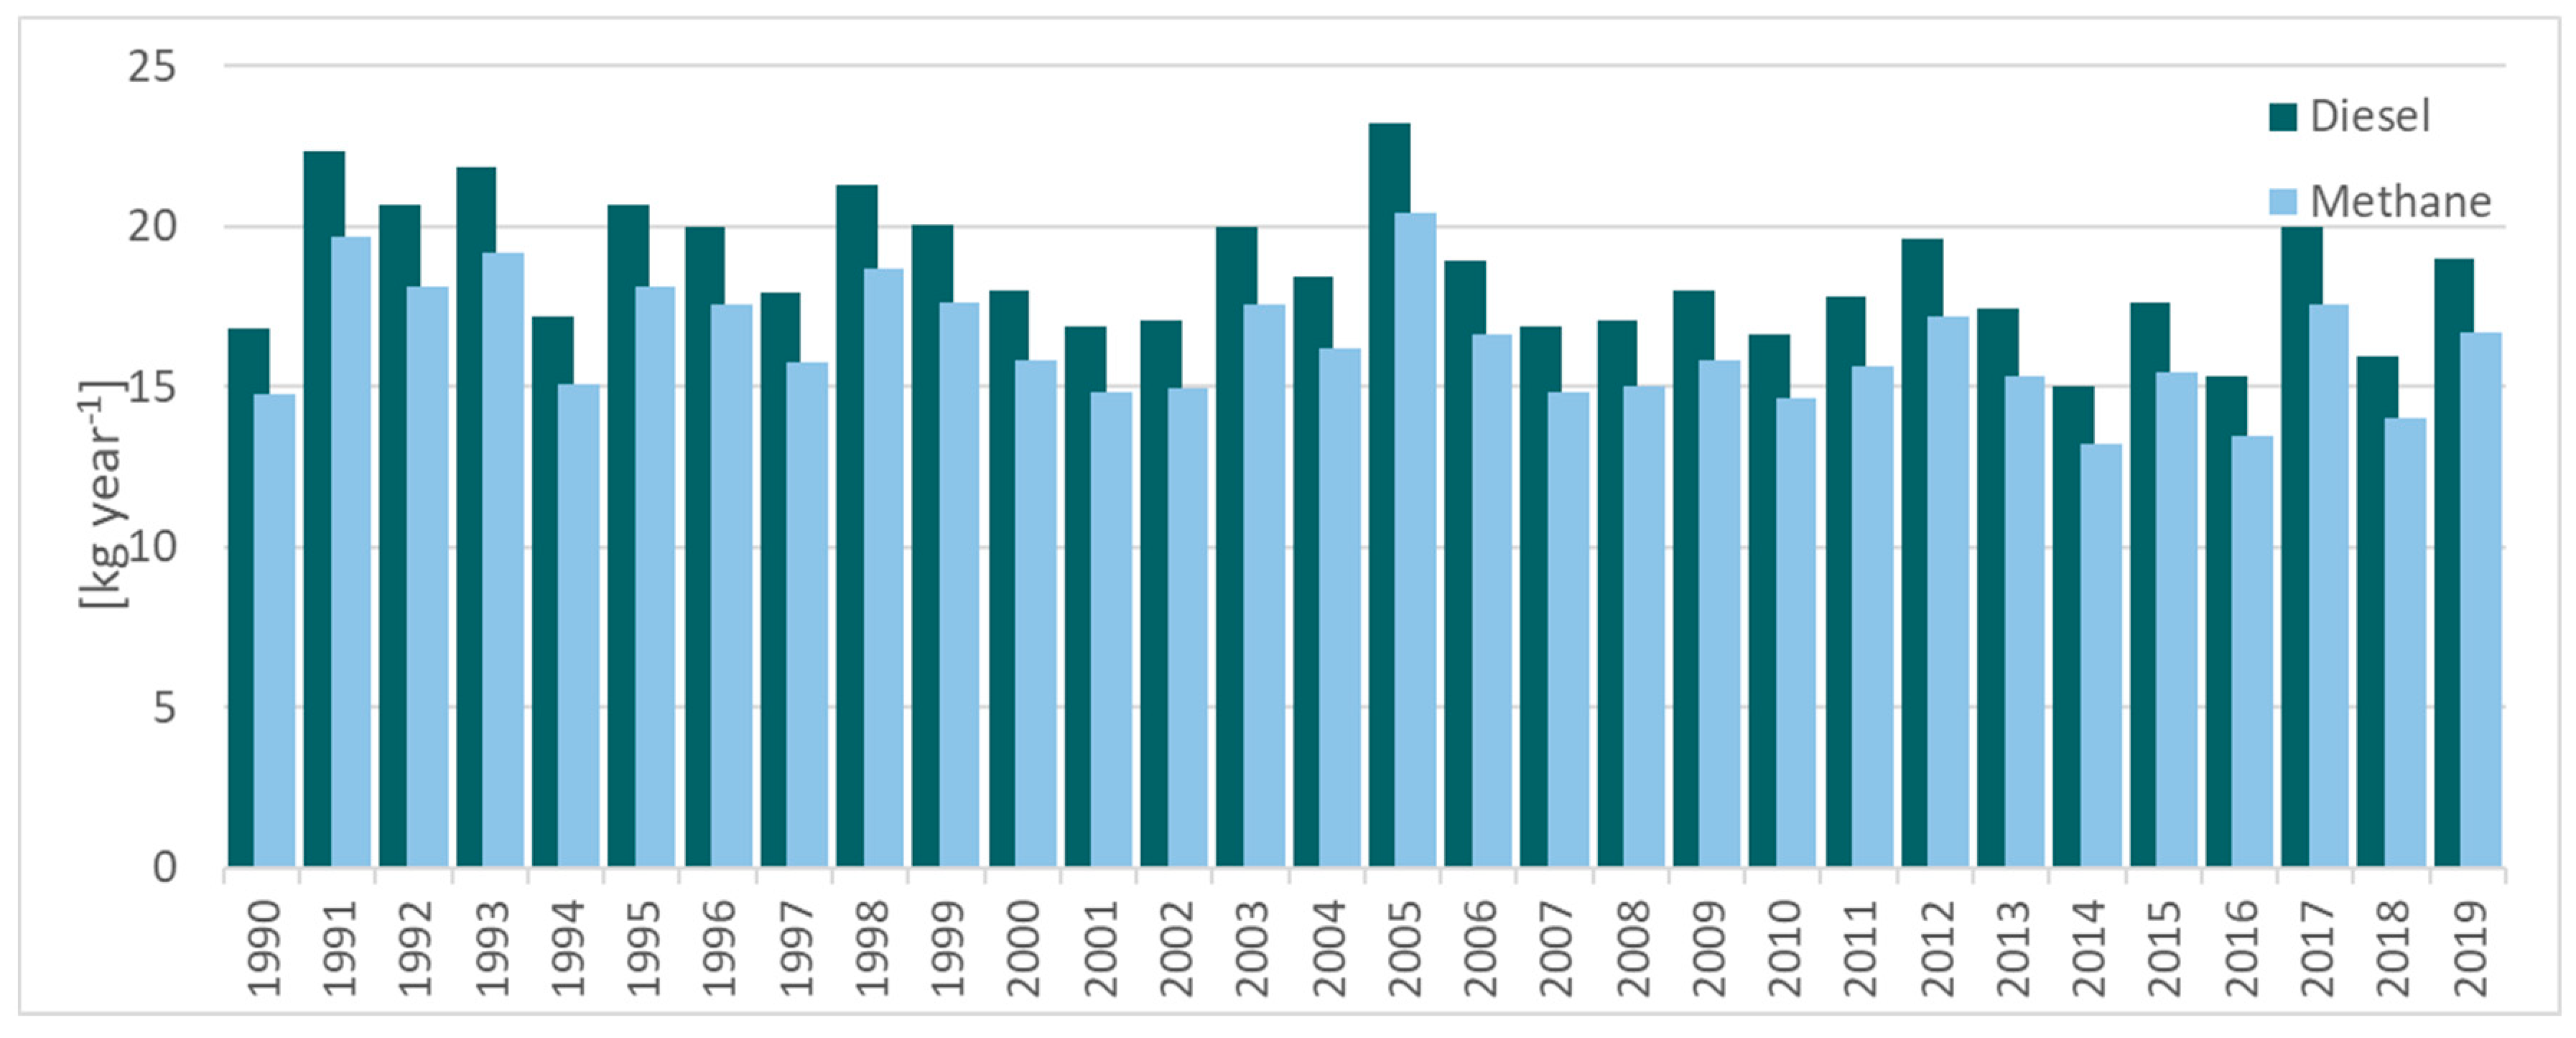
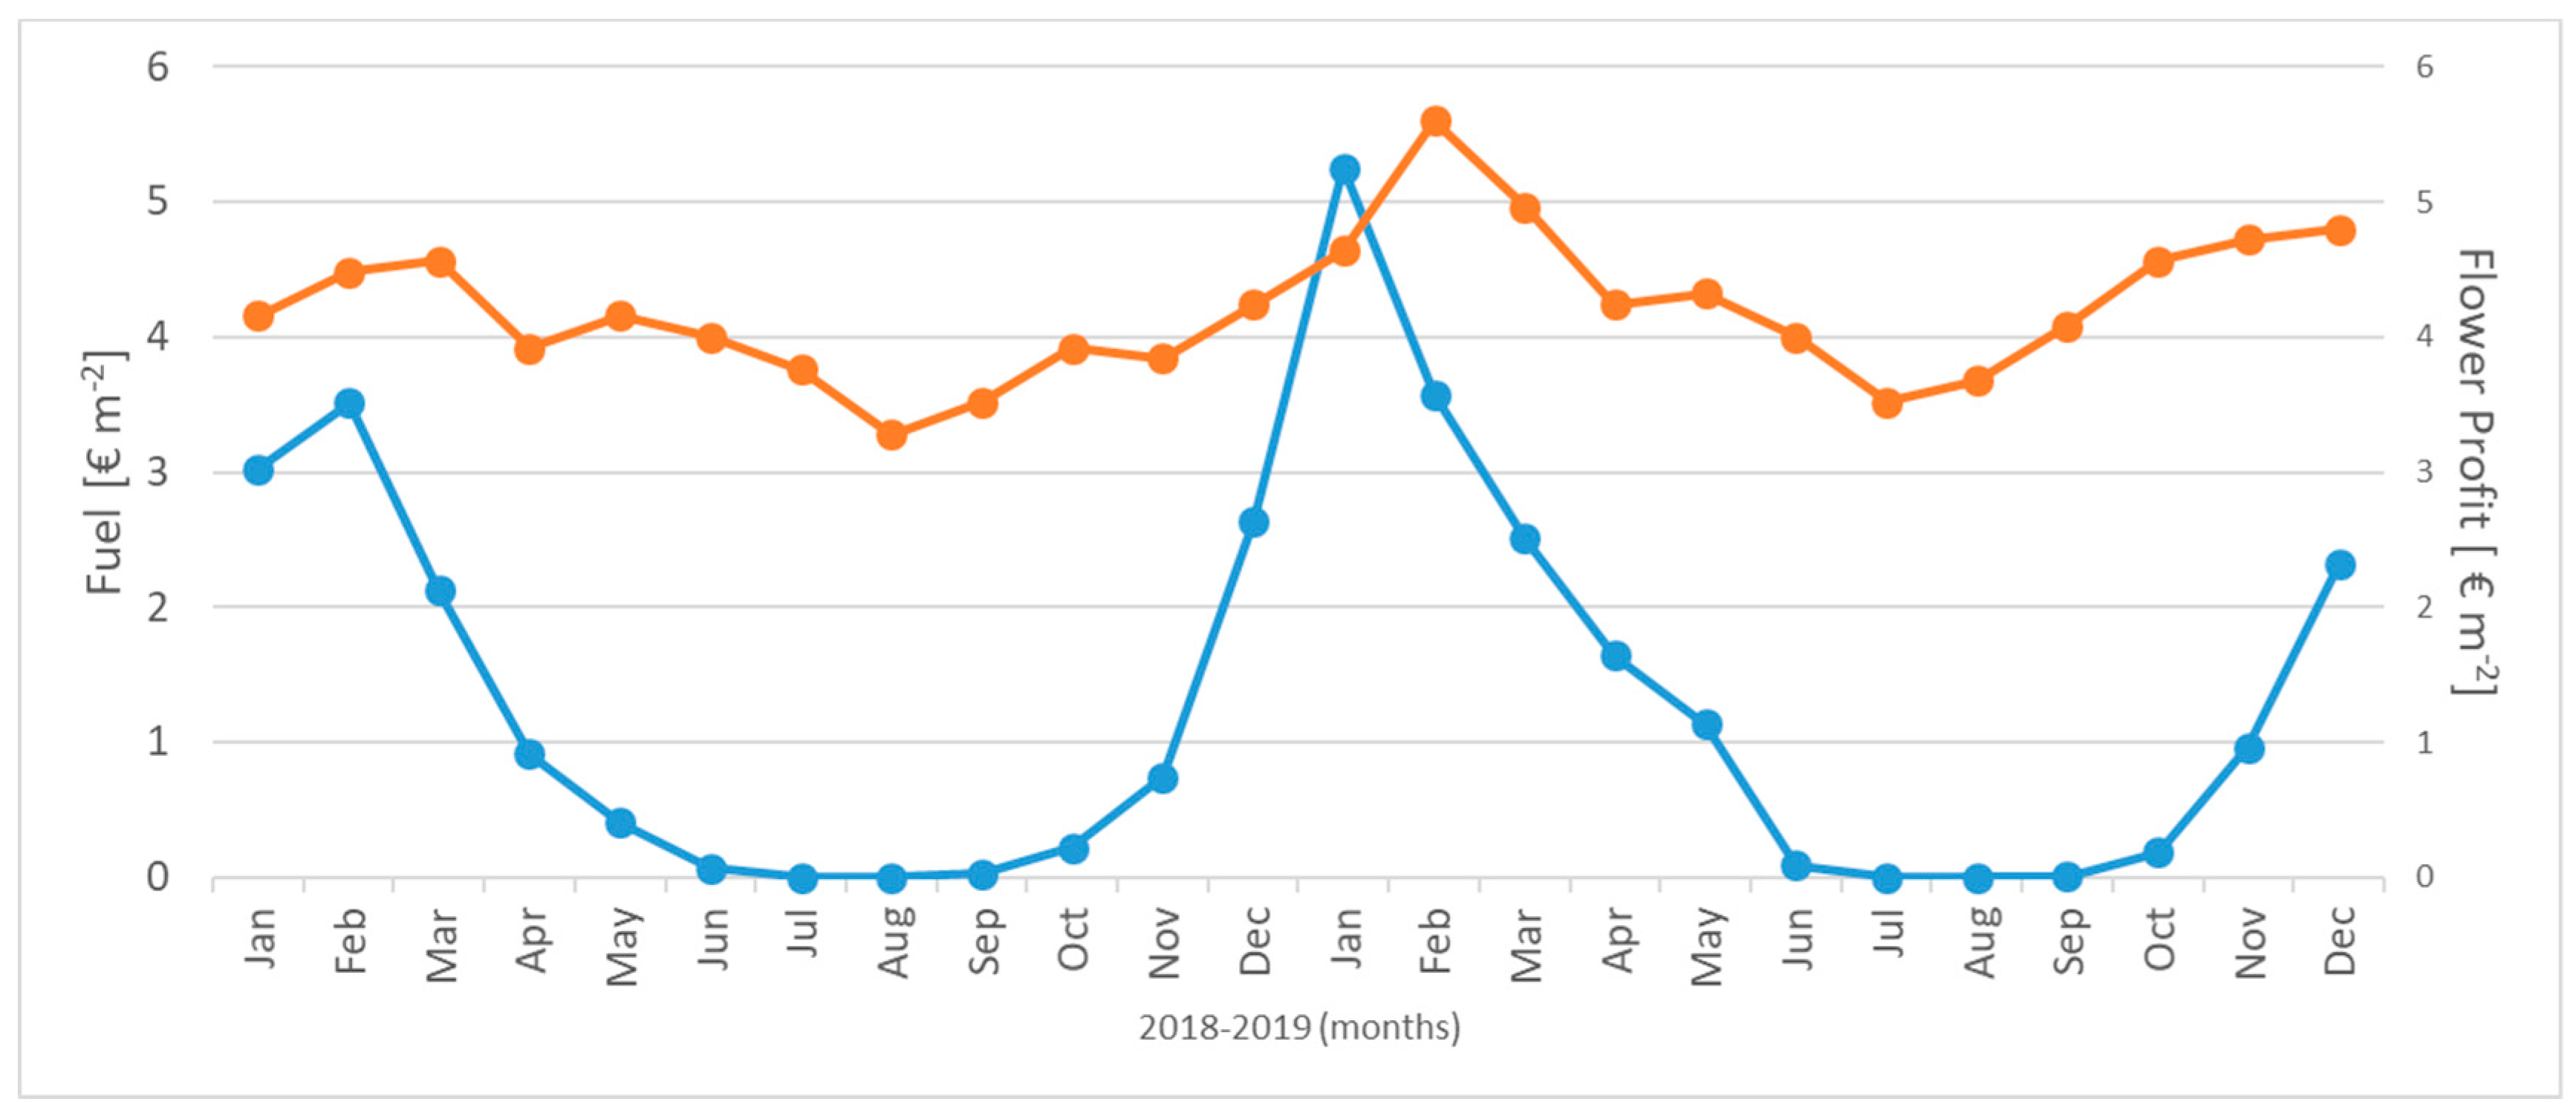
an analysis of the cost of fuel for the period 1990–2019 concerning to the site of Vittoria (Italy).

3. Results

3.1. Model Validation on a Rose Production Farm Located in Sicily

The sum of the simulated daily energy requirements from October 2018 to March 2019 reached 546 MJ m−2 2018–2019, while the observed requirement was of 421.3 MJ m−2. The model showed a monthly average overestimation of 25 MJ m−2 month−1. The seasonal course of consumption was simulated very well, as highlighted by the correlation between observed and simulated monthly energy requirements (R2 = 0.9031).
The difference between the model output and greenhouse farm consumption can be explained, considering the model works with a single greenhouse while the greenhouse used for validation is a multi-greenhouse with lower dispersal surface. This may explain the lower energy request for climatization.

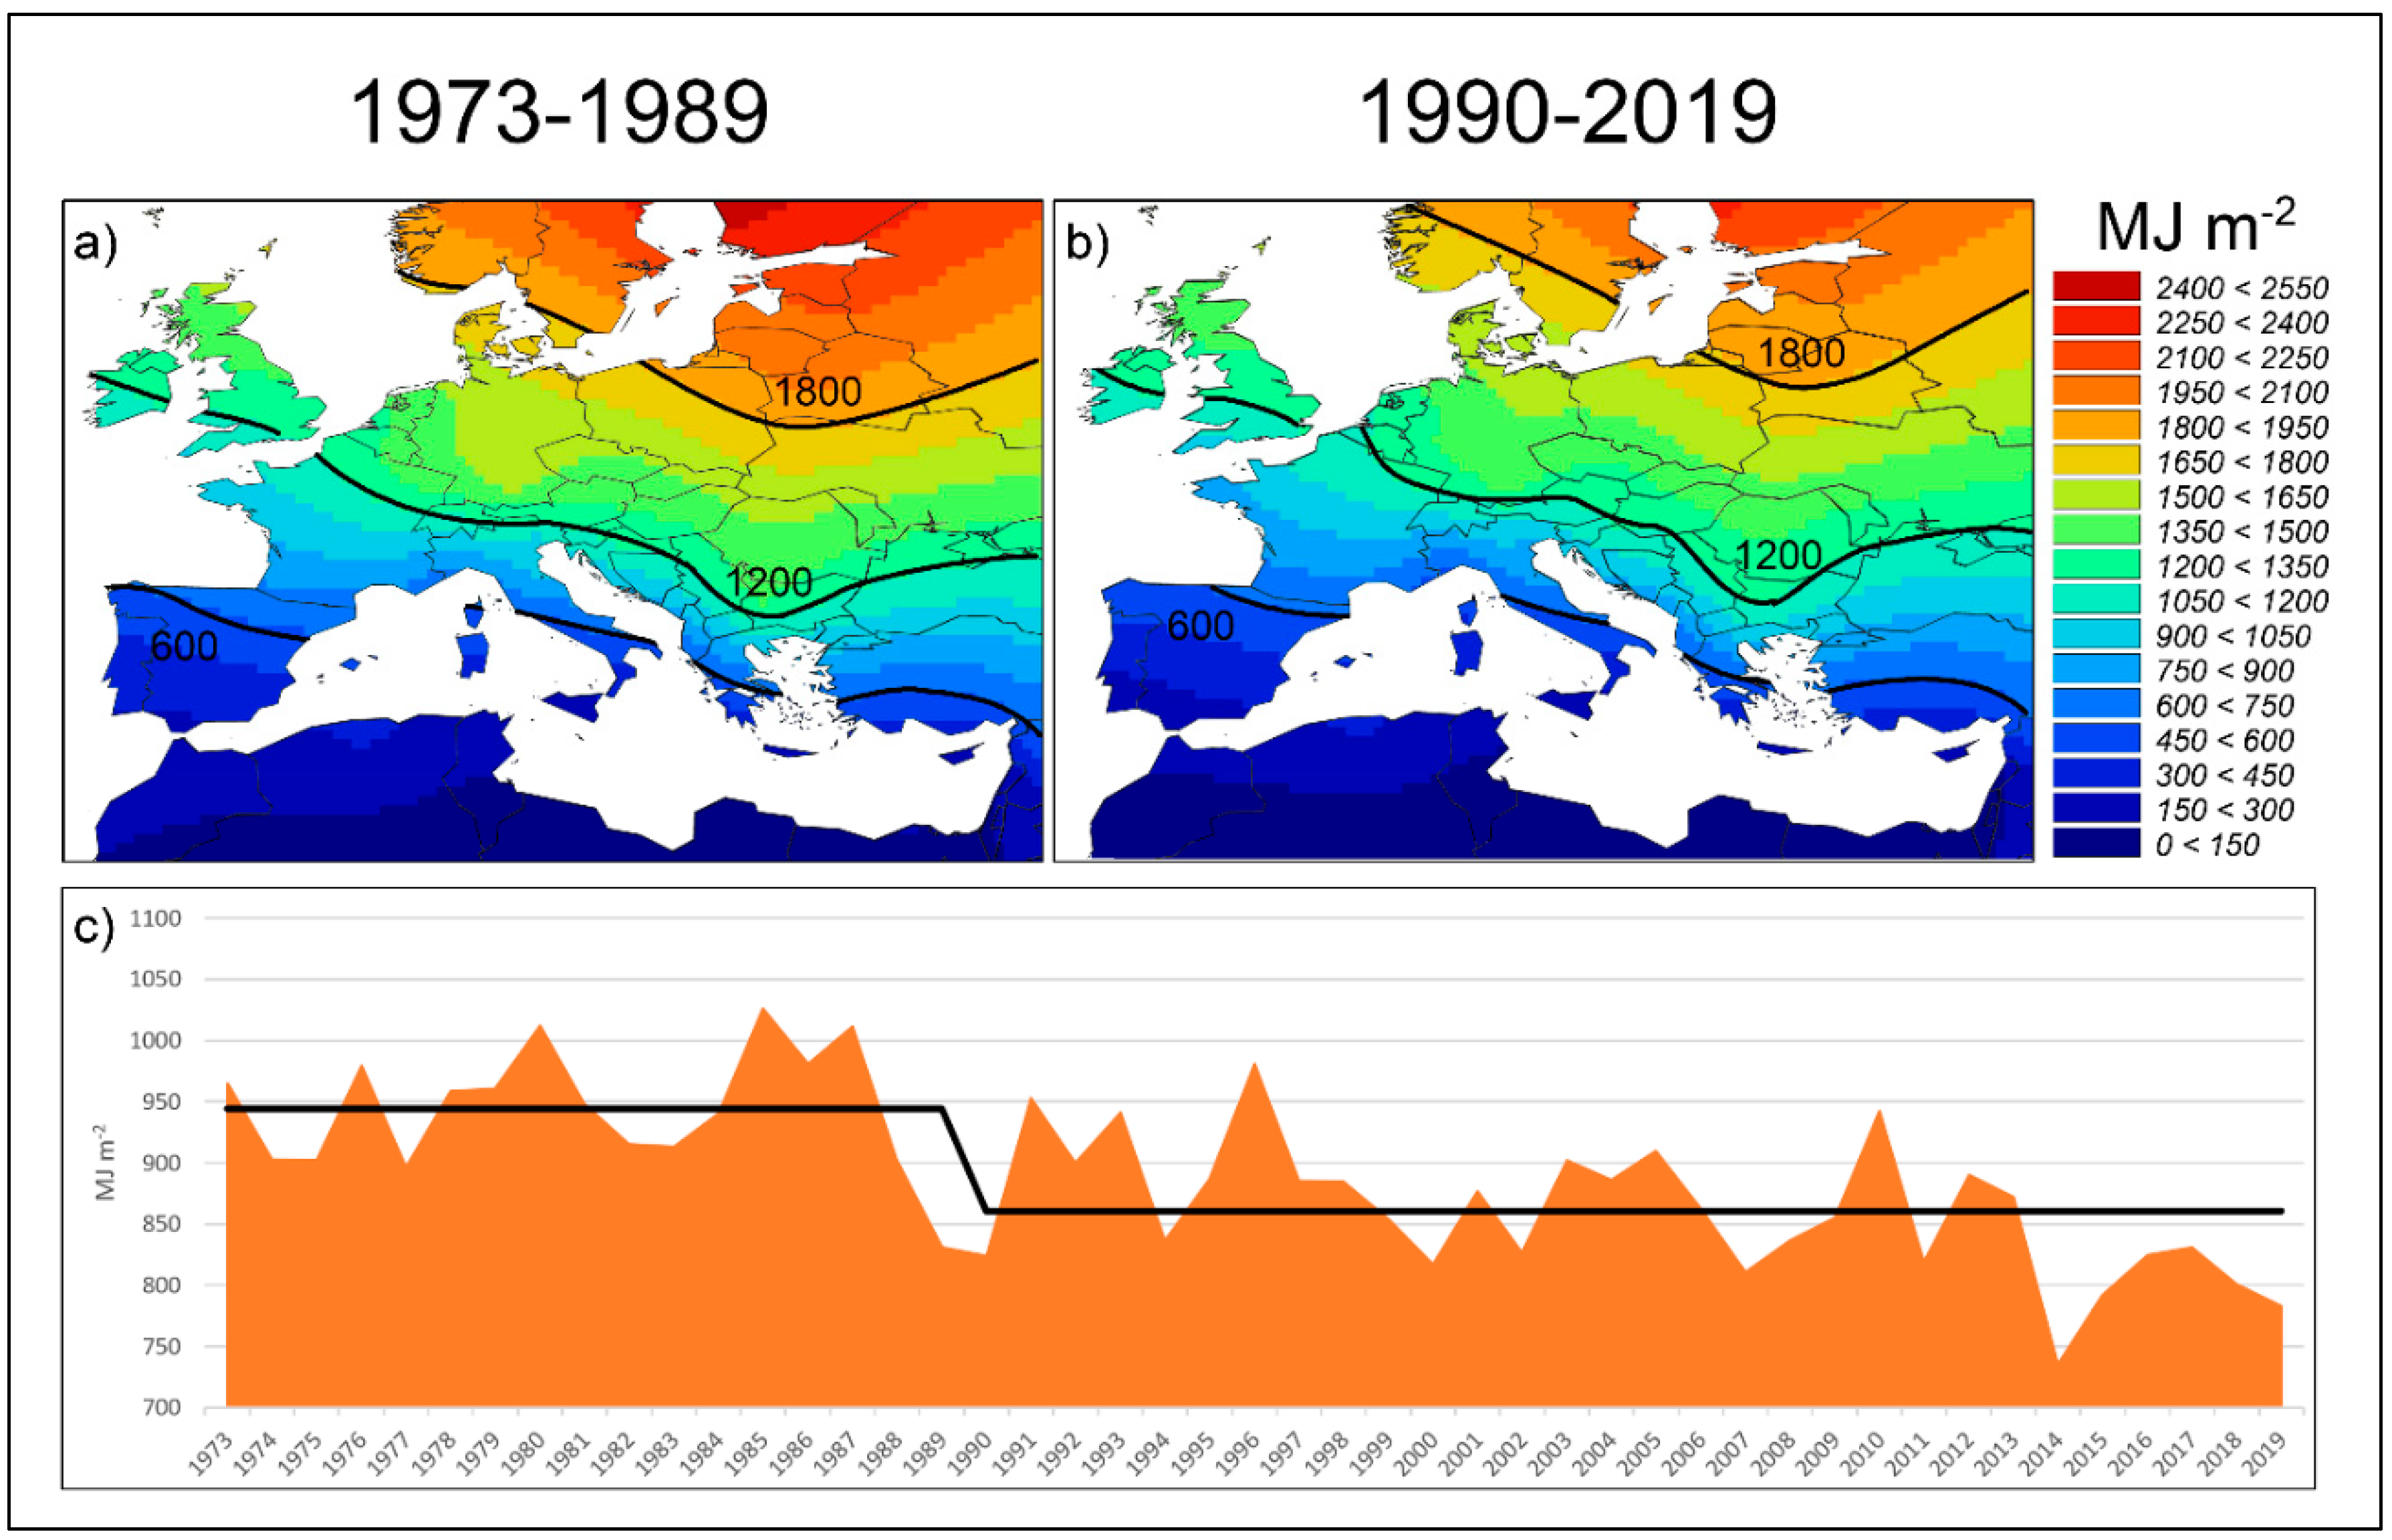
3.2. European Energy Requirements for Greenhouse Climatization

The growing environmental conditions affect rose production and cultivation costs. Temperature is one of the most important parameters affecting the plant growth and quality of cut roses [3,21,22]. The climatic data collected in different European and Mediterranean countries (Figure S2) showed the northern geographical areas require a high amount of energy for heating. This energy request explains the cultivation areas distributed in different European countries (Figure 1). During the first days of the year in Tallin (Estonia), the cultivation of roses on average required 10 MJ m−2, with maximum requirements that can reach 20 MJ m−2 (Figure 1).
From May, day of the year (DOY) 161, to August (DOY 231), the environmental conditions are favorable for rose cultivation, demonstrating greenhouse climatization is not necessary. In winter, from DOY 231 to 365, the energy requirements progressively increased up to 10 MJ m−2. Similarly, the energy requirements ranged from 5 to 10 MJ m−2 during winter in Friheim (Norway), Wroclaw (Poland), Haarlem (The Netherlands), and Constanta (Romania), (Figure 2, Figure 3 and Figure S2). In these countries, the maximum energy requirement ranged between 15 and 20 MJ m−2. Moving towards southern countries, the energy requirements for the rose cultivation progressively declined. In Paimpol, France, the average energy required for heating was 5 MJ m−2. In Albenga, Italy, the requirements calculated were 3–4 MJ m−2 in the first days of the year (and November–December). These requirements were similar to those found in Antalya, Turkey, which energy requirements were comprised between 2 and 3 MJ m−2. In Sicily, South Italy, the values were comprised from 2 to 3 in January, February, and March, whereas from April to October the heating requirements were limited if not unnecessary. The lowest energy requirements were found in Vittoria (Sicily, Italy), Almeria (Spain), Maadi (Egypt), Sous-Massa (Morocco), in the 1–3 MJ m−2 range.

3.3. Highest Energy Requirements Recorded in Different Locations

The rose cultivation has a production cycle that normally lasts two years. Therefore, the best locations are those that do not show strong oscillation in energy need from one year. The increase of heating requirements can make rose production not sustainable with economic losses and higher environmental impact. Therefore, it is important to analyze the oscillations and the peaks of the highest energy needs. The analysis of climatic data and energy requirements calculated resulted that in Tallin the highest energy requirements were observed in 1994, 1996, and 2010 with a range of 2100–2300 MJ m−2 (Figure 2). The oscillations were comprised from 1800 to 2300 MJ m−2. In Friheim, the highest energy requirement was found in 2010, followed by 1996 and 1993. The amount of energy requested for the rose cultivation was comprised from 1400 to 2000 MJ m−2. In Wroclaw, Haarlem, and Constanta the highest energy needs were recorded in 1996, with values comprised from 1450 to 1800 MJ m−2. In these countries, the energy requirements never dropped below the 1000 MJ m−2 threshold. In Paimpol, the coldest years were 2010, 1991, and 2013. In these years, the energy needs were above 1000 MJ m−2, but did not overcome the 1100 MJ m−2. The energy requirements were below 1000 MJ m−2 in the Southern countries and in Albenga and Antalya the values were comprised between 290 and 700 MJ m−2 year−1. Vittoria and Almeria showed similar energy needs between 150 and 300 MJ m−2. In Maadi and Sous-Massa, values are below 100 MJ m−2 year−1 in recent years.

3.4. Comparison with Past Energy Requirements

Analyzing the whole period of available data (1973–2019), it is possible to highlight how the change of the European climate that occurred at the end of the 1980s [14] affected the heating requirements with a clear shift around 1990 (Figure 3). The lower temperatures of the previous climatic phase (here represented by the period 1973–1989) determined higher heating requirements. During the current climatic phase (1990–2019), the higher temperatures allow the cultivation in Northern countries, where in the past the costs of heating were high and not competitive with Southern regions.
The maps of Figure 3a,b show a gradient southwest–northeast of energy requirements. More specifically four large sub-areas can be identified, namely the central-southern Mediterranean (yearly requirements below 600 MJ m−2 year), the northern Mediterranean and the area influenced by the mitigating effect of the Atlantic ocean (600–1200 MJ m−2 year), the central-European area (above 1200–1800 MJ m−2 year) and the northern European one (above 1800 MJ m−2 year). The two maps reported in Figure 3 show the concomitant effects of the Mediterranean Sea (source of hot air in all seasons), Atlantic (source of oceanic mild air in all seasons), Arctic (source of cold air in all seasons), and Siberian area (source of continental air, very cold in winter) [23]. For example, the oceanic effect of the Atlantic Ocean deflects the isolines of 600, 1200, and 1800 northwards in the west part of the map, while the continental effect of Siberia deflects the islands themselves south in the east part of the map.
The diagram of Figure 3c shows then yearly heating requirements from 1973 to 2019 (average of the 56 sites). The black line shows the average 1973–1989 (944 MJ m−2) and the average 1990–2019 (861 MJ m−2). This latter is about 9% lower than that of the previous period.

3.5. Fuel Requirements for the Greenhouse Climatization

The amount of fuel consumption per year needed to maintain the optimal environmental conditions in the greenhouse had an oscillation trend during the 1990–2019 period in Sicily. Diesel fuel consumption was higher than methane. Diesel fuel consumption oscillated from 15 to 23 kg year−1, while the methane was between 13 and 20 kg year−1. The highest amount of fuel utilization was recorded in 2005 (Figure 4).
The fuel consumption followed the energy requirements observed in the colder months of the year. The higher fuel consumption calculated on a monthly basis for 2018 and 2019 showed that the higher energy requests were found in January, February, March, and December. The average from 1990 to 2019 was higher compared to the values of 2018 or 2019 in January and December. Considering the recent years, the gasoline consumption is comprised of 3–4 kg m−2 month−1, while the average of the period 1990–2019 the amount of gasoline has been 5 kg m−2 month−1 (Figure 5).
The cost of fuel consumption expressed as € m−2 declines during spring-summer and increases during autumn–winter. The cost of heating using diesel in coldest months ranged from 3 to 5.3 € m−2 and the price of cut rose flower per stem increased during winter. The price of cut rose per stem ranged from 0.41 to 0.70 €. The profit per square meter ranged from 3.28 to 5.60 € m−2 considering a flower production of 8 stems m−2. These results showed that during the coldest period the heating costs are almost equal to the profit of flower production (Figure 6).

4. Discussion

Rose cultivation is spread worldwide and the location of production depends on logistic aspects, labor cost, and energy requirements for heating the greenhouse during the winter. Energy requirements in greenhouses mainly depend on the cover materials and their thermal conductivity. In northern countries, insulant materials should be used, such as such as glass with low thermal conductivity coefficient, and in southern countries, plastic films with high thermal conductivity. This means that different cover materials have different energy consumption [24]. The energy losses must be compensated by heating systems, which can use diesel or methane as fuel. Each fuel has different energy content and the amount of energy released depends on the engine efficiency [25]. The economic sustainability of diesel or methane depends on their costs. Moreover, the effective energy released for heating depends on the power station efficiency that is different from those fueled with diesel or methane. The energy needs in winter are the most important cost that must be accurately estimated. The cost of heating of the greenhouse has been estimated using different mathematical models [14,26,27].
These models can be useful for rose production planning, and increase production when the market demand is high. The commercialization of this cut flower is constant all year round, but the highest prices are linked to special ‘fests’, such as Valentine’s Day, Mother’s Day, Christmas, and other special events [1]. Temperature is directly connected to physiological processes, such as respiration and photosynthesis, which are responsible for the plant growth rate and rose production [28]. Several mathematical models for rose production have been developed and calibrated, such as ROSGRO [29], ROSESIM [30], and other empirical models [6]. All these models have the aim to monitor and guide the plant growth, development, and flower production. Growers following the greenhouse environmental conditions can use specific models to adjust the production time. The energy model can be also used for estimating the heating costs and make the economic evaluation on crop production.
The simulation and calculation performed resulted when moving the cultivation from Southern to Northern countries the energy consumption for the greenhouse climatization strongly increased, reducing the production sustainability. The same trend has been observed for tomato cultivation in the Euro-Mediterranean areas [14].
It is important to consider that along with heating costs there are also labor costs that must be considered. In Dutch environmental conditions with advanced and technologically equipped greenhouses, the labor represents almost 50% of production costs [31]. In the low-technology greenhouses, the labor costs significantly increase, therefore it is important to reduce other costs such as heating requirements. These considerations explain the delocalization of roses to warmer countries such as Tanzania, Kenya, etc. [32]. In these countries, rose cultivation is carried out in low-cost greenhouses covered with plastic films that can be removed during summer to reduce the excessive temperature [33]. This procedure is commonly used in cheap greenhouses and plastic tunnels located in Mediterranean areas.
The reduction in heating costs due to climate change is at least partially offset by the increase in summer conditioning costs, which were not considered in our work. Similarly, lighting costs were not considered, which in the winter period see the most northerly areas of the territory under investigation more disadvantaged.

5. Conclusions

In conclusion, data obtained suggest that environmental control can strongly increase the energy requirements and hence the production costs. The analysis performed on energy consumption reveals methane is the more cost-effective fuel for the energy supply. However, the reduction of the production costs can be achieved by combining the cheapest fuel availability with high-efficiency power engines and location with mild climate. Therefore, the estimation of heating needs is crucial for the economic and environmental sustainability of rose greenhouse production.

Supplementary Materials

The following are available online at https://www.mdpi.com/2073-4395/10/3/422/s1, Figure S1: Characteristics of greenhouse located close to Vittoria (South-East of Sicily–Italy −36°55′19.2″ N, 14°32′56.7″ E) with a single module of 200 m × 35 m. The height is 6 m at the top and 4.3 m at the eaves. The greenhouses were covered with an 18-month polyethylene film with a thickness of 0.1 mm, Figure S2: Map with the geographic location of the analyzed sites (red circle).

Author Contributions

Conceptualization, G.C., L.M., and A.F.; methodology, G.C., L.M.; software, G.C., L.M.; validation, G.C., and L.M.; investigation, S.T. and D.R.; data curation, G.C., L.M.; writing—original draft preparation, G.C., L.M., A.F.; writing—review and editing, D.R. and S.T.; visualization, G.C.; All authors have read and agreed to the published version of the manuscript.

Acknowledgments

The authors would like to thank to Turtula & Co. farm for the information supplied.

Conflicts of Interest

The authors declare no conflict of interest.

References

  1. Yue, C.; Behe, B.K. Consumer Color Preferences for Single-stem Cut Flowers on Calendar Holidays and Noncalendar Occasions. HortScience 2010, 45, 78–82. [Google Scholar] [CrossRef] [Green Version]
  2. Nazari, F.; Khosh-Khui, M.; Salehi, H. Growth and flower quality of four Rosa hybrida L. cultivars in response to propagation by stenting or cutting in soilless culture. Sci. Hortic. 2009, 119, 302–305. [Google Scholar] [CrossRef]
  3. Shin, H.; Lieth, J.; Kim, S. Effects of temperature on leaf area and flower size in rose. Acta Hortic. 2001, 547, 185–191. [Google Scholar] [CrossRef]
  4. AIPH; Union Fleurs. International Statistics Flowers and Plants 2018; International Association of Horticultural Producers Horticulture House: Chilton, UK, 2018; Volume 66, p. 204. [Google Scholar]
  5. Lieth, J.; Pasian, C.C. A simulation model for the growth and development of flowering rose shoots. Sci. Hortic. 1991, 46, 109–128. [Google Scholar] [CrossRef]
  6. Kim, S.; Lieth, J.H. A Coupled Model of Photosynthesis, Stomatal Conductance and Transpiration for a Rose Leaf (Rosa hybrida L.). Ann. Bot. 2003, 91, 771–781. [Google Scholar] [CrossRef] [PubMed] [Green Version]
  7. Massa, D.; Mattson, N.S.; Lieth, H. An empirical model to simulate sodium absorption in roses growing in a hydroponic system. Sci. Hortic. 2008, 118, 228–235. [Google Scholar] [CrossRef]
  8. FAO Good Agricultural Practices for Greenhouse Vegetable Crops. FAO Plant Production and Protection Paper 217; Food and Agriculture Organization of the United Nations: Rome, Italy, 2013. [Google Scholar]
  9. Belwal, R.; Chala, M. Catalysts and barriers to cut flower export. Int. J. Emerg. Mark. 2008, 3, 216–235. [Google Scholar] [CrossRef]
  10. Steen, M. A world of Flowers: Dutch flower auctions and the market for cut flowers. J. Appl. Hortic. 2010, 12, 113–121. [Google Scholar]
  11. Franze, J.; Ciroth, A. A comparison of cut roses from Ecuador and the Netherlands. Int. J. Life Cycle Assess. 2011, 16, 366–379. [Google Scholar] [CrossRef]
  12. De Pascale, S.; Maggio, A. Sustainable protected cultivation at a mediterranean climate. Perspectives and challenges. Acta Hortic. 2005, 691, 29–42. [Google Scholar] [CrossRef] [Green Version]
  13. NOAA GSOD Dataset. Available online: http://www1.ncdc.noaa.gov/pub/data/gsod/ (accessed on 15 January 2020).
  14. Mariani, L.; Cola, G.; Bulgari, R.; Ferrante, A.; Martinetti, L. Space and time variability of heating requirements for greenhouse tomato production in the Euro-Mediterranean area. Sci. Total. Environ. 2016, 562, 834–844. [Google Scholar] [CrossRef] [PubMed]
  15. Reicosky, D.; Winkelman, L.; Baker, J.; Baker, D. Accuracy of hourly air temperatures calculated from daily minima and maxima. Agric. For. Meteorol. 1989, 46, 193–209. [Google Scholar] [CrossRef] [Green Version]
  16. Cola, G.; Failla, O.; Mariani, L. BerryTone—A simulation model for the daily course of grape berry temperature. Agric. For. Meteorol. 2009, 149, 1215–1228. [Google Scholar] [CrossRef]
  17. Allen, R.G.; Pereira, L.S.; Raes, D.; Smith, M. Crop Evapotranspiration—Guidelines for Computing Crop Water Requirements—FAO Irrigation and Drainage; FAO—Food and Agriculture Organization of the United Nations: Rome, Italy, 1998; Paper 56. [Google Scholar]
  18. Williams, W.A.; Loomis, R.S.; Carter, M.B. Computing Hourly Values of Diffuse and Direct Sunlight 1. Crop. Sci. 1974, 14, 492–493. [Google Scholar] [CrossRef]
  19. Arguez, A.; Vose, R.S. The Definition of the Standard WMO Climate Normal: The Key to Deriving Alternative Climate Normals. Bull. Am. Meteorol. Soc. 2011, 92, 699–704. [Google Scholar] [CrossRef]
  20. World Meteorological Organization (WMO). Guidelines on the Calculation of Climate Normals; WMO-No. 1203; WMO: Geneva, Switzerland, 2017; p. 18. Available online: https://library.wmo.int/doc_num.php?explnum_id=4166 (accessed on 15 January 2020).
  21. Dieleman, J.; Meinen, E.; Dueck, T. Effects of temperature integration on growth and development of roses. Acta Hortic. 2005, 691, 51–58. [Google Scholar] [CrossRef] [Green Version]
  22. Ushio, A.; Mae, T.; Makino, A. Effects of temperature on photosynthesis and plant growth in the assimilation shoots of a rose. Soil Sci. Plant Nutr. 2008, 54, 253–258. [Google Scholar] [CrossRef]
  23. Mc Intosh, D.H.; Thom, A.S. Essentials of Meteorology; Wikeham Publications: London, UK, 1972; p. 239. [Google Scholar]
  24. Papadopoulos, A.P.; Hao, X. Effects of three greenhouse cover materials on tomato growth, productivity, and energy use. Sci. Hortic. 1997, 70, 165–178. [Google Scholar] [CrossRef]
  25. Börjesson, P.; Mattiasson, B. Biogas as a resource-efficient vehicle fuel. Trends Biotechnol. 2008, 26, 7–13. [Google Scholar] [CrossRef]
  26. Kittas, C.; Karamanis, M.; Katsoulas, N. Air temperature regime in a forced ventilated greenhouse with rose crop. Energy Build. 2005, 37, 807–812. [Google Scholar] [CrossRef]
  27. Van Beveren, P.; Bontsema, J.; Van Straten, G.; Van Henten, E.J. Minimal heating and cooling in a modern rose greenhouse. Appl. Energy 2015, 137, 97–109. [Google Scholar] [CrossRef]
  28. Buwalda, F.; Rijsdijk, A.; Vogelezang, J.; Hattendorf, A.; Batta, L. An energy efficient heating strategy for cut rose production based on crop tolerance to temperature fluctuations. Acta Hortic. 1999, 507, 117–126. [Google Scholar] [CrossRef]
  29. Dayan, E.; Presnov, E.; Fuchs, M. Prediction and calculation of morphological characteristics and distribution of assimilates in the ROSGRO model. Math. Comput. Simul. 2004, 65, 101–116. [Google Scholar] [CrossRef]
  30. Hopper, D.A.; Hammer, P.A.; Wilson, J.R. A Simulation Model of Rosa hybrida Growth Response to Constant Irradiance and Day and Night Temperatures. J. Am. Soc. Hortic. Sci. 1994, 119, 903–914. [Google Scholar] [CrossRef] [Green Version]
  31. Berg, G.V.D. Rose factories, fiction or future? Acta Hortic. 1996, 424, 405–412. [Google Scholar] [CrossRef]
  32. Msogoya, T.; Maerere, A. The Flower Industry in Tanzania: Production Performance and Costs. J. Agron. 2006, 5, 478–481. [Google Scholar]
  33. Zhou, J.-B.; Chen, Z.-J.; Liu, X.-J.A.; Zhai, B.-N.; Powlson, D.S. Nitrate accumulation in soil profiles under seasonally open ‘sunlight greenhouses’ in northwest China and potential for leaching loss during summer fallow. Soil Use Manag. 2010, 26, 332–339. [Google Scholar] [CrossRef]
Figure 1. The energy requirements for growing rose plants for cut rose flowers in protected cultivation with the temperature set at the optimal range for this floriculture crop in different Euro-Mediterranean countries. Values reported are minimum, maximum, average ± 1 SD.
Agronomy 10 00422 g001
Figure 2. The cumulative energy requirements for growing rose plants for cut rose flowers in protected cultivation with the temperature set at the optimal range for this floriculture crop in different European countries. The years with the three highest levels of consumption are colored red, orange, and yellow for the 1st, 2nd and 3rd position respectively from 1990 to 2019. In order to make the interannual variability clear for each site, the range of y axis changes for each line of the figure, according to the average level of energy requirement of the site.
Agronomy 10 00422 g002
Figure 3. (a) Average yearly heating requirements for the period 1973–1989, (b) average yearly heating requirements for the period 1990–2019, (c) yearly requirements from 1973 to 2019 (average of the 56 sites).
Agronomy 10 00422 g003
Figure 4. Diesel fuel and methane consumption for heating a greenhouse with rose cultivation. Data are expressed per year.
Agronomy 10 00422 g004
Figure 5. Fuel consumption on month basis of 2018, 2019, and the average from 1990 to 2019.
Agronomy 10 00422 g005
Figure 6. Fuel consumption (blue line) and flower profit (orange line) on a month basis of 2018 and 2019 calculated in a farm located in Sicily Region (Italy).
Agronomy 10 00422 g006
Table 1. Cultivated areas (ha) of cut roses in different Mediterranean and European countries 1.
CountriesAreas (ha)Year
TotalIn the OpenUnder Protection
Belgium10 102012
Finland4.5 4.52012
Germany323224992017
Greece90 1995
Hungary25 2006
Israel214 2004
Italy1221 2005
Morocco827392007–2008
Netherland300 3002018
Poland185 1852016
Spain127121152016
Turkey210 2102017
TOTAL2791.5309932.5
1 Source: International Statistics flower and plants [4].
Table 2. Monthly consumption of methane [m3] in 2018–2019 season.
MonthMethane [m3]Energy [MJ m−2]% of Total
November438021.54.96
December15,52072.917.57
January40,383193.145.71
February16,84380.619.06
March11,22953.712.71

