Article

Effects of Cover Whitening Concentrations on the Microclimate and on the Development and Yield of Tomato (Lycopersicon esculentum Mill.) Inside Mediterranean Greenhouses

by
María de los Ángeles Moreno-Teruel
,
Diego Valera
*,
Francisco Domingo Molina-Aiz
,
Alejandro López-Martínez
,
Araceli Peña
,
Patricia Marín
and
Audberto Reyes-Rosas
Research Centre CIAIMBITAL, University of Almería, Ctra. de Sacramento s/n, 04120 Almería, Spain
*
Author to whom correspondence should be addressed.
Agronomy 2020, 10(2), 237; https://doi.org/10.3390/agronomy10020237
Submission received: 2 January 2020 / Revised: 18 January 2020 / Accepted: 28 January 2020 / Published: 5 February 2020
(This article belongs to the Special Issue Greenhouse Technology)

Abstract

:
This work analyzes the influence of whitening a greenhouse roof on the microclimate and yield of a tomato crop. In the west sectors of two multi-span greenhouses, a whitening concentration of 0.250 kg L−1 was used as a control. In an autumn–winter cycle, a lower (0.125 kg L−1) and an increased (0.500 kg L−1) concentration were used in the east sectors of greenhouses 1 and 2. In a spring–summer cycle, the whitening concentrations in the east were varied depending on outside temperature. The effect of whitening on photosynthetic activity, production, plants’ morphological parameters, and the quality of the fruits were also analyzed. To evaluate the effect on microclimate, solar and photosynthetically active (PAR) radiations, air and soil temperatures, and heat flux in the soil were measured in greenhouse 1. Results show that excessive whitening leads to reductions of inside PAR radiation that decreases photosynthesis and crop yield. A whitening concentration of 0.500 kg L−1 is proposed at the beginning of the autumn–winter crop cycle, washing the cover when inside temperature drops to 35 °C. At the end of the spring–summer cycle, a concentration of 0.125 kg L−1 is recommended when inside temperature increases to 35 °C.

1. Introduction

Almería is one of the main areas of horticultural production under greenhouses worldwide, with an area of 31,614 ha [1], which has increased by about 1500 ha in the last 2 years. The growth in greenhouse area in recent years is probably the main mitigating factor of climate change in the province, due to an increase in the albedo of highly reflective plastic covers [2]. The horticultural sector is facing a difficult economic situation in recent years, in which stability in the sales prices of products in the face of the gradual rise in production costs of greenhouse crops puts at risk the economic profitability of most farms. Thus, in the greenhouses of Almería, the net profit of exploitation (considering variable costs, fixed costs, depreciation, and investment costs) became negative for most crops in the last seasons from 2015 to 2017 [3,4].
The future of Almería’s greenhouses is about addressing the great challenges of global agriculture and the loss of profitability of the sector at the local level. For this purpose, various tools are available, such as optimization of photosynthesis [5]. A better light interception of the structures (higher roof slope) and the use of photo-selective and diffuse plastics can increase inside radiation. The optimization of the geometry of the crop rows could allow higher values of leaf area index and better distribution of the leaves vertically. Photosynthetic performance in greenhouse intensive production can be limited due to reduced distribution of the intercepted solar light along the canopy profile, which can reach levels of about 35% [6,7].
If all factors to improve the efficiency of radiation use and the efficiency of crop light interception were optimized simultaneously, crop productivity could be improved by 36%–64% [8]. Leaf photosynthetic rate is determined by the amount of photosynthetic protein per leaf area and CO2 conductance in stomata [9]. In addition, a rise in the cover transmissivity allows not only to increase photosynthesis and production, but also to reduce the energy input in cold periods [10]. Under normal CO2 concentrations and with adequate temperature conditions, photosynthetic activity is mainly affected by light intensity [11].
Insufficient radiation levels produce significant abiotic stress that limits plant growth and crop yields in intensive greenhouse production [12]. With little incident light, the leaves of the plant canopy exhibit an extremely low net photosynthetic rate and premature senescence [13,14,15], which produces reduction in plant growth and yield [15,16]. Generally, a cumulative daily light decrease of 1% leads to a yield loss of 0.8%–1% for most greenhouse crops [17,18].
Thus, the average level of tomato production in long cycles in greenhouses of Almería using whitening of the cover is 16.8 kg m−2, although farmers with better yields reach 20.9 kg m−2, both in multi-span-type greenhouses with heating by hot air generators, and in Almería-type greenhouses without heating [19]. These production levels are well below the yields of 49–55 kg m−2 for tomato obtained in greenhouses with hi-tech climate control systems in Northern Europe or America [20,21], or even from the values that are obtained in greenhouses of China of 20–35 kg m−2 [22] or Japan of 36–40 kg m−2, when an integrative climate control system is used [9,23]. However, these production systems generate a much higher environmental impact with global energy requirements in the order of 50–80 MJ kg−1, far larger than those generated in the Spanish unheated plastic greenhouses of 5 MJ kg−1 [24].
On the other hand, adverse temperatures and excessive radiation can produce a persistent decrease in the efficiency of solar energy conversion into photosynthesis, referred to as photoinhibition [25,26,27,28]. Photosynthesis limits growth at warm temperatures and decreases with temperature. Photoinhibition of tomato can occur at 30–40 °C and high levels of radiation (1500–1800 µmol m−2 s−1) [29,30,31]. Furthermore, inside the greenhouses, there are stressful thermal regimes and atmospheres of high evaporative demand, which negatively affect crop growth and reduce the quantity and quality of the harvests [32]. Blossom-end rot (BER) in tomato has been generally reported as a calcium-related physiological disorder influenced by cultivar and environmental factors [33,34,35]. Temperature is the major climatic factor inducing blossom-end rot (BER) that impacts on fruit enlargement [33]. The cause of BER is usually an interaction between daily irradiance, air temperature, and water availability, affecting calcium uptake and distribution within the whole plant [34,36]. Shade can be used to reduce BER, as well as other physiological disorders in tomato fruit, as sun burn or sun scald [37,38] caused by temperatures exceeding 40 °C [36]. Thus, the use of 50% shade net reduces the number and weight of unmarketable tomato fruit [31].
Achieving an adequate environment in greenhouses in warm and sunny regions has become a major challenge, due to the large amount of solar radiation transmitted to the greenhouse, and then converted into sensible and latent heat [2]. Multiple cooling strategies are used in greenhouses to provide a suitable environment for plant growth and to increase crop productivity, such as: (1) Evaporative cooling systems, (2) forced ventilation systems, and (3) shading methods, such as the application of whitening or the use of mobile shading screens [32,39].
Shading is an effective method to attain a suitable microclimate inside greenhouses for plant development and to improve quantity and quality crop yield in hot and sunny regions [40]. Whitening is a low-cost method to reduce heat build-up and modify the greenhouse environment in hot summers [32,41]. This shading method is performed by mixing a certain amount of calcium oxide or calcium carbonate with water, to make a solution which is used to paint the outer surface of the glass or polyethylene [19,42,43]. Most farmers in Almería (99%) whiten the roof of their greenhouses to increase the reflection coefficient of solar radiation, which reduces the energy input that warms the greenhouse in the peak hours of the day [19]. Whitening is only needless in greenhouses equipped with mobile shading systems (as internal black-shading net and aluminized screens) or evaporative cooling systems. In the greenhouses of the Mediterranean basin, it is a technique widely used, with natural ventilation [44,45]. Cover whitening does not interfere with the greenhouse ventilation, representing an important advantage with respect to the other shading systems that affect negatively the performance of the roof ventilation [46].
The most commonly used product is micronized calcium carbonate (“Blanco de España”). The dose used varies greatly. Depending of the region and the transmissivity of the plastic cover, shading intensity of the whitening can be regulated, changing the concentration of calcium carbonate between 0.34 and 0.46 kg L−1 [19]. However, calcium carbonate shading is irregular, and product loss can occur with rain (washing) [32,39]. Meca et al. [47] compared the whitening of the cover (with a concentration of 0.25 kg L−1 of ASP “Blanco España”) with the use of a low-pressure fog system and aluminized screens, obtaining greater yield of a pepper crop with the whitening of the cover. Fog system without shading reduced pepper production was 8.4%.
Excessive shading can significantly reduce the solar radiation intercepted by the crop canopy, thereby negatively affecting plant growth [17,32]. Crop production depends on the quantity of photosynthetically active radiation (PAR) absorbed by the crop [48], and levels of shading greater than 40% can reduce tomato yield [49]. However, the reduction of solar radiation by shading can produce positive effects, such as a diminution of the air temperature and the water consumption by irrigation [40,50]. Thus, the use of mobile shading can improve water use efficiency, reducing crop transpiration [32,51]. Close attention should be paid to the date of application, duration, and dose, with the aim of not drastically reducing physiological flows in the lower strata of the plant canopy [52]. Furthermore, the permanent nature of the system hinders the regulation of the intensity of the radiative field after its application, in favor of the crop, which, on certain occasions, has a negative effect on the potential yield of the crops [47]. On the other hand, this method ensures that greenhouses are passively cooled in an environmentally friendly manner, without any energy cost. With other methods, energy-intensive uses are required to maintain ideal growing conditions [53].
The objective of this work is to investigate the effects of different doses of whitening on the production of tomato crops, through analysis of the microclimate inside the greenhouse, photosynthetic activity, plant morphology, and fruit quality in two consecutive crop cycles.

2. Materials and Methods

2.1. Characteristics of the Experimental Greenhouses

This research was carried out in two multi-span Mediterranean greenhouses, located in the Experimental Station UAL-ANECOOP “Catedrático Eduardo Fernandez” of the University of Almería (36°51′ N, 2°16′ W, and 87 MASL). The greenhouses are divided transversely by a polyethylene wall, constituting two isolated sectors with similar characteristics (Table 1).
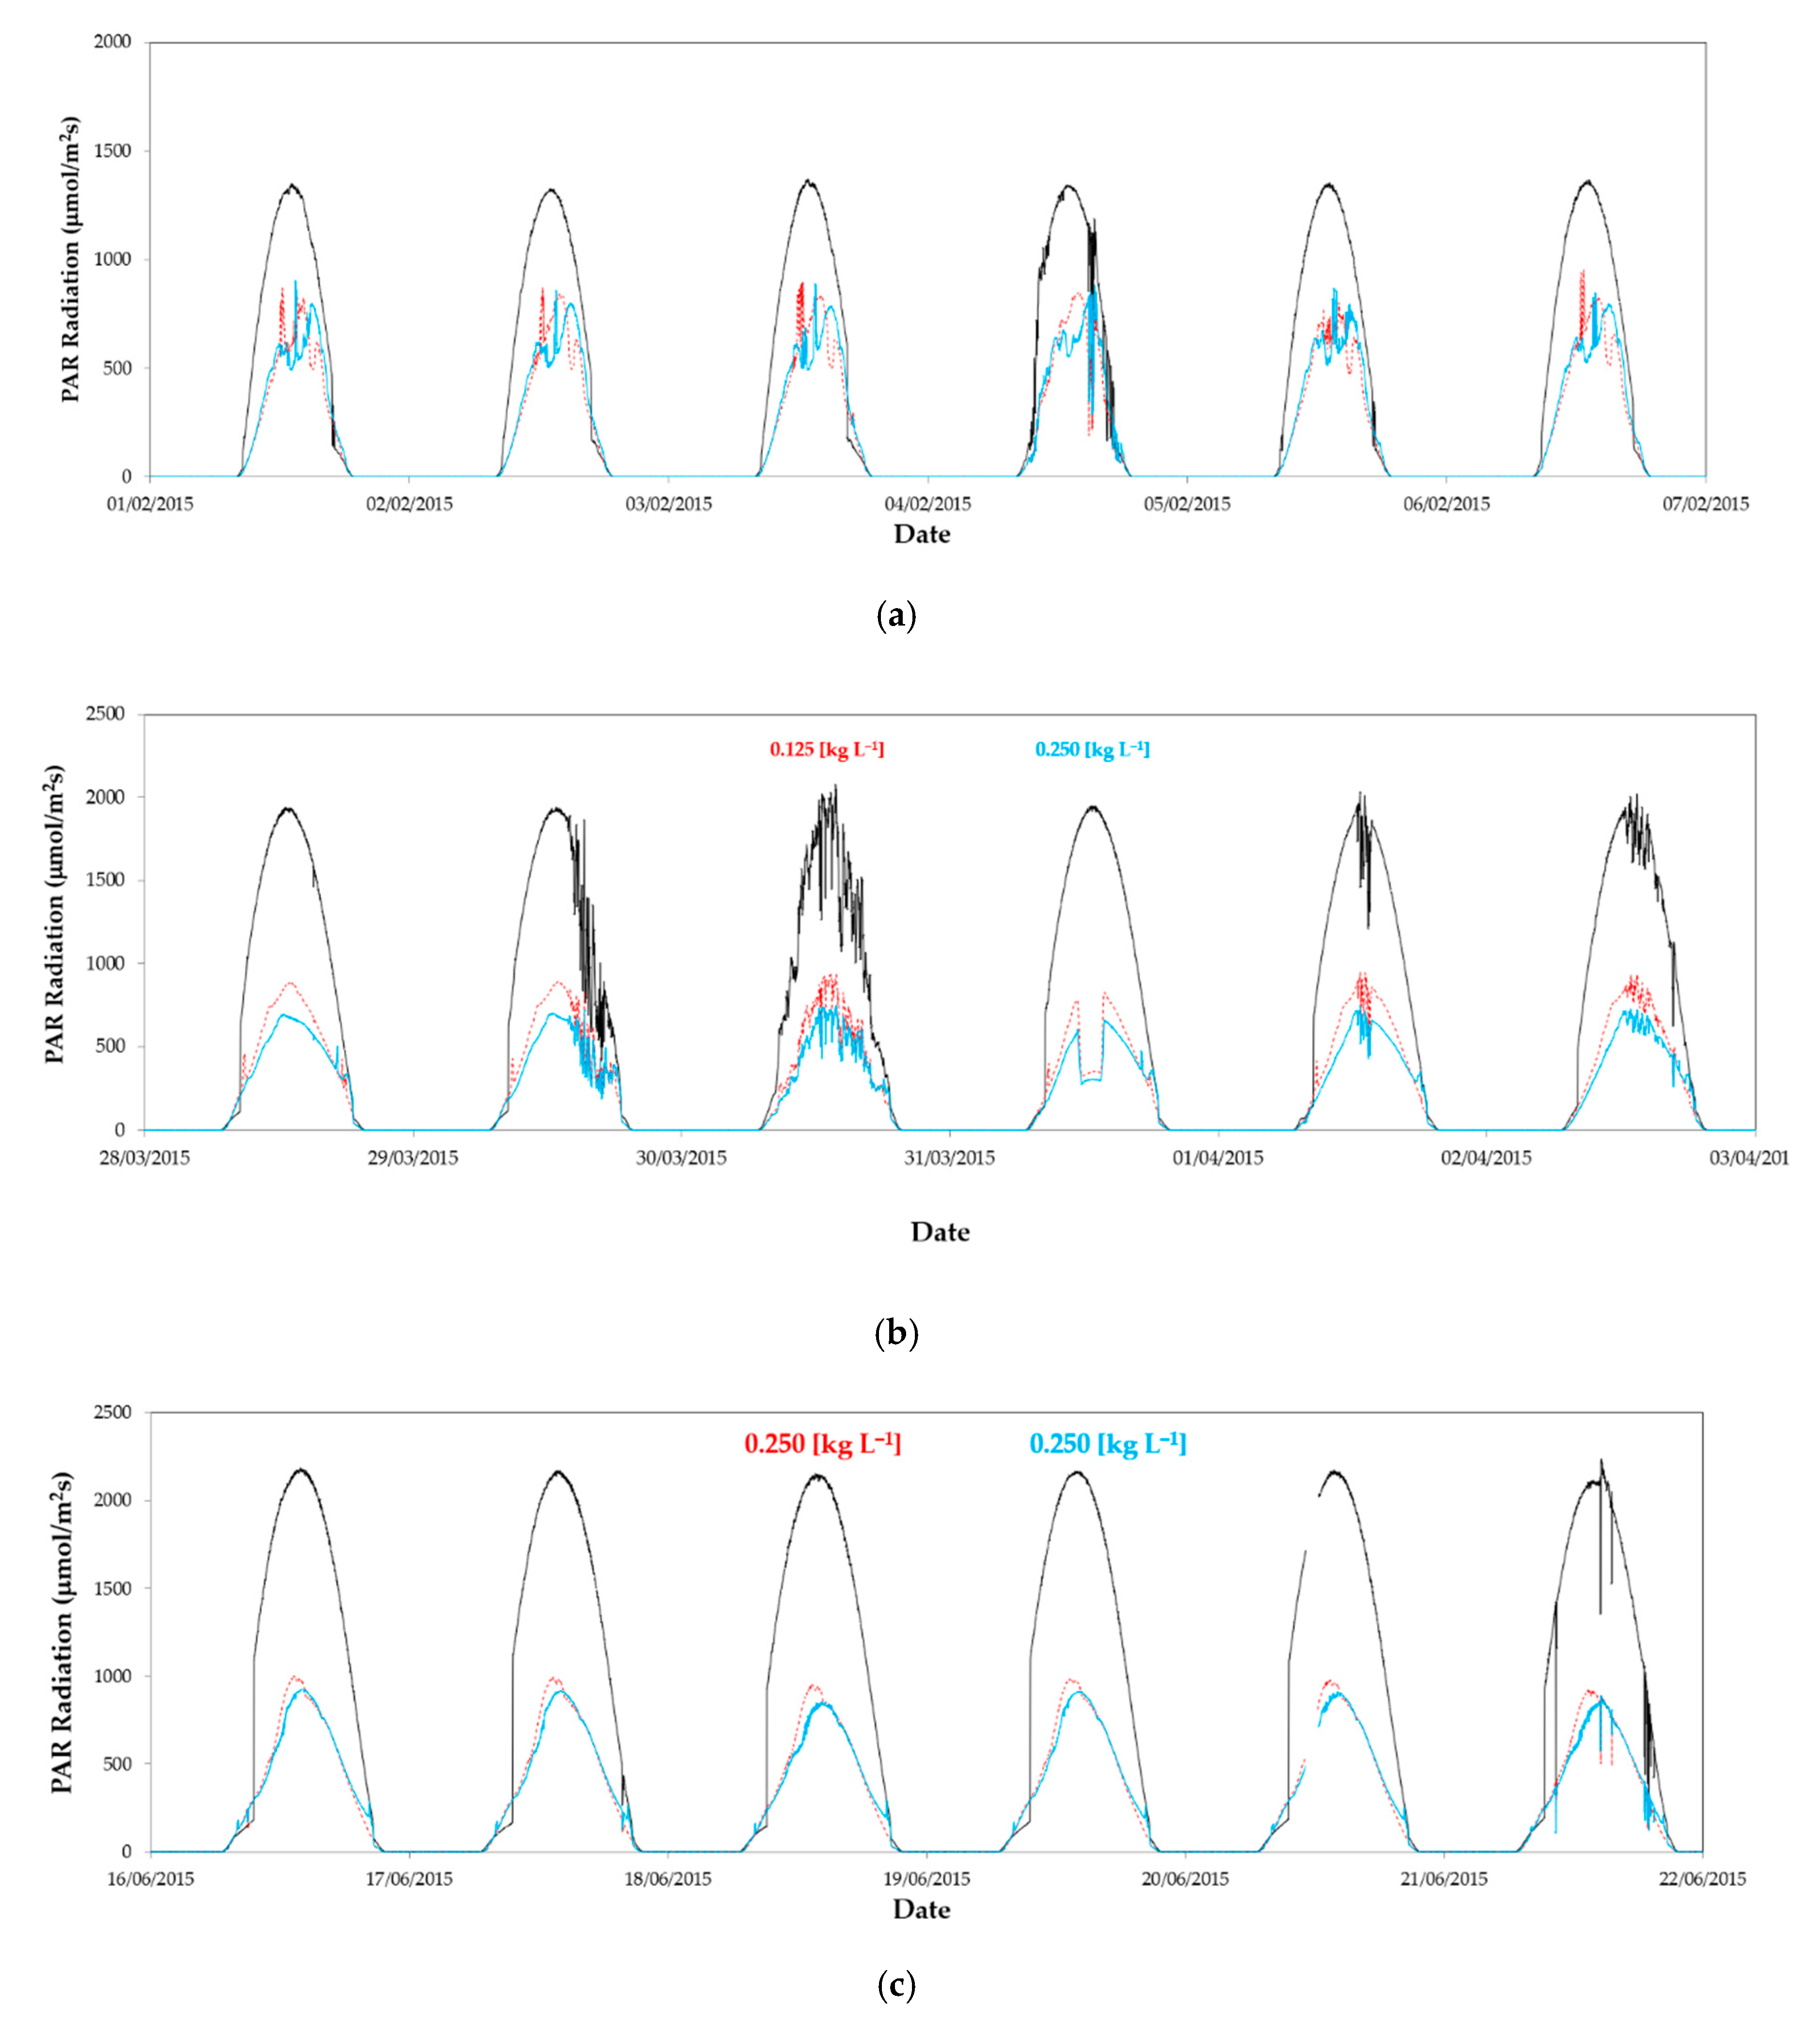
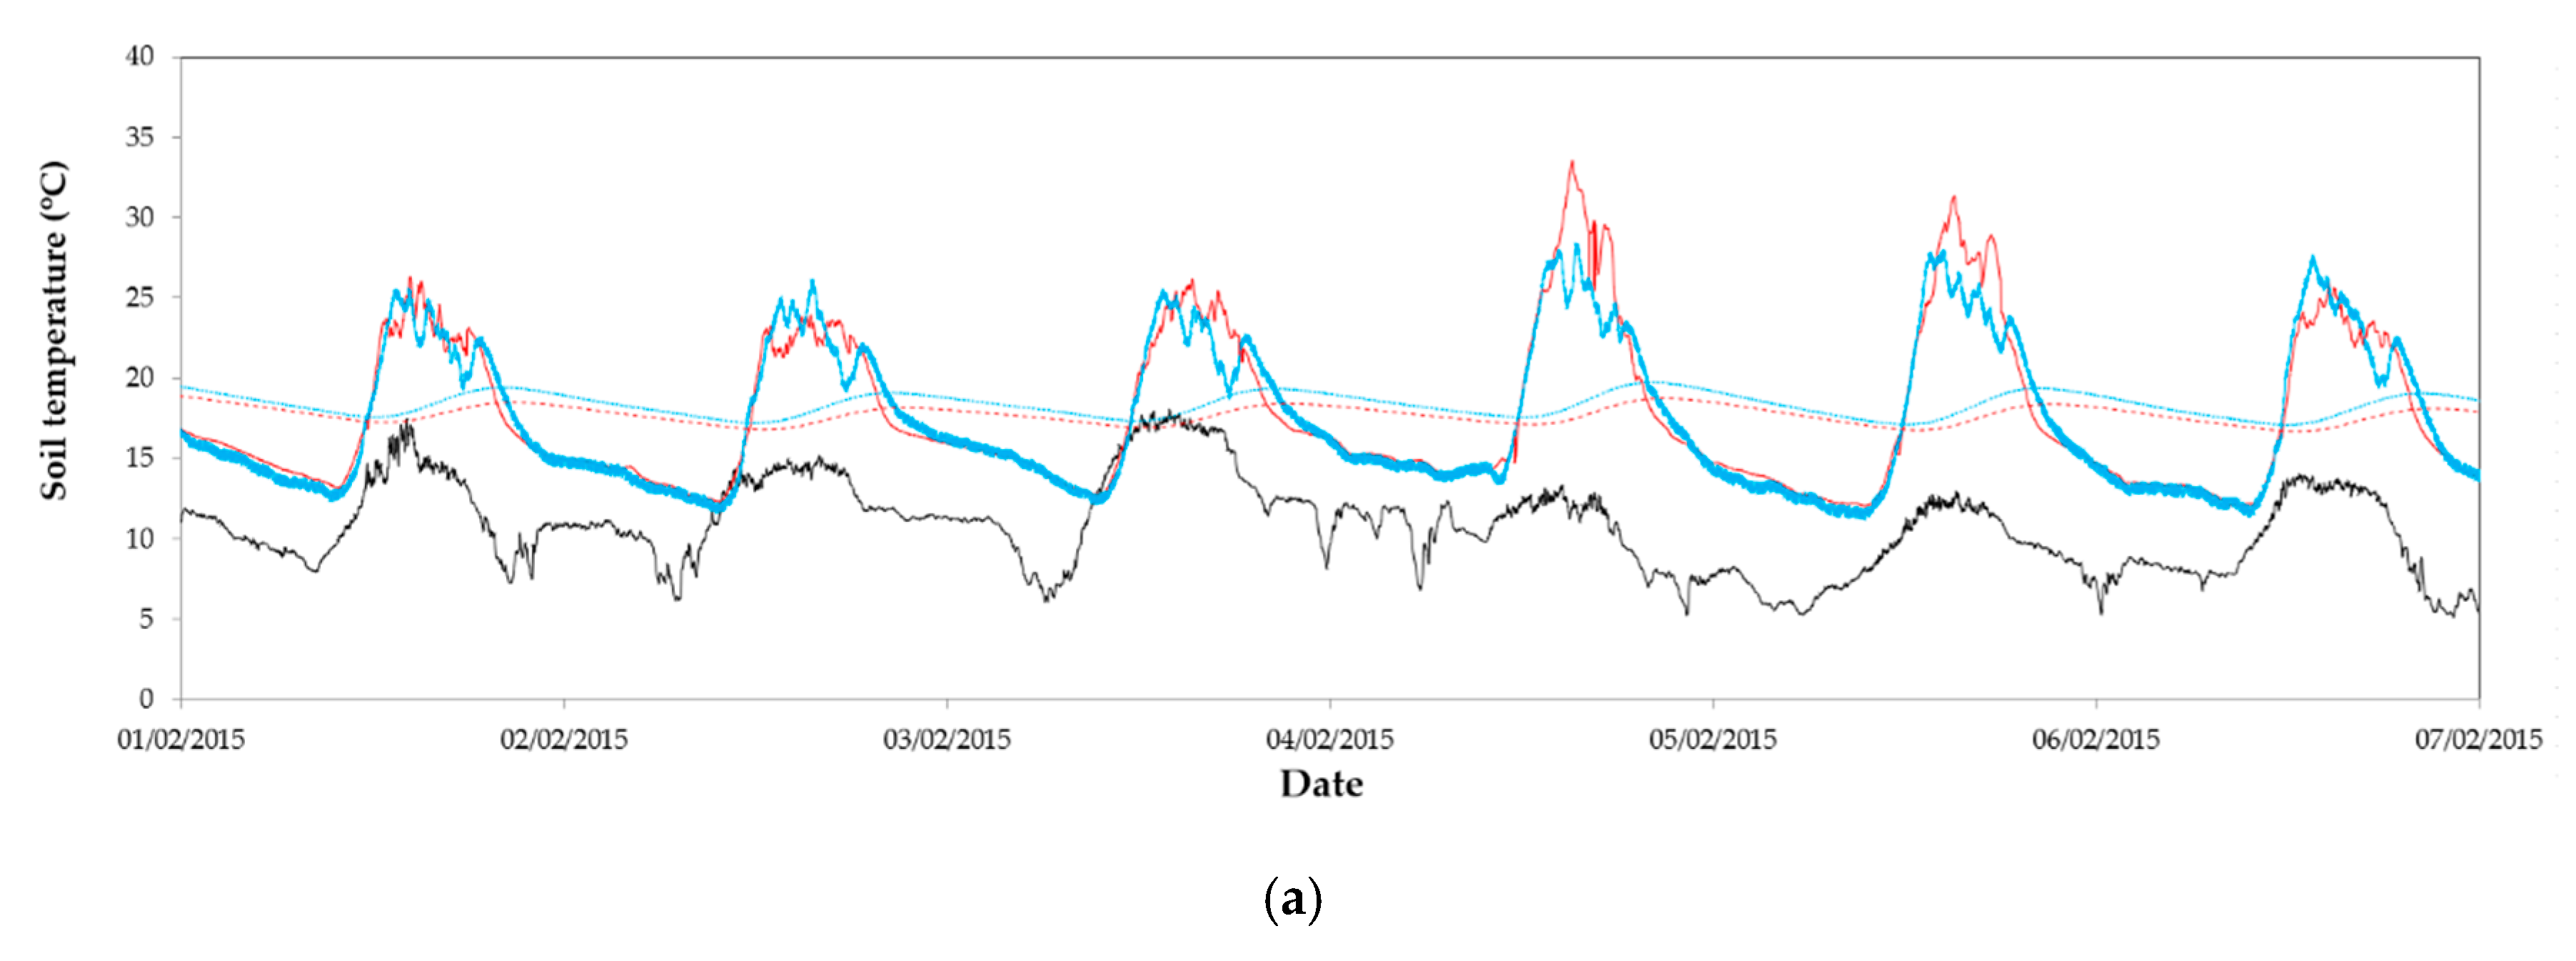
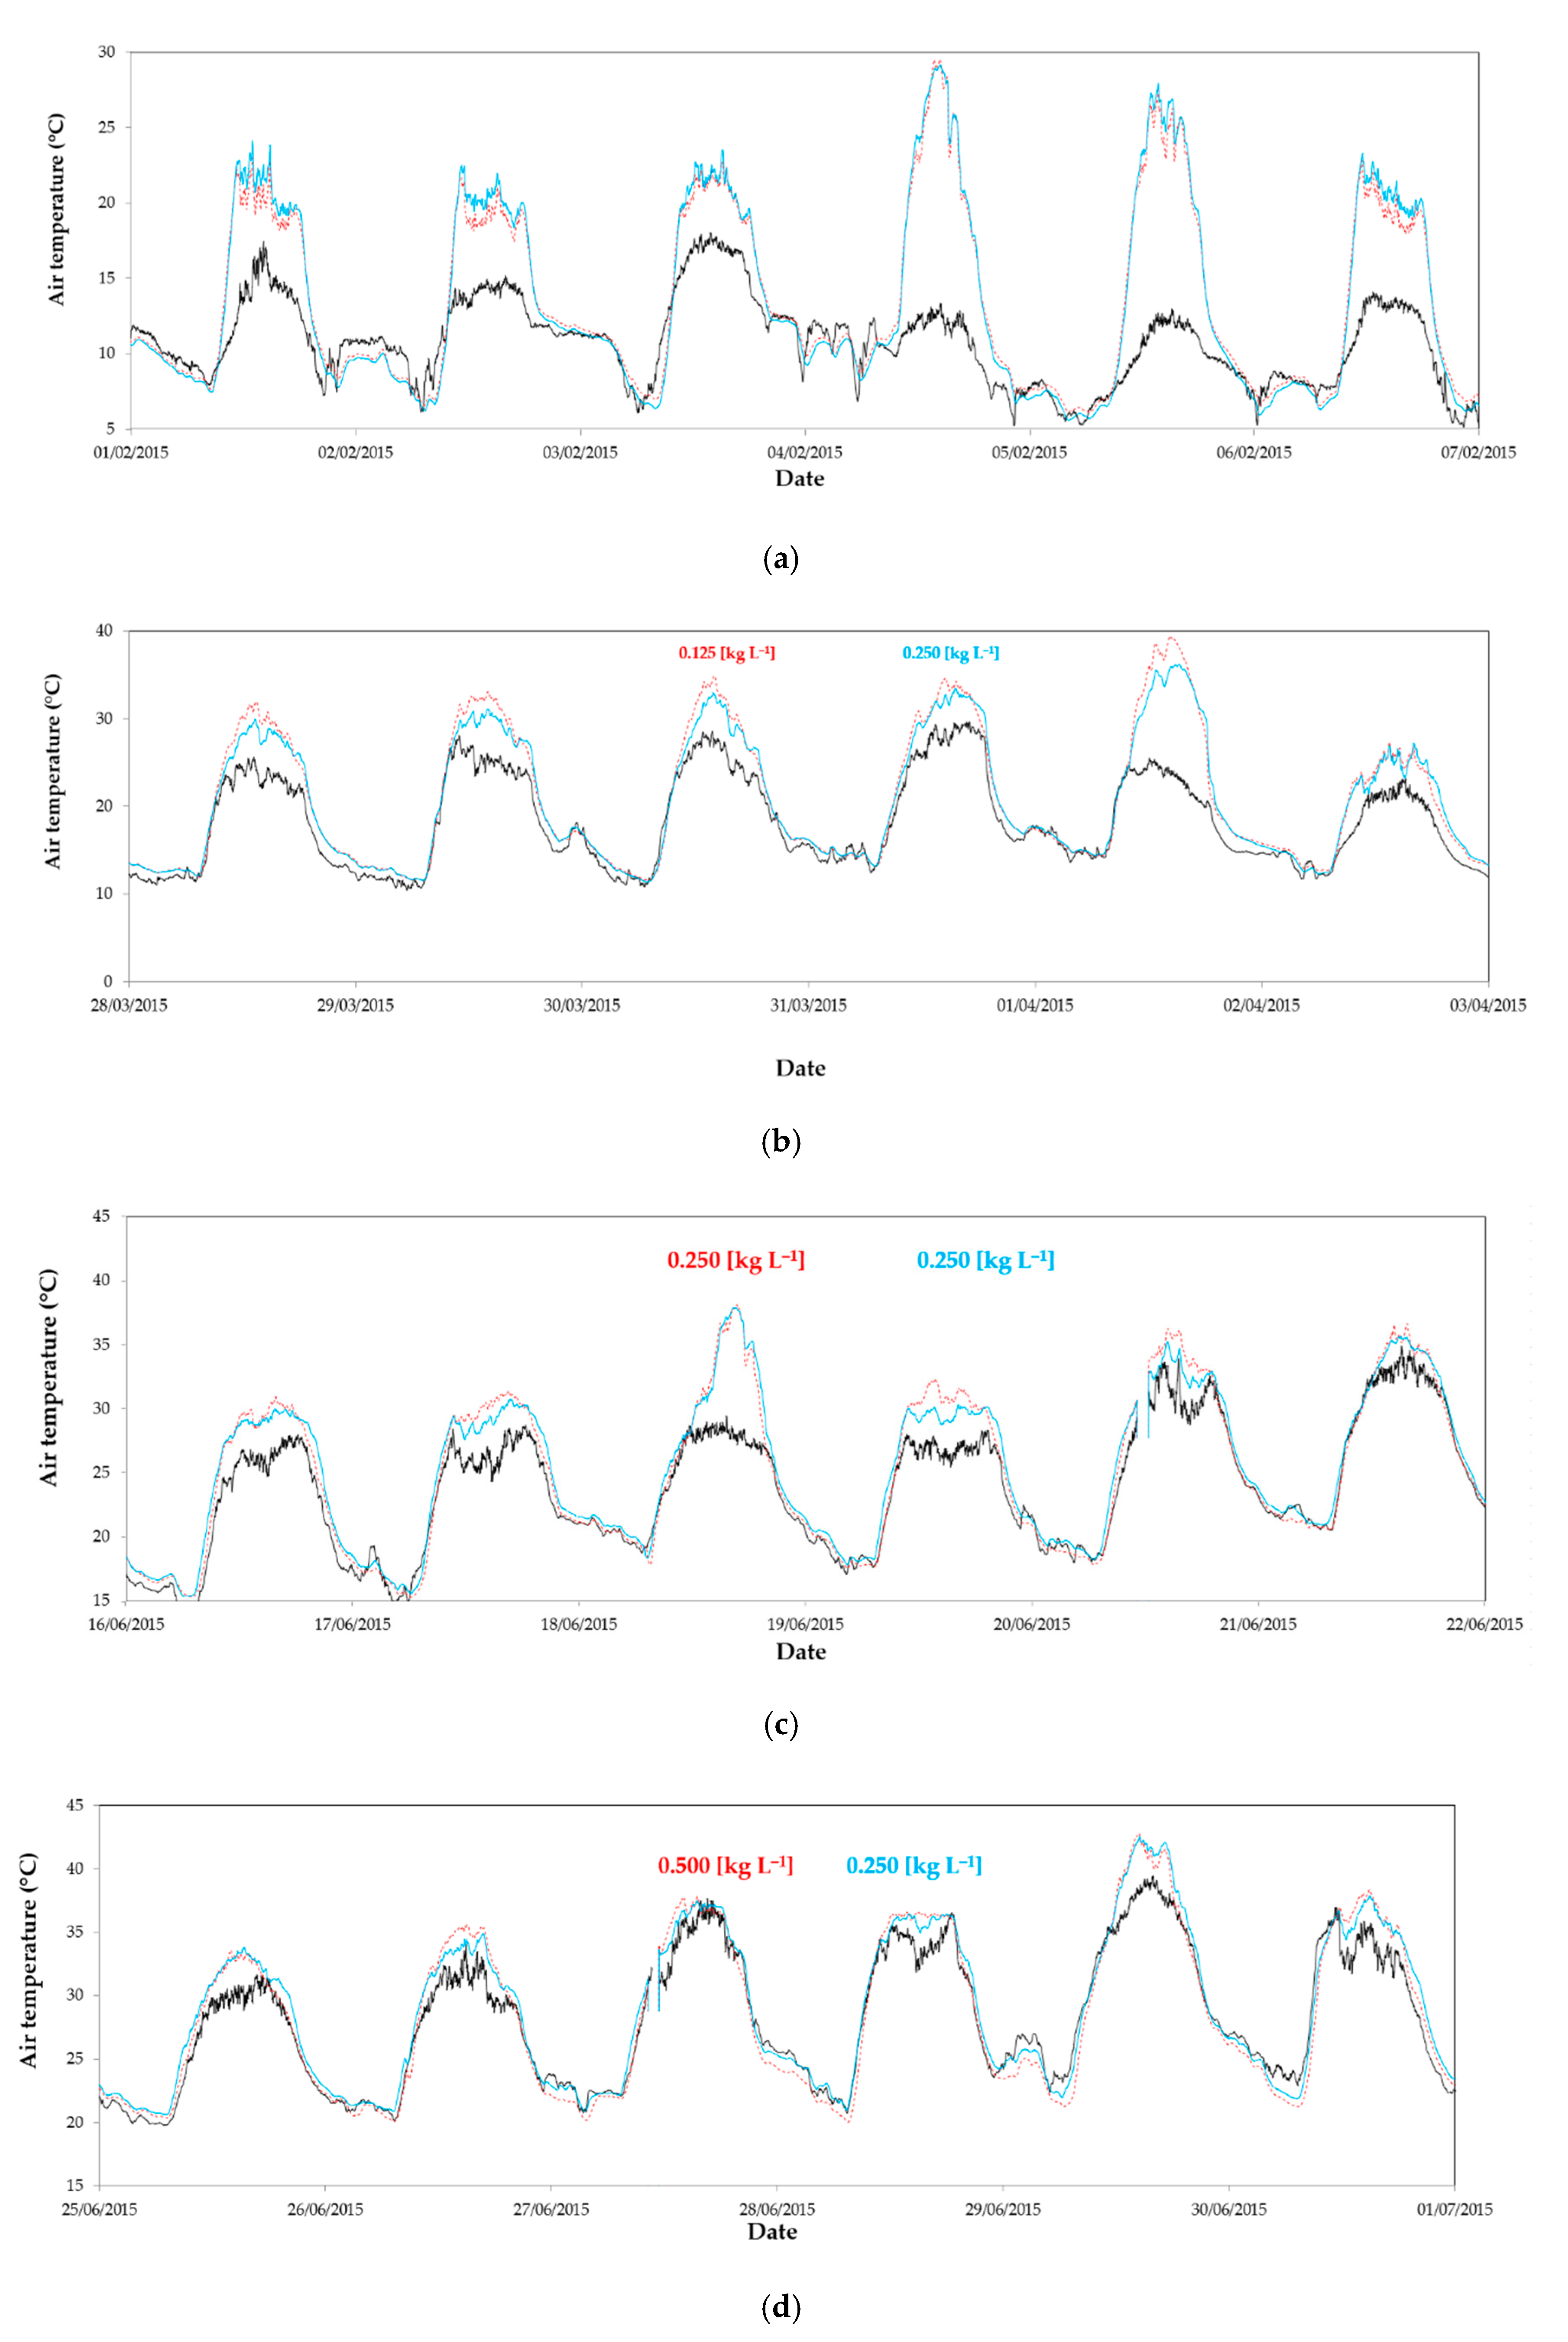
The opening and closing of the windows were managed by an environmental controller MultiMa Series II (Hortimax SL, Almería, Spain), depending on the climatic conditions. Greenhouse windows were opened at temperatures of 20 °C and closed at a wind speed of more than 8 m s−1. Outside, solar radiation, temperature and relative air humidity, and wind speed and direction were measured at 10 m height with a meteorological station. Inside both greenhouses, temperature and relative air humidity were measured at a height of 2 m. Both the external and internal microclimate variables were recorded at a frequency of 1 Hz.
Additionally, the 10/12/2014 set of climate sensors was installed outside and inside sectors east and west of greenhouse 1. Temperature Ti and relative air humidity RHi were measured at 1 m and 2 m height. Solar RS and photosynthetically active RPAR radiations were measured inside and outside greenhouse 1. Soil surface temperature Ts0 was measured beneath a polypropylene mulch covering the ground and soil temperature was measured at a depth of 0.3 m. The heat flux by conduction toward the ground qs was measured using a soil heat flux plate placed at a depth of 0.2 m. A detailed description of all sensors used to measure microclimatic parameters is available in a previous work analyzing thermal exchanges in experimental greenhouse 1 [54].

2.2. Crop System and Experimental Design

The research was carried out in two consecutive crop cycles of tomatoes (Lycopersicon esculentum Mill.). First, an autumn–winter tomato cycle was conducted with the commercial variety Racymo from 19 August 2014 to 09 January 2015. A second crop in the spring–summer cycle was developed with the commercial variety Bermello (from 17 February 2015 to 2 July 2015). In both cases, the transplant was carried out 40 days after sowing, in handmade sacks of coconut fiber with a plantation density of 1 plant m−2.
During this study, the effect of an agricultural solar protector (ASP) applied at different concentrations (Table 1) was evaluated. We used three concentrations recommended by the manufacturing companies of ASP [55], which were selected based on the range of whitening concentrations used by the growers of Almería [19]. A concentration of 0.250 kg L−1, mainly used by growers of Almería [19], was used as control in the west sectors of both greenhouses. The option of un-whitened cover was not considered because 100% of commercial greenhouses naturally ventilated in Almería use whitening [19]. Furthermore, an un-whitened greenhouse at the beginning of the crop cycle could risk the viability of the tomato crop as a consequence of plant photoinhibition [29,30,31] or physiological disorders [34,35,36,37,38] produced by excessive radiation and extreme temperatures. Application of the different doses consisted of increasing the concentration of the mass of CaCO3 (kg) diluted in a volume of water (L). The method of application was the one used by the companies in the sector. The CaCO3 solution was applied with a spray nozzle while the operator moved over the surface of the greenhouse roof. Therefore, the homogeneity of the application can vary, as it is manual work and dependent on wind conditions. To determine the relationship between the concentration of dilution (kg L
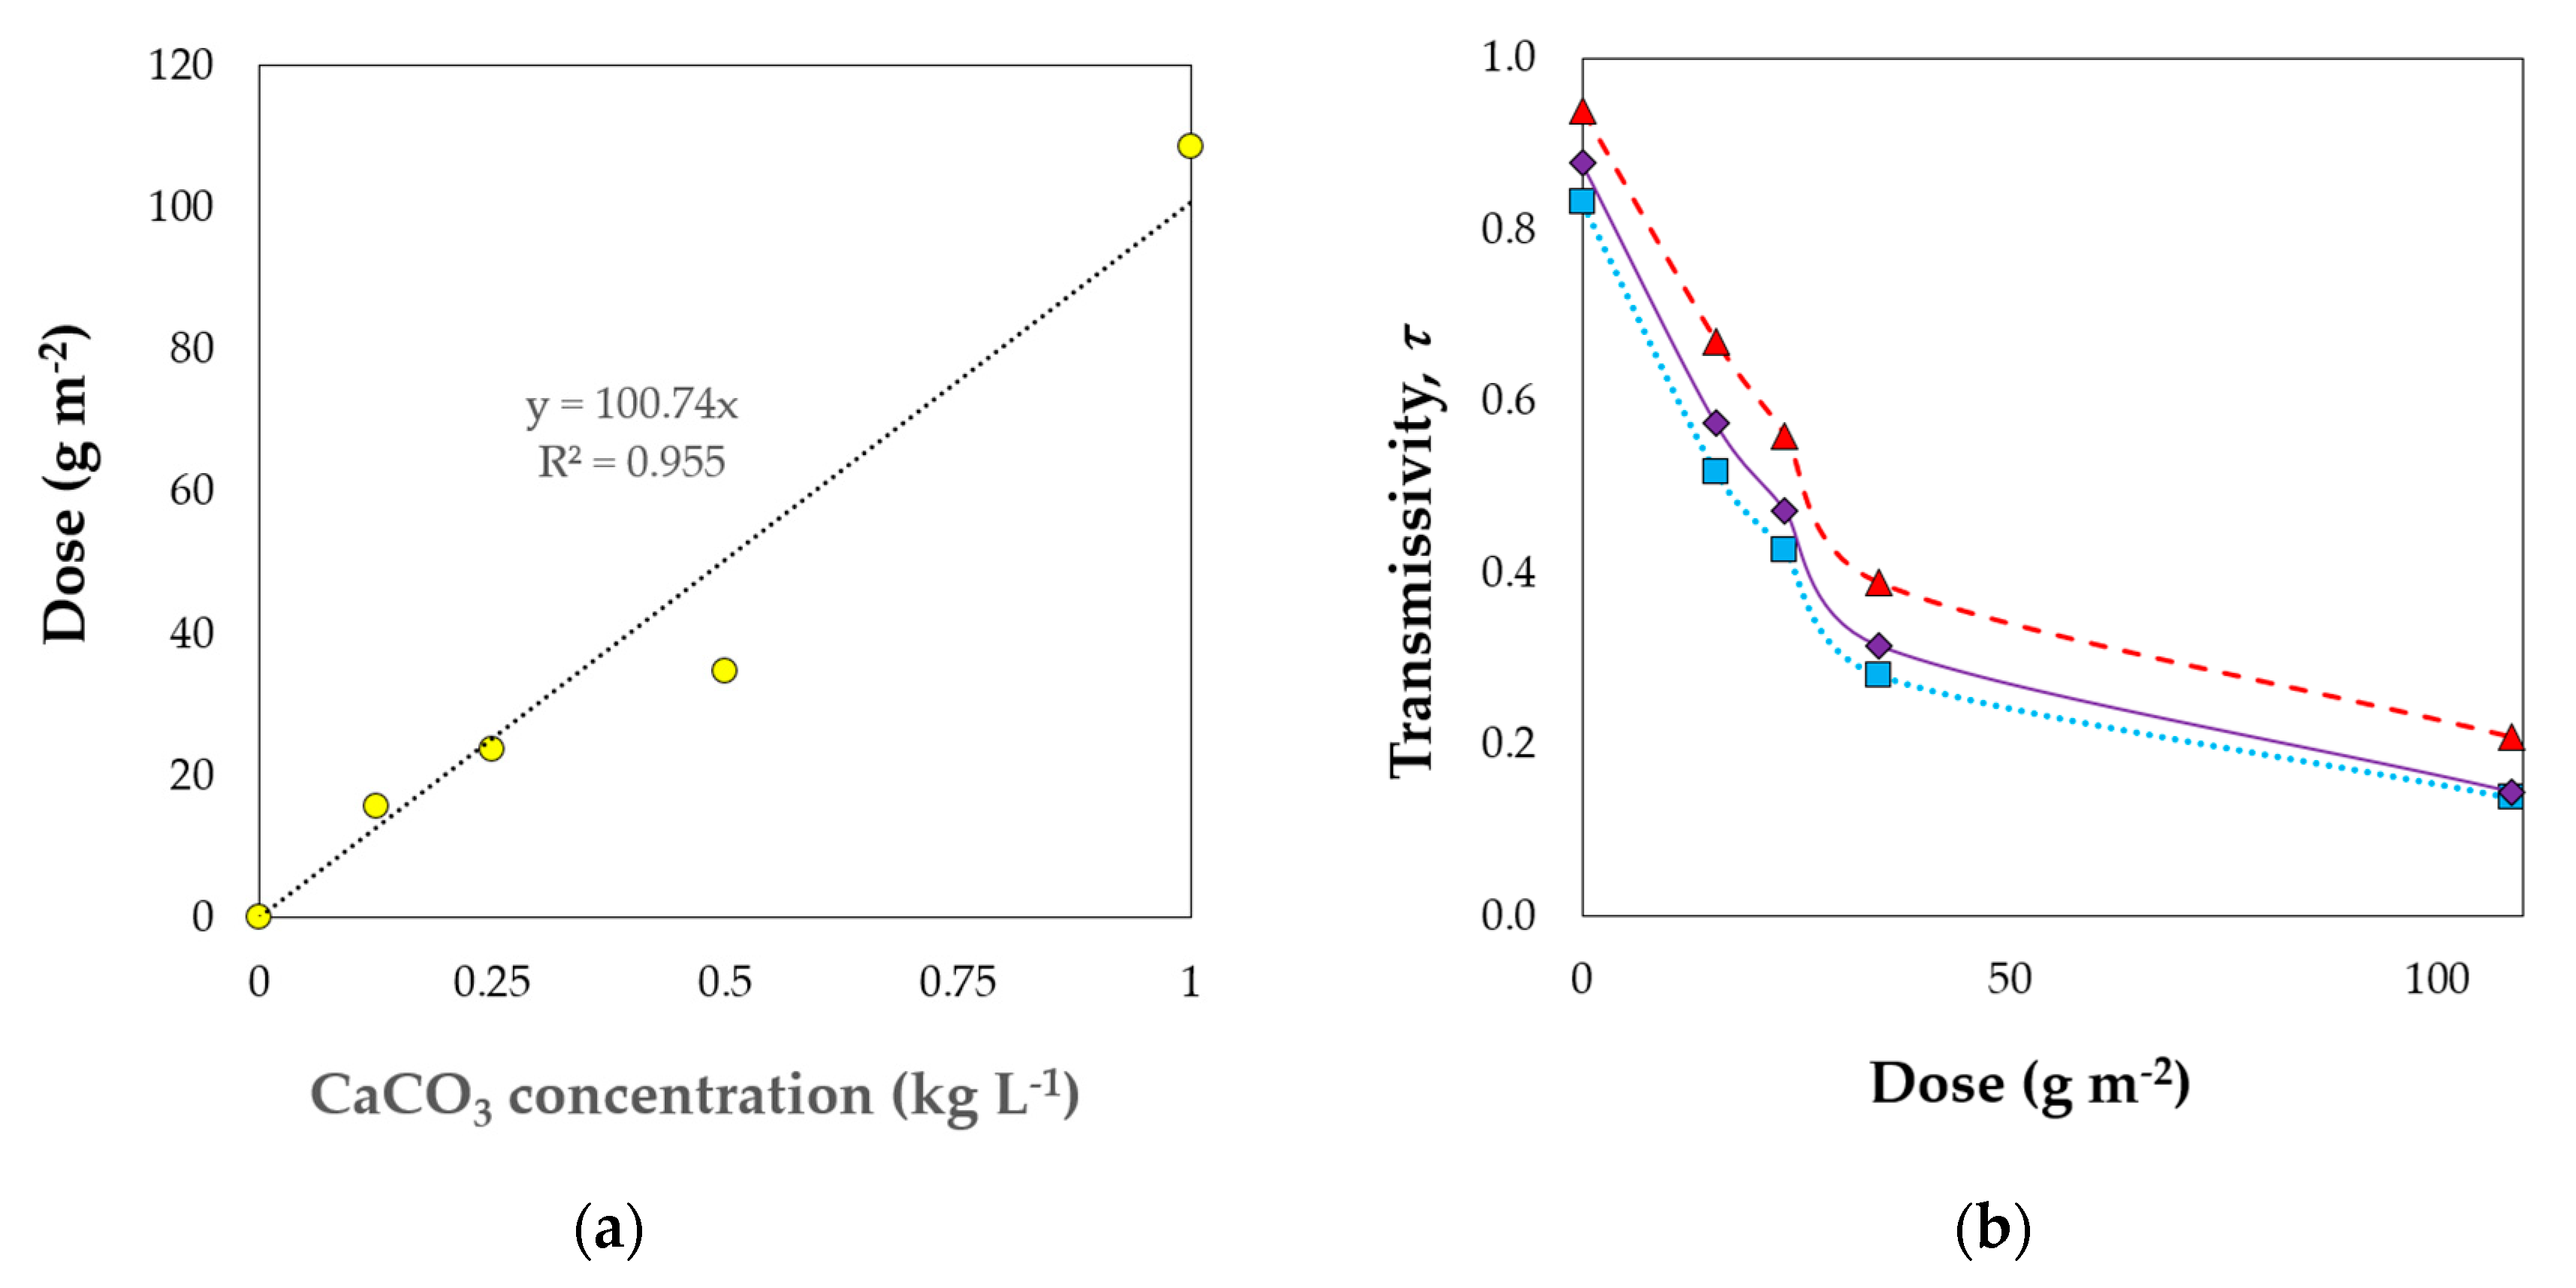
−1) applied for the whitening of the cover and the dose of CaCO3 remaining on the cover (g m−2), plastic samples of 20 cm2 were taken. The amount of CaCO3 deposited on the plastic samples was weighed on an analytical lab balance QUINTIX224-1S (Sartorius Lab Instruments GmbH & Co. KG, Goettingen, Germany) with 220 g weighing capacity with readability to 0.1 mg.
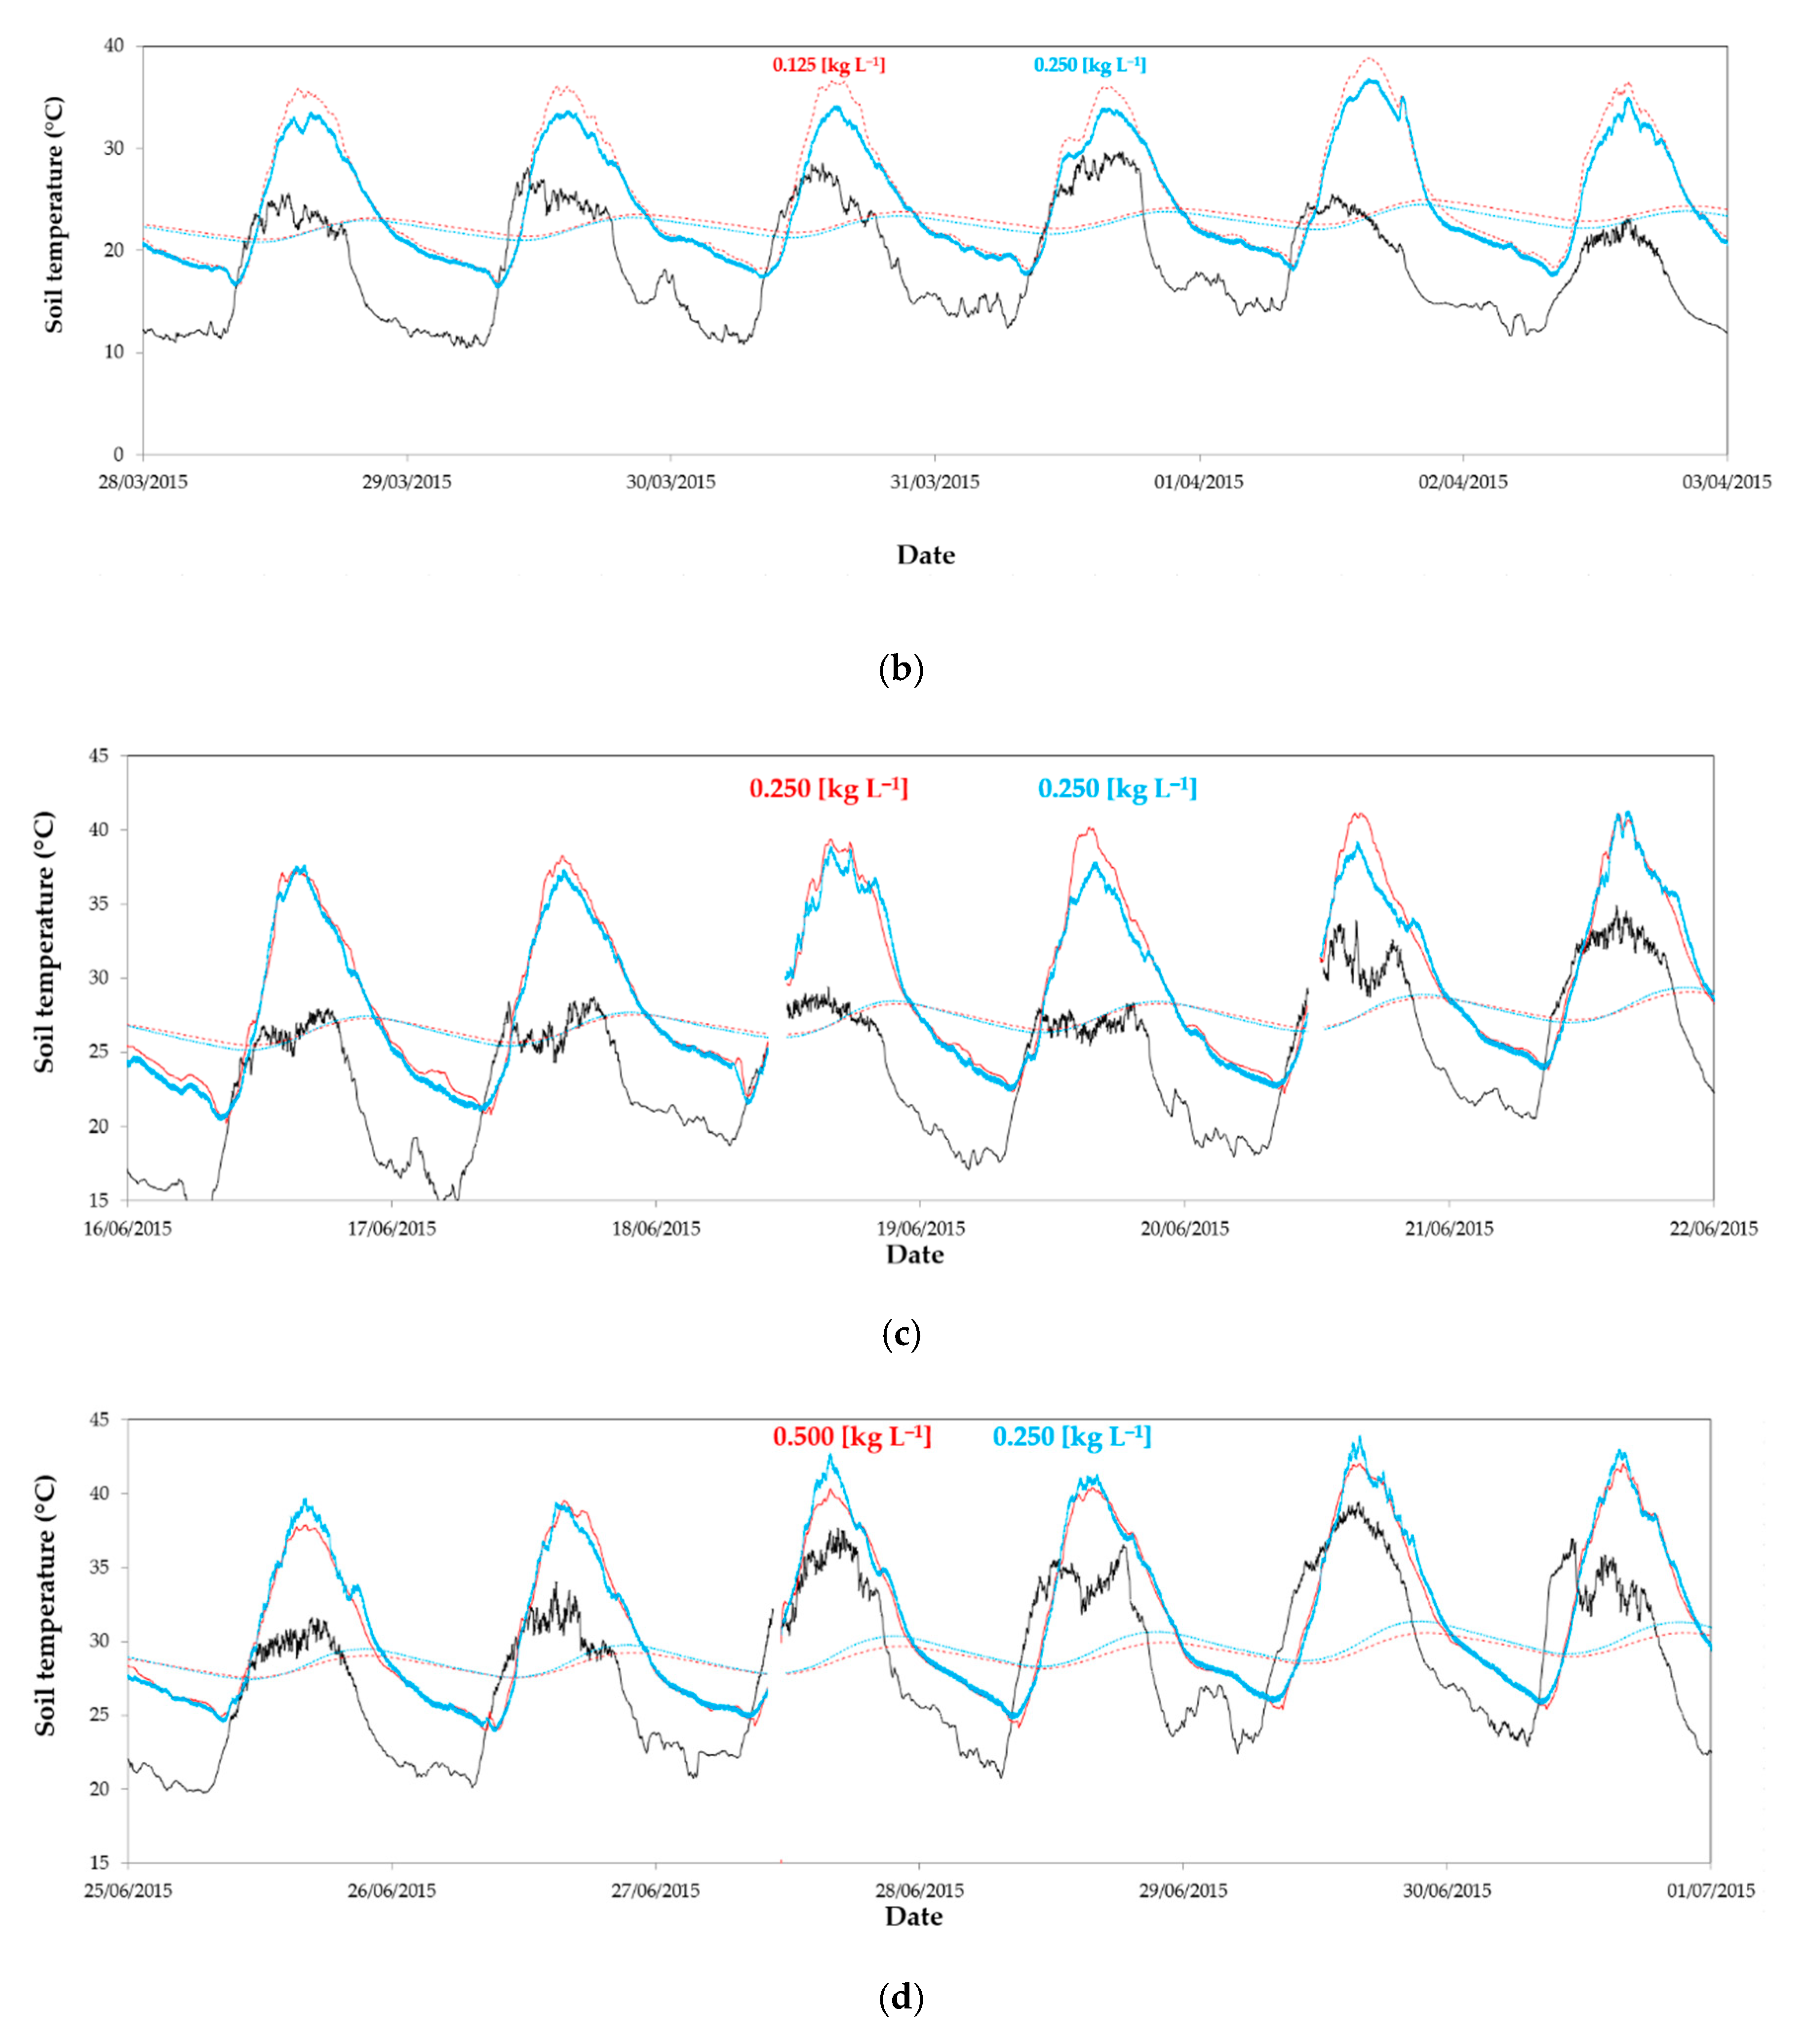
In the spring–summer cycle, the concentration was varied in the east sectors of both greenhouses depending on the outside temperature conditions. The cycle started with a concentration of 0.125 kg L−1, applying the most concentrated dose (0.500 kg L−1) at the end of the crop. The first dose (0.125 kg L−1) was applied when the maximum outside temperature reached the value of 25 °C during a three-day period. The second (0.250 kg L−1) was spread when maximum outside temperature reached 27 °C and the last (0.500 kg/L) when it surpassed 30 °C. Each time a new concentration was applied, the previous application was cleaned. The concentration of control (0.250 kg L−1) was renewed at the same times as the variable dose, cleaning previously the greenhouse cover. The total and spectral transmissivity of the samples of plastic cover with the different doses of CaCO3 were measured as described by Sangpradit [56]. A spectrometer MK350S (UPRTek, Jhunan, Taiwan) was used with a measurement range of 380–780 nm and accuracy of 2.5%. For each treatment, the measurements were performed at three different locations of the material.

2.3. Measurement Equipment for Crop Development and Production Analysis

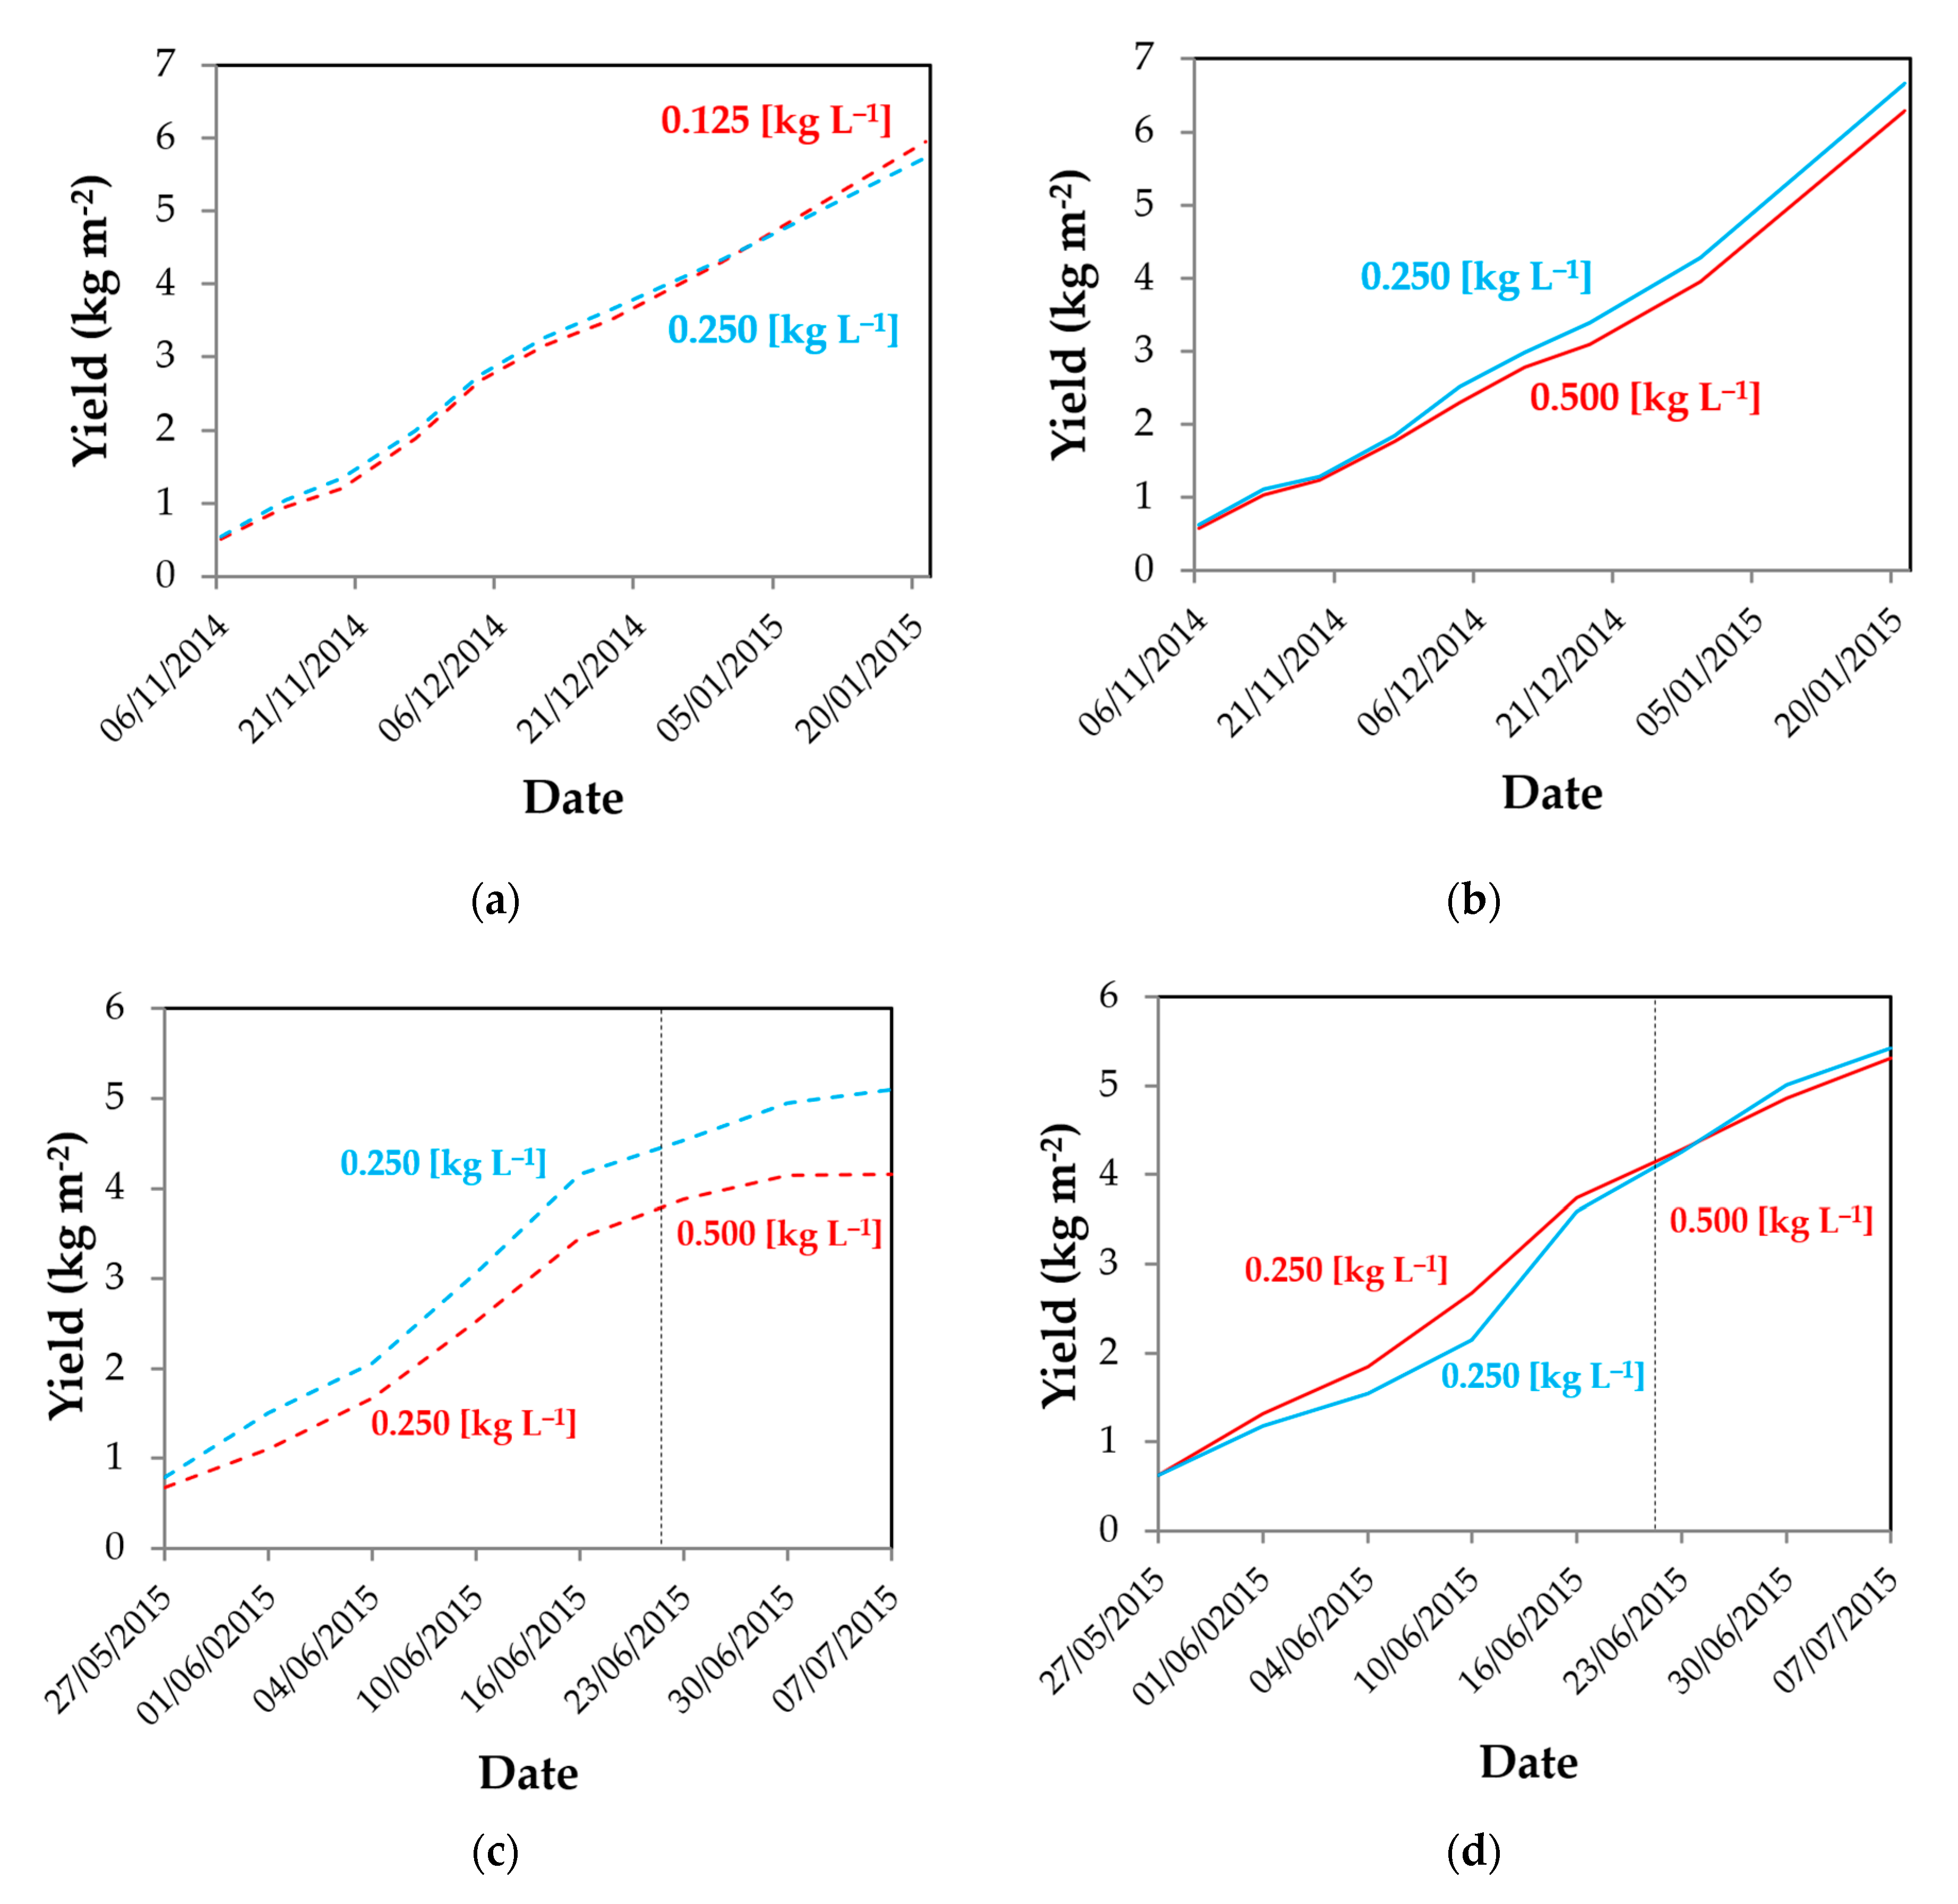
To determine the influence of different ASP doses on crop yield, three lines were selected in each experimental sector (considered as statistical repetitions). Marketable and non-marketable yield were weighed with an EKS Premium electronic balance (EKS España, SA, Spain), with a measuring range of 0–40 kg and an accuracy of 10 g.
To determine growth, 12 plants were evaluated in each of the experimental sectors. Data were taken every 15 days. The morphological parameters measured were [57]: Total length of the plant, LT (cm); length of the internodes immediately superior, HI (cm) and immediately inferior to the internode that occupies the last true leaf, LI (cm); diameter of the stem, DS (mm); number of nodes below the last true leaf, NN; Leaf Area Index LAI (m2 m−2).
For the fruit quality evaluation, 20 tomatoes were taken (everyday of harvest) of each sector of experimentation. We measured tomato fruit characteristic as weight [58] and diameter [12], soluble solids content [58,59], core firmness [58], and dry matter [58,59]. The corresponding instruments used to measure these parameters were:
Weight (WF): Electronic scale PB3002-L Delta Range® (Mettler Toledo, SA, L’Hospitalet de Llobregat, Spain), with measuring range of 0–600 kg and accuracy of ±0.1 g.
Equatorial diameter (DF): Digital meter 150 mm (Medid Precision, SA, Barcelona, Spain) with measuring range of 0–150 mm and resolution of 0.010 mm.
Total soluble solids content (TSS): A few drops of tomato juice were placed in a refractometer PAL−1 (Atago Co. LTD., Fukuoka, Japan) with a measuring range of 0%–53% and accuracy of ±0.2%.
Firmness (FF): A texture digital analyzer PCE-FM 200 (PCE- Ibérica SL, Tobarra, Spain) with measuring range of 0–20 kg and accuracy of ±0.5 g.
The pH was potentiometrically determined with a multimeter MM 40 (Crison Instruments S.A., L’Hospitalet de Llobregat, Spain) with measuring range of −2.00 to 19.99 and measurement error ≤0.01.
Dry matter (DM): Fruits were dried at 70 °C for 48 h in an oven 23–240 I, FD series (Binder GmbH, Tuttlingen, Germany).
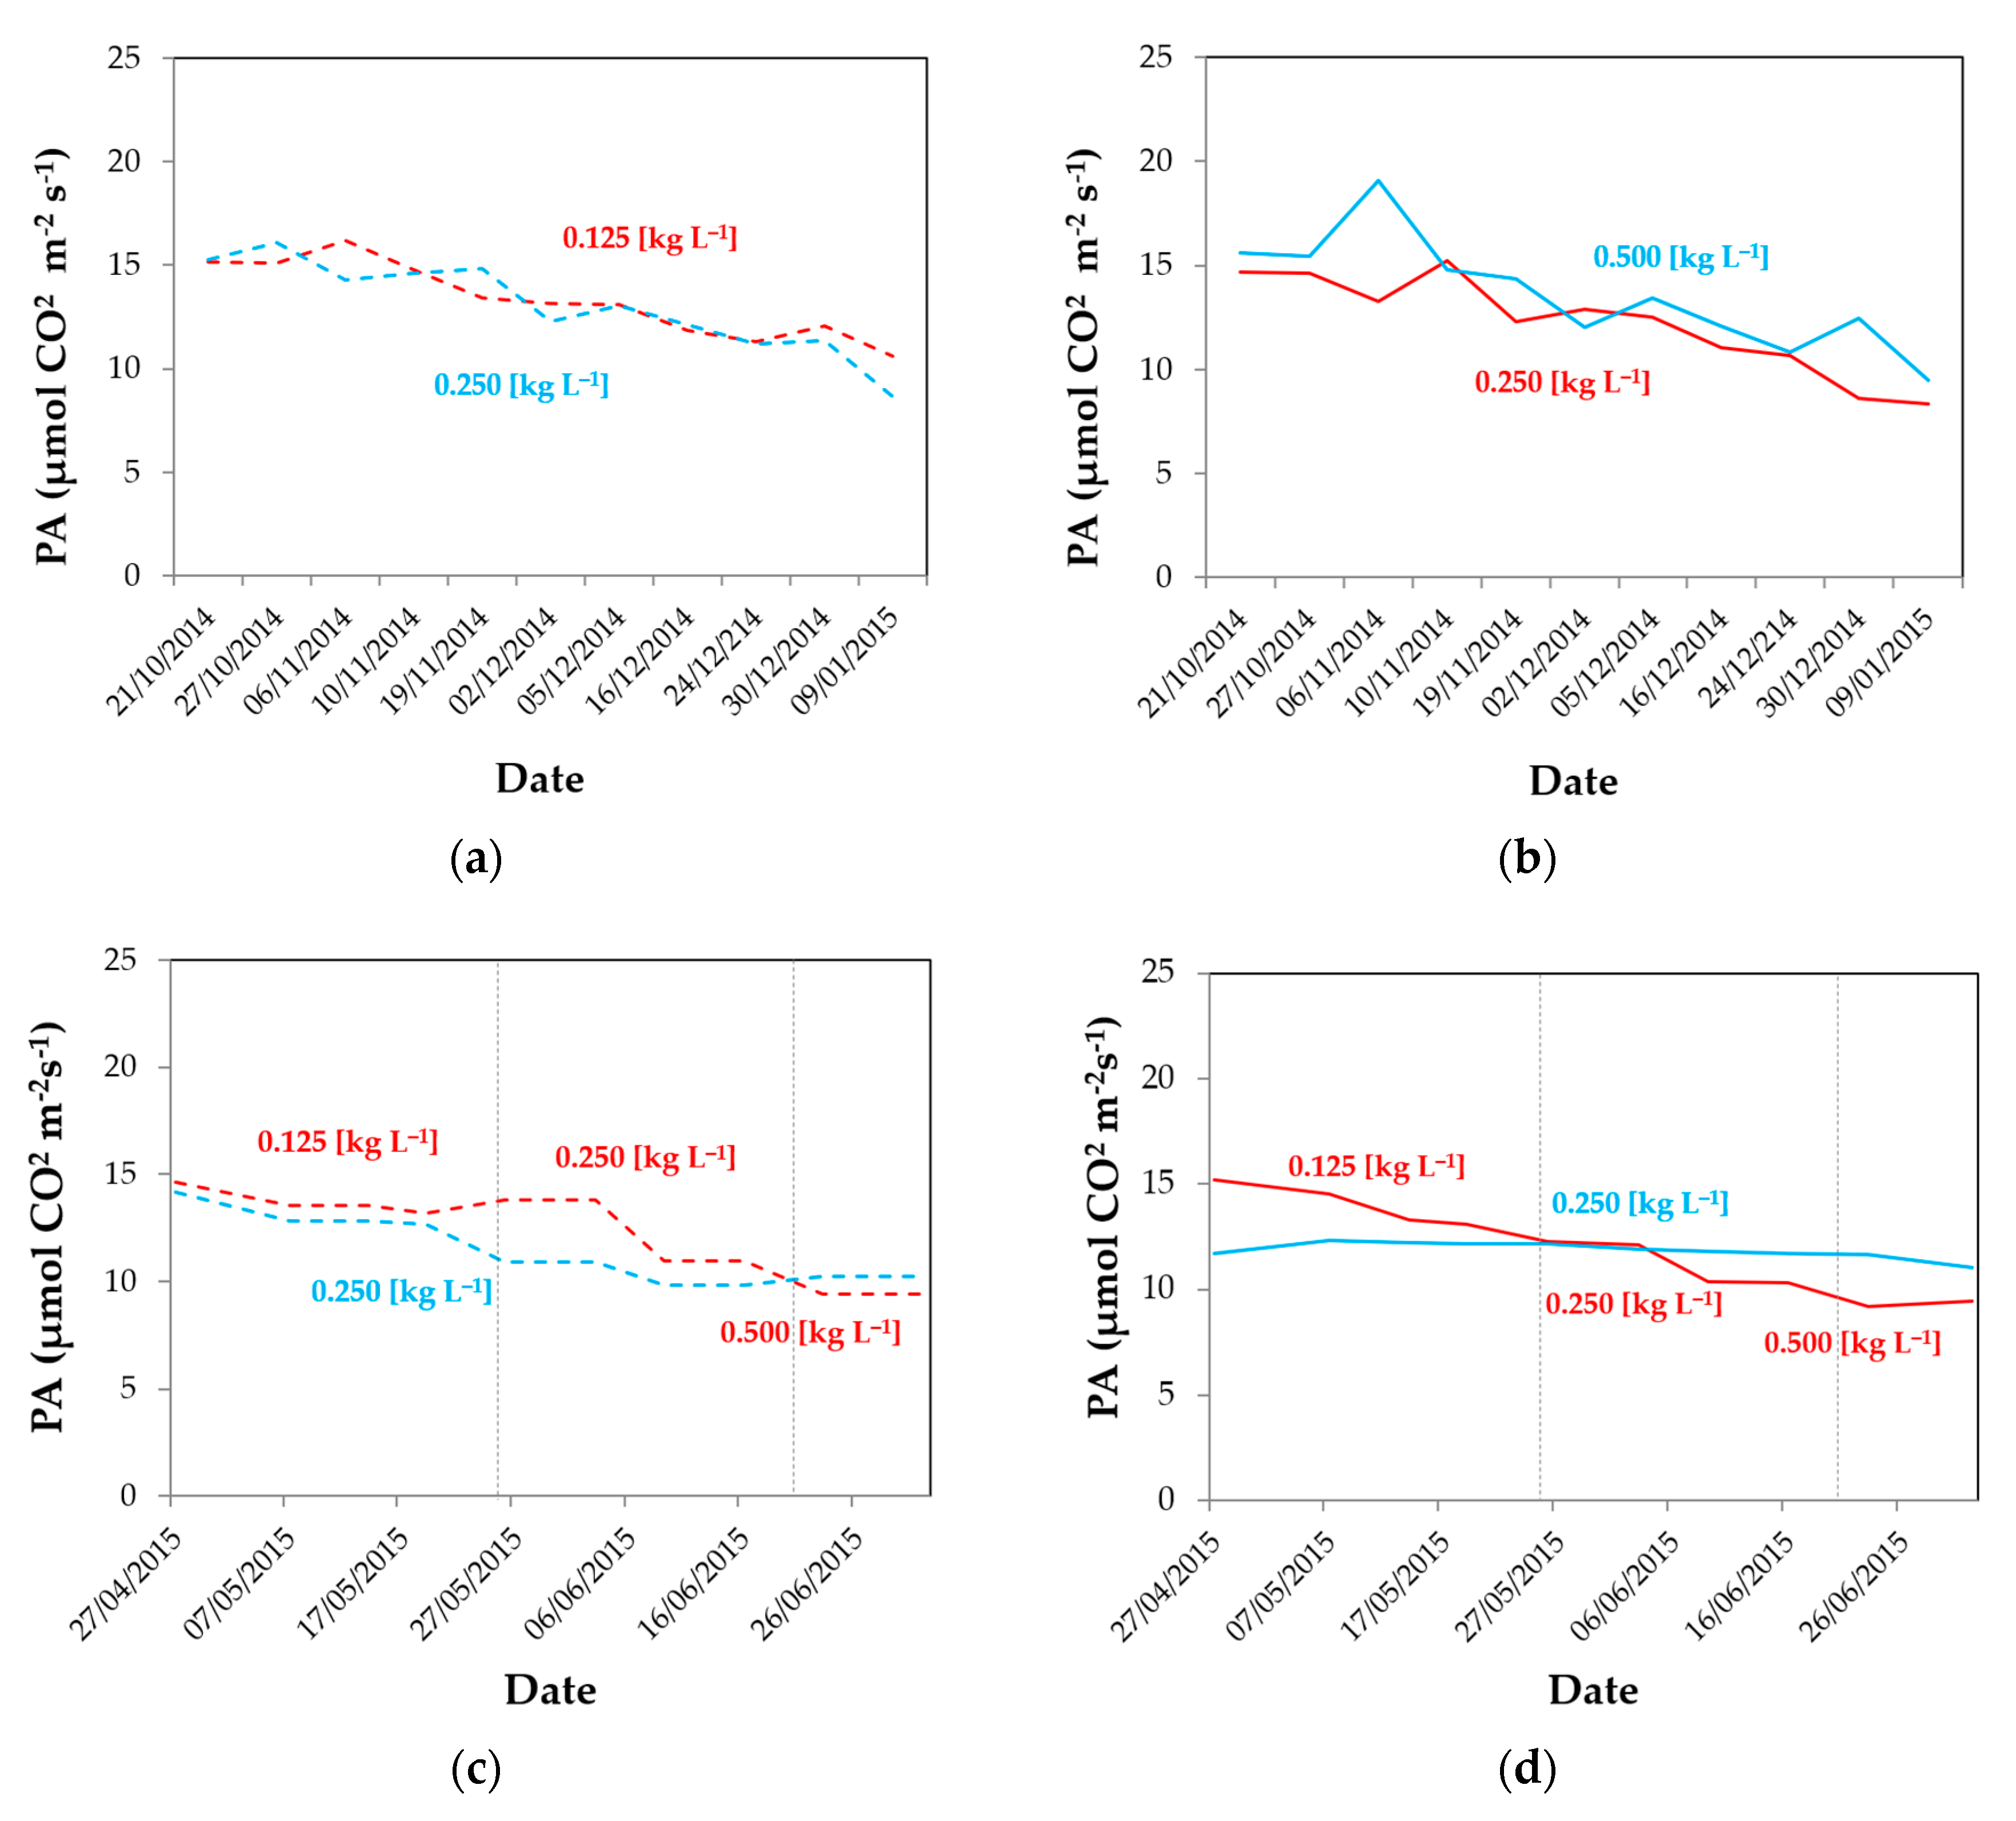
The measurement of the photosynthetic activity of the plants [12] was carried out by means of an LCi Portable Photosynthesis System (ADC BioScientificLimited, Hertfordshire, United Kingdom). It has a measurement range of 0–2000 ppm (CO2) and 0–75 mbar (H2O), with an accuracy of ±2%. The system also provides measurements of leaf temperature and PAR radiation. Twelve plants per experimental sector were measured on unclouded days.

2.4. Statistical Analysis

The statistical analysis of the data was performed with the Statgraphics Centurion XVIII software, using a variance analysis (considered significant if p-value ≤ 0.05), comparing the mean values with Fisher’s minimum significant difference procedure (LSD). Bartlett, Cochran, and Hartley tests were used to determine whether a sector has similar variation. When there was a statistically significant difference between the standard deviations, the parametric analysis was not viable by means of analysis of variance. For parameters with different variance, we carried out non-parametric analysis with the Friedman test, with each row representing a block (the date of measurement), using box-and-whisker plots [60]. Repetitions were 12 plants for growth parameters and photosynthesis and 20 tomatoes for analysis of production quality.

3. Results and Discussion

3.1. Effect of the Whitening Doses on the Cover Transmissivity

The spectral power distribution of sun light and light transmitted through five different samples of the plastic cover were measured over the 380–780 nm range using a spectroradiometer (Figure 1a). One sample without and four with whitening concentrations (the three used in the experimental greenhouse and an additional concentration of 1 kg L−1) were analyzed. Using these spectrums, the total transmissivity of the materials was calculated (Figure 1b). Transmissivity of the plastic without whitening ranged between 0.61 and 0.91 (Figure 1b), in agreement with values measured in a new film (0.80–0.87) [55]. The transmissivity of the plastic with the control concentration of 0.250 kg L−1 was 0.33–0.52 (Figure 1b) for the PAR wavelengths, corresponding with the values measured in a dirty cover with 6-month-old material without cleaning [55].
From measurements of the quantity of the CaCO3 deposited in the plastic cover (Figure 2a) and using the light transmitted spectrums (Figure 1), the total transmissivity of the materials was calculated over the PAR 400–700 nm, the 380–400 nm, and the 700–780 nm ranges (Figure 2b). The dose of CaCO3 deposited in the cover after application of the whitening treatment was proportional to the concentration used, with about 0.1 kg m−2 for a concentration of 1 kg L−1. However, the rise of the whitening dose produced an exponential decrease in PAR transmissivity of the plastic. For doses lower than 50 g m−2, the transmissivity was proportionally reduced to the increase of the whitening concentration (Figure 2b), with a small reduction of transmissivity between 50 and 100 g m−2.
The different levels of whitening produced a variable decrease on transmissivity of the greenhouse cover. This reduction does not seem to be proportional to the dose of calcium carbonate applied (Table 2). The causes of the irregularity in shading were the heterogeneity of the application on the cover surface and the non-uniform effect of rain washing [32,39,55]. The transmissivity of the greenhouse cover with the different doses (Table 2) differed of that measured in the plastic samples (Figure 1b), as a consequence of the effect of dirty accumulation [55], variation of sun position with time, and application heterogeneity [55].
For the autumn–winter cycle, the whitening of the cover was carried out on the same day that the plants were transplanted inside the greenhouses (19 August 2014). Whitening was maintained in the cover until the rain washing it (1 October 2014 rained 12.6 mm), defining these dates as the first period. Transmissivity of the cover at this first period was measured for concentrations of 0.125 and 0.250 kg L−1 in a closed greenhouse (on 23–31 July and 18–26 September 2014) with the same dimension and plastic film [55]. At this first period, transmissivity of the cover was reduced considerably with the use of the lower concentration of 0.125 kg L−1 in the east sector (Table 2).
However, increasing by double the dose in the west sector (to the concentration of control 0.250 kg L−1), the transmissivity was reduced by only 10% with respect to the lower dose. After the wash of the cover by the first rainfall, the transmissivity of both sectors rose to similar values (Table 2). At the end of the crop cycle of autumn–winter (periods 2–3), solar radiation and PAR presented a similar evolution in both sectors of greenhouse 1 (Figure 3a). These data show the similarity of microclimate in both sectors of experimental greenhouse 1 when the same whitening treatment was used in the cover. The mean solar radiation measured at the end of the autumn–winter cycle (period 3), with the cover washed by the rain, was equal in both sectors (Table 2). However, the average daily maximum values of solar radiation and PAR were statistically greater in the east sector than in the west sector (Table 3). These differences could be due to a greater persistence of the whitening after the rainfall in the cover with a greater dose of the agricultural solar protector (ASP).
The mean and maximum values of solar and PAR radiation recorded at the beginning of the spring–summer cycle (period 4), with the non-whitened cover, were statistically similar in both sectors (Table 3). This similarity in radiations guarantees that the effect of the orientations of the east and west sectors with respect to the sun’s path is negligible.
When outside temperature increased, a first whitening for the spring–summer cycle was applied in the greenhouse cover (period 5), with an initial concentration of 0.125 kg L−1 in the east sector. Lower values of radiation were measured in the west sector with the control concentration of 0.250 kg L−1 (Figure 3b). These differences were statistically significant for maximum values of radiation. However, mean values were greater in the east sector, with the lower whitening concentration of 0.125 kg L−1, but without statistical significance (Table 3). The average cover transmissivity measured in the west sector with the control treatment at this period was the same as the value measured in August (Table 2) [55]. However, transmissivity in the east sector with the lower concentration of whitening (0.125 kg L−1) was higher than values measured in August [55]. This result put emphasis on the difficulty of making two applications with the same dose of ASP (kg m−2) on the greenhouse cover.
Although in period 6 the concentration of control was applied in both sectors, the amount of product remaining in the cover was different. We can observe a higher radiation in the east sector than in the west (Figure 3c), with statistical significance for the maximum values (Table 3). Finally, at the end of the production cycle (period 7), when outside temperature reached 30 °C (Figure 3d), a concentration of 0.500 kg L−1 was applied in the cover of the east sector, producing a reduction of the transmissivity.
Despite applying in the east sector twice the concentration of ASP than the control applied in the west sector, its transmissivity remained higher than in the west sector, and similar to that measured in September 2014 for the same concentration of 0.500 kg L−1 [55]. This shows that the reduction in transmissivity of the cover is not always proportional to the increase in the concentration of calcium carbonate dissolved in the application water.

3.2. Effect of the Whitening Doses on Temperature and Heat Flux in the Soil

The main objective of application of whitening in the cover of Mediterranean greenhouses is to reduce solar radiation absorbed by the soil surface. One part of this energy is transmitted to the inside air by natural convection. Another part is transmitted to the ground by conduction (stocked during the daytime and released in the night to the air), and the other is emitted as infrared radiation [54]. The soil temperature depends on the ratio of the energy absorbed to that lost from the soil, fluctuating daily, affected mainly by variations in solar radiation [61,62,63,64].
Because of whitening, air temperature, vapor pressure deficit, and canopy-to-air temperature difference can experience drastic changes while transpiration rate was not strongly affected [45]. Cover whitening can produce a positive effect decreasing air temperature (more than 4 °C). This climate control method can be considered as an efficient means for reducing the heat load during summer in warm countries [45]. However, whitening can drastically reduce the photosynthesis capacity of plants inside greenhouses [54].
A higher soil temperature was observed in the east sector in periods 4 and 5 (Figure 4b,c) when the transmissivity was greater that in the west sector (Table 2). Statistically significant differences were only observed for maximum soil surface temperature Ts0 in period 4 (Table 3), when difference between cover transmissivity was maximum. In both periods (3 and 4), without whitening in the greenhouse cover, very similar values of mean and maximum soil surface temperature were observed (Table 3). At the end of the spring–summer cycle (period 6), the increase of the whitening concentration to 0.500 kg L−1 in the east sector produced a reduction in soil surface temperature (Figure 4d) but without statistical significance (Table 3).
Temperatures measured at a depth of 0.3 m in the soil inside both greenhouse sectors were very similar (Figure 4a–d). Soil temperature was only statistically greater in the east sector for period 5 when the maximum difference between cover transmissivity of both sectors was achieved. Although soil temperature can affect to plant growth [65], differences observed between both greenhouse sectors seem small to produce significant effects on plants development.
Soil heat flux is important because its couples surface energy balance with energy transfer processes in the soil [64] and affects the soil surface [61] and soil temperatures. The heat flux in the soil was similar in both greenhouse sectors only at the beginning of the spring–summer cycle (period 3) when similar transmissivity was observed in the non-whitened covers. For the other four periods (3 and 5–7), significantly greater maximum heat flux was observed in the east sector with the greater solar radiation values (Table 3). However, this heat flux represented less than 4% of solar radiation transmitted inside the greenhouse (Table 3).
Evolutions of soil surface temperature measured inside the greenhouse 1 (Figure 4) show a similar pattern to that of PAR radiation (Figure 3). Soil temperature is a key factor affecting chemical and biological processes in the soil essential to plant growth, such as the uptake of nutrients and water by roots, the decomposition of organic matter by microbes, and the germination of seeds [63,64]. At the end of the autumn–winter cycle (period 3), the mean soil surface temperatures were identical for both sectors (Table 3), as a consequence of the equal transmissivity of the cover (Table 2).

3.3. Effect of the Whitening Doses on the Temperature and Relative Air Humidity

In general, air temperature (Figure 5) was lower than soil surface temperature (Figure 4) as a consequence of the use of a black polypropylene mulch [54]. Furthermore, as the crop was developed in a coconut fiber substrate, the soil was not irrigated, avoiding water evaporation from the soil surface that normally reduce its temperature [66].
Maximum temperatures were observed in August 2014 (Table 3 and Table 4), corresponding with the start of the autumn–winter crop cycle (period 1). Average daily maximum temperature reached 35.0 °C in the west sector of greenhouse 2 with the control concentration (0.250 kg L−1). In the east sector, with the most concentrated whitening (0.500 kg L−1), temperature was 2 °C lower.
Despite the whitening of the greenhouses, maximum temperatures exceeded 35–40 °C in the first days of plant inside both greenhouses at the end of August. At this temperature range, tomato plants can reduce photosynthesis and fruit can be damaged [29,34].
The use of the greatest whitening concentration (0.500 kg L−1) in the east sector of greenhouse 2 reduced the number of days with maximum temperatures above 37 °C to only three. In the other three sectors, with lower doses, this limit was exceeded in 9 or 10 days. At this first period of crop, maximum temperatures were statistically greater in the sectors with lowest whitening concentrations of each greenhouse (Table 4). A whitening concentration of 0.500 kg L−1 is recommended at the time of maximum climatic requirement in August, as well as an increase in the ventilation surface.
Although the final objective of the use of cover whitening in greenhouses is to reduce air temperature, any significant difference was observed in air temperature (Figure 5a,c,d). In the spring–summer cycle, mean values measured at 1 m and 2 m height and the average maximum temperatures were similar in the two sectors of each greenhouse (Table 3 and Table 4). The greatest difference between temperatures in the spring–summer cycle was observed when the dose applied in the east sector was the lowest (0.125 kg L−1). At this time (period 5), differences between average maximum air temperatures achieved 1.1–1.4 °C (Table 4), with greater values in the east sectors (Figure 5b), but without statistical significance.
Inside temperature increased drastically when outside wind speed overcame 8 m s−1 and the climatic control system closed greenhouse windows to avoid structural damage. We can observe this abrupt increase in temperature on 4 and 5 February (Figure 5a), 1 April (Figure 5b), and 18 June (Figure 5c). This is an important drawback in the climate control of multi-span greenhouse in Almería [54].
As a consequence of the small differences in the inside air temperatures produced by the whitening, values of relative air humidity were very similar between the east and west sectors of greenhouse 1 for the five periods where this parameter was analyzed (Table 3).

3.4. Plant Morphology

Reduction of PAR radiation at the lower leaves tends to limit plant growth, mainly in the winter periods, when the solar altitude and light at the canopy are low and day length is shorter than in summer [7]. Thus, the total length of the plant and the dimeter of the stem were reduced in the east sector of greenhouse 2 as a consequence of the use of the greater shading level in the autumn–winter cycle (Table 5).
No statistically significant differences were observed between the sectors of greenhouse 1 for all the morphological parameters of the plants measured in the first crop cycle (Table 5). In the same way, no statistically significant differences were observed between sectors of both greenhouses for the spring–summer cycle (Table 5). In agreement with our results, small reductions in PAR did not affect plant morphology [57]. The general lack of differences could be due to a low plant density (1 plant m−2) and LAI (Table 5). Another possible cause was that the whitening was applied to the cover in mid-August, corresponding with the transplant date, and was not renewed throughout the crop cycle after the rain washed the cover (1 October 2014).
Reduction of radiation intercepted by the crop can result in an increase in hypocotyl length and specific leaf area [16]. Cockshull et al. [17] also observed an increase of total plant length with the use of slight fixed shading treatments (beneath 23.4%), but without significant differences. At moderate shading level (30% shading), Abdel-Mawgoud et al. [38] observed an increase in plant length and leaf area, but not on the number of leaves. In the autumn–winter cycle, the length of the lowest internode and the stem diameter were statistically greater in the east sector with the greatest whitening concentration (Table 5). This may indicate that in the autumn–winter cycles, when whitening is only necessary at the beginning of the cycle, the prolonged use of excessive whitening (0.500 kg L−1) can affect plant development.
Significant reductions of the biomass of the vegetative aerial parts (leaves and stems) and the total fruit biomass can be produced under strong shaded condition (70%) [67]. High shading conditions (above 60%) can produce higher values of leaf area and plant length, as observed in greenhouse 1 in the autumn–winter cycle, and a lower number of leaves [67]. The small differences observed in the climatic parameters (radiation and air temperature) produced by the change of the whitening concentration do not seem to significantly affect plant growth.

3.5. Photosynthetic Activity

The mean photosynthetic activity for the first crop cycle was slightly higher in the sectors with the least concentrated whitening. This can be a consequence of the statistically significant increase in the PAR incident on surface of plant leaves (Table 6).
This difference in the photosynthetic activity was statistically significant in greenhouse 2. The increase of the concentration to 0.500 kg L−1 in the east sector reduced the transmissivity of the cover (Table 2) and the PAR incident on leaf surface (Table 6). This reduction conducted to lower values of photosynthesis than in the west sector along all the growing cycle (Figure 6b).
The evolution of the photosynthetic activity in the spring–summer crop cycle was clearly influenced by the dose of ASP administered to each experimental sector (Figure 5a,b). At the beginning of the cycle, photosynthetic activity was superior in the east sectors of both greenhouses with the variable dose. At this period, the applied concentration of 0.125 kg L−1 was lower than that of the sector with the control treatment (Figure 6c,d). At the end of May, when the variable dose was the same as that in the control (period 6), photosynthetic activity was very similar in both sectors (Figure 6c,d). At the end of the crop cycle, photosynthetic activity was lower in the east sector as a consequence of the increase of the whitening concentration (Figure 6c,d).
Shading of 40% can decrease significantly the stomatal conductance and transpiration [68], and roof whitening can significantly reduce temperatures and the rate of transpiration at times of higher radiation [52]. However, crop transpiration did not present any significant differences between sectors with different whitening level (Table 6), in agreement with the similar values of mean air temperature and relative humidity recorded inside greenhouse 1 (Table 3).
The whitening of the cover of an Almería-type greenhouse reduced the transitivity to τS = 0.40–0.47, causing increase in transpiration and reduction of leaves temperature [69]. Baille et al. [45] also observed how the use of the whitening (reducing transitivity of the cover from τS = 0.62–0.31), resulting in an increase on the transpiration rate (about 18%) and a reduction on temperature difference between plants and air (from 3 to −2 °C). According to Stanghellini [70], only half of the available solar energy on the crop can be intercepted and absorbed by the leaves of canopy plants with a foliar area index LAI < 2 m2 m−2 [71]. For high levels of solar radiation, the absorbed energy exceeds the latent heat, resulting in an increase in the temperature of the crop [70,72]. Transpiration increases non-linearly with increased solar radiation as a result of the opening of stomata caused by light [72]. Any statistical difference was observed in the plant transpiration (Table 6).
In agreement with the non-significant differences recorded in air temperature inside the greenhouse (Table 3 and Table 4), leaf temperature only presented a significant difference in the spring–summer cycle inside greenhouse 2. Reduction of whitening concentration in autumn–winter produced an increase in PAR that affected positively enhancing photosynthesis without significant effects on temperature and stomatal conductance (Table 6).

3.6. Fruit Quality

Solar radiation and temperature conditions can have important effects in fruit development and quality. Day/night temperatures influence gas exchange in tomato plants, with the best temperature regime for net photosynthesis at 28/20 °C [73]. In the first crop autumn–winter cycle, the fruits of the sectors with the most concentrated whitening doses presented lower diameters, with statistically significant differences in both greenhouses (Table 7). Furthermore, this growth in the tomato fruit size was complemented by an increase in the weight, being statistically significant in greenhouse 1 (Table 7). The increase in cover transmissivity produced when the dose of whitening was reduced seemed to have a positive effect in fruit development. However, the reduction of maximum temperatures produced by the increase of the whitening at the beginning of the crop cycle (Table 3 and Table 4) did not affect the fruit quality (Table 7). Fruit development seems to be more influenced by the availability of PAR and the consequently greater photosynthetic activity (Table 6).
For the spring–summer crop cycle, only a significant difference was observed in the fruit diameter, that was greater in the east sector with the variable dose of whitening (Table 7). This higher value of the average size of the tomato in the east sector (in agreement with a non-significant increase in the weight) can be related to the higher value of the photosynthetic activity during the major part of the cycle (Figure 6c).
The level of whitening did not produce any statistically significant difference in other parameters of quality as the total soluble solids content, the acidity level, and the dry matter (Table 7). Although, the restriction of the solar radiation intensity, using excessive permanent shading, can reduce tomato growth and yield, fruit quality seems to be less sensible [74]. Final fruit composition and sugars and acids contents (linked to fruit gustative quality) were not considerably modified by fruit temperature and intercepted radiation [75]. However, Callejón-Ferre et al. [49] found a significant increase of fruit firmness when shading was above 40%. In the same way, the total soluble solids in fruit diminished when the shading level augmented from 40% to 60% [49]. Aroca-Delgado et al. [57] reported a decrease in diameter of tomato fruit as a consequence of the shading caused by the installation of flexible photovoltaic panels on the greenhouse roof, without significant effect on the firmness and pH. In our case, variation of about 10% of transmissivity between treatments (Table 2) did not affect the quality parameter of fruits as total soluble solids content and pH (Table 7).
Temperature had an indirect influence on plant growth, while incoming solar radiation presented a direct influence [76]. Newton et al. [48] observed a negative linear relationship between truss weight of tomato fruits and mean temperature during the truss growth for one variety (Solairo), and also a linear relationship between yield and cumulated solar radiation for other varieties. Different varieties can have diverse sensitivity to the increase of solar radiation and temperature.

3.7. Tomato Production

A reduction of temperature and solar radiation using shading of about 35%–40% can produce increases in tomato yield, with no increase or decrease in production when shading intensity overcomes these values [37,73,77]. In some cases, the reduction of temperature produced by a shade of 30% did not affect tomato fruit yield [53]. In the first crop cycle, marketable production was 3.8%–5.9% higher in the sectors with the least concentrated whitening (Table 8). Similar differences were also observed for the total production. These differences represent loss in production of 0.8%–1% for a reduction of 1% in the cover transmissivity, in agreement with the values reported in bibliography [17,18]. In the second crop cycle, marketable productions were higher in the west sector with the control concentration (0.250 kg L−1), with an increase of 22.6% in greenhouse 1 and only 2.1% in greenhouse 2.
As a consequence of the reductions observed in cover transmissivity τs (Table 2), in the PAR radiation inside the greenhouses RPARi (Table 3) and incident on leaf surface QPAR (Table 6), the photosynthetic activity PA decreased (Table 6) when the whitening dose was augmented. This reduction in the photosynthetic activity negatively affected the growth of tomato fruit, reducing the size and/or weight (Table 7), that finally resulted in a lower tomato production (Table 8).
The evolution of the production during the spring–winter cycle in greenhouse 1 (Figure 7a) shows how marketable yield in the east sector, with a lower concentration of whitening (0.125 kg L−1), increased in the month of January, when the lowest temperatures were recorded in the greenhouses (Table 3). However, in greenhouse 2, the augmentation from the control concentration in the west sector to double (0.500 kg L−1) in the east sector caused a continuous reduction of production from the first date of yield, generating a considerable loss of production (Figure 7b).
In the spring–summer cycle, production was lower inside the east sector from the first yield date, resulting in a big difference of production at the end of the season (Figure 7c). However, in greenhouse 2 (Figure 7d), production was initially greater in the east sector (with the lower dose, 0.125 kg L−1). The superior photosynthetic activity observed at the beginning of the cycle increased yield (Figure 6d). The effect of photosynthesis on yield is delayed in the time. An increase of the photosynthetic photon flux density for one week can result in augmentation of yield for a period of 4–6 weeks after the start of the treatment in tomato [78]. At the end of the cycle, the increase of the concentration in the east sector (0.500 kg L−1), reversed the order of all parameters, reducing PAR transmissivity, photosynthetic activity (Figure 6d), and production (Figure 7d).
The increase of the radiation intercepted by plant leaves can rise tomato yield of crops with a high plant density [6]. Although the total yield can be reduced linearly with the augmentation of shading [17,79], positive effects can be produced in the yield of marketable fruit. Shading can diminish the incidence of blossom-end rot (BER) in tomatoes [38] and, as a consequence, reduce the non-marketable yield [51]. The main drawback of cover whitening against other passive or active cooling methods (i.e., external/internal net shading, fog) is that it may negatively affect the photosynthetic rate, crop growth, and production, as it reduces light in hours when it is not in excess.
The small reduction in PAR caused using flexible photovoltaic panels on the greenhouse roof did not produce a significant effect on the total and marketable yield [57]. Results of the present work show a negative effect when the shading level was increased for all data analyzed (Figure 7), indicating that in our test conditions (greenhouses well ventilated and production period stopped before extreme temperatures in the summer), reduction of photosynthesis had more importance that a possible reduction of BER incidence.
When greenhouses present an insufficient capacity of natural ventilation, whitening is adopted as the standard practice with problems of heterogeneity and severe reductions in PAR radiation that diminish the assimilation potential of crop species with high light saturation [51]. The flow of photosynthetic activity is more uniform under the influence of a shading screen than under whitening [80], which may suggest a large spatial variation in light uniformity.
The behavior of the parameters analyzed throughout this work can be conditioned by, in addition to the dose applied, the method of application, the climatic conditions and the time of year. Furthermore, as the whitening is applied by hand, the amount of product retained in the greenhouse cover will also depend on the capacity of the applicator [55].
A high whitening concentration (0.500 kg L−1) positively affected the greenhouse climate in the first days after crop transplant, reducing the number of days where air temperature overcoming 37 °C. However, this concentration produced negative effects increasing plant growth (stem diameter and internode length) and reducing photosynthetic activity and tomato yield.

4. Conclusions

The effect of three concentrations of an agricultural solar protector (0.125 kg L−1, 0.250 kg L−1, and 0.500 kg L−1) used for the whitening of greenhouse covers on the microclimate and production and growth of two tomato crops in two greenhouses has been analyzed in this work. From the results obtained, the following practical conclusions can be drawn for growers and technicians:
1. Increase of the whitening dose reduced the transmissivity of the roof, decreasing the extreme maximum temperatures at the beginning of the autumn–winter cycle and reducing photosynthesis along the rest of the year. We recommend a dose of 35 g m−2 (concentration of 0.500 kg L−1) for the beginning of the crop cycle in the month of August.
2. As a result of the lower levels of photosynthesis caused by increased whitening in the autumn–winter cycle, significant production losses were observed, about 0.8%–1% for every 1% reduction in the transmissivity. We recommend washing the cover in the middle of September when the maximum inside temperature is inferior to 35 °C.
3. The use of a variable dose throughout the spring–summer cycle was not effective against the use of a constant dose (0.250 kg L−1), because the negative effect of photosynthesis reduction caused by the use of the higher dose (0.500 kg L−1) at the end of the cycle was greater than the positive effect produced at the start of the cycle with a lower dose (0.125 kg L−1). We recommend a dose of 15 g m−2 (0.125 kg L−1) at the end of the spring when the inside temperature exceeds 35 °C.
4. In general, no major variations in crop growth or fruit quality parameters were observed; the exception to this was the size of the fruits, which was significatively reduced with the increase in the whitening dose, causing important loss of production (4%–5%).

Author Contributions

Conceived and research design: M.d.l.Á.M.-T., F.D.M.-A., A.L.-M., and D.V.; acquisition of data and statistical analysis: A.L.-M., P.M., A.P., M.d.l.Á.M.-T., and A.R.-R.; analysis and interpretation of data: M.d.l.Á.M.-T., A.L.-M., D.V., A.P. and F.D.M.-A.; drafting the manuscript: M.d.l.Á.M.-T.; critical revision of the manuscript for important intellectual content: F.D.M.-A., D.V., A.L.-M., and A.P.; coordinating and supervising the research work: D.V. and A.P.; project administration: D.V.; funding acquisition: D.V. All authors have read and agreed to the published version of the manuscript.

Funding

This work has been funded by the Spanish Ministry of Economy and Competitiveness and the European Regional Development Fund (ERDF) by means of research grant AGL2015-68050-R.

Acknowledgments

The authors wish to express their gratitude to Indaloblanc, the Research Centre CIAIMBITAL and Research Grant Program (Plan Propio de Investigación y Transferencia) of the University of Almeria (Spain) for their support throughout the development of this study. They would like to thank the University of Almeria—ANECOOP Foundation for their collaboration and assistance during the development of this study.

Conflicts of Interest

The authors declare no conflicts of interest.

References

  1. Cartografía de invernaderos en Almería, Granada y Málaga. 2018. Available online: https://www.juntadeandalucia.es/export/drupaljda/Cartografia%20_inv_AL_GR_MA_180725.pdf (accessed on 20 September 2019).
  2. Campra, P.; García, M.; Cantón, Y.; Palacios-Orueta, A. Surface temperature cooling trends and negative radiative forcing due to land use change toward greenhouse farming in southeastern Spain. J. Geophys. Res. Atmos. 2008, 113, 1–10. [Google Scholar] [CrossRef]
  3. Honoré, M.N.; Belmonte-Ureña, L.J.; Navarro-Velasco, A.; Camacho-Ferre, F. Profit analysis of papaya crops under greenhouses as an alternative to traditional intensive horticulture in southeast Spain. Int. J. Environ. Res. Public Health 2019, 16, 2908. [Google Scholar] [CrossRef] [PubMed] [Green Version]
  4. Molina-Aiz, F.D.; Valera, D.L.; López, A.; Bouharroud, R.; Fatnassi, H. Analysis of economic sustainability of tomato greenhouses in Almería (Spain). In Proceedings of the International Symposium on Advanced Technologies and Management for Innovative Greenhouses—Greensys 2019, Angers, France, 16–20 June 2019. [Google Scholar]
  5. De Boer, I.J.M.; Van Ittersum, M.K. Circularity in Agricultural Production; Wageningen University & Research: Wageningen, The Netherlands, 2018; pp. 50–51. [Google Scholar]
  6. Lu, N.; Maruo, T.; Johkan, M.; Hohjo, M.; Tsukagoshi, S.; Ito, Y. Effects of supplemental lighting within the canopy at different developing stages on tomato yield and quality of single-truss tomato plants grown at high density. Environ. Control Biol. 2012, 50, 1–11. [Google Scholar] [CrossRef] [Green Version]
  7. Tewolde, F.T.; Lu, N.; Shiina, K.; Maruo, T.; Takagaki, M.; Kozai, T.; Yamori, W. Nighttime supplemental LED inter-lighting improves growth and yield of single-truss tomatoes by enhancing photosynthesis in both winter and summer. Front. Plant Sci. 2016, 7, 448–457. [Google Scholar] [CrossRef] [PubMed]
  8. Yin, X.; Struik, P.C. Constraints to the potential efficiency of converting solar radiation into phytoenergy in annual crops: From leaf biochemistry to canopy physiology and crop ecology. J. Exp. Bot. 2015, 66, 6535–6549. [Google Scholar] [CrossRef] [PubMed] [Green Version]
  9. Higashide, T.; Heuvelink, E. Physiological and morphological changes over the past 50 years in yield components in tomato. J. Am. Soc. Hortic. Sci. 2009, 134, 460–465. [Google Scholar] [CrossRef] [Green Version]
  10. Dieleman, J.A.; Marcelis, L.F.M.; Elings, A.; Dueck, T.A.; Meinen, E. Energy saving in greenhouses: Optimal use of climate conditions and crop management. Acta Hortic. 2006, 718, 203–210. [Google Scholar] [CrossRef] [Green Version]
  11. Zhang, G.; Shen, S.; Takagaki, M.; Kozai, T.; Yamori, W. Supplemental upward lighting from underneath to obtain higher marketable lettuce (Lactuca sativa) leaf fresh weight by retarding senescence of outer leaves. Front. Plant Sci. 2015, 6, 1110–1118. [Google Scholar] [CrossRef] [Green Version]
  12. Jiang, C.; Johkan, M.; Hohjo, M.; Tsukagoshi, S.; Ebihara, M.; Nakaminami, A.; Maruo, T. Photosynthesis, plant growth, and fruit production of single-truss tomato improves with supplemental lighting provided from underneath or within the inner canopy. Sci Hortic. 2017, 222, 221–229. [Google Scholar] [CrossRef]
  13. Acock, B.; Charles-Edwards, D.A.; Fitter, D.J.; Hand, D.W.; Ludwig, L.J.; Wilson, J.W. The contribution of leaves from different levels within a tomato crop to canopy net photosynthesis: An experimental examination of two canopy models. J. Exp. Bot. 1978, 29, 815–827. [Google Scholar] [CrossRef]
  14. Xu, H.L.; Gauthier, L.; Desjardins, Y.; Gosselin, A. Photosynthesis in leaves, fruits, stem and petioles of greenhouse-grown tomato plants. Photosynthetica 1997, 33, 113–123. [Google Scholar] [CrossRef]
  15. Frantz, J.M.; Joly, R.J.; Mitchell, C.A. Intra-canopy lighting influences radiation capture, productivity, and leaf senescence in cowpea canopies. J. Am. Soc. Hortic. Sci. 2000, 125, 694–701. [Google Scholar] [CrossRef] [Green Version]
  16. Steinger, T.; Roy, B.A.; Stanton, M.L. Evolution in stressful environments. II. Adaptive value and costs of plasticity in response to low light in Sinapis arvensis. J. Evol. Biol. 2003, 16, 313–323. [Google Scholar] [CrossRef] [Green Version]
  17. Cockshull, K.E.; Graves, C.J.; Cave, C.R.J. The influence of shading on yield of greenhouse tomatoes. J. Hortic. Sci. Biotechnol. 1992, 67, 11–24. [Google Scholar] [CrossRef]
  18. Marcelis, L.F.M.; Broekhuijsen, A.G.M.; Meinen, E.; Nijs, E.M.F.M.; Raaphorst, M.G.M. Quantification of the growth response to light quantity of greenhouse grown crops. Acta Hortic. 2006, 711, 97–104. [Google Scholar] [CrossRef]
  19. Valera, D.L.; Belmonte, L.J.; Molina-Aiz, F.D.; López, A. Greenhouse Agriculture in Almería. A Comprehensive Techno-Economic Analysis. Available online: https://www.publicacionescajamar.es/series-tematicas/economia/greenhouse-agriculture-in-almeria-a-comprehensive-techno-economic-analysis (accessed on 22 September 2019).
  20. Hendricks, P. Life Cycle Assessment of Greenhouse Tomato (Solanum lycopersicum L.) Production in Southwestern Ontario. Ph.D. Thesis, University of Guelph, Guelph, ON, Canada, 2012. [Google Scholar]
  21. Heuts, R.F.; Van Loon, J.; Schrevens, E. Life cycle assessment of different heating systems for glasshouses tomato production in Flanders, Belgium. Acta Hortic. 2012, 957, 107–114. [Google Scholar] [CrossRef]
  22. Costa, J.M.; Heuvelink, E.; Botden, N. Greenhouse Horticulture in China: Situation and Prospects; Horticultural Production Chains Group, Wageningen University: Wageningen, The Netherlands, 2004; pp. 47–77. [Google Scholar]
  23. Kobayashi, S.; Shimaji, H.; Ikeda, H. A study on single-truss tomato production by hydroponics. II. Relationship between Environmental Parameters and Plant Growth. J. Japan Soc. Hort. Sci. 1998, 28, 203–208, (In Japanes with English Summary). [Google Scholar]
  24. Torrellas, M.; Antón, A.; Ruijs, M.; García Victoria, N.; Stanghellini, C.; Montero, J.I. Environmental and economic assessment of protected crops in four European scenarios. J. Clean. Prod. 2012, 28, 45–55. [Google Scholar] [CrossRef]
  25. Demmig-Adams, B.; Adams, W.W. Photosynthesis and Partitioning. In Photoinhibition; Thomas, B., Ed.; Elsevier: Amsterdam, The Netherland, 2003; pp. 707–714. [Google Scholar]
  26. Adir, N.; Zer, H.; Shochat, S.; Ohad, I. Photoinhibition—A historical perspective. Photosynth. Res. 2003, 76, 343–369. [Google Scholar] [CrossRef]
  27. Murata, N.; Takahashi, S.; Nishiyama, Y.; Allakhverdiev, S.I. Photoinhibition of photosystem II under environmental stress. Biochim. Biophys. Acta 2007, 1767, 414–421. [Google Scholar] [CrossRef] [Green Version]
  28. Wang, F.; Wu, N.; Zhang, L.; Ahammed, G.J.; Chen, X.; Xiang, X.; Zhou, J.; Xia, X.; Shi, K.; Yu, J.; et al. Light signaling-dependent regulation of photoinhibition and photoprotection in tomato. Plant Physiol. 2018, 176, 1311–1326. [Google Scholar] [CrossRef]
  29. Sage, R.F.; Sharkey, T.D. The effect of temperature on the occurrence of O2 and CO2 insensitive photosynthesis in field grown plants. Plant Physiol. 1987, 84, 658–664. [Google Scholar] [CrossRef] [Green Version]
  30. Gent, M.P.N.; Seginer, I. A carbohydrate supply and demand model of vegetative growth: Response to temperature and light. Plant Cell Environ. 2012, 35, 1274–1286. [Google Scholar] [CrossRef]
  31. Masabni, J.; Sun, Y.; Niu, G.; Del Valle, P. Shade effect on growth and productivity of tomato and chili pepper. HortTechnology 2016, 26, 344–350. [Google Scholar] [CrossRef] [Green Version]
  32. Lorenzo, P.; García, M.L.; Sánchez-Guerrero, M.C.; Medrano, E.; Caparros, I.; Giménez, M. Influence of mobile shading on yield, crop transpiration and water use efficiency. Acta Hortic. 2006, 719, 471–478. [Google Scholar] [CrossRef]
  33. Ho, L.C.; Belda, R.; Brown, M.; Andrews, J.; Adams, P. Uptake and transport of calcium and the possible causes of blossom-end rot in tomato. J. Exp. Bot. 1993, 44, 509–518. [Google Scholar] [CrossRef]
  34. Peet, M.M. Physiological disorders in tomato fruit development. Acta Hortic. 2009, 821, 151–160. [Google Scholar] [CrossRef]
  35. Vinh, T.D.; Yoshida, Y.; Ooyama, M.; Goto, T.; Yasuba, K.; Tanaka, Y. Comparative analysis on blossom-end rot incidence in two tomato cultivars in relation to calcium nutrition and fruit growth. Horticult. J. 2018, 87, 97–105. [Google Scholar] [CrossRef]
  36. Adams, P.; Ho, L.C. Effects of environment on the uptake and distribution of calcium in tomato and on the incidence of blossom-end rot. Plant Soil. 1993, 154, 127–132. [Google Scholar] [CrossRef]
  37. El-Gizawy, A.M.; Abdallah, M.M.F.; Gomaa, H.M.; Mohamed, S.S. Effect of different shading levels on tomato plants. 2. Yield and fruit quality. Acta Hortic. 1993, 323, 349–354. [Google Scholar] [CrossRef]
  38. Abdel-Mawgoud, A.M.R.; El Abd, S.O.; Singer, S.M.; Abou Hadid, A.F.; Hsiao, T.C. Effect of shade on the growth and yield of tomato plants. Acta Hortic. 1996, 434, 313–320. [Google Scholar] [CrossRef]
  39. Abdel-Ghany, A.M.; Al-Helal, I.M. Characterization of solar radiation transmission through plastic shading nets. Sol. Energy Mater. Sol. Cells 2010, 94, 1371–1378. [Google Scholar] [CrossRef]
  40. Ahemd, H.A.; Al-Faraj, A.A.; Abdel-Ghany, A.M. Shading greenhouses to improve the microclimate, energy and water saving in hot regions: A review. Sci. Hortic. 2016, 201, 36–45. [Google Scholar] [CrossRef]
  41. Sethi, V.P.; Sharma, S.K. Survey of cooling technologies for worldwide agricultural greenhouse applications. J. Sol. Energy 2007, 81, 1447–1459. [Google Scholar] [CrossRef]
  42. Ganguly, A.; Ghosh, S. A review of ventilation and cooling technologies in agricultural greenhouse application. Iran. J. Energy Environ. 2011, 2, 32–46. [Google Scholar]
  43. Holcman, E.; Sentelhas, P.C. Microclimate under different shading screens in greenhouses cultivated with bromeliads. Rev. Bras. Eng. Agríc. Ambient. 2012, 16, 858–863. [Google Scholar] [CrossRef] [Green Version]
  44. Molina-Aiz, F.D.; Valera, D.L.; Peña, A.A.; Gil, J.A. Optimisation of Almería-type greenhouse ventilation performance with computational fluid dynamics. Acta Hortic. 2005, 691, 433–440. [Google Scholar] [CrossRef]
  45. Baille, A.; Kittas, C.; Katsoulas, N. Influence of whitening on greenhouse microclimate and crop energy partitioning. Agric. Forest Meteorol. 2001, 107, 293–306. [Google Scholar] [CrossRef]
  46. Kittas, C.; Baille, A.; Giaglaras, P. Influence of covering material and shading on the spectral distribution of light in greenhouses. J. Agric. Eng. Res. 1999, 73, 341–351. [Google Scholar] [CrossRef]
  47. Meca, D.; López, J.C.; Gázquez, J.C.; Baeza, E.; Pérez-Parra, J.; Zaragoza, G.; Baeza, E. A comparison of three different cooling systems in parral type greenhouses in Almería. Span. J. Agric. Res. 2007, 5, 285–292. [Google Scholar] [CrossRef]
  48. Newton, P.; Sahraoui, R.; Economakis, C. The influence of air temperature on truss weight of tomatoes. Acta Hortic. 1999, 507, 43–50. [Google Scholar] [CrossRef]
  49. Callejón-Ferre, A.J.; Manzano-Agugliaro, F.; Díaz-Pérez, M.; Carreño-Ortega, A.; Pérez-Alonso, J. Effect of shading with aluminised screens on fruit production and quality in tomato (Solanum lycopersicum L.) under greenhouse conditions. Span. J. Agric. Res. 2009, 7, 41–49. [Google Scholar]
  50. Willits, D.H.; Peet, M.M. Intermittent application of water to an externally mounted greenhouse shade cloth to modify cooling performance. Trans. ASAE 2000, 43, 1247–1252. [Google Scholar] [CrossRef]
  51. Lorenzo, P.; Sánchez-Guerrero, M.C.; Medrano, E.; García, M.L.; Caparrós, I.; Coelho, G.; Giménez, M. Climate control in the summer season: A comparative study of external mobile shading and fog system. Acta Hort. 2004, 659, 189–194. [Google Scholar] [CrossRef]
  52. Chauhan, P.M.; Kim, W.S.; Lieth, J.H. Combined effect of whitening and ventilation methods on microclimate and transpiration in rose greenhouse. In Proceedings of the International Conference on Thermal Energy Storage Technologies, Devi Ahilya, Indore, India, 21–24 March 2003. [Google Scholar]
  53. Baille, A.; López, J.C.; Bonachela, S.; González-Real, M.M.; Montero, J.I. Night energy balance in a heated low-cost plastic greenhouse. Agric. Forest Meteorol. 2006, 137, 107–118. [Google Scholar] [CrossRef]
  54. López, A.; Valera, D.L.; Molina-Aiz, F.D.; Moreno, M.A.; Peña, A.; Espinoza, K.E. Analysis of the effect of concentrations of four whitening products in cover transmissivity of Mediterranean greenhouses. Int. J. Environ. Res. Public Health 2019, 16, 344–350. [Google Scholar]
  55. Sangpradit, K. Study of the solar transmissivity of plastic cladding materials and influence of dust and dirt on greenhouse cultivations. Energy Procedia 2014, 56, 566–573. [Google Scholar] [CrossRef] [Green Version]
  56. Aroca-Delgado, R.; Pérez-Alonso, J.; Callejón-Ferre, A.J.; Díaz-Pérez, M. Morphology, yield and quality of greenhouse tomato cultivation with flexible photovoltaic rooftop panels (Almería-Spain). Sci Hortic. 2019, 257, 1–8. [Google Scholar] [CrossRef]
  57. Hernández, J.; Bonachela, S.; Granados, M.R.; López, J.C.; Magán, J.J.; Montero, J.I. Microclimate and agronomical effects of internal impermeable screens in an unheated Mediterranean greenhouse. Biosyst. Eng. 2017, 163, 66–77. [Google Scholar] [CrossRef]
  58. Steelheart, C.; Alegre, M.L.; Bahima, J.V.; Senn, M.E.; Simontacchi, M.; Bartoli, C.G.; Gergoff Grozeff, G.E. Nitric oxide improves the effect of 1-methylcyclopropene extending the tomato (Lycopersicum esculentum L.) fruit postharvest life. Sci Hortic. 2019, 255, 193–201. [Google Scholar] [CrossRef]
  59. Statgraphics. Statgraphics® Centurion 18. User Manual. Statgraphics Technologies. Available online: https://www.statgraphics.net/wp-content/uploads/2015/03/Centurion-XVI-Manual-Principal.pdf (accessed on 22 September 2019).
  60. Reyes-Rosas, A.; Molina-Aiz, F.; Valera, D.; López, A.; Khamkure, S. Development of a single energy balance model for prediction of temperatures inside a naturally ventilated greenhouse with polypropylene soil mulch. Comput. Electron. Agric. 2017, 142, 9–28. [Google Scholar] [CrossRef]
  61. Wu, J.; Nofziger, D.L. Incorporating temperature effects on pesticide dug radiation into a management model. J. Environ. Qual. 1999, 28, 92–100. [Google Scholar] [CrossRef]
  62. Abu-Hamdah, N.H. Thermal properties of soils as affected by density and water content. Biosyst. Engine. 2003, 86, 97–102. [Google Scholar] [CrossRef]
  63. Campbell, G.S. Soil Temperature and Heat Flow. In Developments in Soil Science; Chapter 4; Campbell, G.S., Ed.; Elsevier B.V.: Amsterdam, The Netherlands, 1985; Volume 14, pp. 26–39. [Google Scholar]
  64. Sauer, T.J.; Robert, H. Soil Heat Flux; Agricultural Research Service (USDA-ARS): Lincoln, NE, USA, 2005; pp. 131–132.
  65. Onwuka, B.; Mang, B. Effects of soil temperature on some soil properties and plant growth. Adv. Plants Agric. Res. 2018, 8, 34–37. [Google Scholar] [CrossRef]
  66. Monteith, J.L. Evaporation and surface temperature. Q. J. Roy. Meteor. Soc. 1981, 107, 1–27. [Google Scholar] [CrossRef]
  67. Bénard, C.; Bernillon, S.; Biais, B.; Osorio, S.; Maucourt, M.; Ballias, P.; Deborde, C.; Colombié, S.; Cabasson, C.; Jacob, D.; et al. Metabolomic profiling in tomato reveals diel compositional changes in fruit affected by source–sink relationships. J. Exp. Bot. 2015, 66, 3391–3404. [Google Scholar] [CrossRef] [PubMed] [Green Version]
  68. López-Marín, J.; Gálvez, A.; González, A.; Egea-Gilabert, C.; Fernández, J.A. Effect of shade on yield, quality and photosynthesis-related parameters of sweet pepper plants. Acta Hortic. 2012, 956, 545–552. [Google Scholar] [CrossRef]
  69. Molina-Aiz, F.D. Simulation and modelling of ventilation in Almería greenhouses using Computational Fluid Dynamics. Ph.D. Thesis, University of Almería, Almería, Spain, 2010. [Google Scholar]
  70. Stanghellini, C. Transpiration of Greenhouse Crops. An Aid to Climate Management. Ph.D. Thesis, Agricultural University Wageningen, Wageninge, The Nederland, 1987. [Google Scholar]
  71. Yang, X.; Short, T.H.; Fox, R.D.; Bauerle, W.L. Transpiration, leaf temperature and stomatal resistance of a greenhouse cucumber crop. Agr. Forest Meteorol. 1990, 51, 197–209. [Google Scholar] [CrossRef]
  72. Marcelis, L.F.M. Simulation of plant-water relations and photosynthesis of greenhouse crops. Sci Hortic. 1989, 41, 9–18. [Google Scholar] [CrossRef] [Green Version]
  73. Katsoulas, N.; Kittas, C. Impact of greenhouse microclimate on plant growth and development with special reference to the Solanaceae. Eur. J. Plant Sci. Biotechnol. 2008, 2, 31–44. [Google Scholar]
  74. Klaring, H.P.; Krumbein, A. The effect of constraining the intensity of solar radiation on the photosynthesis, growth, yield and product quality of tomato. J. Agron. Crop. Sci. 2013, 199, 351–359. [Google Scholar] [CrossRef]
  75. Gautier, H.; Diakou-Verdin, V.; Benard, C.; Reich, M.; Buret, M.; Bourgaud, F. How does tomato quality (sugar, acid and nutritional quality) vary with ripening stage, temperature and irradiation. J. Agric. Food Chem. 2008, 56, 1241–1250. [Google Scholar] [CrossRef] [PubMed]
  76. Perin, L.; Peil, R.M.N.; Trentin, R.; Streck, E.A.; da Rosa, D.S.B.; Hohn, D.; Schaun, W.S. Solar radiation threshold and growth of mini tomato plants in mild autumn/winter condition. Sci. Hortic. 2018, 239, 156–162. [Google Scholar] [CrossRef]
  77. El-Aidy, F.; Moutafa, S.; El-Afry, M. Influence of shade on growth and yield of tomatoes cultivated during the summer season in Egypt Lycospersicon esculentum. Plasticulture 1983, 57, 2–6. [Google Scholar]
  78. Adams, S.R.; Valdeés, V.M.; Cave, C.R.J.; Fenlon, J.S. The impact of changing light levels and fruit load on the pattern of tomato yields. J. Hortic. Sci. Biotech. 2001, 76, 368–373. [Google Scholar] [CrossRef]
  79. Gent, M.P.N. Effect of shade on quality of greenhouse tomato. Acta Hortic. 2007, 747, 107–112. [Google Scholar] [CrossRef]
  80. Fernández, E.J.; Fernández, J.; Keing, A.; Camacho, F.; Vazquez, J.J. Radiative field uniformity under shading screens under greenhouse vs. whitewash in Spain. Acta Hortic. 2000, 534, 125–130. [Google Scholar] [CrossRef]
Figure 1. Spectral power distribution (a) and transmissivity (b) of sun light (), light transmitted by a plastic cover without whitening (––) and with whitening for doses of 0.125 kg L−1 and 15.7 g m−2 (- - -), 0.250 kg L−1 and 23.7 g m−2 (·····), 0.500 kg L−1 and 34.6 g m−2 (-·-·-), 1 kg L−1 and 108 g m−2 ().
Agronomy 10 00237 g001
Figure 2. Relationship between CaCO3 concentration in the solution applied in the greenhouse cover and the dose of product remaining under the plastic (a). Transmissivity in function of the whitening dose (b) for photosynthetic active radiation corresponding to wavelengths from 400 to 700 nm (··■··), ultraviolet light 380–400 nm (-♦-) and far red radiation 700–780 nm (-▲-).
Agronomy 10 00237 g002
Figure 3. Evolution of photosynthetically active radiation (PAR) outside (----) and inside greenhouse 1 in the east sector (·····) and west sector (––): (a) From 1 to 5 February2015 without whitening in both sectors; (b) from 28 March 2015 to 3 April 2015 with a concentration of 0.125 kg L−1 in the east and 0.250 kg L−1 in the west; (c) from 16 to 22 June 2015 with a concentration of 0.250 kg L−1 in both sectors; (d) from 25 June 2015 to 1 July 2015 with a concentration of 0.500 kg L−1 in the east and 0.250 kg L−1 in the west.
Agronomy 10 00237 g003aAgronomy 10 00237 g003b
Figure 4. Evolution of air temperature outside (----) and soil surface temperature inside greenhouse 1 in the in the east (––) and west (––) sectors and temperature at 0.2 m deep in the soil in the east (- - -) and west (- - -) sectors: (a) from 1 to 7 February 2015 without whitening in both sectors; (b) from 28/3/2015 to 3/4/2015 with a concentration of 0.125 kg L−1 in the east and 0.250 kg L−1 in the west; (c) from 16 to 22 June 2015 with a concentration of 0.250 kg L−1 in both sectors; and (d) from 25 June 2015 to 1 July 2015 with a concentration of 0.500 kg L−1 in the east and 0.250 kg L−1 in the west.
Agronomy 10 00237 g004aAgronomy 10 00237 g004b
Figure 5. Evolution of air temperature outside (----) and inside greenhouse 1 (at 1 m height) in the east sector (·····) and the west sector (––): (a) from 1 to 7 February 2015 without whitening in both sectors; (b) from 28 March 2015 to 3 April 2015 with a concentration of 0.125 kg L−1 in the east and 0.250 kg L−1 in the west; (c) from 16 to 22 June 2015 with a concentration of 0.250 kg L−1 in both sectors; (d) from 25 June 2015 to 1 July 2015 with a concentration of 0.500 kg L−1 in the east and 0.250 kg L−1 in the west.
Agronomy 10 00237 g005
Figure 6. Evolution of photosynthetic activity PAR in the autumn–winter crop cycle (a,b) and the spring–summer crop cycle (c,d). West sector in greenhouses 1 (- - -) and 2 (––) with the control concentration of 0.250 kg L−1 in both crop cycles and east sector in greenhouses 1 (- - -) and 2 () with different doses. Date of the change of dose in the variable treatment (·····).
Agronomy 10 00237 g006
Figure 7. Evolution of tomato marketable production in the autumn–winter crop cycle (a,b) and the spring–summer crop cycle (c,d). East sector in greenhouses 1 (- - -) and 2 (––) with different concentrations and west sector with the control concentration of 0.250 kg L−1 in both crop cycles in greenhouses 1 (- - -) and 2 (). Date of the change of concentration in the variable treatment (·····).
Agronomy 10 00237 g007
Table 1. Characteristics of sectors east (E) and west (W) of the two experimental greenhouses and different whitening concentration CWH (kg L−1) applied in both crop cycles. Surface area of cultivated soil SC (m2) and total ventilation surface area SV/SC (%).
Autumn–Winter CycleSpring–Summer Cycle
SectorCWHSCSV/SCSectorCWHSCSV/SCSectorCWH
1E0.12560018.82E0.50045019.51–2E0.125–0.250–0.500 (Variable)
1W0.25048018.02W0.25036018.71–2W0.250 (Constant)
Table 2. Mean transmissivity (±standard deviation) for solar radiation τs and for photosynthetically active radiation τPAR measured in greenhouse 1 for the different whitening concentrations CWH (kg L−1) and doses DWH (g m−2) applied in both crop cycles.
Autumn–Winter Cycle
SectorGreenhouse 1 EastGreenhouse 1 West
PeriodDatesCWHDWHτsτPARCWHDWHτsτPAR
119/8/14–1/10/2014 *0.12515.70.46 ± 0.040.41 ± 0.030.25023.70.42 ± 0.040.39 ± 0.03
2–32/10/14–9/1/20150–Rain0.64 ± 0.040.58 ± 0.030–Rain0.64 ± 0.040.58 ± 0.03
Spring–Summer Cycle
417/2/15–26/3/2015000.61 ± 0.050.57 ± 0.04000.60 ± 0.050.56 ± 0.04
527/3/15–25/5/20150.12515.70.49 ± 0.040.46 ± 0.030.25023.70.42 ± 0.040.39 ± 0.03
626/5/15–21/6/20150.25023.70.45 ± 0.040.40 ± 0.030.25023.70.42 ± 0.040.38 ± 0.03
722/6/15–2/7/20150.50034.60.42 ± 0.030.37 ± 0.020.25023.70.40 ± 0.030.38 ± 0.02
* Values measured in another greenhouse annex to greenhouse 1 of similar characteristics [55].
Table 3. Mean and average maximum (±standard deviation) values of air temperature recorded inside the east and west sectors of the experimental greenhouse 1 at 2 m height Ti2 (°C) for the different periods P and whitening concentrations CWH (kg L−1). Air temperature at 1 m height Ti1 (°C), relative air humidity of inside air HRi (%), soil surface temperature Ts0 (°C), temperature of the soil at 0.3 m depth Ts0.3 (°C), inside solar radiation Rsi (W m−2), inside PAR radiation RPARi (W m−2), and soil heat conducted in the soil at 0.2 m qs (W m−2).
Greenhouse-SectorsGreenhouse 1 EastGreenhouse 1 West
Mean Values in the Autumn–Winter Cycle
PDatesCWHRsiTi1Ti2HRiTs0Ts0.3CWHRsiTi1Ti2HRiTs0Ts0.3
119/8/14–1/10/140.125--26.4 a ± 2.3---0.250--25.7 a ± 2.3--
22/10/14–9/12/14Rain--18.3 a ± 4.5---Rain--18.0 a ± 4.5--
310/12/14–9/1/150146.1 a ± 1512.9 a ± 1.613.1 a ± 1.780.7 a ± 3.815.5 a ± 0.717.6 a ± 0.50144.2 a ± 1512.6 a ± 1.412.8 a ± 1.580.8 a ± 3.915.5 a ± 0.617.6 a ± 0.5
Mean Values in the Spring–Summer Cycle
417/2/15–26/3/150173.3 a ± 2514.0 a ± 1.814.3 a ± 1.968.1 a ± 11.817.2 a ± 2.817.9 a ± 1.70175.7 a ± 2313.9 a ± 1.914.0 a ± 1.968.1 a ± 12.017.6 a ± 2.518.2 a ± 1.7
527/3/15–25/5/150.125235.4 a ± 3518.6 a ± 2.319.1 a ± 2.465.7 a ± 8.323.8 a ± 2.022.2 a ± 1.70.250204.7 a ± 2918.5 a ± 2.218.8 a ± 2.366.8 a ± 8.422.9 a ± 1.721.8 a ± 1.9
626/5/15–21/6/150.250310.4 a ± 2124.0 a ± 2.024.6 a ± 2.059.0 a ± 9.628.9 a ± 1.327.0 a ± 0.70.250289.7 a ± 1824.2 a ± 2.124.5 a ± 2.259.0 a ± 11.028.3 a ± 1.627.0 a ± 0.7
722/6/15–2/7/150.500288.2 a ± 928.2 a ± 1.728.7 a ± 1.856.2 a ± 11.931.4 a ± 1.029.4 a ± 0.70.250279.9 a ± 928.5 a ± 1.929.0 a ± 2.054.9 a ± 12.831.5 a ± 1.129.6 a ± 0.8
Average Daily Maximum Values in the Autumn–Winter Cycle
PDatesCWHRsiRPARiqsTiTs0Ts0.3CWHRsiRPARiqsTiTs0Ts0.3
119/8/14–1/10/140.125---34.4 b ± 3.2--0.250---33.6 ab ± 3.4--
22/10/14–9/12/14Rain---27.0 b ± 5.1--Rain---26.9 b ± 5.2--
310/12/14–9/1/150435.5 b ± 57752.5 b ± 1029.3 b ± 3.721.8 b ± 2.120.1 a ± 1.117.7 a ± 0.50403.1 a ± 56693.6 a ± 805.7 a ± 3.222.1 b ± 2.320.4 a ± 0.917.8 a ± 0.5
Average Daily Maximum Values in the Spring–Summer Cycle
417/2/15–26/3/150496.6 a ± 103943.2 a ± 19911.7 a ± 4.625.0 a ± 3.924.5 a ± 6.118.7 a ± 0.40486.0 a ± 79909.9 a ± 16010.4 a ± 6.525.3 a ± 3.425.5 a ± 4.819.1 a ± 0.4
527/3/15–25/5/150.125487.3 b ± 61933.8 b ± 10512.7 b ± 5.030.5 a ± 5.133.7 b ± 4.523.6 b ± 0.80.250395.7 a ± 62781.5 a ± 1182.9 a ± 0.929.4 a ± 4.931.3 a ± 4.223.2 a ± 0.8
626/5/15–21/6/150.250545.0 b ± 291022 b ± 5315.0 b ± 4.932.9 a ± 3.338.1 a ± 2.327.8 a ± 0.50.250483.8 a ± 33942.6 a ± 589.3 a ± 2.632.5 a ± 3.136.5 a ± 2.628.0 a ± 0.5
722/6/15–2/7/150.500457.2a ± 46847.4 a ± 8417.0 b ± 3.237.6 b ± 2.739.9 a ± 1.630.1 a ± 0.80.250442.0 a ± 30868.8 a ± 6711.7 a ± 1.937.6 b ± 3.040.2 a ± 2.130.6 a ± 0.9
a,b Values with different letters are significantly different at 95.0% confidence level (p-value ≤ 0.05).
Table 4. Mean and average maximum (±standard deviation) values of air temperature recorded inside the east and west sectors of the experimental greenhouse 2 at 2 m height Ti2 (°C) for the different periods P and whitening concentrations CWH (kg L−1).
Experimental Greenhouse 2
Autumn–Winter Cycle
SectorsEastWestEastWest
Mean valuesAverage daily maximum values
PDatesCWHTi2CWHTi2CWHTi2CWHTi2
119/8/14–1/10/140.50025.6 a ± 2.20.25027.0 b ± 2.10.50033.0 a ± 3.00.25035.0 b ± 2.2
22/10/14–9/12/14Rain17.7 a ± 4.4Rain-Rain25.1 a ± 4.5Rain-
310/12/14–9/1/15012.7 a ± 1.0013.2 a ± 1.4020.1 a ± 1.6024.5 c ± 1.1
Spring–Summer Cycle
417/2/15–26/3/150-0-0-0-
527/3/15–25/5/150.12521.1 a ± 2.90.25020.6 a ± 2.50.12530.3 a ± 5.20.25028.9 a ± 4.2
626/5/15–21/6/150.25024.7 a ± 2.40.25024.5 a ± 2.10.25031.9 a ± 4.30.25033.3 a ± 4.0
722/6/15–2/7/150.50027.8 a ± 2.10.25027.5 a ± 1.90.50036.6 a ± 3.50.25035.3 a ± 3.0
a,b,c Values with different letters are significantly different at 95.0% confidence level (p-value ≤ 0.05).
Table 5. Mean (±standard deviation) morphological parameters of the plants in both growing cycles in sectors with different whitening concentration CWH (kg L−1): Total length of the plant LT (cm), number of nodes per plant NN, length of the lowest internode LI (cm), length of the highest internode HI (cm), diameter of the stem DS (mm), and leaf area index LAI (m2 m−2).
SectorCWHLTNNLIHIDSLAI
Autumn–Winter Cycle
G1–East0.125191.9 a ± 83.214 a ± 4.09.5 a ± 2.47.1 a ± 2.511.5 a ± 2.01.2 a ± 0.5
G1–West0.250191.6 a ± 82.614 a ± 4.49.2 a ± 1.97.1 a ± 2.211.8 a ± 1.91.2 a ± 0.5
G2–East0.500188.6 a ± 81.914 a ± 4.29.8 a ± 2.36.4 a ± 2.211.5 a ± 1.91.1 a ± 0.5
G2–West0.250192.4 a ± 80.714 a ± 4.48.3 b ± 2.56.9 a ± 2.310.6 b ± 2.31.3 a ± 0.6
Spring–Summer Cycle
G1–EastVariable186.3 a ± 75.212 a ± 2.012.8 a ± 5.38.3 a ± 3.614.1 a ± 3.00.9 a ± 0.2
G1–West0.250190.4 a ± 71.313 a ± 2.414.1 a ± 4.58.4 a ± 4.814.2 a ± 2.50.8 a ± 0.2
G2–EastVariable169.2 a ± 64.811 a ± 2.012.5 a ± 3.76.4 a ± 3.314.5 a ± 3.10.9 a ± 0.3
G2–West0.250173.3 a ± 61.711 a ± 2.113.2 a ± 4.27.3 a ± 3.514.9 a ± 3.41.0 a ± 0.4
a,b Values accompanied by different letters are significantly different at the 95.0% confidence level (p-value ≤ 0.05).
Table 6. Average values (±standard deviation) of parameters measured in the plant leaves for different whitening concentration CWH (kg L−1): Photosynthetic rate PA (μmol CO2 m−2 s−1), PAR incident on leaf surface QPAR (μmol m−2 s−1), transpiration EL (mmol H2O m−2 s−1), leaf temperature Tc (°C), sub-stomatal CO2 concentration in the leaf CO (ppm), and stomatal conductance of H2O CE (mol m−2 s−1).
SectorCWHPAQPARELTcCOCE
Autumn–Winter Cycle
G1–East0.12513.4 a ± 3.0491.6 b ± 157.22.4 a ± 0.926.4 a ± 4.1326.2 a ± 90.00.20 a ± 0.08
G1–West0.25013.1 a ± 3.4432.3 a ± 153.62.3 a ± 0.726.7 a ± 2.3323.2 a ± 87.50.20 a ± 0.07
G2–East0.50012.2 a ± 3.3424.1 a ± 183.72.2 a ± 0.926.6 a ± 3.8316.7 a ± 97.70.19 a ± 0.07
G2–West0.25013.6 b ± 3.4502.2 b ± 199.82.5 a ± 1.027.2 a ± 3.4311.2 a ± 99.60.20 a ± 0.07
Spring–Summer Cycle
G1–EastVariable12.6 b ± 2.6462.6 b ± 101.43.5 a ± 0.831.6 a ± 1.7391.9 b ± 42.60.22 a ± 0.05
G1–West0.25011.6 a ± 2.1468.1 a ± 78.13.5 a ± 0.731.3 a ± 1.9376.7 a ± 21.80.23 a ± 0.05
G2–EastVariable12.3 b ± 2.5458.3 b ± 131.63.2 a ± 0.631.4 b ± 1.8378.0 a ± 8.9 0.20 a ±0.05
G2–West0.25011.02 a ± 1.6338.9 a ± 44.63.2 a ± 0.630.3 a ± 1.9374.2 a ± 20.10.23 b ± 0.05
a,b Values accompanied by different letters are significantly different at 95.0% confidence level (p-value ≤ 0.05).
Table 7. Mean (±standard deviation) quality parameters of fruit produced in both growing cycles in sectors with different whitening concentration CWH (kg L−1): Weight WF (g), equatorial diameter DF (mm), total soluble solids content TSS (°Brix), firmness FF (kg cm−2), acidity level in the juice pH and dry matter DM (%).
SectorCWHWFDFTSSFFpHDM
Autumn–Winter Cycle
G1–East0.125117.4 b ± 15.762.9 b ± 3.14.3 a ± 0.62.5 a ± 0.84.1 a ± 0.16.5 a ± 0.8
G1–West0.250111.4 a ± 16.961.9 a ± 3.64.4 a ± 0.52.7 b ± 1.14.0 a ± 0.16.5 a ± 0.9
G2–East0.500114.7 a ± 14.462.1 a ± 5.14.4 a ± 0.52.8 a ± 0.84.1 a ± 0.16.4 a ± 0.8
G2–West0.250117.9 a ± 15.763.1 b ± 2.94.5 a ± 0.53.0 b ± 0.94.1 a ± 0.16.6 a ± 0.9
Spring–Summer Cycle
G1–EastVariable282.3 a ± 59.187.0 b ± 7.74.6 a ± 0.41.7 a ± 0.54.1 a ± 0.26.2 a ± 1.1
G1–West0.250265.2 a ± 78.984.3 a ± 9.14.6 a ± 0.51.8 a ± 0.64.1 a ± 0.16.2 a ± 1.5
G2–EastVariable277.6 a ± 75.985.9 a ± 9.84.5 a ± 0.42.7 a ± 0.64.0 a ± 0.16.2 a ± 1.3
G2–West0.250285.1 a ± 81.387.0 a ± 10.34.6 a ± 0.42.8 a ± 0.74.0 a ± 0.26.3 a ± 1.6
a,b Values accompanied by different letters are significantly different at the 95.0% confidence level (p-value ≤ 0.05).
Table 8. Mean (±standard deviation) marketable YM and total yield YT (kg m−2) of tomato in both growing cycles in sectors whit different whitening concentration CWH (kg L−1). Increase of production for marketable ΔYM and total yield ΔYT (%).
SectorCWHYMYTΔYMΔYT
Autumn–Winter Cycle
Greenhouse 1–East0.1255.95 ± 0.416.08 ± 0.44+3.8+4.3
Greenhouse 1–West0.2505.73 ± 0.325.83 ± 0.31
Greenhouse 2–East0.5006.29 ± 0.406.37 ± 0.40
Greenhouse 2–West0.2506.66 ± 0.406.80 ± 0.41+5.9+6.7
Spring–Summer Cycle
Greenhouse 1–EastVariable4.16 ± 0.306.04 ± 0.36
Greenhouse 1–West0.2505.10 ± 0.296.74 ± 0.33+22.6+11.6
Greenhouse 2–EastVariable5.31 ± 0.206.30 ± 0.23
Greenhouse 2–West0.2505.42 ± 0.336.30 ± 0.33+2.1

