Article

Characterization and Grouping of All Primary Branches at Various Positions on a Rice Panicle Based on Grain Growth Dynamics

1
Key Laboratory of Crop Cultivation and Farming System, Guangxi University, Nanning 530004, China
2
Southern Regional Collaborative Innovation Center for Grain and Oil Crops (CICGO), Hunan Agricultural University, Changsha 410128, China
*
Author to whom correspondence should be addressed.
Agronomy 2020, 10(2), 223; https://doi.org/10.3390/agronomy10020223
Submission received: 3 January 2020 / Revised: 30 January 2020 / Accepted: 31 January 2020 / Published: 4 February 2020

Abstract

:
Grain filling can directly influence rice yield. However, there is limited information on the growth relationship among grains at different positions on the entire panicle during grain filling. In this study, field experiments were conducted in 2014–2015 to compare the growth dynamics of grains at various positions for two rice cultivars (Nongle 1 and Guifeng 2). The results showed that a high similarity and a slow–fast–slow trend of dry-matter accumulation occurred in all primary branches. However, the maximum grain growth rates of the top primary branches were 86% and 44% higher than basal primary branches of Nongle 1 and Guifeng 2, respectively. Similarly, the maximum final grain weights were 32% and 18% greater in the top primary branches than in the basal primary branches of Nongle 1 and Guifeng 2, respectively. In contrast, the active grain filling duration was 1.5 and 1.3 times longer in the basal primary branches than the top primary branches of Nongle 1 and Guifeng 2, respectively. The time to reach the maximum rate of grain growth of the basal primary branches for Nongle 1 and Guifeng 2 was 2.2 and 2.5 times longer than those of the top primary branches, respectively. Based on cluster analysis of growth characteristics of all primary branches, Group I (superior primary-branches) was considered to be the fastest for grain filling and greatest for dry matter weight, followed by Group II (medium primary-branches). The poorest growth occurred in Group III (inferior primary-branches). Therefore, the yield of poor-filling grains at the basal panicle could be achieved primarily by improving the growth of Group III.

1. Introduction

Rice (Oryza sative L.) is the most important food crop worldwide. It is a staple food for about 3 billion people [1], and it provides 76% of the calories for Southeast Asian people [2]. Nearly 90% of the world’s rice is obtained from Asia (almost 640 million tons), and China and India are the major contributors [3]. The increase in the population and the improvement of living standards has resulted in the demand for further enhancing rice yield and quality.
The formation process of grain weight and rice yield is essentially dependent on grain growth and grain filling. The flowerings of spikelets and grain growth on the rice panicle have shown an obvious sequence in time [4]. It is commonly known that the weight of superior grains is heavier than that of inferior grains. Generally, the superior spikelets are located on the primary branches of the top rice panicle or top rachides, they flower earlier and have the advantages of fast grain filling rate, maximum assimilate enrichment, and high grain weight [5,6]. In contrast, the inferior spikelets are located on the secondary branches of the basal panicle or bottom rachides [5,6]. Inferior spikelets flower later, have poor grain plumpness, minimum weight, and poor cooking quality [7,8].
There are significant differences (about 25%) between superior and inferior grains in seed setting rate and grain plumpness. In addition, inferior grains can account for about one-third of rice panicle grains, and result in a decrease in both the 1000-grain weight and the seed setting rate, which further diminishes the high-yield potential of rice [6]. This is mainly caused by the asynchronous grain filling of superior and inferior grains in different positions [9,10,11]. Ishimaru et al. [10] found via morphological analysis that inferior grains located on the secondary branches of the bottom panicle experienced a lag time to begin filling, whereas superior grains have the highest grain filling rate and heaviest dry-matter accumulation in the rice panicle over the same period. This growth advantage of rice often leads to a higher seed setting percentage and a higher grain weight in the grains from the top of the rice panicle than the basal grains on the panicle [12,13,14,15]. A phenomenon similar to grain-grouping at different positions of the panicle during the grain filling stage is also common in other cereal crops; for example, inferior grains on the upper ear flower later and accumulate dry matter slower than superior grains on the middle and basal ear in wheat and maize [16,17,18,19,20]. They are characterized by both slower and later grain filling in inferior grains compared with superior grains, which ultimately results in low grain weight.
However, previous studies have used different definitions of superior and inferior grains. Nagato [21] first reported that superior grains are located in the middle and upper parts of a panicle which start flowering earlier and accumulate assimilates quickly, whereas inferior grains are located in the lower part of a panicle, flowering late and accumulation rate was slower. Wang et al. [22] then proposed that superior grains are defined as those located on the three topmost primary branches, but those on the secondary branches are excluded, and inferior grains are located on the secondary branches of the three basal primary branches. Peng et al. [23] confirmed that superior grains are often localized in the middle of the primary branches, whereas inferior grains are mostly located on the last two secondary branches of the lower half of the panicle, according to the order of the grain weight. Nevertheless, Fu et al. [15] and Jiang et al. [24] suggested that superior spikelets flower on the first two days after flowering, and are localized at the primary branches of the top panicle, and inferior spikelets flower on the last two days before the end of flowering, and are located on the secondary branches of the basal panicle. Despite many efforts made by researchers, there is still no clear standard for the classification of superior and inferior grains on the whole panicle. It has been concluded from previous studies that superior and inferior grains are determined by the flowering time, grain weight, and the position of the grains on the panicle; that is, superior grains, which are those located on the primary branch at the upper panicle, have an earlier flowering time and heavier weight [22,25,26,27,28], whereas inferior grains are usually formed on secondary branches at the basal panicle, and are characterized by later flowering and lower grain weight [4,22]. The differences between superior and inferior grains in grain quality and weight are primarily caused by varying grain fillings at different positions [28]. A lot of research has mainly focused on characteristics of grain filling, physiological and biochemical mechanisms [4,5,6] for limited parts of the panicle, such as superior and inferior grains, instead of the whole rice panicle. Furthermore, they classified superior grains and inferior grains according to their own experience and subjective judgment. However, (i) where is the actual position of superior grains and inferior grains on the rice panicle for different rice cultivars? (ii) On what basis was it grouped? (iii) Is it reasonable to divide the whole rice panicle into two groups of superior and inferior grains? Therefore, it is of great significance to sort out these ambiguities by evaluating the characteristics of all the grains at different positions on the whole panicle and to establish the classification for superior and inferior grains.
Moreover, the increasing trend of dry-matter accumulation of cereal crops from flowering to maturity is generally an “S” curve and is usually fitted by the logistic equation, Gompertz equation, Mitscherlich equation, polynomial regression equation, and Richards equation for the growth process of plants [29,30]. However, the Richards model has more equation parameters than other growth models and includes three famous models (logistic, Gompertz, Mitscherlich) for plant growth according to the value of N in Richards equation [30]. It means that this model has a wider and more adaptive application for truly simulating the growth process of various plants with more equation parameters [30]. Furthermore, the parameters of the Richards model provide a reasonable and practical meaning to explain and predict plant growth [30]. In a study on the grain filling characteristics of superior and inferior grains, Zhu et al. [31] found that the Richards model well fitted the increasing weight of superior and inferior grains, and the initial growth power and maximum grain growth rate in superior grains were higher than in inferior grains. Likewise, Zhang et al. [32] studied that the grain-filling process of inferior grains was well fitted by the Richards equation under different treatments of controlling water application during grain filling, and dry-matter accumulation of inferior grain in the moderate soil drying treatment markedly increased more than in other treatments. Many previous studies of superior and inferior grains were limited to two extreme parts of a panicle, and few considered the actual grain filling of the whole panicle. There is limited information available on the relationship and characteristics of grain growth for all primary branches at different positions on the whole rice panicle, and a lack of methods to classify grains on the panicle by objective judgment. The key purpose of this study was to determine the grain-filling characteristics of all primary branches at different positions and to establish the method to classify grains according to the dry-matter accumulation of all primary-branches at different positions.

2. Materials and Methods

2.1. Experimental Site and Cultivar Details

The field experiment was conducted at the experimental farm of Guangxi University (22°51′ N, 108°17′ E, 78 m a.s.l.), Guangxi Province, China in the late season of 2014 and in the early season of 2015. The soil of the experimental field was a Ultisol (U.S. taxonomy) with a pH of 6.36, organic matter (35.7 g kg−1), NaOH hydrolysable N (129.52 mg kg−1), Olsen P (25.61 mg kg−1), and NH4OAc extractable K (95.5 mg kg−1). Monthly average air temperatures and rainfall from March to November over two years are presented in detail in Figure 1. Based on the monthly meteorological data, the rainfall was 793.00 mm in the late season and 772.10 mm in the early season. The average temperature was 26.10 °C in the late season and 25.81 °C in the early season.
The test crops were indica cultivars Nongle 1 and Guifeng 2, which have extensive adaptability, a suitable growth period, and are widely grown in many areas of Guangxi province. They are also stable in inheritance and could be reserved for subsequent experiments.

2.2. Experimental Design and Crop Management

The experiment was conducted in a completely randomized block design with three replications for each cultivar; there were six experimental plots for the two cultivars. Each experimental plot was 8 m long and 7 m wide, with a total plot size of 56 m2. Pre-germinated seeds were sown in a seedbed on 19 July for the late season, and on 13 March for the early season. After 20 days, seedlings were transplanted at a hill spacing of 0.3 m × 0.1 m with four seedlings per hill. Urea was used for N fertilizer at the rate of 150 kg N ha−1. It was applied in a split with 50% at basal (1 day before transplanting), 30% at early tillering (6 days after transplanting), and 20% at panicle initiation. Potassium chloride was used as the K fertilizer at a rate of 120 kg K2O ha−1. It was applied in a split with 50% at basal and 50% at early-tillering. For phosphorus fertilizer, superphosphate was applied as a basal with a rate of 55 kg P2O5 ha−1. The experimental field was kept flooded from the day of seedlings being transplanted until 6 days before maturity. Insects and diseases were intensively controlled to avoid yield loss.

2.3. Sampling and Measurements

Five hundred panicles that headed on the same day were chosen and tagged in each plot. Most of the rice panicles for Nongle 1 and Guifeng 2 included 13 and 14 primary branches in the field, respectively. The panicles of Nongle 1 including 13 primary branches and the panicles of Guifeng 2 including 14 primary branches were regarded as target samples. One hundred target panicles selected from tagged panicles in each plot were sampled at 7-day intervals from the anthesis (0 days) to the maturity stage (28 days after heading). The grains from the primary branches at the top to the base of the panicle were labeled from B1 to B13 for Nongle 1, and from B1 to B14 for Guifeng 2 (Figure 2). Therefore, B1 represented the first primary-branch grains from the topmost panicle, and B13 or B14 represented the last primary-branch grains from the lowest panicle. Grains from the same primary branch were combined as one sample. These were dried in an oven at 105 °C for 30 min, and then at 70 °C to a constant weight to measure the grain weight.

2.4. Mathematical Simulation of Grain Growth

The Richards equation [29,31] was used to fit the grain filling process, and the basic parameters of the equation in the tested rice cultivars were calculated as follows:
Y = A ( 1 + B e k t ) 1 / N
where Y is the weight (g per 100 grains), A is the final grain weight (g per 100 grains), t is the number of days after anthesis, and B, k, and N are the parameters determined by the regression equation. k is the parameter of growth speed, B and N do not have obvious biological meaning, but they can decide flexibility and position of growth curve; R2 is the coefficient regarding the fitfulness of the equation.
The grain growth rate (V) was calculated from the derivation of Equation (1):
V = ( k Y / N ) [ 1 ( Y / A ) N ]
Based on the above equations, the secondary parameters were calculated by the methods used by Zhu et al. [31] to describe the characteristics of grain growth as follows:
T m a x = ( I n B I n N ) k
Y m a x = A ( N + 1 ) 1 / N
V m a x = ( k Y m a x / N ) [ 1 ( Y m a x A ) N ]
R 0 = k N
D = 2 ( N + 2 ) k
I = Y m a x A
where Tmax is the time of the maximum grain growth rate (days after anthesis), Ymax is the grain weight of the maximum grain growth rate (g per 100 grains), Vmax is the maximum grain growth rate (g per 100 grains d−1), R0 is the initial growth power that refers to the growth potential of the fertilized ovary, D is the active grain filling duration (days after anthesis), and I is the ratio of Ymax to A.
There are two inflection points t1 and t2 (days after anthesis) that are calculated with the grain growth rate Equation (2) to divide the grain filling process into beginning (0–t1), middle (t1t2), and end (t2t3) stages. Additionally, t3 (days after anthesis) is the time point at which the grain weight is close to 99% of A, and the grain filling is assumed to end. The formulas are as follows:
t 1 = ln ( N 2 + 3 N + N N 2 + 6 N + 5 2 B ) K
t 2 = ln ( N 2 + 3 N N N 2 + 6 N + 5 2 B ) K
t 3 = ln [ ( 100 99 ) N 1 B ] K

2.5. Statistical Analysis

The software SPSS 19.0 was used to fit the grain filling process equation, the correlation analysis, and the cluster [33] analysis of the data. Figures were plotted using Sigma Pot 12.5 software. Means of cultivars were compared based on the least significant difference test at the 0.05 probability level.

3. Results

3.1. Dynamics of Dry-Matter Accumulation for Primary-Branch Grains

The dynamics of dry matter accumulation of the grains of all the primary branches were plotted (Figure 3A–D) using the Richards growth equation, and the grain growth rates of all the primary branches were calculated according to the dry-matter accumulation and grain growth time (Figure 3E–H). The dry matter of grains of all the primary branches in the tested cultivars accumulated slowly in the early stage, quickly in the middle stage, and again slowly in the latter stage. The dry-matter accumulations of all the primary-branch grains gradually decreased from the top to the base of the panicle in the same period. The difference in dry-matter accumulation between primary-branch grains at different positions was small at the early stage of grain growth, the greatest at the middle stage and then smallest at the latter stage (Figure 3A–D). What is more, the maximum grain growth rates of B1–B6 in 2014 and B1–B12 in 2015 for Nongle 1, and those of B1–B7 in 2014 and B1–B9 in 2015 for Guifeng 2, were achieved between 7 and 14 days after anthesis, while the maximum grain growth rates of B7–B13 in 2014 and B13 in 2015 for Nongle 1, and those of B8–B14 in 2014 and B10–B14 in 2015 for Guifeng 2, were later achieved between 14 and 21 days after anthesis (Figure 3E–H). It was found that the main differences in the primary-branch grains at different positions were the starting time of grain growth, the maximum grain growth rate, and the time taken to reach the maximum grain growth rate. The grain growth rates of the primary branches at different positions decreased gradually, and the number of days taken to reach the maximum grain growth rate increased gradually from the top to the base of the panicle.

3.2. Mathematical Simulation of Grain Growth

The Richards equation was used to fit the growth process of all the primary-branch grains and the whole-panicle grains of Nongle 1 and Guifeng 2. The determinant coefficients R2 were both greater than 0.990 (Table 1), which indicates that the growth processes of grains of all the primary branches in both Nongle 1 and Guifeng 2 were very similar, and they were suitable for Richards equation fitting. The values of the final grain weight (A) at the maturity of the primary branch grains decreased gradually from the top to the base of the panicles. It was concluded that the maximum values of A at the upper primary branches of Nongle 1 and Guifeng 2 were 32% and 18% higher than the minimum values of A at the lower primary branches, respectively (Table 1).

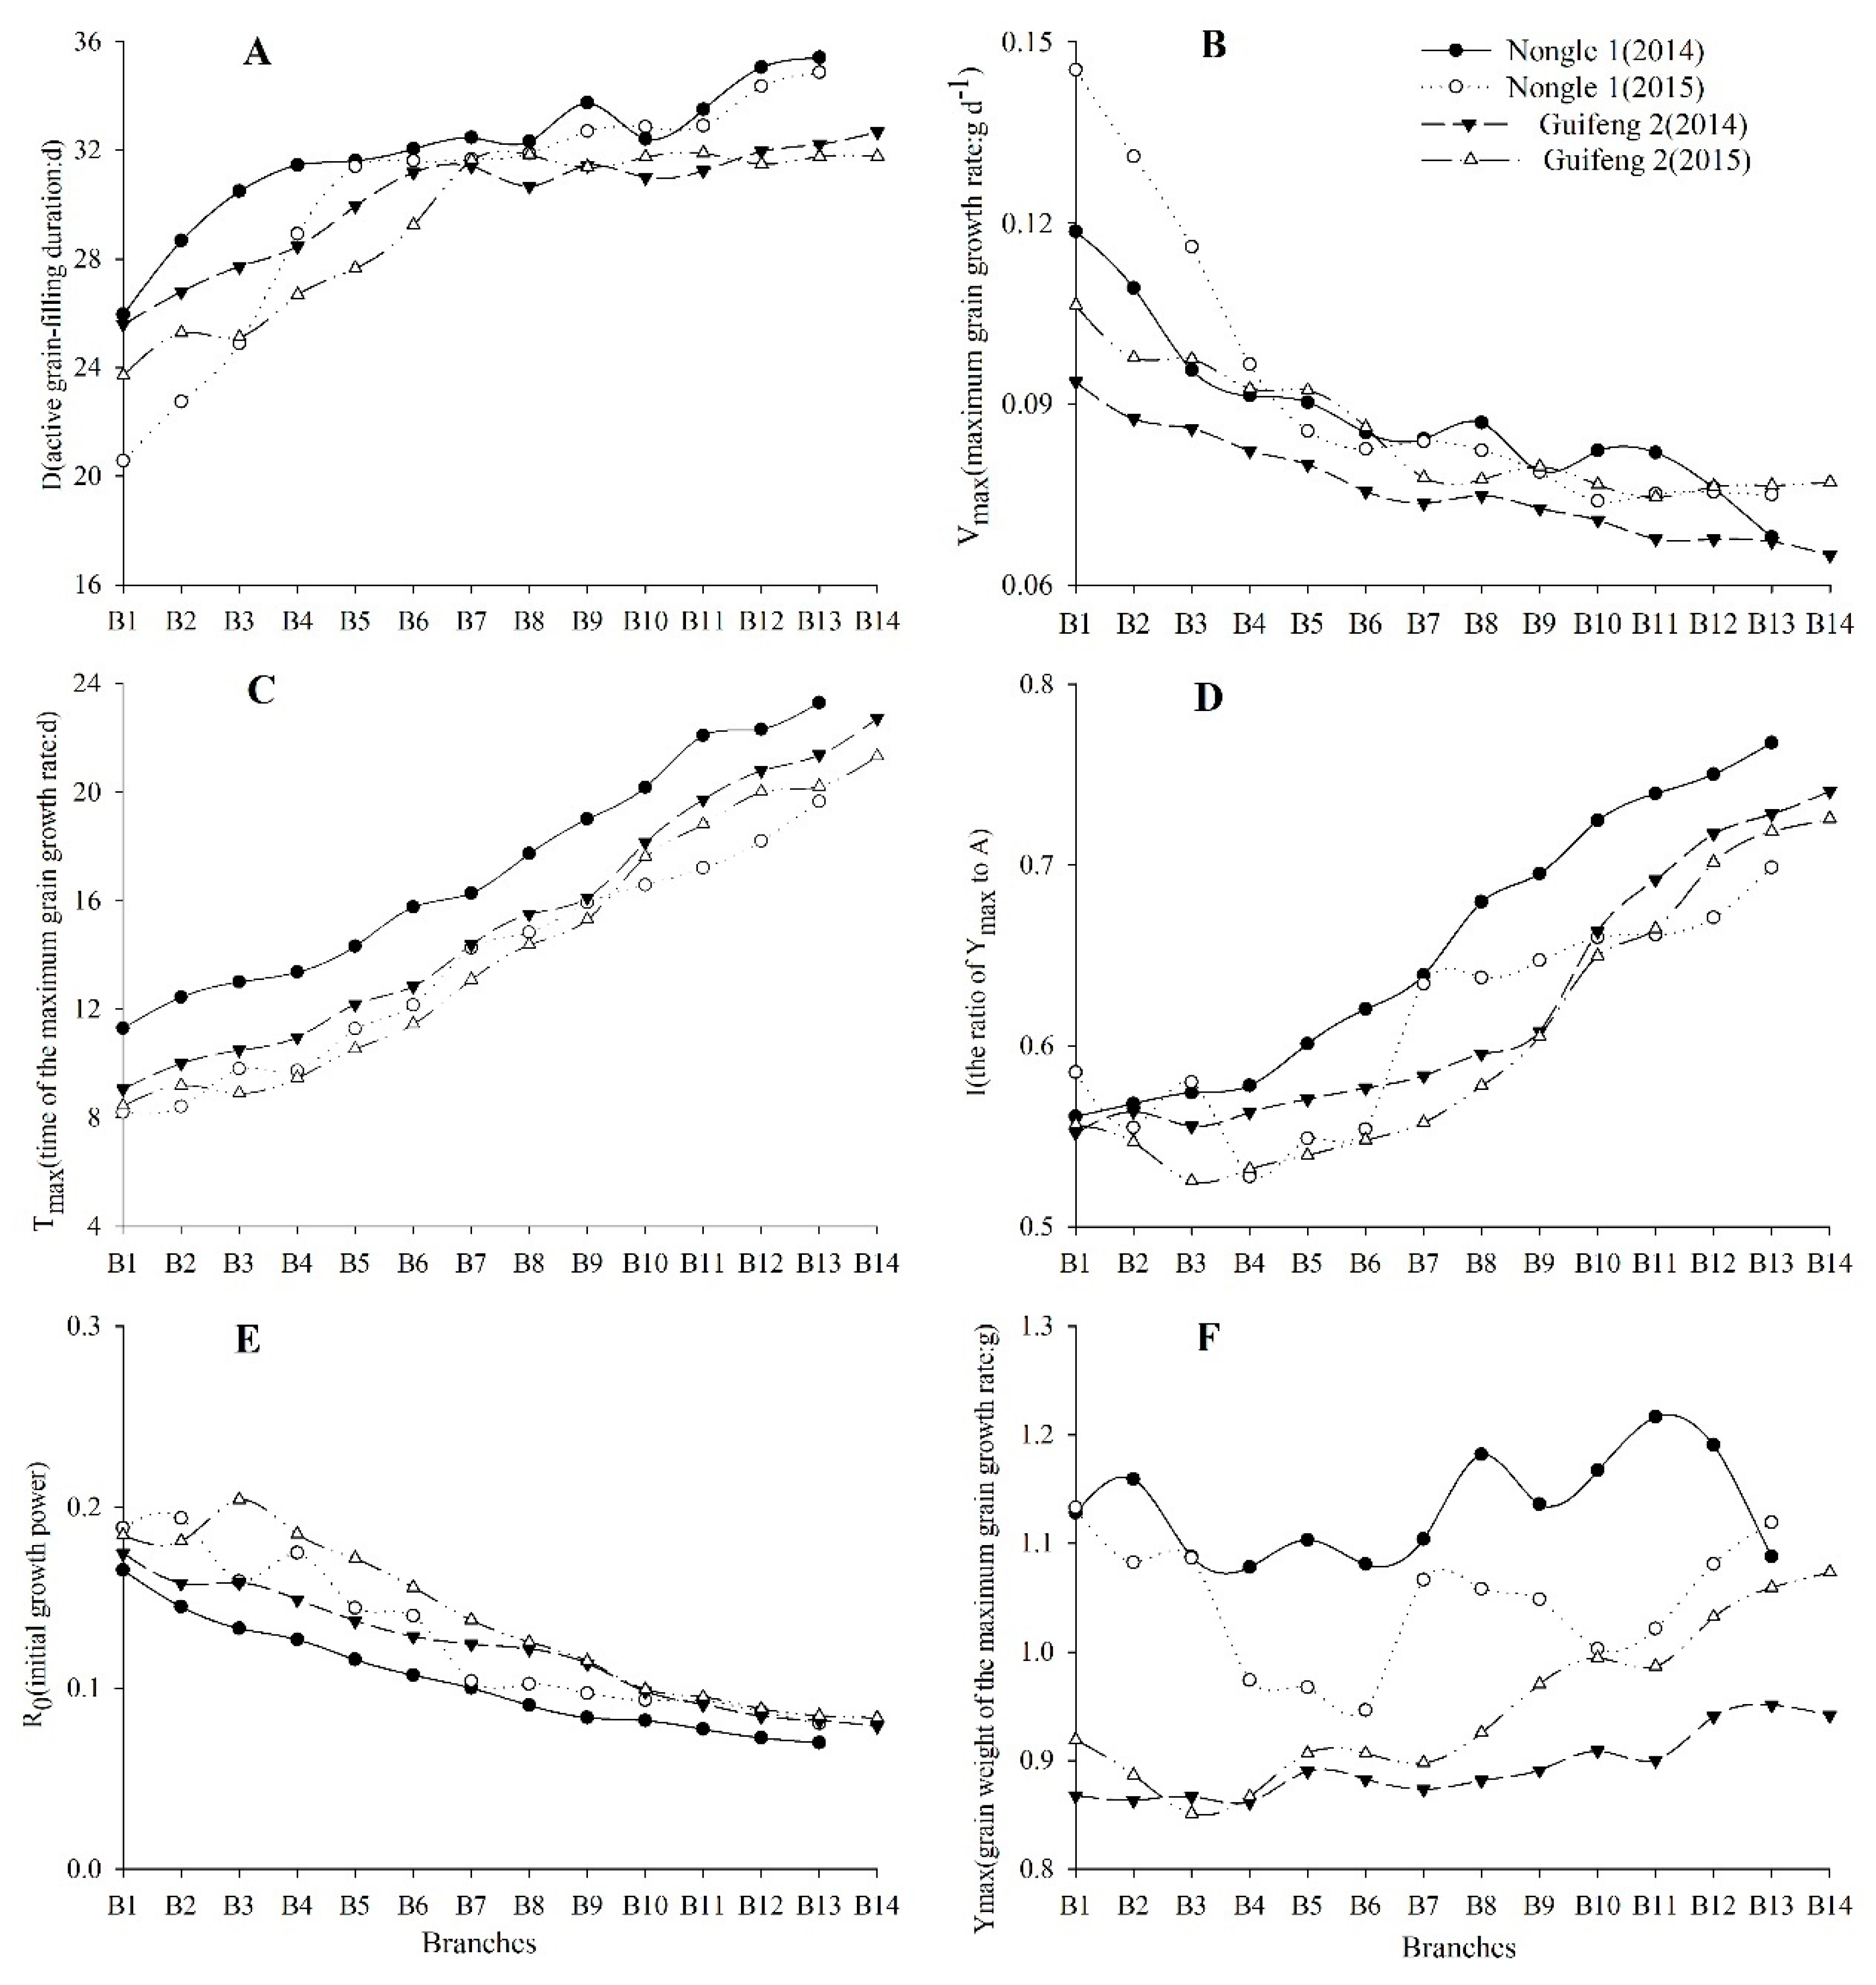
3.3. Characteristics of Growth Parameters

The values of the initial growth power (R0) and the maximum grain growth rate (Vmax) of the primary-branch grains showed a decreased tend from the top to the base of the panicles of both cultivars during both years (Figure 4B,E). In our study, the values of Vmax of the upper primary branch grains of Nongle 1 and Guifeng 2 were 86% and 44% higher than those of the basal primary branch grains, respectively. On the contrary, the values of the active grain filling duration (D), the time of the maximum grain growth rate (Tmax), and the ratio of Ymax to A (I) of the primary-branch grains exhibited an obvious increasing trend from the top to the base of the panicles (Figure 4A,C,D). The maximum values of D of the grains at the lowest primary branches of Nongle 1 and Guifeng 2 were 1.5 times and 1.3 times higher, respectively than the minimum values of D of the grains at the uppermost primary branches. The Tmax of the basal primary branch grains of Nongle 1 and Guifeng 2 were 2.2 times and 2.5 times later, respectively than those of the upper primary branch grains. However, the values of the grain weight of the maximum grain growth rate (Ymax) of the primary-branch grains gradually reduced from the base to the top of the panicle (Figure 4F).

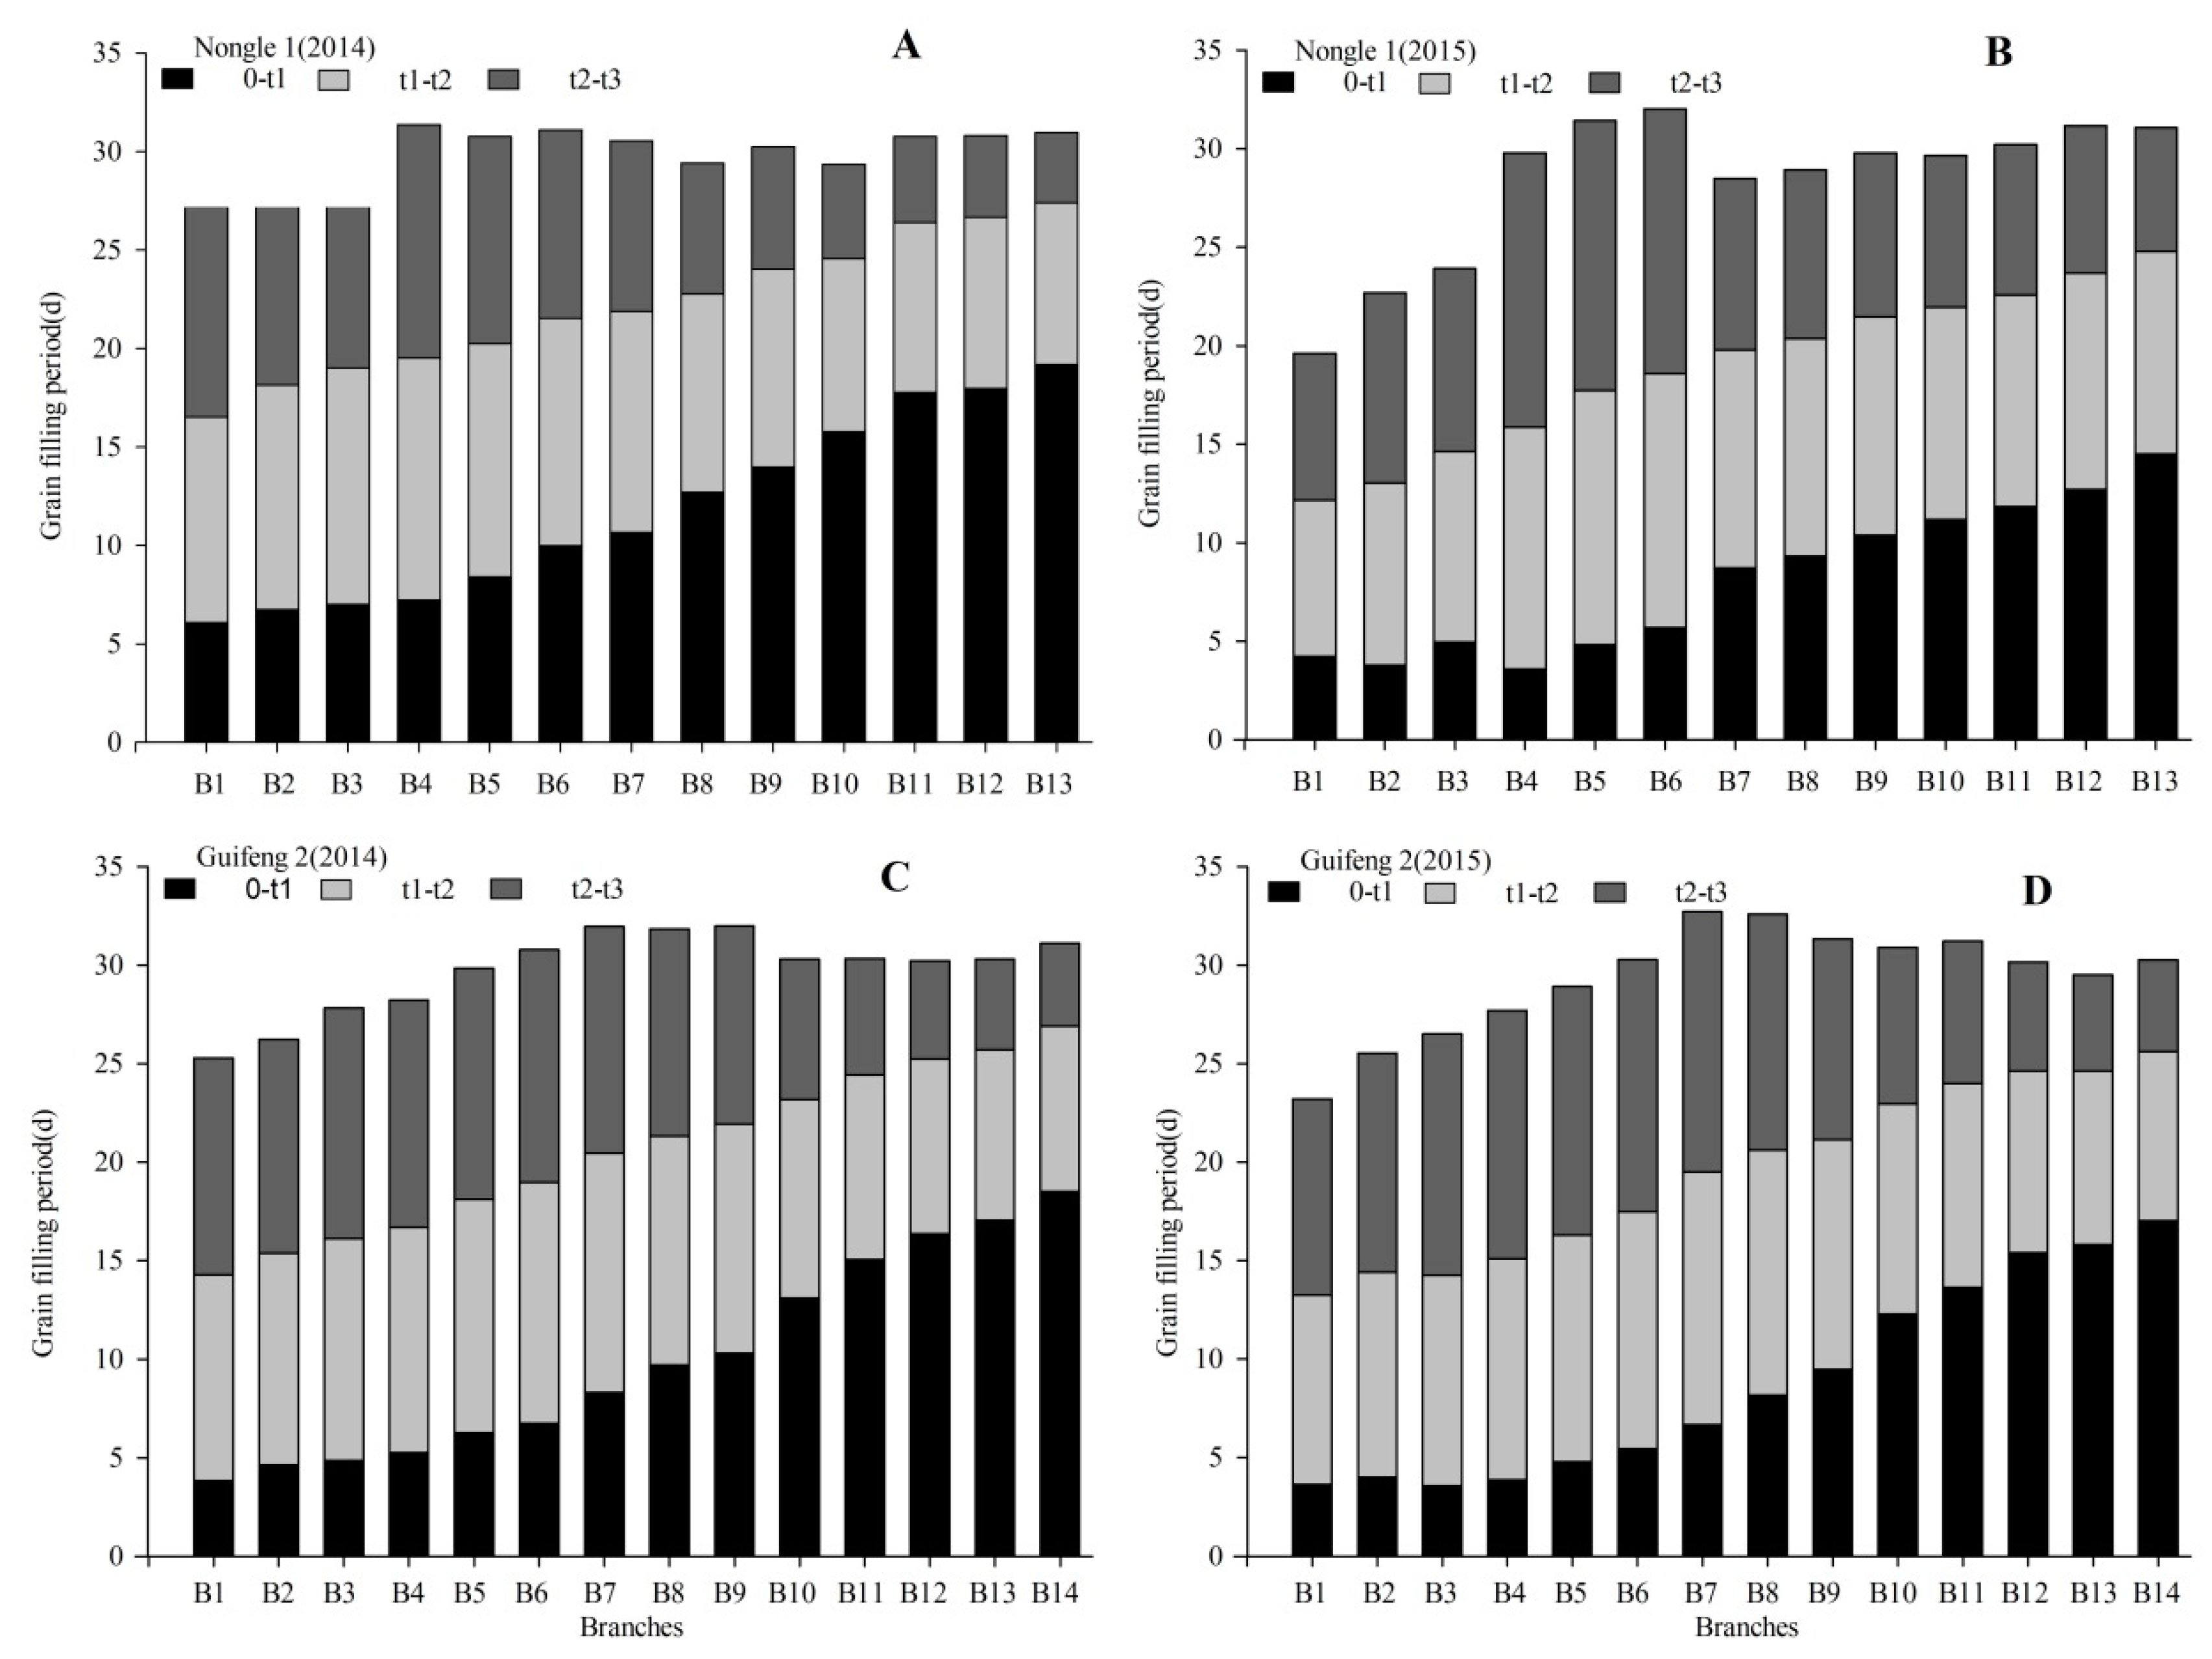
3.4. Division of Growth Stages

The beginning (0–t1), middle (t1t2), and end (t2t3) of grain-filling stages represented gradual, fast, and slow accumulation of dry matter, respectively (Figure 5); 0–t1, t1t2, and t2t3 of all the primary-branch grains of Nongle 1 were, respectively, 6.1 to 19.2 days, 8.2 to 12.3 days, and 3.6 to 11.9 days in 2014, and 3.6 to 14.5 days, 7.9 to 12.9 days, and 6.3 to 13.9 days in 2015 (Figure 5A,B). Those of Guifeng 2 were, respectively, 3.8 to 18.5 days, 8.4 to 12.2 days, and 4.2 to 11.8 days in 2014, and 3.6 to 17.0 days, 8.6 to 12.8 days, and 4.6 to 13.2 days in 2015 (Figure 5C,D).
The days of 0–t1 had the largest changing range than the other two stages from the top primary branch to the basal primary branch on the panicle. The days of 0–t1 increased obviously from top to base on the panicle. The 0–t1 was the longest for the basal primary branch. The days of t2t3 had a larger changing range than t1t2 from the top primary branch to the basal primary branch on the panicle. However, the changing trends of t1t2 and t2t3 was the same from top to base on the panicle, and the days of t1t2 and t2t3 was the highest for the middle primary branches.

3.5. Correlation of Dry-Matter Accumulation between Primary-Branch Grains

There was a significant positive correlation of grain dry-matter accumulation between the primary branches, and the values of the correlation coefficients were related to the distance between the primary branches (Table 2 and Table 3). The values of the correlation coefficients decreased with the increase of the distance between primary branches. Therefore, the dry-matter accumulation of the first primary-branch grains was most closely related to that of the second primary-branch grains, but least closely related to that of the lowest primary-branch grains.
There was a significant positive correlation of the dry-matter accumulation between the whole panicle grains and primary-branch grains. The value of the correlation coefficient was largest in dry-matter accumulation between the whole-panicle grains and the middle primary-branch grains (B6 and B7) in 2014 and (B5 and B6) in 2015 for Nongle 1, and that was most closely related to the middle primary-branch grains (B6 and B7) in 2014 and in 2015 for Guifeng 2 (Table 2 and Table 3).

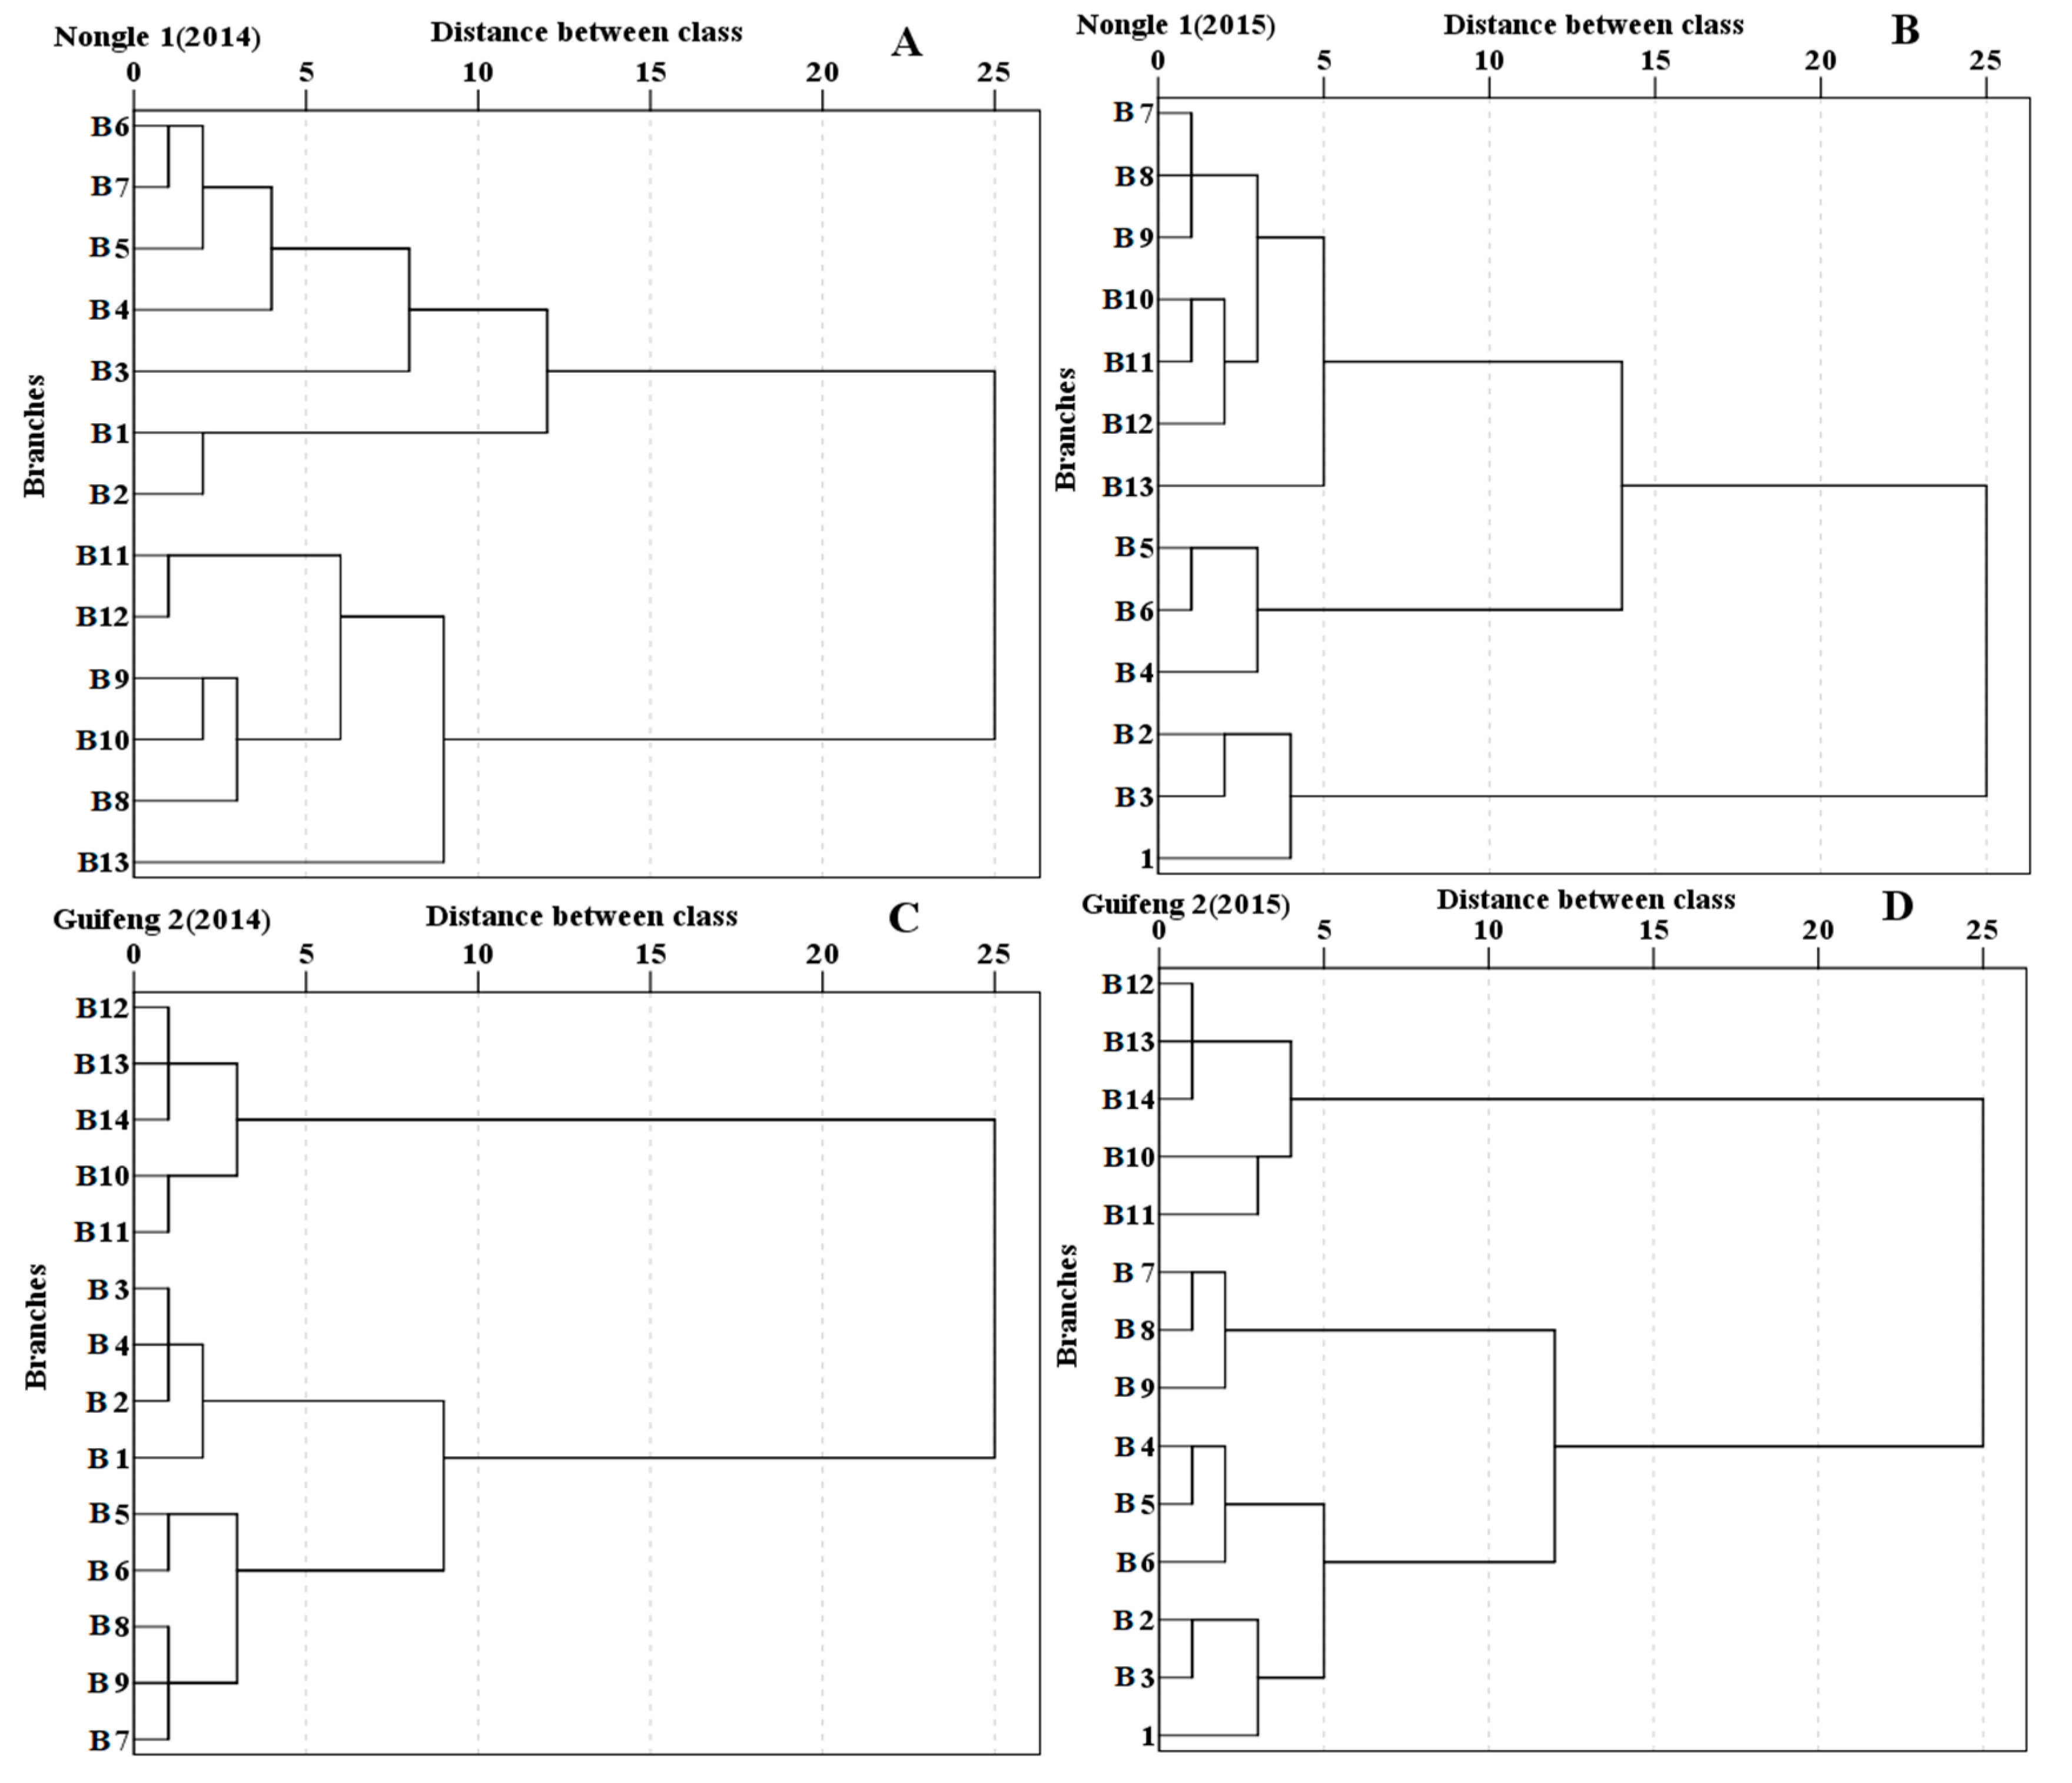
3.6. Grouping of Primary Branches

Cluster analysis can partition grains of all the primary branches into several groups according to the similarities and differences of specific traits. All grains on the panicle regarding an individual primary branch as a unit underwent cluster analysis according to the grain-growth parameters of the primary branches by using the methods of class average and Euclidean distance. Grains of all primary branches on the panicle of Nongle 1 (Figure 6A,B) and Guifeng 2 (Figure 6C,D) were clustered into three groups. Details of the three groups were provided in Table 4.
The growth of the three groups of grains was simulated mathematically by the Richards equation, and the grain filling parameters of each group were obtained. There were significant differences in grain growth among the three groups. The values of A, Vmax, and R0 in Group I were the highest, followed by Group II, and the lowest values occurred in Group III. The values of A in Group I for Nongle 1 and Guifeng 2 were 10.4% and 2.2% greater than in Group II, respectively; those in Group II were 12.8% and 10.5% greater than in Group III, respectively. The differences of Vmax and R0 between groups were particularly significant. For Nongle 1 and Guifeng 2, the values of Vmax of Group I were 31.4% and 17.8% higher than those of Group II, respectively; the values of Vmax of Group II were 6.4% and 3.4% higher than those of Group III, respectively. The values of R0 in Group I for Nongle 1 and Guifeng 2 were 42.6% and 48.6% greater than in Group II, respectively; those in Group II were 62.9% and 52.8% greater than in Group III, respectively (Table 4). However, the values of D, Tmax, and 0–t1 exhibited the opposite trend. Those parameters in Group III were the highest, followed by Group II, and the lowest values occurred in Group I. The differences between Tmax and 0–t1 among groups were particularly significant. For Nongle 1 and Guifeng 2, respectively, the days of Tmax in Group II were 2.9 days and 4.8 days longer than in Group I; those in Group III were 6.7 days and 7.1 days longer than in Group II, respectively. The days of 0–t1 in Group II for Nongle 1 and Guifeng 2 were 2.1 days and 4.3 days longer than in Group I, respectively; the days of 0–t1 of Group III were 8.7 days and 9.2 days longer than those of Group II, respectively. The days of t1t2 between Group I and Group II were not significantly different (except Nongle in 2015), whereas those in Group III for Nongle 1 and Guifeng 2 were 2.4 days and 3.3 days shorter in Group I, respectively. The days of t2t3 between Group I and Group II were not significantly different, whereas those in Group III for Nongle 1 and Guifeng 2 were 8.0 days and 8.9 days shorter than in Group I, respectively (Table 4).

4. Discussion

Previous studies showed that grain filling at different positions of the rice panicle has shown obvious sequence in time [4]. The spikelets on the upper panicle are early flowering, filling fast and producing heavier grains, whereas the spikelets on the lower panicle are late flowering, filling slowly and poorly [34,35,36]. However, previous studies on grain filling at different positions of the rice panicle were limited to examining superior grains on the topmost panicle and inferior grains on the bottom panicle, not all grains on the whole panicle were studied. Additionally, they took the superior and inferior grains as samples by their own judgment of experience and subjectivity before the study. This resulted in a lack of information on the relationship of grain filling between all grains at different positions of the panicle and grouping for all the grains on the whole panicle so far. Thus, the objective of the present research was to determine the grain-filling characteristics of all primary branches at different positions and to establish the method to classify grains according to the dry-matter accumulation of all primary-branches at different positions.
In this study, the grain-growth characteristics for all branches on the panicle of two rice cultivars were compared via field testing in 2014 and 2015. Our results showed that grains of all primary branches of both cultivars exhibited a high similarity in growth. The slow–fast–slow trend was recorded for dry-matter accumulation during the whole grain-filling stage because all primary branches on the panicle showed an increasing and decreasing trend for the grain-filling rate (Figure 3). Similar work reported that the dry-matter accumulation of the whole panicle, superior grains and inferior grains all exhibit a slow–fast–slow trend at the grain filling stage, and their growth processes can be simulated by the Richards equation [36,37]. In the present study, our results indicated that it was most closely related between the two adjacent primary branches in dry-matter accumulation, whereas it was least closely related between two primary branches far apart (Table 2 and Table 3). In addition, dry-matter accumulation of the whole-panicle grains was most closely related to that of the middle primary-branch grains.
However, the grain growth of all primary branches exhibited significant differences due to the different positions and flowering times. Firstly, the final grain weight (A) of the grains decreased in turn from the top to the base of the primary branches, and there was a significant difference in A between the primary branches. A similar finding was made by Liang et al. [38], who reported that a great difference in the final grain weight at maturity was observed between superior and inferior grains. A possible explanation for this is a higher number of cells in superior spikelets than inferior spikelets because the cell-division activity is vital in attracting assimilation to sink organs in the early stages of development [39,40]. Secondly, our results showed that the values of Vmax and R0 on the upper primary-branch grains were significantly greater than those on the basal primary-branch grains (Figure 4B,E). This was because the upper primary branch grains could compete for more nutrients at the beginning stage through higher Vmax and R0, whereas the basal primary-branch grains might experience a long lag period before starting to accumulate dry matter at this stage [36]. Our present study indicated that Tmax of the basal primary-branch grains was significantly later than those of the upper primary-branch grains (Figure 4C). Thirdly, D increased significantly from the top to the base of the primary branches (Figure 4A). Furthermore, the period of grain filling can be divided into three stages: the beginning stage, middle stage, and the end stage, as analyzed by the Richards equation [24]. The days of the three stages of the primary branches varied significantly depending on the position of the primary-branch (Figure 5). The most notable feature was that the days of the beginning stage at the lowest primary branch was four times longer than that at the uppermost primary branch. A possible explanation for this is that the lowest spikelets might have a long lag period at the early grain-filling stage [36] caused by low Vmax and R0. Then, the long lag period may further extend D and 0–t1 in the lowest spikelets. Last, the grains of the whole panicle [37,41], the primary-branch grains [42], and the single grains [20,43], all exhibited a slow–fast–slow trend for growth rate. This means that there must be a “peak” period caused by Vmax and Tmax in rice grain growth for all grains.
The possible reasons for the significant difference in grain growth between all the primary branches in rice are related to the flowering habits and the location of spikelets. On the one hand, the spikelets of the top branch usually blossom one to two days after heading, whereas those of the basal branch blossom later after heading [22,27]. Huang et al. [6] reported that the spikelets of the top branch blossom on the day of heading, where those of the basal branch bloomed seven days after heading. The upper spikelets of rice spikes exhibited high physiological activity and a strong ability to accumulate substances transported from the source [44,45,46], whereas poor grain filling of the inferior spikelets from the base panicle was caused by the low sink strength [38]. The low activity of starch synthesis-related enzymes in endosperm could obviously reduce grain weight by the decline of starch synthesis in inferior spikelets [38]. In addition, Panigrahi et al. [47] stated that poor quality and low grain weight in inferior spikelets were caused by high ethylene production in inferior spikelets which suppresses expression of genes encoding endosperm starch synthesizing enzymes. However, the poor physiological and biochemical activity in inferior spikelets can be improved by alternate wetting and moderate soil drying (AMD) which could enhance grain weight, grain filling rate, protein expression, and transcript level of the gene encoding these proteins in the inferior spikelets [48]. Furthermore, AMD could increase the remobilization of non-structural carbohydrates by 19.6–36.7% [49] and remobilize the nitrogen assimilated from source to the grain through coordinately expressed proteins involved in photosynthesis, systematic senescence, and other metabolisms [50]. Similarly, the moderate increase of nitrogen fertilizer application in the later growth stage [24] and spraying exogenous ABA on grains at the active grain filling stage [51,52,53] can effectively improve physiological activity in inferior spikelets. These findings indicate that the flowering time and physiological activity of the spikelets are the most important factors that affect the grain growth at varied positions of the panicle. On the other hand, the varied locations of the grains also affect grain growth. The vascular bundles of the primary branch at the upper panicle of rice were rapidly matured and their ducts and sieve tubes were very developed [6]. However, the ducts area and phloem area in the vascular bundles of the basal secondary branch of the lower panicle are smaller than those of the primary branch at the upper panicle [6]. Additionally, the differentiation of catheters, sieve tubes, and companion cells of the basal secondary branch of the lower panicle is insufficient and results in the poor transportation of materials [6]. This is one of the most important reasons for the differences in grain growth at different positions. However, the growth of rice grains also has an obvious apical advantage [12,54], that is, the growth of superior grains from the top panicle obviously inhibits that of inferior grains from the lower panicle. After the superior spikelets were thinned or removed, the seed setting rate, grain weight and sucrose content, hormone levels, activities of key enzymes, and the expression levels of genes involved in sucrose-to-starch metabolism in inferior spikelets were all enhanced [55,56]. Moreover, the growth of inferior grains can be significantly promoted by eliminating or reducing the inhibition from the superior grains of the top panicle [55,56]. This is another important reason for the differences in grain growth between the upper and lower branches.
All grains that regard an individual primary branch as a unit on the panicle of the two rice cultivars were clustered into three different groups according to the grain growth parameters of the primary branches. In the current work, our results showed that grain growth was significantly different between groups. Because the values of Vmax and R0 in Group I for both cultivars were highest, whereas those in Group III were lowest (Table 4). The days of Tmax and 0–t1 of Group III for both cultivars were longest, whereas those in Group I were shortest (Table 4). This indicated that the grains in Group I had the strongest initial growth power, and first arrived at the fastest grain-filling rate during the shortest early grain-filling stage. On the contrary, the grains in Group III were the last to start their growth and had the slowest grain-filling rate during the longest early grain-filling stage, which might be related to the lowest initial growth power.
The growth parameters (A, Vmax, Tmax, D, 0–t1, t1t2, t2t3, and grain weight) of the primary-branch grains changed gradually from the top to the base of the panicle. However, it was found that the changes between adjacent primary branches for these parameters were various—that is, the increase or reduction was different and non-uniform between all adjacent primary branches for the same parameter. Figure 7 shows the distribution of the primary branches on the spike axis. It was found that the distances between adjacent primary branches were also non-uniform. Furthermore, the spikelet numbers of primary branches on the rice panicle were different (Table 5). Therefore, further study is required to determine whether the non-uniform changes of parameters between adjacent primary branches are related to the non-uniform distribution of the primary branches on the spike axis and different spikelet numbers of primary branches.

5. Conclusions

Our results showed a high correlation in dry-matter accumulation between adjacent primary branches, and a lower correlation between distanced primary branches. Moreover, there was a significant difference between the primary branches situated far apart in final grain weight, active grain filling duration, maximum grain growth rate, and the time of maximum grain growth rate. For both cultivars, the rice grains at different positions on a panicle could be clustered into three different groups based on the changes in these parameters of grain growth. Group I (superior primary-branches) is considered to be the highest in dry-matter accumulation, and the highest in maximum grain growth rate, followed by Group II (medium primary-branches), which has less growing ability than Group I. Group III (inferior primary-branches) was found to be the poorest for grain filling in the three groups. Therefore, the increase of grain yield can be achieved by improving the growth of Group III. This study could provide a new method of classification for all primary branches on a panicle based on growth parameters of every primary branch, and lays an important foundation for the directional cultivation and regulation of grain filling at middle and basal positions for large panicle cultivars.

Author Contributions

Conceptualization: L.J. Methodology and investigation: Q.Z., X.H., F.K., T.L., Y.X., F.L., B.Y. and Y.L. Formal analysis and data curation: Q.Z. Writing-Original draft preparation: Q.Z. Writing-Review & Editing: L.J., H.L., M.H., I.A., A.I., S.U., S.W., and N.C. Funding Acquisition: L.J. All the authors approved the final version of the manuscript. All authors have read and agreed to the published version of the manuscript.

Funding

This work was financially supported by the National Natural Science Foundation of China (31771712).

Acknowledgments

We wish to thanks our cooperates from the Guangxi University, Agriculture Station for the help of conducting and managing this experiment.

Conflicts of Interest

The authors declare no conflict of interest.

References

  1. Fageria, N.K. Yield physiology of rice. J. Plant Nutr. 2007, 30, 843–879. [Google Scholar] [CrossRef]
  2. Fitzgerald, M.A.; Mccouch, S.R.; Hall, R.D. Not just a grain of rice: the quest for quality. Trends. Plant Sci. 2009, 14, 133–139. [Google Scholar] [CrossRef] [PubMed]
  3. Fahad, S.; Adnan, M.; Noor, M.; Arif, M.; Alam, M.; Khan, I.A.; Ullah, H.; Wahid, F.; Mian, I.A.; Jamal, Y.; et al. Major constraints for global rice production. In Advances in Rice Research for Abiotic Stress Tolerance; Hasanuzzaman, M., Fujita, M., Nahar, K., Biswas, J.K., Eds.; Woodhead Publishing: Sawston, UK, 2019; pp. 1–22. [Google Scholar]
  4. Fu, J.; Xu, Y.J.; Chen, L.; Yuan, L.M.; Wang, Z.Q.; Yang, J.C. Changes in enzyme activities involved in starch synthesis and hormone concentrations in superior and inferior spikelets and their association with grain filling of super rice. Rice Sci. 2013, 20, 120–128. [Google Scholar] [CrossRef]
  5. Yang, J.C.; Cao, Y.Y.; Zhang, H.; Liu, L.J.; Zhang, J.H. Involvement of polyamines in the post-anthesis development of inferior and superior spikelets in rice. Planta 2008, 228, 137–149. [Google Scholar] [CrossRef]
  6. Huang, S.M.; Zou, Y.B.; Liu, C.L. Setting physiology of the superior and inferior grains of hybrid rice Liangyoupeijiu. Acta Agron. Sin. 2005, 31, 102–107. [Google Scholar]
  7. Cheng, W.D.; Zhang, G.P.; Zhao, G.P.; Yao, H.G.; Xu, H.M. Variation in rice quality of different cultivars and grain positions as affected by water management. Field Crops Res. 2003, 80, 245–252. [Google Scholar] [CrossRef]
  8. Sekhar, S.; Panda, B.B.; Mohapatra, T.; Das, K.; Shaw, B.P.; Kariali, E.; Mohapatra, P.K. Spikelet-specifc variation in ethylene production and constitutive expression of ethylene receptors and signal transducers during grain flling of compact and lax panicle rice (Oryza sativa) cultivars. J. Plant Physiol. 2015, 179, 21–34. [Google Scholar] [CrossRef]
  9. Yang, J.C. Mechanism and regulation in the filling of inferior spikelets of rice. Acta Agron. Sin. 2010, 36, 2011–2019. [Google Scholar]
  10. Ishimaru, T.; Matsuda, T.; Ohsugi, R.; Yamagishi, T. Morphological development of rice caryopses located at the different positions in a panicle from early to middle stage of grain filling. Funct. Plant Biol. 2003, 30, 1139–1149. [Google Scholar] [CrossRef]
  11. Ishimaru, T.; Hirose, T.; Matsuda, T.; Goto, A.; Takahashi, K.; Sasaki, H.; Terao, T.; Ishii, R.; Ohsugi, R.; Yamagishi, T. Expression patterns of genes encoding carbohydrate-metabolizing enzymes and their relationship to grain filling in rice (Oryza sativa L.): Comparison of caryopses located at different positions in a panicle. Plant. Cell Physiol. 2005, 46, 620–628. [Google Scholar] [CrossRef] [Green Version]
  12. Mohapatra, P.K.; Panigrahi, R.; Turner, N.C. Physiology of spikelet development on the rice panicle: Is manipulation of apical dominance crucial for grain yield improvement? In Advance Agron; Sparks, D.L., Ed.; Elsevier: Amsterdam, The Netherlands, 2011; Volume 110, pp. 333–359. [Google Scholar]
  13. Yang, J.C.; Peng, S.B.; Visperas, R.M.; Sanico, A.L.; Zhu, Q.S.; Gu, S.L. Grain filling pattern and cytokinin content in the grains and roots of rice plants. Plant Growth Regul. 2000, 30, 261–270. [Google Scholar] [CrossRef]
  14. Yang, J.C.; Zhang, J.H. Grain filling problem in “super” rice. J. Exp. Bot. 2010, 61, 1–5. [Google Scholar] [CrossRef] [PubMed] [Green Version]
  15. Fu, J.; Huang, Z.H.; Wang, Z.Q.; Yang, J.C.; Zhang, J.H. Pre-anthesis non-structural carbohydrate reserve in the stem enhances the sink strength of inferior spikelets during grain filling of rice. Field Crops Res. 2011, 123, 170–182. [Google Scholar] [CrossRef]
  16. Kennedy, S.P.; Lynch, J.P.; Spink, J.; Bingham, I.J. Grain number and grain filling of two-row malting barley in response to variation in post-anthesis radiation: Analysis by grain position on the ear and its implications for yield improvement and quality. Field Crops Res. 2018, 225, 74–82. [Google Scholar] [CrossRef]
  17. Liang, W.X.; Zhang, Z.C.; Wen, X.X.; Liao, Y.C.; Liu, Y. Effect of non-structural carbohydrate accumulation in the stem pre-anthesis on grain filling of wheat inferior grain. Field Crops Res. 2017, 211, 66–76. [Google Scholar] [CrossRef]
  18. Li, Y.; Cui, Z.Y.; Ni, Y.L.; Zheng, M.J.; Yang, D.Q.; Jin, M.; Chen, J.; Wang, Z.L.; Yin, Y.P. Plant density effect on grain number and weight of two winter wheat cultivars at different spikelet and grain positions. PLoS ONE 2016, 11, e0155351. [Google Scholar] [CrossRef]
  19. Chen, Y.J.; Hoogenboom, G.; Ma, Y.T.; Li, B.G.; Guo, Y. Maize kernel growth at different floret positions of the ear. Field Crops Res. 2013, 149, 177–186. [Google Scholar] [CrossRef]
  20. Yu, T.; Li, G.; Liu, P.; Dong, S.T.; Zhang, J.W.; Zhao, B. Proteomics analysis of maize (Zea mays L.) grain based on iTRAQ reveals molecular mechanisms of poor grain filling in inferior grains. Plant Physiol. Biochem. 2017, 115, 83–96. [Google Scholar] [CrossRef]
  21. Nagato, K. Differences in grain weight of spikelets located at different positions within a rice panicle. Jpn. J. Crop Sci. 1941, 13, 156–169. [Google Scholar] [CrossRef] [Green Version]
  22. Wang, F.; Chen, S.; Cheng, F.M.; Liu, Y.; Zhang, G.P. The differences in grain weight and quality within a rice (Oryza sativa L.) panicle as affected by panicle type and source-sink relation. J. Agron. Crop Sci. 2007, 193, 63–73. [Google Scholar] [CrossRef]
  23. Peng, T.; Lv, Q.; Zhao, Y.F.; Sun, H.Z.; Han, Y.C.; Du, Y.X.; Zhang, J.; Li, J.Z.; Wang, L.L.; Zhao, Q.Z. Superior grains determined by grain weight are not fully correlated with the flowering order in rice. J. Integr. Agric. 2015, 14, 847–855. [Google Scholar] [CrossRef] [Green Version]
  24. Jiang, Q.; Du, Y.L.; Tian, X.Y.; Wang, Q.S.; Xiong, R.H.; Xu, G.C.; Yan, C.; Ding, Y.F. Effect of panicle nitrogen on grain filling characteristics of high-yielding rice cultivars. Eur. J. Agron. 2016, 74, 185–192. [Google Scholar] [CrossRef]
  25. Zhang, H.; Li, H.W.; Yuan, L.M.; Wang, Z.Q.; Yang, J.C.; Zhang, J.H. Post-anthesis alternate wetting and moderate soil drying enhances activities of key enzymes in sucrose-to-starch conversion in inferior spikelets of rice. J. Exp. Bot. 2012, 63, 215–227. [Google Scholar] [CrossRef] [PubMed] [Green Version]
  26. Zhang, Z.X.; Chen, J.; Lin, S.S.; Li, Z.; Cheng, R.H.; Fang, C.X.; Chen, H.F.; Lin, W.X. Proteomic and phosphoproteomic determination of ABA’s effects on grain-filling of Oryza sativa L. inferior spikelets. Plant Sci. 2012, 185–186, 259–273. [Google Scholar] [CrossRef] [PubMed]
  27. Wang, F.; Cheng, F.M.; Zhang, G.P. The relationship between grain filling and hormone content as affected by genotype and source-sink relation. Plant Growth Regul. 2006, 49, 1–8. [Google Scholar]
  28. Wei, H.Y.; Zhu, Y.; Qiu, S.; Han, C.; Hu, L.; Xu, D.; Zhou, N.B.; Xing, Z.P.; Hu, Y.J.; Cui, P.Y.; et al. Combined effect of shading time and nitrogen level on grain filling and grain quality in japonica super rice. J. Integr. Agric. 2018, 17, 2405–2417. [Google Scholar] [CrossRef] [Green Version]
  29. Richards, F.J. A flexible growth function for empirical use. J. Exp. Bot. 1959, 10, 290–301. [Google Scholar] [CrossRef]
  30. Cheng, M.L. Parameter estimation of Richards model and its application. Math. Pract. Theory. 2010, 40, 139–143. [Google Scholar]
  31. Zhu, Q.S.; Cao, X.Z.; Luo, Y.Q. Growth analysis on the process of grain filling in rice. Acta Agron. Sin. 1988, 14, 182–193. [Google Scholar]
  32. Zhang, H.; Liu, K.; Wang, Z.Q.; Liu, L.J.; Yang, J.C. Abscisic acid, ethylene and antioxidative systems in rice grains in relation with grain filling subjected to postanthesis soil-drying. Plant Growth Regul. 2015, 76, 135–146. [Google Scholar] [CrossRef]
  33. Adolfsson, A.; Ackerman, M.; Brownstein, N.C. To cluster, or not to cluster: An analysis of clusterability methods. Pattern Recogn. 2019, 88, 13–26. [Google Scholar] [CrossRef] [Green Version]
  34. Mohapatra, P.K.; Patel, R.; Sahu, S.K. Time of flowering affects grain quality and spikelet partitioning within the rice panicle. Aust. J. Plant Physiol. 1993, 20, 231–242. [Google Scholar] [CrossRef]
  35. Naik, P.K.; Mohapatra, P.K. Ethylene inhibitors promote male gametophyte survival in rice. Plant Growth Regul. 1999, 28, 29–39. [Google Scholar] [CrossRef]
  36. Chen, L.; Deng, Y.; Zhu, H.L.; Hu, Y.X.; Jiang, Z.G.; Tang, S.; Wang, S.H.; Ding, Y.F. The initiation of inferior grain filling is affected by sugar translocation efficiency in large panicle rice. Rice 2019, 12, 75. [Google Scholar] [CrossRef] [PubMed] [Green Version]
  37. Gu, S.L.; Zhu, Q.S.; Yang, J.C.; Peng, S.B. Analysis on grain filling characteristics for different rice types. Acta Agron. Sin. 2001, 27, 7–14. [Google Scholar]
  38. Liang, J.S.; Zhang, J.H.; Cao, X.Z. Grain sink strength may be related to the poor grain filling of indica-japonica rice (Oryza sativa) hybrids. Physiol. Plantarum. 2001, 112, 470–477. [Google Scholar] [CrossRef]
  39. Leonard, M.; Kinet, J.M.; Bodson, M.; Bernier, G. Enhanced inflorescence development in tomato by growth substance treatments in relation to 14C-assimilate distribution. Physiol. Plantarum. 1983, 57, 85–89. [Google Scholar] [CrossRef]
  40. Kinet, J.M.; Zime, V.; Linotte, A.; Jacqmard, A.; Bernier, G. Resumption of cellular activity induced by cytokinin and gibberellin treatments in tomato flowers targeted for abortion unfavorable light conditions. Physiol. Plantarum. 1986, 64, 67–73. [Google Scholar] [CrossRef]
  41. Feng, S.W.; Hu, T.Z.; Li, G.; Dong, N.; Li, X.H.; Ru, Z.G.; Cheng, Z.H. Analysis of grain filling characteristics of different wheat varieties. J. Triticeae Crops 2009, 29, 643–646. [Google Scholar]
  42. Dong, M.H.; Chen, P.F.; Xie, Y.L.; Qiao, Z.Y.; Yang, J.C. Variations in carbohydrate and protein accumulation among spikelets at different positions within a panicle during rice grain filling. Rice Sci. 2012, 19, 223–232. [Google Scholar] [CrossRef]
  43. Lv, X.K.; Li, T.; Wen, X.X.; Liao, Y.C.; Liu, Y. Effect of potassium foliage application post-anthesis on grain filling of wheat under drought stress. Field Crops Res. 2017, 206, 95–105. [Google Scholar] [CrossRef]
  44. Yang, J.C.; Zhang, J.H.; Wang, Z.Q.; Xu, G.W.; Zhu, Q.S. Activities of key enzymes in sucrose-to-starch conversion in wheat grains subjected to water deficit during grain filling. Plant Physiol. 2004, 135, 1621–1629. [Google Scholar] [CrossRef] [PubMed] [Green Version]
  45. Jeng, T.L.; Wang, C.S.; Chen, C.L.; Sung, J.M. Effects of grain position on the panicle on starch biosynthetic enzyme activity in developing grains of rice cultivar Tainung 67 and its NaN3-induced mutant. J. Agric. Sci. 2003, 141, 303–311. [Google Scholar] [CrossRef]
  46. Das, K.; Panda, B.B.; Shaw, B.P.; Das, S.R.; Dash, S.K.; Kariali, E.; Mohapatra, P.K. Grain density and its impact on grain filling characteristic of rice: mechanistic testing of the concept in genetically related cultivars. Sci. Rep. 2018, 8, 4149. [Google Scholar] [CrossRef] [PubMed]
  47. Panigrahi, R.; Kariali, E.; Panda, B.B.; Lafarge, T.; Mohapatra, P.K. Controlling the trade-off between spikelet number and grain filling: the hierarchy of starch synthesis in spikelets of rice panicle in relation to hormone dynamics. Funct. Plant Biol. 2019, 46, 507–523. [Google Scholar] [CrossRef]
  48. Chen, T.T.; Xu, G.W.; Wang, Z.Q.; Zhang, H.; Yang, J.C.; Zhang, J.H. Expression of proteins in superior and inferior spikelets of rice during grain filling under different irrigation regimes. Proteomics 2016, 16, 102–121. [Google Scholar] [CrossRef]
  49. Yang, J.C.; Zhang, J.H.; Wang, Z.Q.; Zhu, Q.S.; Wang, W. Remobilization of carbon reserves in response to water deficit during grain filling of rice. Field Crops Res. 2001, 71, 47–55. [Google Scholar] [CrossRef]
  50. Li, Z.; Li, Z.; Muhammad, W.; Lin, M.H.; Azeem, S.; Zhao, H.; Lin, S.; Chen, T.; Fang, C.X.; Letuma, P.; et al. Proteomic analysis of positive influence of alternate wetting and moderate soil drying on the process of rice grain filling. Plant Growth Regul. 2018, 84, 533–548. [Google Scholar] [CrossRef]
  51. Yang, J.C.; Zhang, J.H.; Wang, Z.Q.; Liu, K.; Wang, P. Post-anthesis development of inferior and superior spikelets in rice in relation to abscisic acid and ethylene. J. Exp. Bot. 2006, 57, 149–160. [Google Scholar] [CrossRef] [Green Version]
  52. Liu, Y.; Sui, Y.W.; Gu, D.D.; Wen, X.X.; Chen, Y.; Li, C.J.; Liao, Y.C. Effects of conservation tillage on grain filling and hormonal changes in wheat under simulated rainfall conditions. Field Crops Res. 2013, 144, 43–51. [Google Scholar] [CrossRef]
  53. Xu, G.W.; Zhang, J.H.; Lam, H.M.; Wang, Z.Q.; Yang, J.C. Hormonal changes are related to the poor grain filling in the inferior spikelets of rice cultivated under non-flooded and mulched condition. Field Crops Res. 2007, 101, 53–61. [Google Scholar] [CrossRef]
  54. Xu, X.B.; Vergara, B.S. Morphological changes in rice panicle development: a review of literature. IRRI Res. Pap. Ser. 1986, 117, 1–16. [Google Scholar]
  55. Okamura, M.; Arai-Sanoh, Y.; Yoshida, H.; Mukouyama, T.; Adachi, S.; Yabe, S.; Nakagawa, H.; Tsutsumi, K.; Taniguchi, Y.; Kobayashi, N.; et al. Characterization of high-yielding rice cultivars with different grain-filling properties to clarify limiting factors for improving grain yield. Field Crops Res. 2018, 219, 139–147. [Google Scholar] [CrossRef]
  56. You, C.C.; Zhu, H.L.; Xu, B.B.; Huang, W.X.; Wang, S.H.; Ding, Y.F.; Liu, Z.H.; Li, G.H.; Chen, L.; Ding, C.Q.; et al. Effect of removing superior spikelets on grain filling of inferior spikelets in rice. Front. Plant Sci. 2016, 7, 1161. [Google Scholar] [CrossRef] [PubMed] [Green Version]
Figure 1. Summary of the average air temperature and rainfall in 2014 and 2015 growing seasons.
Agronomy 10 00223 g001
Figure 2. Thirteen primary branch grains of Nongle 1 panicle and fourteen primary branch grains of Guifeng 2 panicle. B1 to B14 represent the grains from the top 1st primary branch to the basal 14th primary branch on rice panicles for Nongle 1 and Guifeng 2.
Agronomy 10 00223 g002
Figure 3. Dynamics of dry-matter accumulation and grain growth rate of primary-branch grains at different positions for two rice cultivars in 2014 and 2015 at different growth stages. (A,B) dry-matter accumulation for Nongle 1, (C,D) dry-matter accumulation for Guifeng 2, (E,F) grain growth rate for Nongle 1, (G,H) grain growth rate for Guifeng 2. Data are the mean across three replications. 0, 7, 14, 21 and 28 indicate 0 days, 7 days, 14 days, 21 days and 28 days after anthesis. B1 to B14 represent the grains from the top 1st primary branch to the basal 14th primary branch on rice panicles for Nongle 1 and Guifeng 2.
Agronomy 10 00223 g003
Figure 4. Variation of grain growth parameters of primary-branch grains at different positions for Nongle 1 and Guifeng 2 in 2014 and 2015. (A) active grain-filling period, (B) maximal grain growth rate, (C) time of the maximum grain growth rate, (D) the ratio of Ymax to A, (E) initial growth power, (F) grain weight of the maximum grain growth rate. B1 to B14 represent the 1st primary-branch grains to the 14th primary-branch grains from the top to the base of the panicle for Nongle 1 and Guifeng 2.
Agronomy 10 00223 g004
Figure 5. The period for the beginning (0–t1), middle (t1t2) and end (t2t3) of grain filling of primary-branch grains at different positions for Nongle 1 (A,B) and Guifeng 2 (C,D) in 2014 and 2015. B1 to B14 represent the 1st primary-branch grains to the 14th primary-branch grains from the top to the base of the panicle for Nongle 1 and Guifeng 2. 0–t1, t1t2 and t2t3 represent the period with gradual, fast, slow dry matter accumulation, respectively.
Agronomy 10 00223 g005
Figure 6. Cluster analysis of all primary-branch grains at different positions for Nongle 1 (A,B) and Guifeng 2 (C,D) in 2014 and 2015. B1 to B14 represent the 1st primary-branch grains to the 14th primary-branch grains from the top to the base of the panicle for Nongle 1 and Guifeng 2.
Agronomy 10 00223 g006
Figure 7. The distribution of all primary-branch grains at different positions for Nongle 1 (A) and Guifeng 2 (B) on the panicle axis. B1 to B14 represent the 1st primary-branch grains to the 14th primary-branch grains from the top to the base of the panicle for Nongle 1 and Guifeng 2.
Agronomy 10 00223 g007
Table 1. Parameters of Richards equation for fitting grain growth of primary branches and the whole panicle of Nongle 1 and Guifeng 2 in 2014 and 2015. B1 to B14 represent the 1st primary-branch grains to the 14th primary-branch grains from the top to the base of the panicle for Nongle 1 and Guifeng 2. Panicle indicates the whole panicle of Nongle 1 and Guifeng 2. A is the final grain weight (g per 100 grains). B, k and N are the parameters set by the regression equation. k is the parameter of growth speed, B and N do not have the obvious biological meaning but they can decide flexibility and position of the growth curve. R2 is the determinant coefficient.
2014 (Late Rice)2015 (Early Rice)
CultivarsBranchesABkNR2BranchesABkNR2
Nongle 1B12.01145.840.2891.7500.996B11.93557.560.4022.1330.995
B22.04052.750.2691.8560.994B21.95124.910.3221.6610.999
B31.89556.620.2591.9480.997B31.87349.370.3252.0430.999
B41.86560.820.2552.0110.997B41.84512.170.2291.3110.997
B51.835131.130.2792.4110.998B51.76220.670.2281.5800.998
B61.742311.130.2992.7910.998B61.70827.320.2311.6510.998
B71.727597.140.3213.2110.995B71.681305.800.3223.1000.995
B81.7394521.610.3924.3340.999B81.659393.610.3253.1800.998
B91.63411139.480.4074.8670.997B91.620665.460.3313.4110.996
B101.611140115.850.4986.0710.998B101.5191239.350.3503.7500.993
B111.645756627.730.5266.8120.996B111.5441614.660.3523.7900.989
B121.5871186041.880.5377.4100.992B121.6112507.230.3534.0640.994
B131.4178710836.160.5948.5190.993B131.60213194.860.4014.9900.990
panicle1.85569.380.222.1220.999panicle1.76514.450.1991.3940.998
Guifeng 2B11.57221.110.2831.6220.999B11.65123.310.3111.6870.998
B21.53130.470.2831.7920.999B21.62120.560.2811.5510.975
B31.56027.060.2651.6740.998B31.62013.090.2611.2790.993
B41.52933.100.2661.7870.998B41.62914.820.2521.3610.995
B51.56045.090.2601.8950.997B51.68020.310.2501.4570.997
B61.53053.490.2561.9920.997B61.65425.670.2441.5680.997
B71.49789.620.2612.1000.996B71.61036.380.2341.7010.995
B81.480180.820.2812.3110.996B81.60175.350.2522.0110.997
B91.465268.170.2892.5440.996B91.603197.980.2862.4880.995
B101.3703598.770.3773.8440.996B101.5301516.540.3453.4770.995
B111.30123999.850.4324.7510.995B111.4844021.750.3693.8850.994
B121.311138239.930.4855.7510.993B121.47142367.890.4515.1020.994
B131.306354717.290.5126.2500.993B131.474118240.280.4915.8010.990
B141.2711603900.560.5446.8900.990B141.479328969.320.5116.1190.984
panicle1.52725.840.2071.6290.998panicle1.65912.310.1891.2520.998
Table 2. The correlation coefficients of dry-matter accumulation between primary-branch grains and the whole panicle of Nongle 1 in 2014 and 2015. B1 to B14 represent the 1st primary-branch grains to the 14th primary-branch grains from the top to the base of the panicle for Nongle 1 and Guifeng 2. Panicle indicates the whole panicle of Nongle 1. *, significance at the 0.05 probability level; **, significance at the 0.01 probability level.
CultivarsSeasonBranchesB2B3B4B5B6B7B8B9B10B11B12B13Panicle
Nongle 12014
(late rice)
B10.989 **0.970 **0.973 **0.961 **0.908 **0.911 **0.876 **0.835 **0.765 **0.664 **0.657 **0.571 **0.909 **
B2 0.980 **0.995 **0.978 **0.951 **0.949 **0.914 **0.892 **0.830 **0.757 **0.744 **0.666 **0.949 **
B3 0.977 **0.975 **0.949 **0.950 **0.926 **0.893 **0.847 **0.764 **0.763 **0.694 **0.954 **
B4 0.987 **0.974 **0.971 **0.939 **0.927 **0.871 **0.807 **0.796 **0.727 **0.974 **
B5 0.983 **0.987 **0.973 **0.947 **0.906 **0.817 **0.823 **0.757 **0.983 **
B6 0.999 **0.987 **0.987 **0.959 **0.908 **0.908 **0.857 **0.996 **
B7 0.993 **0.986 **0.960 **0.898 **0.904 **0.852 **0.995 **
B8 0.987 **0.976 **0.905 **0.921 **0.873 **0.981 **
B9 0.990 **0.954 **0.960 **0.924 **0.977 **
B10 0.969 **0.982 **0.957 **0.946 **
B11 0.994 **0.983 **0.889 **
B12 0.992 **0.892 **
B13 0.842 **
2015
(early rice)
B10.995 **0.969 **0.936 **0.871 **0.808 **0.798 **0.748 **0.692 **0.647 **0.610 **0.557 **0.420.827 **
B2 0.986 **0.965 **0.913 **0.860 **0.851 **0.807 **0.756 **0.714 **0.680 **0.631 **0.501 *0.876 **
B3 0.986 **0.959 **0.922 **0.912 **0.878 **0.836 **0.797 **0.762 **0.717 **0.614 **0.929 **
B4 0.986 **0.961 **0.953 **0.926 **0.893 **0.864 **0.838 **0.800 **0.693 **0.971 **
B5 0.993 **0.986 **0.972 **0.950 **0.927 **0.902 **0.874 **0.796 **0.996 **
B6 0.995 **0.990 **0.978 **0.960 **0.939 **0.918 **0.858 **0.997 **
B7 0.997 **0.987 **0.974 **0.956 **0.938 **0.878 **0.990 **
B8 0.987 **0.971 **0.960 **0.913 **0.982 **
B9 0.996 **0.985 **0.977 **0.942 **0.967 **
B10 0.996 **0.990 **0.953 **0.949 **
B11 0.993 **0.951 **0.928 **
B12 0.972 **0.905 **
B13 0.833 **
Table 3. The correlation coefficients of dry-matter accumulation between primary-branch grains and the whole panicle of Guifeng 2 in 2014 and 2015. B1 to B14 represent the 1st primary-branch grains to the 14th primary-branch grains from the top to the base of the panicle for Nongle 1 and Guifeng 2. Panicle indicates the whole panicle of Guifeng 2. *, significance at the 0.05 probability level; **, significance at the 0.01 probability level.
CultivarsSeasonBranchesB2B3B4B5B6B7B8B9B10B11B12B13B14Panicle
Guifeng 2late rice
(2014)
B10.994 **0.982 **0.974 **0.937 **0.912 **0.832 **0.750 **0.741 **0.644 **0.537 *0.481 *0.448 *0.3770.875 **
B2 0.996 **0.992 **0.967 **0.948 **0.881 **0.804 **0.797 **0.708 **0.604 **0.548 *0.517 *0.451 *0.914 **
B3 0.999 **0.985 **0.971 **0.916 **0.848 **0.842 **0.759 **0.659 **0.604 **0.574 **0.509 *0.942 **
B4 0.991 **0.979 **0.930 **0.866 **0.860 **0.781 **0.684 **0.630 **0.601 **0.537 *0.953 **
B5 0.997 **0.971 **0.925 **0.920 **0.856 **0.770 **0.721 **0.693 **0.629 **0.980 **
B6 0.986 **0.949 **0.945 **0.890 **0.813 **0.767 **0.741 **0.680 **0.991 **
B7 0.987 **0.986 **0.952 **0.895 **0.858 **0.837 **0.784 **0.990 **
B8 0.999 **0.987 **0.949 **0.922 **0.904 **0.849 **0.965 **
B9 0.989 **0.956 **0.930 **0.914 **0.864 **0.963 **
B10 0.986 **0.970 **0.957 **0.914 **0.916 **
B11 0.997 **0.992 **0.964 **0.855 **
B12 0.998 **0.974 **0.814 **
B13 0.987 **0.792 **
B14 0.738 **
early rice
(2015)
B10.994 **0.978 **0.978 **0.945 **0.918 **0.834 **0.756 **0.742 **0.638 **0.550 **0.467 *0.475 *0.3760.868 **
B2 0.983 **0.991 **0.970 **0.952 **0.888 **0.821 **0.808 **0.717 **0.635 **0.558 **0.564 **0.472 *0.916 **
B3 0.994 **0.976 **0.954 **0.890 **0.808 **0.804 **0.702 **0.625 **0.530 *0.541 *0.440 *0.909 **
B4 0.987 **0.973 **0.922 **0.854 **0.847 **0.758 **0.683 **0.598 **0.607 **0.515 *0.941 **
B5 0.996 **0.960 **0.912 **0.907 **0.828 **0.763 **0.688 **0.697 **0.606 **0.969 **
B6 0.981 **0.945 **0.940 **0.874 **0.817 **0.749 **0.757 **0.673 **0.986 **
B7 0.986 **0.985 **0.946 **0.908 **0.851 **0.857 **0.792 **0.993 **
B8 0.998 **0.982 **0.956 **0.921 **0.925 **0.874 **0.972 **
B9 0.986 **0.963 **0.926 **0.932 **0.881 **0.964 **
B10 0.993 **0.975 **0.977 **0.946 **0.917 **
B11 0.990 **0.992 **0.971 **0.871 **
B12 0.999 **0.993 **0.811 **
B13 0.991 **0.815 **
B14 0.745**
Table 4. Comparison of grain growth parameters at different primary-branch groups of Nongle 1 and Guifeng 2 in 2014 and 2015. Means followed by the same letters within the column are not significantly different at p < 0.05.
CultivarsSeasonBranch GroupsBranchesAVmaxDTmaxR00–t1t1t2t2t3
Nongle 1late rice (2014)IB1-B22.081a0.101a31.4b12.0b0.143a5.6b12.8a13.5a
IIB3-B71.857b0.082b34.8a14.5b0.112ab7.7b13.5a12.8a
IIIB8-B131.619c0.079b34.1a21.3a0.076b16.9a8.7b4.3b
early rice (2015)IB1-B31.941a0.120a24.3b7.7c0.238a2.4b10.6b13.0a
IIB4-B61.785b0.086b31.6a11.0b0.151b4.4b13.2a14.5a
IIIB7-B131.610c0.079b33.3a17.6a0.085c12.6a10.0b6.3b
Guifeng 2late rice (2014)IB1-B41.563a0.085a28.0b10.0c0.165a4.2c11.5a12.4a
IIB5-B91.524a0.072b32.7a14.3b0.118b8.0b12.5a11.7a
IIIB10-B141.339b0.068b33.2a22.2a0.075c18.2a8.0b3.6b
early rice (2015)IB1-B61.658a0.091a27.6b9.4c0.190a3.5c11.8a13.7a
IIB7-B91.629a0.077a32.5a14.6b0.121b8.2b12.7a12.0a
IIIB10-B141.519b0.077a32.8a20.9a0.081c16.4a8.8b4.7b
Table 5. The numbers of spikelets of each primary-branch at different positions for Nongle 1 and Guifeng 2 in 2014 and 2015. B1 to B14 represent the 1st primary-branch grains to the 14th primary-branch grains from the top to the base of the panicle for Nongle 1 and Guifeng 2.
Nongle 1Guifeng 2
2014201520142015
B116.616.115.615.6
B218.118.516.9617.2
B318.720.716.5017.3
B418.723.216.516.7
B518.423.316.517.2
B617.122.316.3016.5
B717.923.314.614.7
B817.522.513.5014.1
B915.620.913.5013.9
B1016.321.811.712.0
B1114.319.010.410.7
B1214.618.79.910.2
B1315.218.59.610.3
B14 9.49.2

