Article

Long-Term Effects of Organic Amendments on Soil Organic Matter Quantity and Quality in Conventional Cropping Systems in Switzerland

Agroscope, Field-Crop Systems and Plant Nutrition, Research Division Plant Production Systems, Route de Duillier 50, P.O. Box 1012, CH-1260 Nyon, Switzerland
*
Author to whom correspondence should be addressed.
Agronomy 2020, 10(12), 1977; https://doi.org/10.3390/agronomy10121977
Submission received: 19 November 2020 / Revised: 11 December 2020 / Accepted: 12 December 2020 / Published: 16 December 2020

Abstract

:
Increasing soil organic carbon (SOC) in agroecosystems is a promising solution to simultaneously address climate change mitigation, adaptation, and food security. Yet, the best management practices that could achieve these goals remain to be identified. Here, we analyze the long-term effects of application of green manure, cereal straw, farmyard manure, and cattle slurry on SOC in a 37 year long field experiment in Switzerland. The treatment effects were compared against control conditions that received only optimal mineral fertilization. More specifically, this study aimed at evaluating the effect of organic amendments on SOC accumulation and distribution in different soil particle-size fractions by means of a set of indicators about organic matter quality (biological reactivity, humification index) and microbial activity (extracellular enzyme activities). In the absence of organic matter input, application of mineral fertilizers alone resulted in the lowest SOC content and the highest humification index of the bulk soil organic matter. Among the organic amendments, cereal straw, farmyard manure, and cattle slurry promoted a higher SOC content and a lower humification index due to an increase of SOC in the clay-size fraction. The annual C accrual reached 4.4‰ per year over 37 years with farmyard manure. The higher biological reactivity measured for the green manure and cereal straw amendments was associated with higher soil enzymatic activities, while C retention coefficients decreased by at least 2.5 times compared to animal-derived amendments. The low availability of nutrients in green manure and straw amendments as suggested by the high phosphatase and N-acetylglucosaminidase activities may indicate a reduction in C retention of organic matter inputs due to nutrient microbial mining with plant-derived amendments.

1. Introduction

Agroecosystems represent a great potential to sequester atmospheric carbon (C) in soils because of their strong soil organic carbon (SOC) depletion due to historical human land use [1,2]. The goal to increase SOC in agroecosystems is not only to achieve negative emission, but also to improve soil health and quality, ultimately increasing agroecosystem productivity and resilience to extreme climatic events [3].
Despite the recent political awareness for increasing SOC in agroecosystems [4], severe losses of SOC are still reported in most conventional cropping systems due to intensive agricultural practices [5,6], particularly in stockless farms due to an insufficient input of organic C [7]. A wide range of agricultural practices have been identified to promote SOC storage, for example, by adding farmyard manure, incorporating plant residues, or cultivating green manures (cover crops) between commercial crops [7,8,9,10,11,12]. Nonetheless, accurate quantifications of their long-term effect on SOC quantity and quality are sparse [13,14].
Recent studies emphasized the role of physical protection and mineral association of SOC as a crucial mechanism for long-term stability of SOC [15,16,17,18]. Indeed, SOC can be found in heterogeneous states, i.e., free or bound to soil minerals, resulting in SOC fractions with different turnover rates [19,20,21]. Free or loosely bound SOC can be rapidly degraded, whereas SOC that is firmly bound to or protected by soil minerals degrades at slower rate [22]. In particular, SOC associated with clay-sized minerals has been proven to be a long-term C sink [23]. In this respect, soils with a higher proportion of clay and silt particles have a greater potential to sequester C in the long term by stabilizing more SOC in their fine fractions [6,24,25,26]. The ratio between SOC and clay (SOC/clay) is then not only important to determine the SOC sequestration potential of a soil, but it also impacts soil physical quality and the soil capacity to buffer extreme climatic events such a heavy rainfall and drought [27,28,29,30].
The stabilization pathways of organic matter (OM) inputs into fine soil fractions are affected by OM composition [31]. Microbial metabolisms and, especially, the substrate use efficiency by microbes vary depending on the stoichiometry and chemical composition of organic matter inputs [32,33]. The functional groups of OM influence its chemical reactivity to bind to minerals and to serve as a substrate for soil extracellular enzymes [34,35]. To follow the transformation and decomposition of OM in soils, various indices based on the relative proportion of labile and recalcitrant functional groups were created, for instance, the humification index (aromatic to aliphatic groups) that increases during decomposition or the biological reactivity index (O-containing groups to C and H or N-containing groups) that increases with OM lability [36,37,38]. Hence, the amount, the composition, and the stoichiometry of organic amendments, applied with or without mineral fertilization, strongly affect their C-retention coefficient, i.e., the proportion of applied C that is transformed in SOC [11,39], incorporated in different SOC fractions [40,41] by soil biological activities [9].
In this study, we aimed to investigate the long-term dynamics of SOC in an agricultural soil receiving different types of organic amendments with contrasting stoichiometry and composition, i.e., mustard (Brassica juncea L.) green manure, wheat cereal straw, farmyard manure, cattle slurry, or mineral fertilizers alone at typical rates applied in the field. In particular, we aimed to answer the following questions: (i) How do the different amendments affect SOC concentration? (ii) How is the SOC distribution among different soil particle fractions affected by the different amendments? (iii) Does the degree of SOC humification differ among treatments? (iv) Is extracellular enzymatic activity affected by the chemical characteristics of the different organic amendments?

2. Materials and Methods

2.1. Site Characteristics and Agronomic Practices

The field trial started in 1976 at the Swiss Research Station Agroscope in Changins (46°23′55.7″ N, 06°14′24.72″ E, altitude: 442 m) on a Calcaric Cambisol (FAO classification) under cultivation with the following measured soil properties determined in 2012: 143 g·kg−1 clay, 475 g·kg−1 sand, 12.2 g·kg−1 SOC, and a pH of 7.2 in the plough layer (0–20 cm). During the 1976–2013 experimental period, mean annual rainfall and temperature were 1010 mm and 10.4 °C, respectively [11]. One year prior to the establishment of the experiment, winter wheat was sown as a buffer crop. A 5–6 year crop rotation was applied, alternating between spring and winter crops, with two-thirds of crops being cereals [11]. Before every sowing (in September for winter crops and in April for spring crops), soil was ploughed to 20–25 cm depth, and the seedbed was prepared with a rotary harrow to 5 cm depth. Herbicides were applied depending on weed density, and standard phytosanitary protection was applied according to integrated crop protection principles [42].

2.2. Experimental Design and Soil Sampling

The experimental design was a split plot with six main organic treatments and four subtreatments of mineral nitrogen fertilization in four replicates (each of 4.5 × 20 m). For this study, one mineral treatment (NPK) with optimal mineral nitrogen fertilizer and four organic treatments with optimal mineral nitrogen fertilizer for plant growth were considered [11]. The main treatments were as follows: (i) no organic amendment (only mineral fertilization, NPK), (ii) green manure (GM + NPK), (iii) cereal straw (Str + NPK), (iv) farmyard manure (FYM + NPK), and (v) cattle slurry (Slu + NPK), where N, P, and K refer to mineral nitrogen, phosphorus, and potassium fertilization, respectively (Table 1). Cereal straws (wheat, barley, or spring oat) were removed after the harvest from the plot for all treatments except for the Str + NPK treatment where cereal straw was incorporated into the soil. Maize and rapeseed straws were incorporated into the soil each time in all the treatments. For the GM + NPK treatment, mustard (Brassica juncea L.) as green manure was sown every 2 years after crop harvest in the summer and was incorporated into the soil by ploughing just before sowing the spring crop in the following year. On FYM + NPK and Slu + NPK treatments, manures were applied every 3 years on maize and rapeseed.
To be sure that all the treatments received the same amount of macronutrient according to the Swiss fertilization guideline (Table 1) [43], the total amount of applied P and K was adjusted with mineral fertilizers (respectively, triple superphosphate: Ca(H2PO4)2·H2O and salt of potash: KCl) depending on the macronutrient composition of each organic amendment. The mineral fertilizers were applied prior to the seeding of spring crops (maize, spring barley, and spring oat) and during the growing season for the other crops (winter wheat and rapeseed). The rate and application time of mineral N fertilizer (ammonium nitrate: NH4NO3) to all treatments was adjusted depending on the crop needs as defined in the Swiss fertilization guideline [43].
Soil samples were collected in August 2012 to a depth of 0–20 cm from three plots (replicates) for each treatment. On each plot, at least 10 soil cores (diameter = 2.5–3 cm) were sampled randomly. Plant residues were removed and soil cores from the same plot were mixed to form a composite sample (replicate) per plot. Soil samples were air-dried, sieved at 2 mm, and kept in plastic bottles until analysis.
Soil bulk density was measured with the ring method by vertically inserting rings (100 cm3) at 3–7 and 13–17 cm depths at the center of each plot and averaged to approximate bulk density at 0–20 cm depth [11]. To avoid bias on SOC stocks due to the correlation between SOC and bulk density, treatments were compared on equivalent soil mass basis using the bulk density (1.47 g cm−3) of NPK treatment as reference [44]. SOC stocks (Mg·ha−1 within the first 20 cm of depth) were calculated as follows:
Corg (g/kg) × depth (m) × bulk density (g cm−3) × 10.
The C retention coefficient was calculated for each treatment as ratio between the increase in SOC stock (Mg C·ha−1) relatively to the NPK treatment and the total C input provided by the organic amendment (Mg C·ha−1).

2.3. Chemical Characterization of Organic Amendments

Aboveground biomass samples of mustard were collected from the GM + NPK treatment in April 2013, while aboveground biomass samples of wheat straw were collected in July 2012 from the Str + NPK treatment. FYM manure and cattle slurry were sampled in May 2013 from a local farmer. Four plot-replicates for mustard and straw, as well as four pseudo-replicates created for FYM and cattle slurry, were dried in an oven (Rubarth Apparate GmbH, Laatzen, Germany) for 6 days at 40 °C and kept dry in plastic bags until analysis. The organic C (Corg) and total nitrogen (Ntot) contents of organic amendments were determined using a katharometer combined with chromatography after a dry combustion at around 900 °C (NF ISO 10694 and ISO 13878). Additionally, spectroscopic analysis of organic amendments was performed by diffuse reflectance infrared Fourier-transform spectroscopy (DRIFT) spectroscopy (PerkinElmer Inc., Waltham, MA, USA) for soil samples and soil fractions. All the dried samples were previously ground to a fine powder using a tungsten mill (ThermoFischer Scientific, Waltham, MA, USA), manually mixed with potassium bromide (KBr) powder (Merck, Darmstadt, Germany) in an agate mortar, and diluted to 5%, which gave the best resolution. Diluted samples were kept in an oven at 45 °C for at least one night to remove any residual humidity. The biological reactivity index [36] was calculated according to the following equation:
Biological   Reactivity   Index   =   A 1725 A 1450 + A 1420 + A 779 ,
where A1725 refers to the integrated area of the absorption peak of O-containing groups, and A1450 + A1420 + A779 refers to the sum of the integrated areas of C, H, and N functional groups.

2.4. Characterization of Bulk SOM and Soil Particle-Size Fractions

The organic C (Corg) and total nitrogen (Ntot) contents of both bulk soils were determined using a katharometer combined with chromatography after a dry combustion at around 900 °C (NF ISO 10694 and ISO 13878). Soil C size fractionation was based on the centrifugation method [45,46]. A total of 35 g of sieved soils were mixed with 200 mL of deionized water and agitated with five glass beads (diameter = 1 cm) for 16 h prior to the fractionation. Subsequently, the wet samples were sieved at 50 µm by flushing the sample gently with deionized water. Particles having passed through the sieve were recovered in a bowl under the sieve, until no more particles passed through the sieve. The fraction 50–2000 µm was then placed onto a sieve tower of 200 and 50 µm in this order, from the top, in a large cylinder equipped with compressed air circulating deionized water from the bottom to the top to fractionate the sample at 200 µm. The fraction <e50 µm was thoroughly mixed to obtain a homogeneous solution, and a portion of this solution was then poured into centrifuge tubes and separated at 2 µm by repeated centrifugation (four times) at 150× g (relative centrifugal force, RCF). The centrifugation time was 3 min and calculated on the basis of Stokes’ law, combining rotation speed, temperature, and settling distance [47]. The obtained fractions corresponding to clay, silt, and fine and coarse sand fractions, i.e., <2, 2–50, 50–200, and 200–2000 µm, respectively, were dried in an oven at 40 °C for about 2 weeks. The obtained dried fractions were thereafter analyzed by a CHNS analyzer (ThermoFischer Scientific, Waltham, MA, USA) in order to determine the C content. Due to the coarse particle size, the fractions of 50–200 and 200–2000 µm were ground into powder using an agate mill prior to the analysis. About 10 mg of each fraction was used for the analysis. As the carbonate content was negligible in bulk soils, total C was taken as organic C (Corg). The organic carbon distribution in each size fraction was calculated according to the following equation:
Corg   distribution   in   size   fraction   [ % ]   =   Recovered   Corg   in   size   fraction   [ g   kg 1 ] Total   recovered   Corg   [ g   kg 1 ] 100 .
Spectroscopic characterization of both bulk soil samples and clay fractions was performed by Fourier-transform infrared spectroscopy using the DRIFT technique (Frontier FT-NIR/MIR). Bulk soils were initially ground to a fine powder using an agate mill then diluted to 10% KBr by mixing manually in an agate mortar. Due to their mineral dominance, and unlike recent similar cases [46,48,49], these soil samples needed to be diluted. Clay fractions were diluted to 5% in the same way as bulk soils. The spectra were thereafter recorded in the mid-infrared range (4000–400 cm−1), by scanning each sample 32 times. The atmospheric CO2 and H2O were automatically corrected by the PerkinElmer Spectrum 10 software. The obtained spectra were all converted into Kubelka–Munk units for calculation and interpretation. Peak assignments include aliphatic C–H (2925–2825 cm−1), carboxylic and ketonic C=O (1725 cm−1), aromatic C=C and carboxylate compounds (1600–1640 cm−1), aromatic C=C (1500 cm−1), and aliphatic C–H and C = N from primary amides (1450–1420 cm−1), according to the literature [48,50]. For all the spectra, the humification index [37] was calculated as follows:
Humification   Index   =   A 1640 1600 A 2925
where A1640–1600 represents the integrated area of absorption peak from aromatic and carboxylate compounds, whereas A2925 represents the integrated area of absorption peak from aliphatic compounds.

2.5. Enzyme Assay

Five extracellular enzyme activities were measured, including four hydrolytic enzymes (i.e., β-glucosidase (BG), β-1,4-N-acetylglucosaminidase (NAG), leucine aminopeptidase (LAP), and phosphatase (AP)) and one lignin-degrading enzyme (phenol oxidase, PO). The dried soils were rewetted with deionized water to 50% of their maximum water holding capacity and incubated in the dark at room temperature (22 ± 1 °C) for 2 weeks before enzyme assay. The soil moisture was adjusted every 2 days by the difference of weights.
The hydrolytic enzyme assays were based on fluorescence of 4-methylumbelliferone (MUF) and 7-amino-4-methylcoumarin (MUC) [51]. The enzyme substrates (i.e., 400 µM of 4-MUF-β-d-glucopyranoside, 200 µM of 4-MUF-N-acetyl-β-d-glucosaminide, l-leucine-7-amido-4-methylcoumarin hydrochloride, and 4-MUF phosphate) were individually added to 1 g of incubated soils (soil-to-water ratio 1:7) for the activity of BG, NAG, LAP, and AP, respectively. After 1 h of incubation at room temperature in the dark, they were centrifuged, and the fluorescence of the supernatants was analyzed by spectrophotometry at an excitation wavelength of 330 nm and an emission wavelength of 450 nm on a black microplate reader (BioTek Instrument, Winooski, VT, USA. In order to take into account the background autofluorescence of the soil samples (quenching effect), a series of MUF and MUC standard solutions were prepared by mixing with the soil extracts (soil-to-water ratio 1:7) for each treatment. The activity is expressed as µmol of MUF or MUC·g−1 soil (dry weight)·h−1.
The activity of PO was measured by adding 10 mM L-dopa (dihydroxyphenylalanine) to the soil extracts (soil-to-water ratio 1:10) which were then incubated for 30 min in the dark at room temperature and shaken occasionally. The same number of blanks (milli-Q water was added to the soil extract) was also prepared in the same way. The absorbance was measured at a wavelength of 460 nm (BioTek SynergyMX). The activity of phenol oxidase was expressed as µmol of 2, 3-dihydroindole-5, 6-quinone-2-carboxylate (dicq)·g−1 soil (dry weight)·h−1. All reagents used came from Merck (Darmstadt, Germany).

2.6. Statistical Analysis
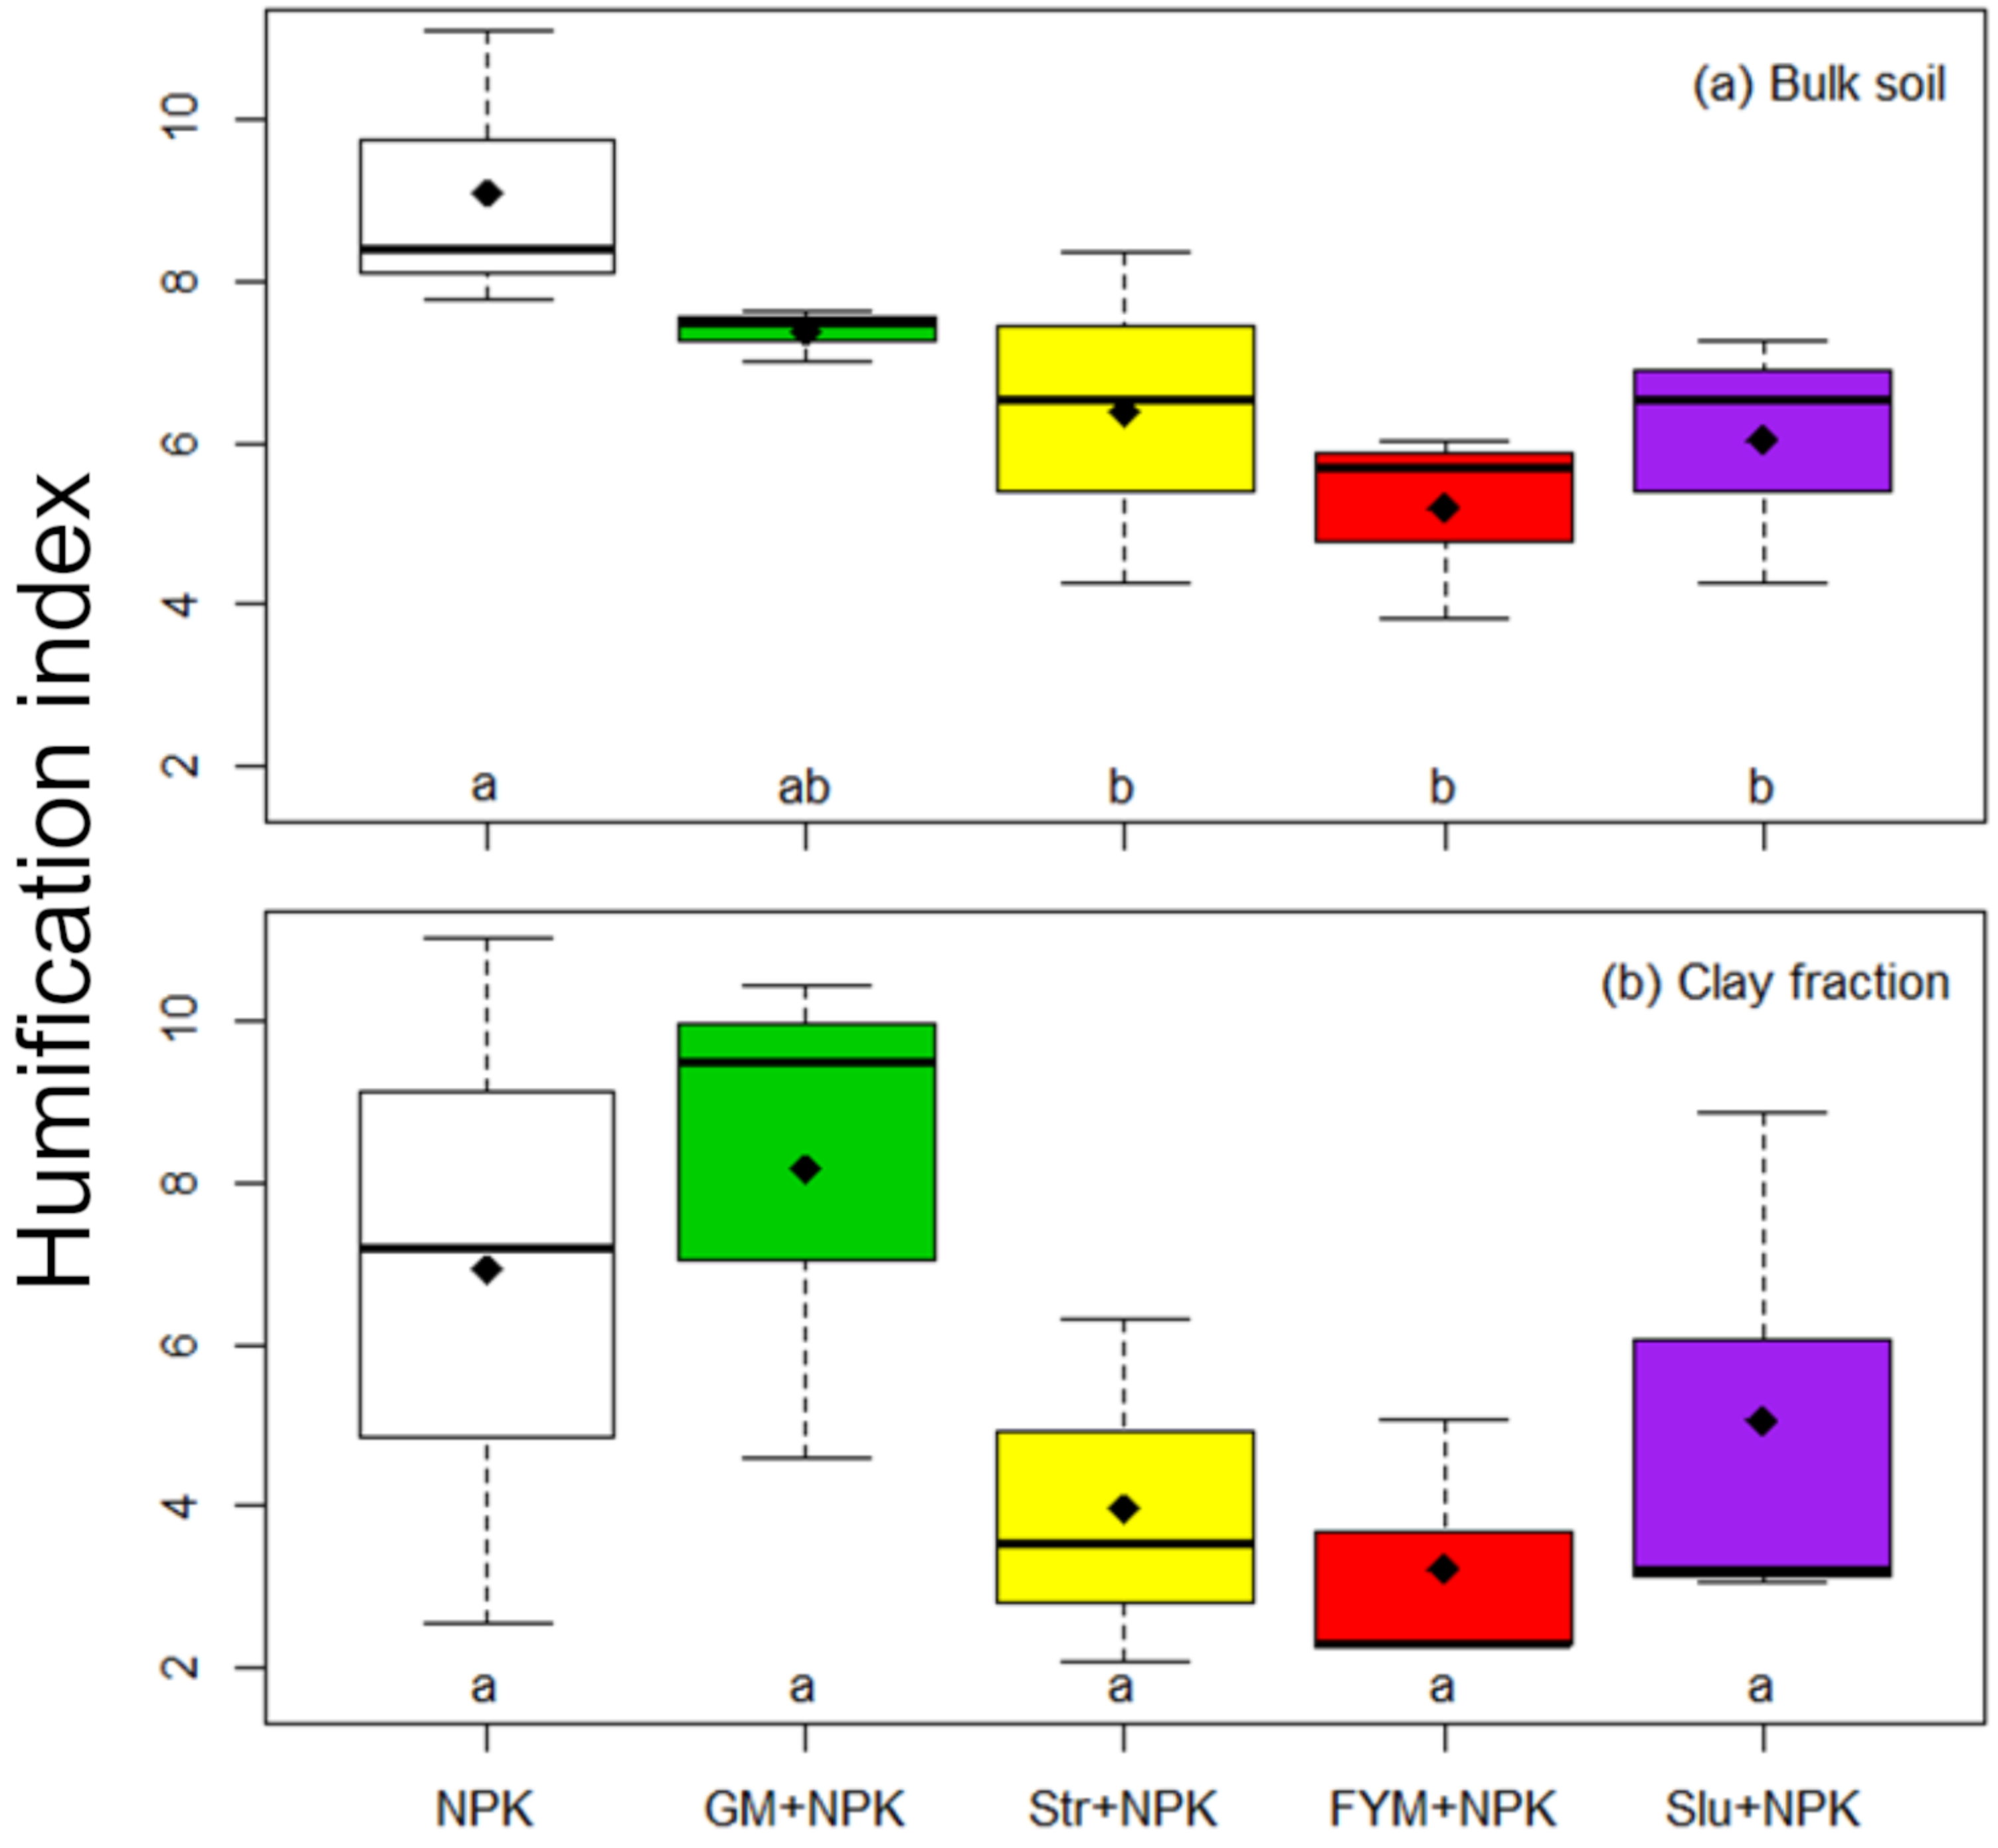
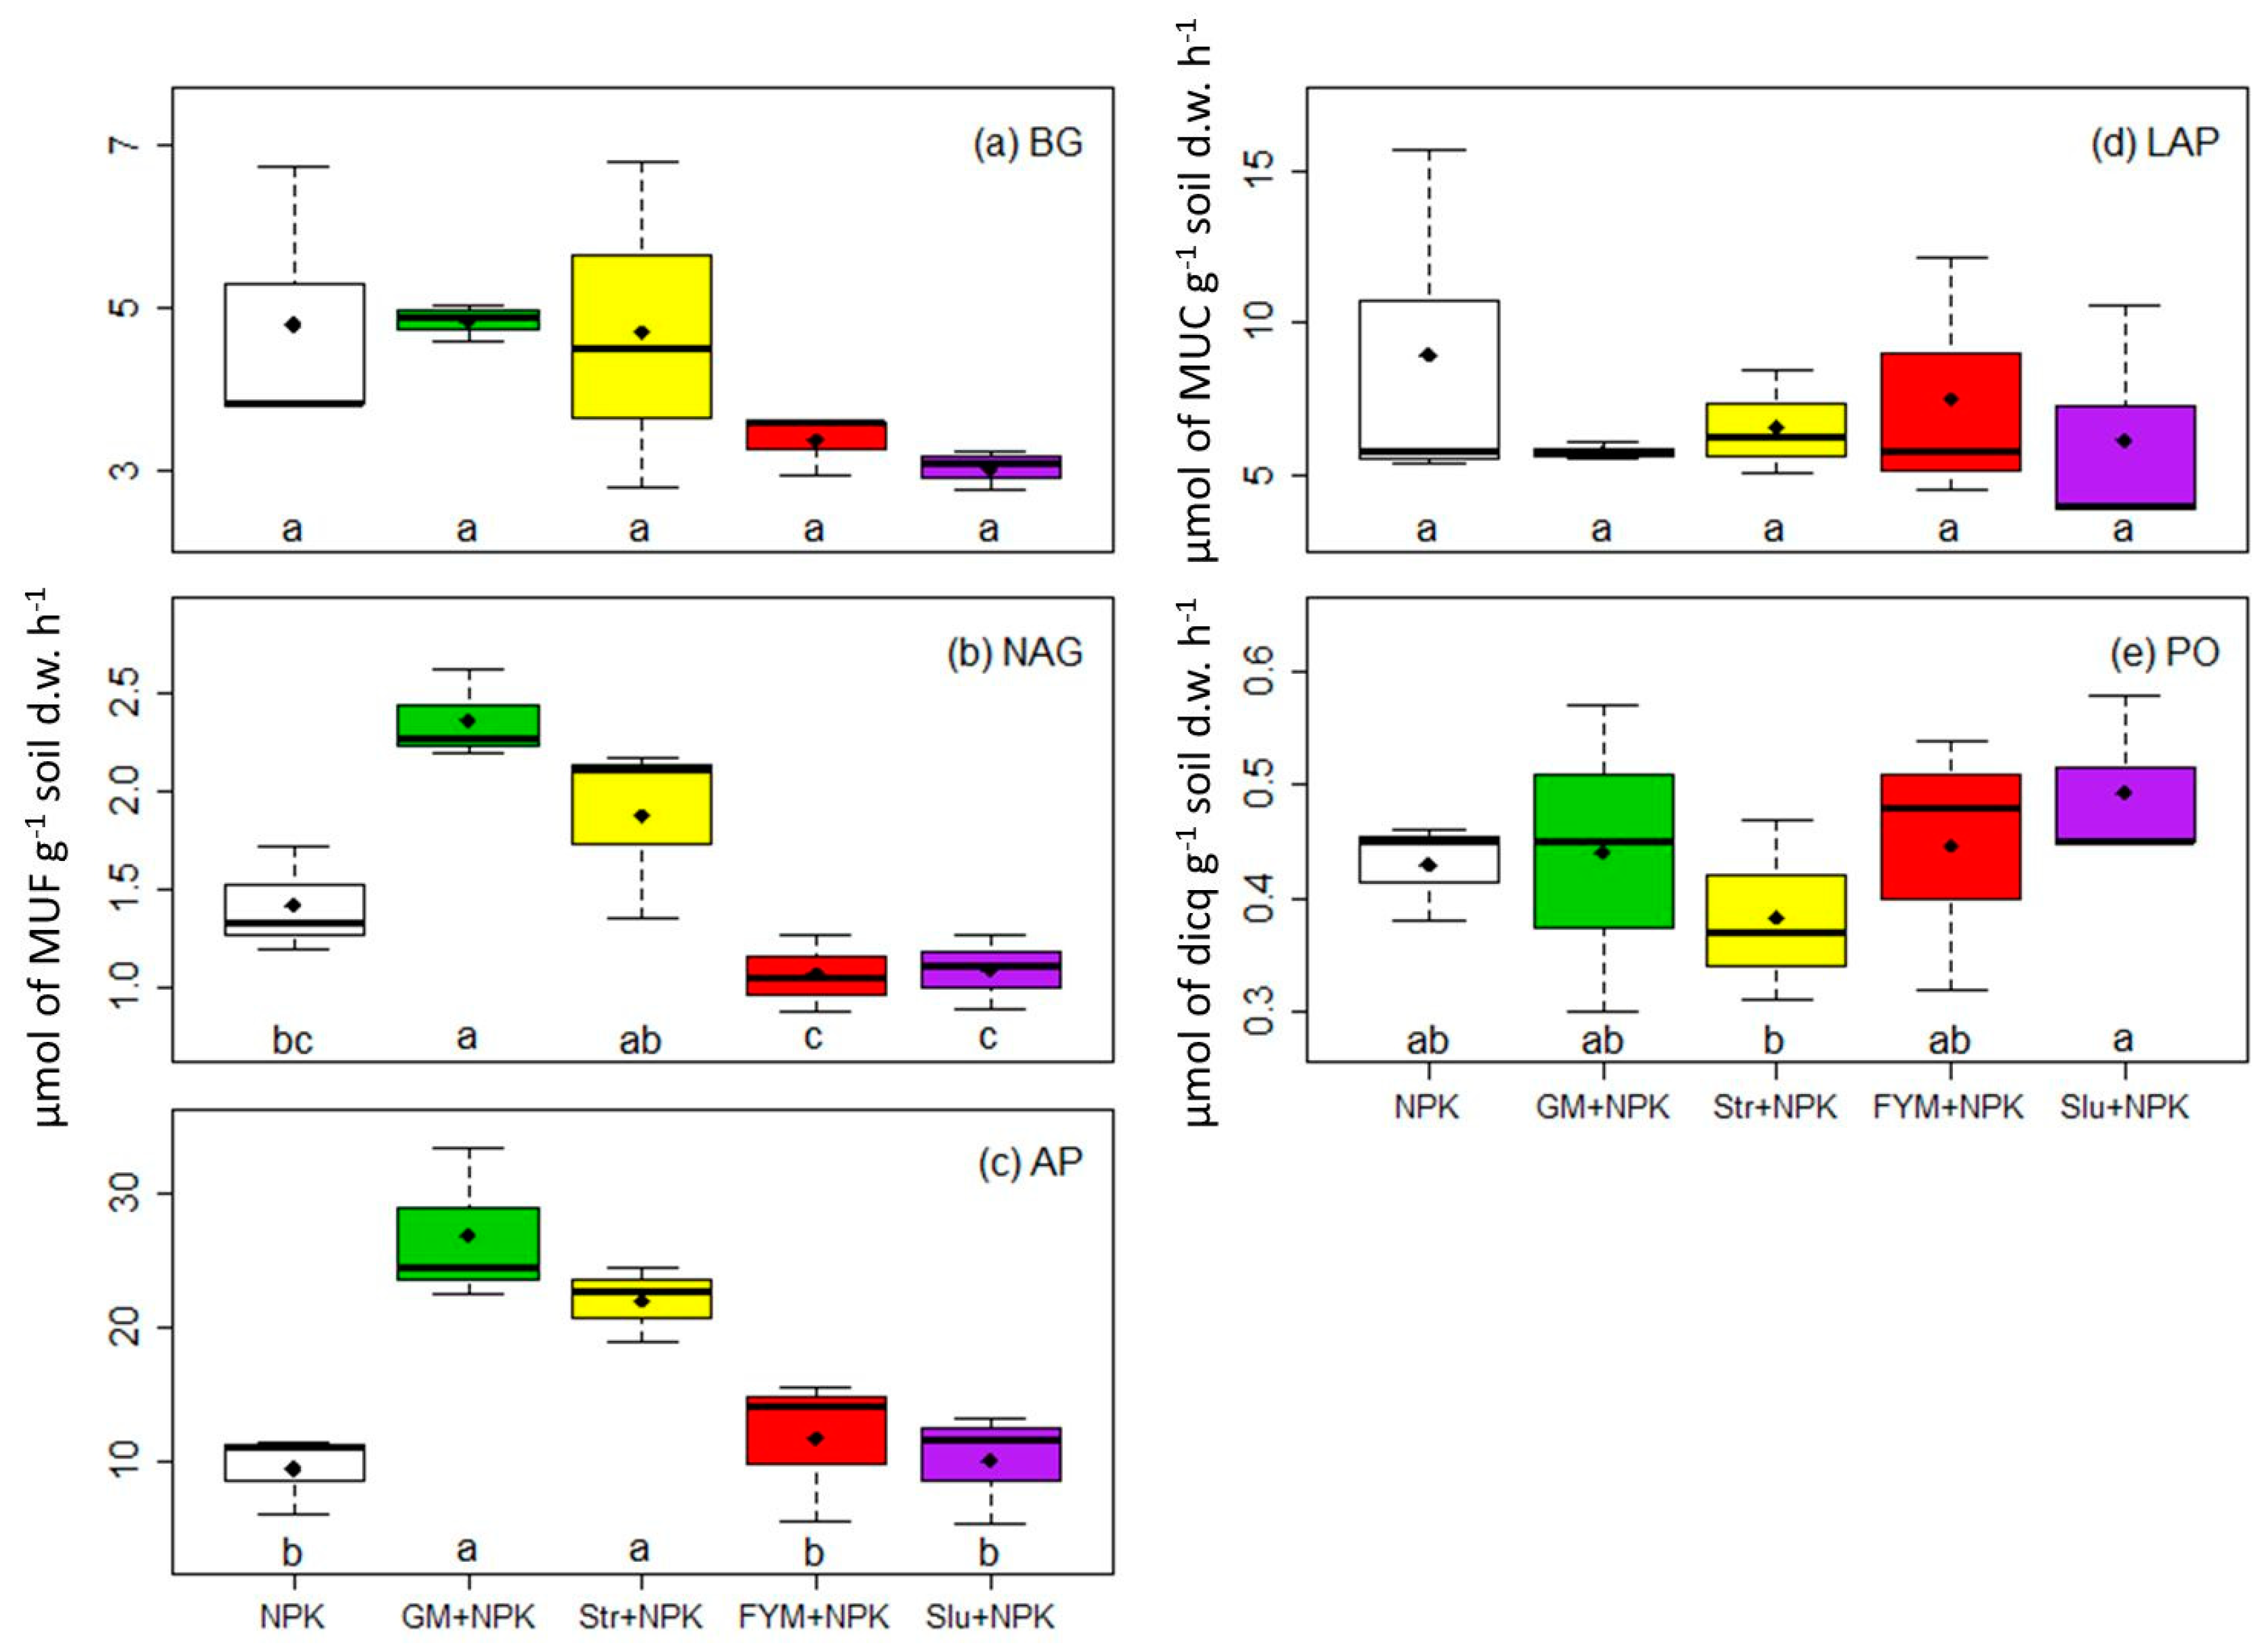
All statistical analyses were made with R software (version 3.5.0, R Core Team, Vienna, Austria). One-way ANOVA was applied to analyze the effects of different organic amendments and the Fisher’s protected least significant difference was applied as a post hoc test to assess significant differences among treatments. A principal component analysis (PCA) was performed on standardized variables to investigate the relationship between soil properties and SOM quality. If not specified, discussed differences were deemed significant at a p-value < 0.05.

3. Results

3.1. Chemical Characterization of Organic Amendments

Organic amendments differed considerably in total N (N-tot) and total P (P-tot) concentrations, both nutrients being particularly low in cereal straw as compared to farmyard manure and cattle slurry (Table 1). In addition, the amount of C inputs provided by the organic amendments increased in the following order: Slu + NPK = GM + NPK < FYM + NPK < Str + NPK (Table 1).
The major chemical differences emerging from the DRIFT spectra among the four organic amendments were associated with a relatively small, but still sharp peak at around 1725 cm−1 for green manure and cereal straw that can be ascribed to C=O stretching of carbonyl functions corresponding to organic acids (Figure 1). Two peaks common to all the four amendments can be identified at 1650 cm−1 and at 1600 cm−1, corresponding to C=O stretching and to aromatic C=C stretching or COO stretching, respectively. A large peak at around 1050 cm−1 can be identified as polysaccharides due to C–O stretching, which can be quite dominant especially for animal manures (Figure 1).
The biological reactivity index was significantly among between the four organic amendments indicating a clear difference between plant (GM: 2.28 ± 0.05; Str: 1.54 ± 0.05) and animal amendments (FYM: 0.09 ± 0.00; Slu: 0.14 ± 0.00). The green manure was the most enriched in reactive O-containing functional groups (ketone and carboxylic acids), followed by the cereal straw, while the farmyard manure (FYM) and the cattle slurry (Slu) were more enriched in recalcitrant, CHN-containing functional groups (aliphatic and aromatic compounds) (Figure 1).

3.2. Organic Carbon Content and Partitioning into Soil Particle-Size Fractions

The organic carbon content of bulk soil was not significantly affected by the treatments, even if there was an increasing trend in the following order: NPK < GM + NPK < Str + NPK < Slu + NPK < FYM + NPK (Table 2). The organic C content in the clay fraction increased with increasing content of bulk soil Corg, suggesting that organic C inputs from organic amendments were accumulated preferentially in the clay fraction (Figure 2). The relative increase of Corg in the fine sand fraction also showed a slightly increasing trend with increasing bulk soil Corg, while the other two particle-size fractions, i.e., coarse sand and silt, did not exhibit any trend in Corg (Figure 2). In terms of relative SOC change as compared to the NPK treatment only, the increase in Corg in the fine sand fraction was similar to that in the clay fraction for Str + NPK, FYM + NPK, and Slu + NPK addition, while, in the GM + NPK treatment, the SOC seemed to accumulate primarily in the sand fractions (Figure 3).
The type of amendment affected the humification index of bulk SOC (Figure 4a). Compared to the index of NPK treatment alone, Str + NPK, FYM + NPK, and Slu + NPK showed an index that was, respectively, 1.42, 1.75, and 1.51 times lower, whereas GM + NPK exhibited an intermediate value of humification. In the clay fraction, the Str + NPK, FYM + NPK, and Slu + NPK treatments also had the lowest humification index, but treatment effect was not significant (Figure 4b). The C retention coefficient tended to be higher with animal amendments (Slu + NPK = 0.17 ± 0.09; FYM + NPK: 0.14 ± 0.04) than with plant residues (Str + NPK = 0.06 ± 0.02; GM + NPK: 0.02 ± 0.04), even if the differences were not significant.

3.3. Soil Enzymatic Activity and Soil Properties

Compared to NPK treatment, NAG and AP activities were significantly higher in GM + NPK and Str + NPK treatments, while the activity in FYM + NPK and Slu + NPK were comparable (Figure 5b,c). Organic treatments had nonsignificant effects on the activity of LAP and BG activity (Figure 5a,d). The PO activity was relatively lower in the Str + NPK when compared to the Slu + NPK treatment (Figure 5e). Principal component analysis (Figure 6a, variables factor map) indicated a strong correlation between enzymatic activities (BG, NAG, and AP) and the coarse sand-associated SOC (positive) or the clay-associated SOC (negative), showing high activity values in the GM + NPK treatment (Figure 6b, individuals factor map). In addition, the PCA showed a positive correlation between the phenol oxidase activity and the clay-associated C content (Figure 6a) with high values in the FYM + NPK and Slu + NPK treatments (Figure 6b, individuals factor map).

4. Discussion

After 37 years of organic amendment application, we did not observe significantly different contents of SOC compared to the treatment with mineral fertilizer alone (NPK treatment), although a trend can be observed with lower values of SOC content in the NPK treatment and higher values in the FYM + NPK and Slu + NPK treatments (Table 2). The absence of significant differences in SOC content between mineral fertilization alone and organic amendment addition was previously reported in other studies [52,53,54]. The amount of amendment applied was relatively low, and no temporary grasslands, a determining factor for SOC accrual [6], were included in the rotation. It was previously reported that, under such conditions, recommended practices in Switzerland were not sufficient to increase or even maintain SOC levels [5,55]. Nonetheless, organic amendments affected the SOC distribution in the different soil particle-size fractions (Figure 2). While bulk SOC did not show clear trends, the clay-associated SOC fraction increased with increasing bulk SOC, especially for the Str-NPK, Slu-NPK, and FYM-NPK treatments, suggesting that the SOC gained from organic amendments was primarily stored in the finer particle-size fractions (Figure 2). This is a positive outcome for C sequestration as mineral-associated SOC with finer soil particles has a slower turnover rate compared to SOC associated with coarser soil particles [26].
The humification index of the bulk soil showed a clear trend with NPK > GM + NPK > Str + NPKSlu + NPKFYM + NPK (Figure 4a). A higher SOC humification with mineral fertilizer treatment alone (NKP) was reported in other studies [48,56]. The differences in humification index of the clay fraction were not significant among treatments (Figure 4b). This suggests that the different levels of humification in bulk soil were mainly driven by the proportion of clay-associated SOC rather than by a drastic change in SOM quality within the clay-size fractions.
Results on SOC stock should be interpreted by taking into account the low clay content of the soil in this study (143 g·kg−1 clay). The SOC-to-clay ratio changed from 1:13 in NPK to 1:11 in FYM+NPK, a trend that can be considered as a strong improvement toward a threshold (1:10) indicating good soil structure [30]. Below 1:13, the decrease in structural stability and porosity may even lead to temporary hypoxia, thus limiting plant productivity [30,57]. In terms of C sequestration, the C retention in FYM+NPK was consequent and in line with the 4‰ initiative with a SOC accrual rate of 4.4‰ ± 1.3‰ [58]. More generally, the fact that the observed changes in SOC were not statistically significant illustrates the difficulty in assessing Corg changes in soils with low clay content.
The composition of organic amendments affected the observed disparity on the C retention and SOC composition between treatments. Differences in C retention were linked to the reactivity index of the corresponding amendment, i.e., the degradability/mineralization of the organic material [36]. The green manure (GM) and the cereal straw (Str) were enriched in reactive, O-containing functional groups (Figure 1), whose presence is positively correlated with biological reactivity [59]. The observed higher reactivity of GM and Str amendments is expected to result in a more rapid turnover and, consequently, in a lower C retention compared to animal manures (Slu and FYM), at least in the upper soil horizon. The reactivity index and the C retention of different organic amendments are consistent with the measured activity of the main hydrolytic enzymes (Figure 5). The application of the most reactive amendments, i.e., GM and Str, resulted in relatively higher hydrolytic and lower oxidative enzyme activities suggesting that the chemical quality of GM and Str promoted the soil microbial metabolism [60].
The observed strong associations between the amount of SOC in the sand fraction (positive) and in the clay fraction (negative) and enzymatic activity (Figure 6) illustrate the trade-off between agronomic measures promoting food security and measures to favor C sequestration. Indeed, the first measures are associated with high microbial activity and nutrient turnover (e.g., GM), whereas the second measures require SOC accrual and slow organic matter turnover (e.g., FYM and Str). The straw amendment, although chemically different from the animal-derived amendments, showed a behavior similar to the animal-derived manure in terms of organic C distribution, but a behavior similar to green manure for what concerns the enzyme activity. This is likely because the large amount of C inputs from straw residues (Table 1) compensated for their high degradability.
In addition to the higher degradability of GM and Str, the stoichiometry of the input may be responsible for the very low C retention of these two amendments (Table 1). Soil amendments with high C-to-nutrient ratios are expected to reduce the microbial C use efficiency and to promote nutrient mining in SOM [61,62,63]. The stronger increase in phosphatase and chitinase activities compared to glucosidase activities in GM and Str suggests a lack of nutrient availability for microbial communities [64]. The fact that the leucine aminopeptidase activity was not affected, differently from the N-acteylglucoaminidase, can be interpreted as indication that microorganisms were mining for nutrients, especially N in amino-sugars from microbial necromass [65,66]. As microbial necromass is a major contributor of mineral-associated C, this may explain why clay-associated SOC did not increase in GM and only little in Str despite very high C inputs [67,68].

5. Conclusions

After 37 years of application of different organic amendments, the concentration of SOC only slightly increased with a positive, although not significant trend from mineral fertilizer treatment (NPK) alone and organic treatments (FYM + NPK and Slu + NPK). Organic amendment increased the clay-associated SOC fraction, thus decreasing the SOC-to-clay ratio and contributing to the promotion of SOC stability and soil structure. The composition of organic amendments affected the observed disparity between SOC retention and SOC quality. From the C sequestration aspect, the C retention in FYM-NPK was 4.4‰ ± 1.3‰ showing that the aspirational goal of the 4‰ initiative is attainable. The same could not be stated for the GM and Str amendments that had a lower C retention coefficient due to higher degradability and differences in stoichiometry.
Overall, the present study shows that the climate change mitigation potential of organic amendments in low clay soil is limited; however, even small C accrual in these soils may be important for climate change adaptation, food security, and soil health improvements. These findings demonstrate a close relationship among the biological reactivity of organic amendments, the distribution of SOC in soil particle fractions, and, potentially, long-term sequestration trends. Our data seem to indicate that, in a stockless management of SOC, cereal straw restitution offers a viable alternative solution to animal manures to increase and stabilize SOC.

Author Contributions

Conceptualization, S.S., A.K. and A.M.; formal analysis, A.K. and A.M.; investigation, A.K.; data curation, S.S.; writing—original draft preparation, A.K.; writing—review and editing, L.B., T.G. and S.S.; visualization, A.M.; funding acquisition, S.S. All authors have read and agreed to the published version of the manuscript.

Funding

This research has been funded by Agroscope.

Acknowledgments

The authors gratefully acknowledge the financial support provided by Agroscope. The authors thank Roxane Kohler-Milleret (Institute of Biology, University of Neuchâtel, Switzerland) for the assistance during the particle-size fractionation.

Conflicts of Interest

The authors declare no conflict of interest.

References

  1. Lal, R. Digging deeper: A holistic perspective of factors affecting soil organic carbon sequestration in agroecosystems. Glob. Chang. Biol. 2018, 24, 3285–3301. [Google Scholar] [CrossRef] [PubMed]
  2. Sanderman, J.; Hengl, T.; Fiske, G.J. Soil carbon debt of 12,000 years of human land use. Proc. Natl. Acad. Sci. USA 2017, 114, 9575–9580. [Google Scholar] [CrossRef] [PubMed] [Green Version]
  3. Lal, R. Soil carbon sequestration impacts on global climate change and food security. Science 2004, 304, 1623–1627. [Google Scholar] [CrossRef] [PubMed] [Green Version]
  4. Amelung, W.; Bossio, D.; Vries, W. De Towards a global-scale soil climate mitigation strategy. Nat. Commun. 2020, 1–10. [Google Scholar] [CrossRef]
  5. Keel, S.G.; Anken, T.; Büchi, L.; Chervet, A.; Fliessbach, A.; Flisch, R.; Huguenin-Elie, O.; Mäder, P.; Mayer, J.; Sinaj, S.; et al. Loss of soil organic carbon in Swiss long-term agricultural experiments over a wide range of management practices. Agric. Ecosyst. Environ. 2019, 286, 106654. [Google Scholar] [CrossRef] [Green Version]
  6. Guillaume, T.; Bragazza, L.; Levasseur, C.; Libohova, Z.; Sinaj, S. Long-term soil organic carbon dynamics in temperate cropland-grassland systems. Agric. Ecosyst. Environ. 2021, 305. [Google Scholar] [CrossRef]
  7. Fließbach, A.; Oberholzer, H.R.; Gunst, L.; Mäder, P. Soil organic matter and biological soil quality indicators after 21 years of organic and conventional farming. Agric. Ecosyst. Environ. 2007, 118, 273–284. [Google Scholar] [CrossRef]
  8. Benbi, D.K.; Toor, A.S.; Kumar, S. Management of organic amendments in rice-wheat cropping system determines the pool where carbon is sequestered. Plant Soil 2012, 360, 145–162. [Google Scholar] [CrossRef]
  9. Blanchet, G.; Gavazov, K.; Bragazza, L.; Sinaj, S. Responses of soil properties and crop yields to different inorganic and organic amendments in a Swiss conventional farming system. Agric. Ecosyst. Environ. 2016, 230, 116–126. [Google Scholar] [CrossRef] [Green Version]
  10. Lal, R. Challenges and opportunities in soil organic matter research. Eur. J. Soil Sci. 2009, 60, 158–169. [Google Scholar] [CrossRef]
  11. Maltas, A.; Kebli, H.; Oberholzer, H.R.; Weisskopf, P.; Sinaj, S. The effects of organic and mineral fertilizers on carbon sequestration, soil properties, and crop yields from a long-term field experiment under a Swiss conventional farming system. Land Degrad. Dev. 2018, 29, 926–938. [Google Scholar] [CrossRef]
  12. Šimon, T.; Mikanová, O.; Cerhanová, D. Long-term effect of straw and farmyard manure on soil organic matter in field experiment in the Czech Republic. Arch. Agron. Soil Sci. 2013, 59, 1193–1205. [Google Scholar] [CrossRef]
  13. Chenu, C.; Angers, D.A.; Barré, P.; Derrien, D.; Arrouays, D.; Balesdent, J. Increasing organic stocks in agricultural soils: Knowledge gaps and potential innovations. Soil Tillage Res. 2019. [Google Scholar] [CrossRef]
  14. Bai, X.; Huang, Y.; Ren, W.; Coyne, M.; Jacinthe, P.A.; Tao, B.; Hui, D.; Yang, J.; Matocha, C. Responses of soil carbon sequestration to climate-smart agriculture practices: A meta-analysis. Glob. Chang. Biol. 2019, 25, 2591–2606. [Google Scholar] [CrossRef] [PubMed]
  15. Schmidt, M.W.I.; Torn, M.S.; Abiven, S.; Dittmar, T.; Guggenberger, G.; Janssens, I.A.; Kleber, M.; Kögel-Knabner, I.; Lehmann, J.; Manning, D.A.C.; et al. Persistence of soil organic matter as an ecosystem property. Nature 2011, 478, 49–56. [Google Scholar] [CrossRef] [Green Version]
  16. Kleber, M.; Eusterhues, K.; Keiluweit, M.; Mikutta, C.; Mikutta, R.; Nico, P.S. Mineral-Organic Associations: Formation, Properties, and Relevance in Soil Environments; Elsevier Ltd.: Amsterdam, The Netherlands, 2015; Volume 130. [Google Scholar]
  17. Lavallee, J.M.; Soong, J.L.; Cotrufo, M.F. Conceptualizing soil organic matter into particulate and mineral-associated forms to address global change in the 21st century. Glob. Chang. Biol. 2019, 261–273. [Google Scholar] [CrossRef] [Green Version]
  18. Haddix, M.L.; Gregorich, E.G.; Helgason, B.L.; Janzen, H.; Ellert, B.H.; Francesca Cotrufo, M. Climate, carbon content, and soil texture control the independent formation and persistence of particulate and mineral-associated organic matter in soil. Geoderma 2020, 363, 114160. [Google Scholar] [CrossRef]
  19. Six, J.; Feller, C.; Denef, K.; Ogle, S.M.; de Morales Sa, J.C.; Albrect, A. Soil organic matter, biota and aggregation in temperate and tropical soils—Effects of no-tillage. Agronomie 2002, 22, 755–775. [Google Scholar] [CrossRef] [Green Version]
  20. von Lutzow, M.; Kogel-Knabner, I.; Ekschmittb, K.; Flessa, H.; Guggenberger, G.; Matzner, E.; Marschner, B. SOM fractionation methods: Relevance to functional pools and to stabilization mechanisms. Soil Biol. Biochem. 2007, 39, 2183–2207. [Google Scholar] [CrossRef]
  21. Poeplau, C.; Don, A.; Six, J.; Kaiser, M.; Benbi, D.; Chenu, C.; Cotrufo, M.F.; Derrien, D.; Gioacchini, P.; Grand, S.; et al. Isolating organic carbon fractions with varying turnover rates in temperate agricultural soils—A comprehensive method comparison. Soil Biol. Biochem. 2018. [Google Scholar] [CrossRef] [Green Version]
  22. Giannetta, B.; Plaza, C.; Vischetti, C.; Cotrufo, M.F.; Zaccone, C. Distribution and thermal stability of physically and chemically protected organic matter fractions in soils across different ecosystems. Biol. Fertil. Soils 2018, 54, 671–681. [Google Scholar] [CrossRef]
  23. Courtier-Murias, D.; Simpson, A.J.; Marzadori, C.; Baldoni, G.; Ciavatta, C.; Fernández, J.M.; López-de-Sá, E.G.; Plaza, C. Unraveling the long-term stabilization mechanisms of organic materials in soils by physical fractionation and NMR spectroscopy. Agric. Ecosyst. Environ. 2013, 171, 9–18. [Google Scholar] [CrossRef] [Green Version]
  24. Hassink, J. A Model of the Physical Protection of Organic Matter in Soils The capacity of soils to preserve organic C and N by their association with clay and silt particles. Plant Soil 1997, 191, 77–87. [Google Scholar] [CrossRef]
  25. Six, J.; Conant, R.T.; Paul, E.A.; Paustian, K. Stabilization mechanisms of soil organic matter: Implications for C-saturation of soils. Plant Soil 2002, 241, 155–176. [Google Scholar] [CrossRef]
  26. Cotrufo, M.F.; Ranalli, M.G.; Haddix, M.L.; Six, J.; Lugato, E. Soil carbon storage informed by particulate and mineral-associated organic matter. Nat. Geosci. 2019, 12, 1–6. [Google Scholar] [CrossRef]
  27. Dexter, A.R.; Richard, G.; Arrouays, D.; Czyz, E.A.; Jolivet, C.; Duval, O. Complexed organic matter controls soil physical properties. Geoderma 2008, 144, 620–627. [Google Scholar] [CrossRef]
  28. Keller, T.; Dexter, A.R. Plastic limits of agricultural soils as functions of soil texture and organic matter content. Soil Res. 2012, 50, 7–17. [Google Scholar] [CrossRef]
  29. Abiven, S.; Menasseri, S.; Chenu, C. The effects of organic inputs over time on soil aggregate stability—A literature analysis. Soil Biol. Biochem. 2009, 41, 1–12. [Google Scholar] [CrossRef]
  30. Johannes, A.; Matter, A.; Schulin, R.; Weisskopf, P.; Baveye, P.C.; Boivin, P. Optimal organic carbon values for soil structure quality of arable soils. Does clay content matter? Geoderma 2017, 302, 14–21. [Google Scholar] [CrossRef]
  31. Cotrufo, M.F.; Wallenstein, M.D.; Boot, C.M.; Denef, K.; Paul, E. The Microbial Efficiency-Matrix Stabilization (MEMS) framework integrates plant litter decomposition with soil organic matter stabilization: Do labile plant inputs form stable soil organic matter? Glob. Chang. Biol. 2013, 19, 988–995. [Google Scholar] [CrossRef] [Green Version]
  32. Averill, C.; Waring, B. Nitrogen limitation of decomposition and decay: How can it occur? Glob. Chang. Biol. 2018, 24, 1417–1427. [Google Scholar] [CrossRef] [PubMed] [Green Version]
  33. Qiao, N.; Xu, X.; Hu, Y.; Blagodatskaya, E.; Liu, Y.; Schaefer, D.; Kuzyakov, Y. Carbon and nitrogen additions induce distinct priming effects along an organic-matter decay continuum. Sci. Rep. 2016, 6, 19865. [Google Scholar] [CrossRef] [PubMed]
  34. Dippold, M.; Biryukov, M.; Kuzyakov, Y. Sorption affects amino acid pathways in soil: Implications from position-specific labeling of alanine. Soil Biol. Biochem. 2014, 72, 180–192. [Google Scholar] [CrossRef]
  35. Burns, R.G.; DeForest, J.L.; Marxsen, J.; Sinsabaugh, R.L.; Stromberger, M.E.; Wallenstein, M.D.; Weintraub, M.N.; Zoppini, A. Soil enzymes in a changing environment: Current knowledge and future directions. Soil Biol. Biochem. 2013, 58, 216–234. [Google Scholar] [CrossRef]
  36. Ding, G.; Novak, J.M.; Amarasiriwardena, D.; Hunt, P.G.; Xing, B. Soil Organic Matter Characteristics as Affected by Tillage Management. Soil Sci. Soc. Am. J. 2002, 66, 421–429. [Google Scholar] [CrossRef]
  37. Veum, K.S.; Goyne, K.W.; Kremer, R.J.; Miles, R.J.; Sudduth, K.A. Biological indicators of soil quality and soil organic matter characteristics in an agricultural management continuum. Biogeochemistry 2014, 117, 81–99. [Google Scholar] [CrossRef]
  38. Margenot, A.J.; Calderón, F.J.; Bowles, T.M.; Parikh, S.J.; Jackson, L.E. Soil Organic Matter Functional Group Composition in Relation to Organic Carbon, Nitrogen, and Phosphorus Fractions in Organically Managed Tomato Fields. Soil Sci. Soc. Am. J. 2015, 79, 772. [Google Scholar] [CrossRef]
  39. Maillard, É.; Angers, D.A. Animal manure application and soil organic carbon stocks: A meta-analysis. Glob. Chang. Biol. 2014, 20, 666–679. [Google Scholar] [CrossRef]
  40. Samson, M.É.; Chantigny, M.H.; Vanasse, A.; Menasseri-Aubry, S.; Angers, D.A. Coarse mineral-associated organic matter is a pivotal fraction for SOM formation and is sensitive to the quality of organic inputs. Soil Biol. Biochem. 2020, 149. [Google Scholar] [CrossRef]
  41. Jilling, A.; Kane, D.; Williams, A.; Yannarell, A.C.; Davis, A.; Jordan, N.R.; Koide, R.T.; Mortensen, D.A.; Smith, R.G.; Snapp, S.S.; et al. Rapid and distinct responses of particulate and mineral-associated organic nitrogen to conservation tillage and cover crops. Geoderma 2020, 359, 114001. [Google Scholar] [CrossRef]
  42. Häni, F.J.; Sarthou, V. Protection des Plantes en Production Intégrée: Grandes Cultures: Maladies, Ravageurs, Auxiliaires; LmZ—Centrale des moyens d’enseignement agricole: Zollikofen, Switzerland, 2004. [Google Scholar]
  43. Sinaj, S.; Richner, W. Principes de fertilisation des cultures agricoles en Suisse (PRIF 2017). Rech. Agron. Suisse Publ. Spéciale 2017, 8, 276. [Google Scholar]
  44. von Haden, A.C.; Yang, W.H.; DeLucia, E.H. Soils’ dirty little secret: Depth-based comparisons can be inadequate for quantifying changes in soil organic carbon and other mineral soil properties. Glob. Chang. Biol. 2020, 26, 3759–3770. [Google Scholar] [CrossRef] [PubMed]
  45. Stemmer, M.; Gerzabek, M.H.; Kandeler, E. Organic matter and enzyme activity in particle-size fractions of soils obtained after low-energy sonication. Soil Biol. Biochem. 1998, 30, 9–17. [Google Scholar] [CrossRef]
  46. Antil, R.S.; Gerzabek, M.H.; Haberhauer, G.; Eder, G. Long-term effects of cropped vs. fallow and fertilizer amendments on soil organic matter. I. Organic carbon. J. Plant Nutr. Soil Sci. 2005, 168, 108–116. [Google Scholar] [CrossRef]
  47. Poppe, L.J.; Fredericks, J.J.; Hathaway, J.C. A computer program to calculate centrifugation parameters for sedimentation analyses. Comput. Geosci. 1988, 14, 541–545. [Google Scholar] [CrossRef]
  48. Demyan, M.S.; Rasche, F.; Schulz, E.; Breulmann, M.; Müller, T.; Cadisch, G. Use of specific peaks obtained by diffuse reflectance Fourier transform mid-infrared spectroscopy to study the composition of organic matter in a Haplic Chernozem. Eur. J. Soil Sci. 2012, 63, 189–199. [Google Scholar] [CrossRef]
  49. Reeves, J.B. Near- versus mid-infrared diffuse reflectance spectroscopy for soil analysis emphasizing carbon and laboratory versus on-site analysis: Where are we and what needs to be done? Geoderma 2010, 158, 3–14. [Google Scholar] [CrossRef]
  50. González Pérez, M.; Martin-Neto, L.; Saab, S.C.; Novotny, E.H.; Milori, D.M.B.P.; Bagnato, V.S.; Colnago, L.A.; Melo, W.J.; Knicker, H. Characterization of humic acids from a Brazilian Oxisol under different tillage systems by EPR, 13C NMR, FTIR and fluorescence spectroscopy. Geoderma 2004, 118, 181–190. [Google Scholar] [CrossRef]
  51. Marx, M.-C.; Wood, M.; Jarvis, S. A microplate fluorimetric assay for the study of enzyme diversity in soils. Soil Biol. Biochem. 2001, 33, 1633–1640. [Google Scholar] [CrossRef]
  52. Shahbaz, M.; Menichetti, L.; Kätterer, T.; Börjesson, G. Impact of long-term N fertilisation on CO2 evolution from old and young SOM pools measured during the maize cropping season. Sci. Total Environ. 2019, 658, 1539–1548. [Google Scholar] [CrossRef]
  53. Lemke, R.L.; VandenBygaart, A.J.; Campbell, C.A.; Lafond, G.P.; Grant, B. Crop residue removal and fertilizer N: Effects on soil organic carbon in a long-term crop rotation experiment on a Udic Boroll. Agric. Ecosyst. Environ. 2010, 135, 42–51. [Google Scholar] [CrossRef]
  54. Taghizadeh-Toosi, A.; Olesen, J.E. Modelling soil organic carbon in Danish agricultural soils suggests low potential for future carbon sequestration. Agric. Syst. 2016, 145, 83–89. [Google Scholar] [CrossRef]
  55. Emmel, C.; Winkler, A.; Hörtnagl, L.; Revill, A.; Ammann, C.; D’Odorico, P.; Buchmann, N.; Eugster, W. Integrated management of a Swiss cropland is not sufficient to preserve its soil carbon pool in the long term. Biogeosciences 2018, 15, 5377–5393. [Google Scholar] [CrossRef] [Green Version]
  56. Menšík, L.; Hlisnikovský, L.; Pospíšilová, L.; Kunzová, E. The effect of application of organic manures and mineral fertilizers on the state of soil organic matter and nutrients in the long-term field experiment. J. Soils Sediments 2018, 18, 2813–2822. [Google Scholar] [CrossRef]
  57. Johannes, A.; Weisskopf, P.; Schulin, R.; Boivin, P. Soil structure quality indicators and their limit values. Ecol. Indic. 2019. [Google Scholar] [CrossRef]
  58. Rumpel, C.; Amiraslani, F.; Chenu, C.; Garcia Cardenas, M.; Kaonga, M.; Koutika, L.S.; Ladha, J.; Madari, B.; Shirato, Y.; Smith, P.; et al. The 4p1000 initiative: Opportunities, limitations and challenges for implementing soil organic carbon sequestration as a sustainable development strategy. Ambio 2020, 49, 350–360. [Google Scholar] [CrossRef] [Green Version]
  59. Marschner, B.; Kalbitz, K. Controls of bioavailability and biodegradability of dissolved organic matter in soils. Geoderma 2003, 113, 211–235. [Google Scholar] [CrossRef]
  60. Tejada, M.; Gonzalez, J.L.; García-Martínez, A.M.; Parrado, J. Application of a green manure and green manure composted with beet vinasse on soil restoration: Effects on soil properties. Bioresour. Technol. 2008, 99, 4949–4957. [Google Scholar] [CrossRef]
  61. Bertrand, I.; Viaud, V.; Daufresne, T.; Pellerin, S.; Recous, S. Stoichiometry constraints challenge the potential of agroecological practices for the soil C storage. A review. Agron. Sustain. Dev. 2019, 39. [Google Scholar] [CrossRef]
  62. Rüegg, J.; Quezada, J.C.; Santonja, M.; Ghazoul, J.; Kuzyakov, Y.; Buttler, A.; Guillaume, T. Drivers of soil carbon stabilization in oil palm plantations. Land Degrad. Dev. 2019, 1–12. [Google Scholar] [CrossRef]
  63. Finn, D.; Page, K.; Catton, K.; Kienzle, M.; Robertson, F.; Armstrong, R.; Dalal, R. Ecological stoichiometry controls the transformation and retention of plant-derived organic matter to humus in response to nitrogen fertilisation. Soil Biol. Biochem. 2016, 99, 117–127. [Google Scholar] [CrossRef] [Green Version]
  64. Loeppmann, S.; Blagodatskaya, E.; Pausch, J.; Kuzyakov, Y. Enzyme properties down the soil profile—A matter of substrate quality in rhizosphere and detritusphere. Soil Biol. Biochem. 2016, 103, 274–283. [Google Scholar] [CrossRef]
  65. He, H.; Zhang, W.; Zhang, X.; Xie, H.; Zhuang, J. Temporal responses of soil microorganisms to substrate addition as indicated by amino sugar differentiation. Soil Biol. Biochem. 2011, 43, 1155–1161. [Google Scholar] [CrossRef]
  66. Joergensen, R.G. Amino sugars as specific indices for fungal and bacterial residues in soil. Biol. Fertil. Soils 2018, 54, 559–568. [Google Scholar] [CrossRef]
  67. Chen, J.; Dippold, M.A.; Seven, J.; Zilla, T.; Blagodatskaya, E.; Kuzyakov, Y. Microbial C:N:P stoichiometry and turnover depend on nutrients availability in soil: A 14C, 15N and 33P triple labelling study. Soil Biol. Biochem. 2019. [Google Scholar] [CrossRef]
  68. Cui, J.; Zhu, Z.; Xu, X.; Liu, S.; Jones, D.L.; Kuzyakov, Y.; Shibistova, O.; Wu, J.; Ge, T. Carbon and nitrogen recycling from microbial necromass to cope with C:N stoichiometric imbalance by priming. Soil Biol. Biochem. 2020, 142, 107720. [Google Scholar] [CrossRef]
Figure 1. Diffuse reflectance infrared Fourier-transform spectroscopy (DRIFT) spectra of organic amendments. All spectra were maximized on the same Y-axis to facilitate the direct comparison of spectra. Green manure = mustard; straw = wheat straw; FYM = farmyard manure; slurry = cattle slurry.
Agronomy 10 01977 g001
Figure 2. Relationship between mean (± standard error, n = 3) organic C (Corg; g Corg·kg−1 soil) in bulk soil and mean Corg (g Corg·kg−1 soil) in each size fraction. Linear regression functions are reported.
Agronomy 10 01977 g002
Figure 3. Distribution of relative abundance (% ± standard error, n = 3) of Corg in the different size fractions for the four organic amendments in comparison to the NPK treatment (mineral fertilization alone). Along the x-axis, each amendment treatment is ordered in relation to increasing bulk Corg content relatively to the NPK treatment (see Table 2). For each size fraction, mean value of each treatment was ranked by increasing mean content of Corg g·kg−1 of bulk soil. NPK: mineral fertilization alone where N, P, and K refer to mineral nitrogen, phosphorus and potassium; GM + NPK: green manure + mineral fertilization; Str + NPK: cereal straw + mineral fertilization; FYM + NPK: farmyard manure + mineral fertilization; Slu + NPK: cattle slurry + mineral fertilization.
Agronomy 10 01977 g003
Figure 4. Humification index for bulk soils (a) and clay fraction (b) Different letters indicate significant differences between treatments (p < 0.05; n = 3). The centerline represents the median, the dot represents the mean, the lower and the upper lines of the boxplot represent the 25th and the 75th percentiles, and the box whiskers represent minimum and maximum values. NPK: mineral fertilization alone; GM + NPK: green manure + mineral fertilization; Str + NPK: cereal straw + mineral fertilization; FYM + NPK: farmyard manure + mineral fertilization; Slu + NPK: cattle slurry + mineral fertilization.
Agronomy 10 01977 g004
Figure 5. Soil enzyme activity of (a) β-glucosidase (BG), (b) β-1,4-N-acetylglucosaminidase (NAG), (c) phosphatase (AP), (d) leucine aminopeptidase (LAP), and (e) phenol oxidase (PO). Different letters indicate significant differences between treatments (p < 0.05; n = 3). The centerline represents the median, the dot represents the mean, the lower and the upper lines of the boxplot represent the 25th and the 75th percentiles, and the box whiskers represent minimum and maximum values. NPK: mineral fertilization alone; GM + NPK: green manure + mineral fertilization; Str + NPK: cereal straw + mineral fertilization; FYM + NPK: farmyard manure + mineral fertilization; Slu + NPK: cattle slurry + mineral fertilization.
Agronomy 10 01977 g005
Figure 6. Principal component analysis (PCA) on both quantitative and qualitative parameters of the bulk soil with variables (a) and observations (b). The colored area indicates the 95% confidence ellipse of each treatment, with the centered dot indicating the mean and the smaller dots indicating the replicates (n = 3). Variables: bulk soil Corg, humification degree of soil organic matter, Corg content (g·kg−1) in the soil particle fractions (Corg coarse sand, Corg fine sand, Corg silt and Corg clay) and activity of enzymes (BG: β-glucosidase; NAG: β-1,4-N-acetylglucosaminidase; LAP: leucine aminopeptidase; AP: phosphatase; PO: phenol oxidase). Total fresh C input (total C input) was added as supplementary information that was not taken into account in the PCA analysis. NPK: mineral fertilization alone; GM + NPK: green manure + mineral fertilization; Str + NPK: cereal straw + mineral fertilization; FYM + NPK: farmyard manure + mineral fertilization; Slu + NPK: cattle slurry + mineral fertilization.
Agronomy 10 01977 g006
Table 1. Description and characterization of all the fertilization treatments.
TreatmentOrganic Amendments Mineral Fertilization (kg·ha−1)
Type of AmendmentsApplication FrequencyChemical Properties
(g·kg−1 DM)
Total C Input
since 1976
(t·ha−1)
Crop Type
C-orgN-totP-totWheatBarley/
Spring Oat
RapeseedMaize
NPK------110 N
30.5 P
99.6 K
70 N
30.5 P
99.6 K
110 N
30.5 P
99.6 K
110 N
30.5 P
99.6 K
GM + NPKMustard (Brassica juncea) incorporation, typically cultivated between two cropping seasonsEvery 2 years446.316.73.420.4110 N
30.5 P
99.6 K
70 N
30.5 P
99.6 K
110 N
30.5 P
99.6 K
110 N
30.5 P
99.6 K
Str + NPKCereal straw restitution
(wheat, barley and oat)
Years with cereal450.74.51.153.0110 N
26.2 P
66.4 K
70 N
26.2 P
66.4 K
110 N
26.2 P
66.4 K
110 N
26.2 P
66.4 K
FYM + NPKFarmyard manure
(35 t/ha)
Every 3 years424.0 *19.612.637.0110 N
21.8 P
66.4 K
70 N
21.8 P
66.4 K
110 N
0 P
0 K
110 N
0 P
0 K
Slu + NPKCattle slurry
(60 m3/ha)
1976–1993: every year
1994-present: every 3 years
410.0 *26.019.120.4110 N
30.5 P
58.1 K
70 N
30.5 P
58.1 K
110 N
0 P
0 P
110 N
0 P
0 K
* Mean of measured values from 1976 to 2012. NPK: mineral fertilization alone where N, P, and K refer to mineral nitrogen, phosphorus and potassium; GM + NPK: green manure + mineral fertilization; Str + NPK: cereal straw + mineral fertilization; FYM + NPK: farmyard manure + mineral fertilization; Slu + NPK: cattle slurry + mineral fertilization
Table 2. Soil chemical soil properties measured in 2012 for all the fertilization treatments.
TreatmentCorgC stocksC/NpHCECK-totMg-totP-totK-EDTAMg-EDTAP-EDTA
g·kg−1Mg·ha−1 H2Ocmol + kg−1g·kg−1Mg·kg−1
NPK11.20 a±0.0932.93 a±0.269.84 a±0.076.93 a±0.687.97 a±0.5415.03 a±0.476.67 a±0.590.82 a±0.02183.00 a±14.7363.27 a±12.4551.39 a±19.32
GM + NPK11.37 a±0.2733.43 a±0.799.89 a±0.076.50 a±0.177.85 a±1.3015.23 a±1.556.70 a±1.330.77 a±0.02191.33 a±15.5070.53 a±14.0831.20 ab±3.98
Str + NPK12.20 a±0.4035.87 a±1.1810.03 a±0.026.90 a±0.107.85 a±0.8814.77 a±0.516.37 a±0.580.81 a±0.02177.00 a±21.0769.07 a±6.0444.78 ab±1.94
FYM + NPK13.00 a±0.5338.22 a±1.5610.10 a±0.107.00 a±0.568.19 a±1.1915.03 a±1.006.57 a±0.940.82 a±0.03221.67 a±49.6583.63 a±26.3450.63 ab±15.89
Slu + NPK12.40 a±0.6036.46 a±1.769.71 a±0.066.90 a±0.668.58 a±2.0915.60 a±1.477.10 a±1.440.79 a±0.02190.67 a±26.4183.17 a±13.3229.46 b±6.08
Different letters indicate significant differences between treatments (mean value ± standard error of mean, p < 0.05; n = 3). Corg: organic carbon; C/N: carbon-to-nitrogen ratio; CEC: cation exchange capacity. NPK: mineral fertilization alone; GM + NPK: green manure + mineral fertilization; Str + NPK: cereal straw + mineral fertilization; FYM + NPK: farmyard manure + mineral fertilization; Slu + NPK: cattle slurry + mineral fertilization.
Publisher’s Note: MDPI stays neutral with regard to jurisdictional claims in published maps and institutional affiliations.

