Article

Extending the CSM-CERES-Beet Model to Simulate Impact of Observed Leaf Disease Damage on Sugar Beet Yield

by
Emir Memic
1,*,
Simone Graeff-Hönninger
1,
Oliver Hensel
2 and
William D. Batchelor
3
1
Cropping Systems and Modelling, University of Hohenheim, 70599 Stuttgart, Germany
2
Department of Agricultural and Biosystems Engineering, University of Kassel, 37213 Witzenhausen, Germany
3
Biosystems Engineering Department, Auburn University, Auburn, AL 36849, USA
*
Author to whom correspondence should be addressed.
Agronomy 2020, 10(12), 1930; https://doi.org/10.3390/agronomy10121930
Submission received: 18 October 2020 / Revised: 28 November 2020 / Accepted: 4 December 2020 / Published: 8 December 2020

Abstract

:
A CSM-CERES-Beet pest damage routine was modified to simulate the impact of Cercospora leaf spot disease effects on sugar beet yield. Foliar disease effects on sugar beet growth and yield were incorporated as daily damage to leaf area and photosynthesis, which was linked to daily crop growth and biomass accumulation. An experiment was conducted in Southwest Germany (2016–2018) with different levels of disease infection. Data collected included time-series leaf area index, top weight, storage root weight and Cercospora leaf spot disease progress. The model was calibrated using statistical and visual fit for one treatment and evaluated for eight treatments over three years. Model performance of the calibration treatment for all three variables resulted in R2 values higher than 0.82 and d-statistics higher than 0.94. Evaluation treatments for all three observation groups resulted in high R2 and d-statistics with few exceptions mainly caused by weather extremes. Root mean square error values for calibration and evaluation treatments were satisfactory. Model statistics indicate that the approach can be used as a suitable decision support system to simulate the impact of observed Cercospora leaf spot damage on accumulated above-ground biomass and storage root yield on a plot/site-specific scale.

1. Introduction

The EU is the largest producer of sugar beet (Beta vulgaris L.) in the world with approximately 50% of global production [1]. Approximately 20% of global sugar is produced from sugar beet [1]. The sugar beet industry plays a very important role in the EU rural and agricultural economy and as such requires studies for increasing competitiveness of the sugar beet crop. Due to the abolishment of the production quotas, the EU farmers have increased sugar beet production. In 2017, cultivated area used for sugar beet production increased by 17.2% compared to 2016 [1]. The EU-28 production quantities of sugar beet in 2017 was 27.3% higher than in 2016 [1]. In 2018, sugar beet sown area was 1.2% lower when compared to the previous year with harvested sugar beet being 16.5% lower [1]. The sudden drop in harvested amount of sugar beet was very likely caused by recorded drought conditions and not quota abolishment related price volatility [1]. Based on the general economic theory with market defined prices, more volatility is to be expected in sugar beet pricing, which will affect production quantities in the EU. The increase in sugar beet production in 2017 led to a fall in prices by an average of 5.4% in real terms when compared to the prices from 2016 [1] and because of this, improved management of production resources might help to mitigate the impact on sugar beet production profitability.
Cercospora beticola (Sacc.) is a leading leaf pathogen affecting sugar beets in Germany [2]. Economic consequences of Cercospora leaf spot in sugar beet are evident and quantifiable in the context of storage root yield and extractable sugar losses as reported by Shane et al. [3]. Shane et al. [3] reported that sugar loss due to reductions in storage root and sugar concentration had more impact on dollar return than sugar loss to molasses due to impurities. The Cercospora leaf spot (caused by Cercospora beticola) has a significant influence on sugar beet yield, causing up to 30% yield losses [2]. Economically less significant sugar beet leaf diseases in Germany are caused by Ramularia beticola, Uromyces betae, and Phoma betae, which are normally not treated with specific fungicides, as some appear later in the growing season and/or are slow to develop [2].
Crop growth models were developed as a tool to help researchers and farmers understand how genetics, environment and management impact daily crop growth and yield. They have been used to identify crop management practices [4], and the impact of climate change on yield [5]. However, most crop growth models do not simulate the impact of pest damage on crop growth and yield [6,7]. One of the earliest efforts to simulate Cercospora leaf spot effects on yield was undertaken by Bourgeois [8], based on the peanut crop growth (PNUTGRO) model [9]. Similar efforts for evaluating disease effects on photosynthesis and yield estimates were performed by Nokes and Young [10] and Batchelor et al. [11].
The CERES-Beet (Crop Environment Resource Synthesis-Beet) model developed by Leviel [12] simulates growth and development processes of sugar beet. It has been tested using data from France, Romania [13], and North Dakota, USA [14]. Anar et al. [14] modified the CERES-Beet model of Leviel [13] and incorporated it as the CSM-CERES-Beet (Cropping System Model) model in the Decision Support System for Agrotechnology Transfer 4.6 (DSSAT4.6). A model comparison of five sugar beet crop models showed that the CERES model provided overall good simulations of plant growth and yield, based on the evaluation criteria that consisted of: relative root mean square error, model efficiency coefficient and yield prediction error [15]. The CSM-CERES-Beet model was improved and successfully tested with additional data from North Dakota, USA (2016–2018) and made available within GitHub DSSAT 4.7 release [16,17,18]. The CERES-Beet and the CSM-CERES-Beet models are derivatives of the CERES-Maize model [19]. The CERES-Maize model is deterministic and simulates different phenology events of the crop, including growth rates and biomass partitioning among crop organs (roots, stem, leaves and kernels) on a daily basis [20]. The model requires a minimum of four different daily weather input variables (solar radiation, minimum temperature, maximum temperature, and precipitation), crop management practices (sowing date, plant population density and fertiliser amounts) and crop cultivar characteristics (genetic coefficients). The CSM-CERES-Beet considers sugar beet as an annual crop for beet production purposes and classifies the phenology into five events: sowing, germination, emergence, vegetative phase, and harvest. The CSM-CERES-Beet model did not include leaf disease damage.
The objectives of this study were to: (1) to develop a method to simulate the impact of observed Cercospora leaf spot disease on sugar beet yield and sugar content using the CSM-CERES-Beet model, (2) to evaluate the leaf disease model with three years of observed data from Southwest Germany, (3) to evaluate sugar yield based on the measured storage root dry matter (DM) quantities in defined plots.
This is an extended version of the conference paper published and presented at the 12th European Precision Agriculture Conference in Montpellier, France 2019 as preliminary work under the title “Extending the CERES-Beet model to simulate leaf disease in sugar beet”, Memic et al. [21].

2. Materials and Methods

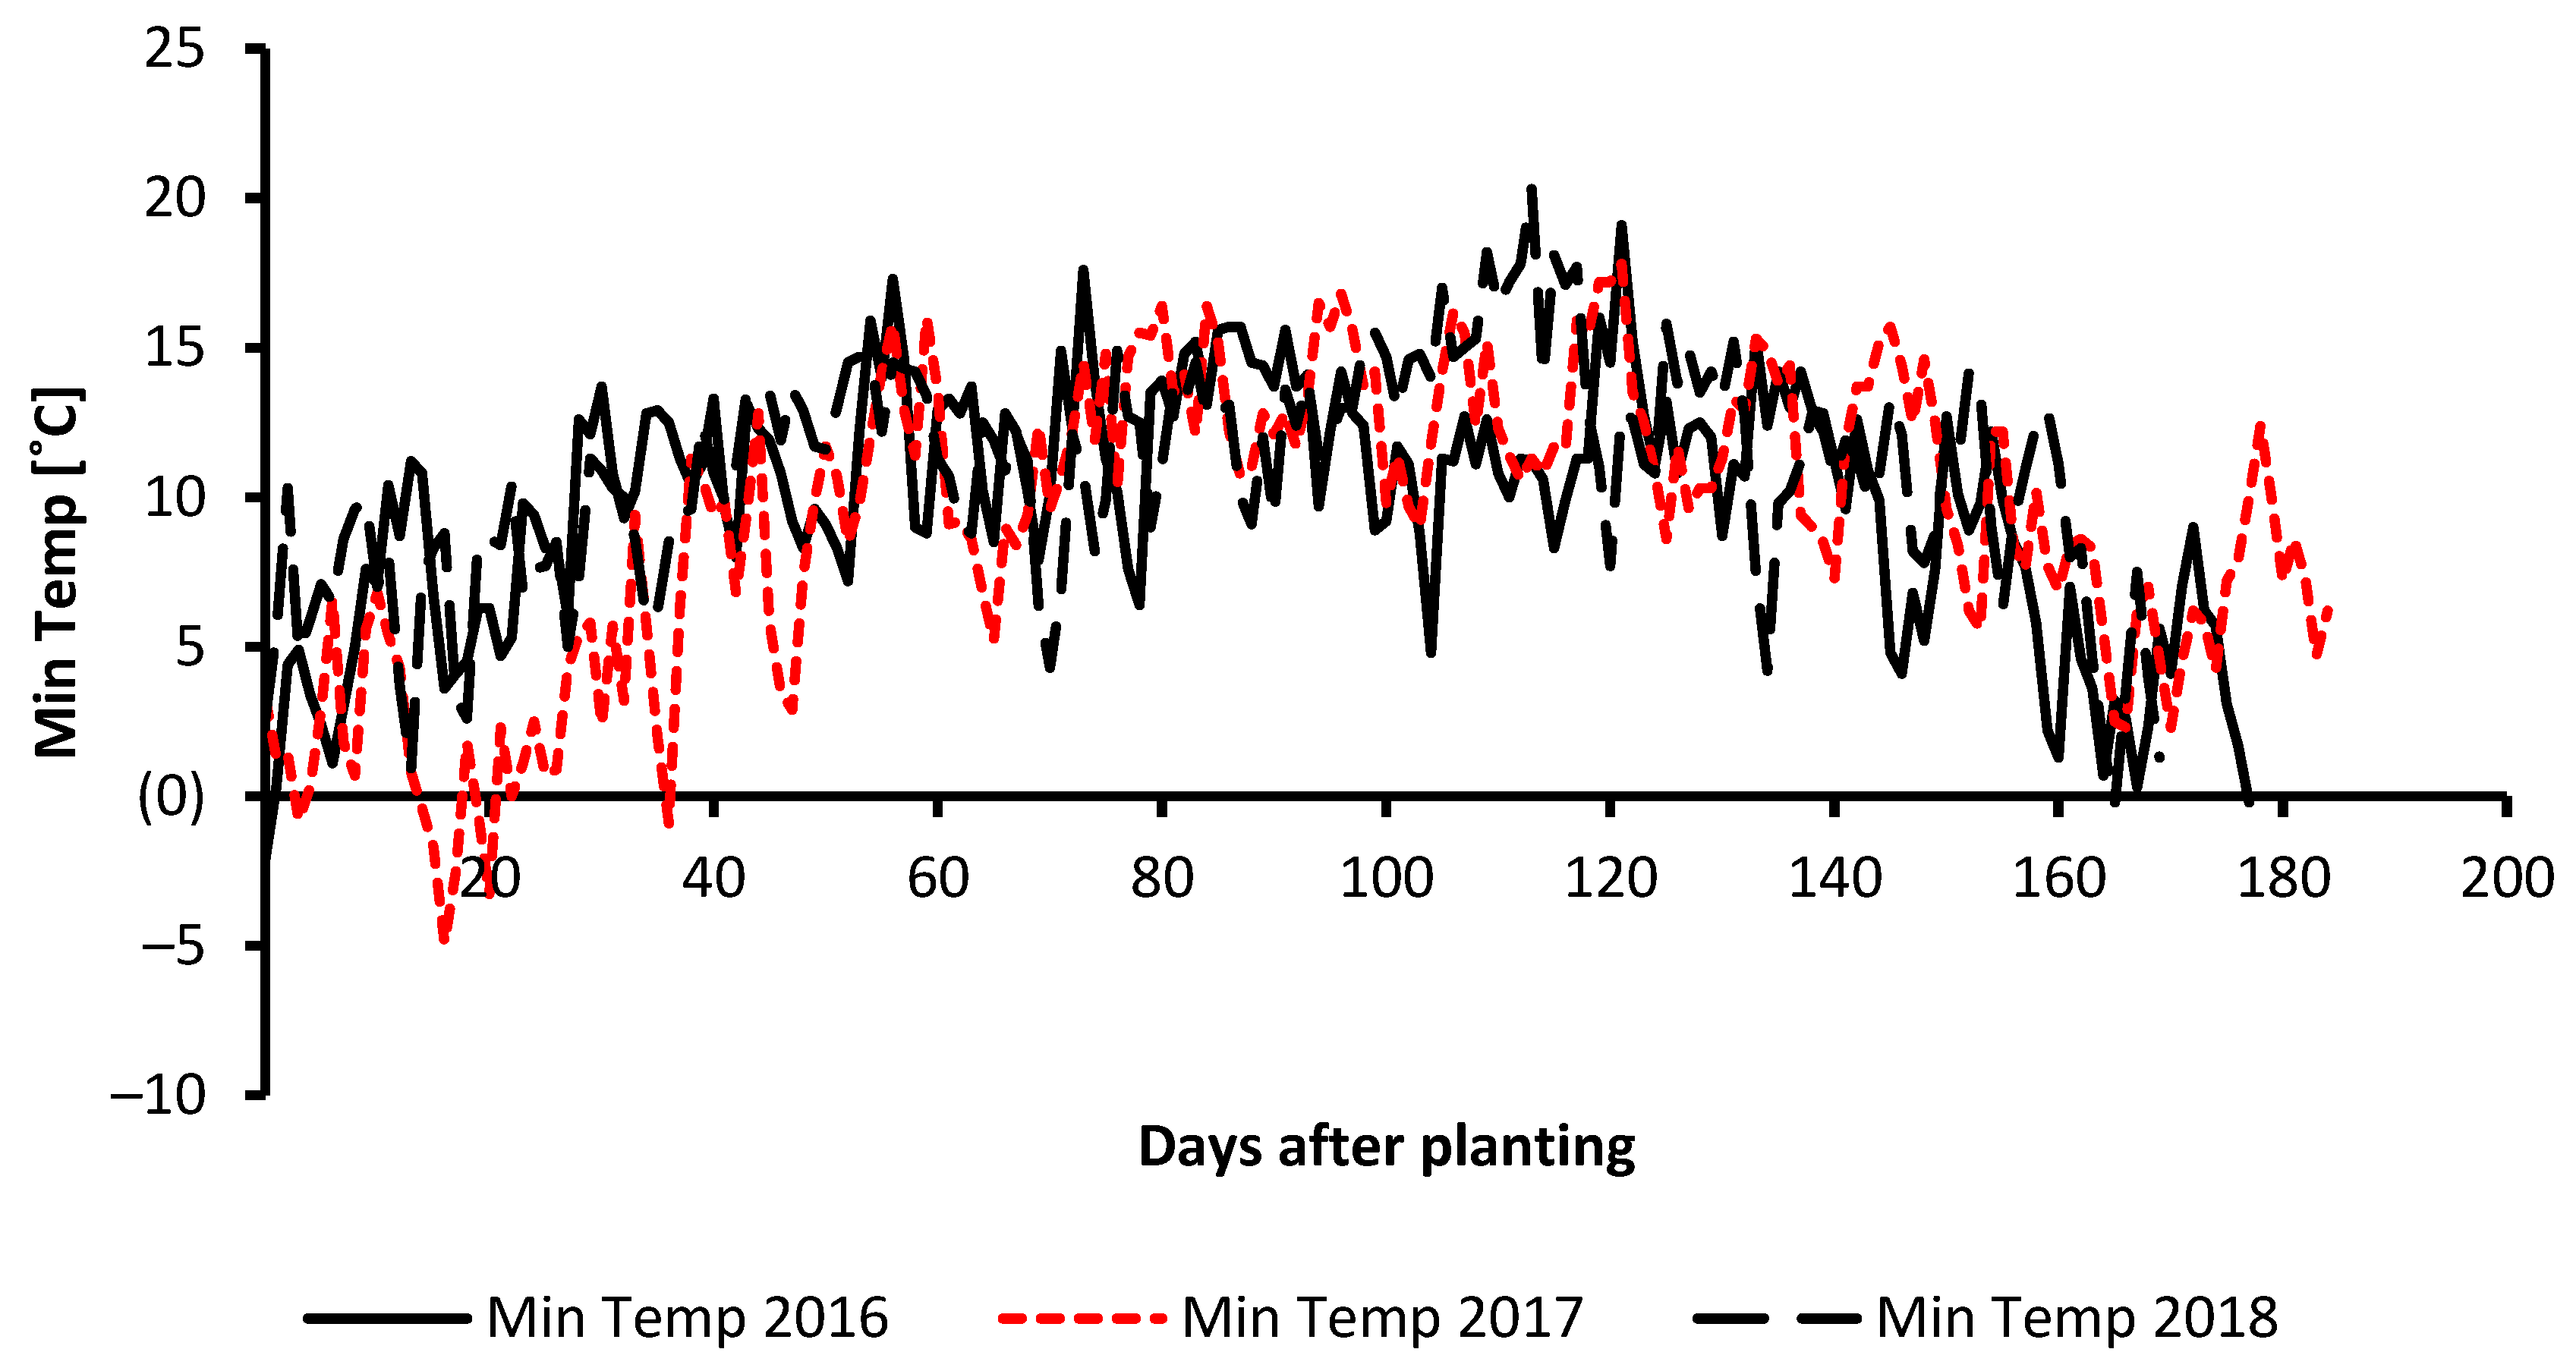
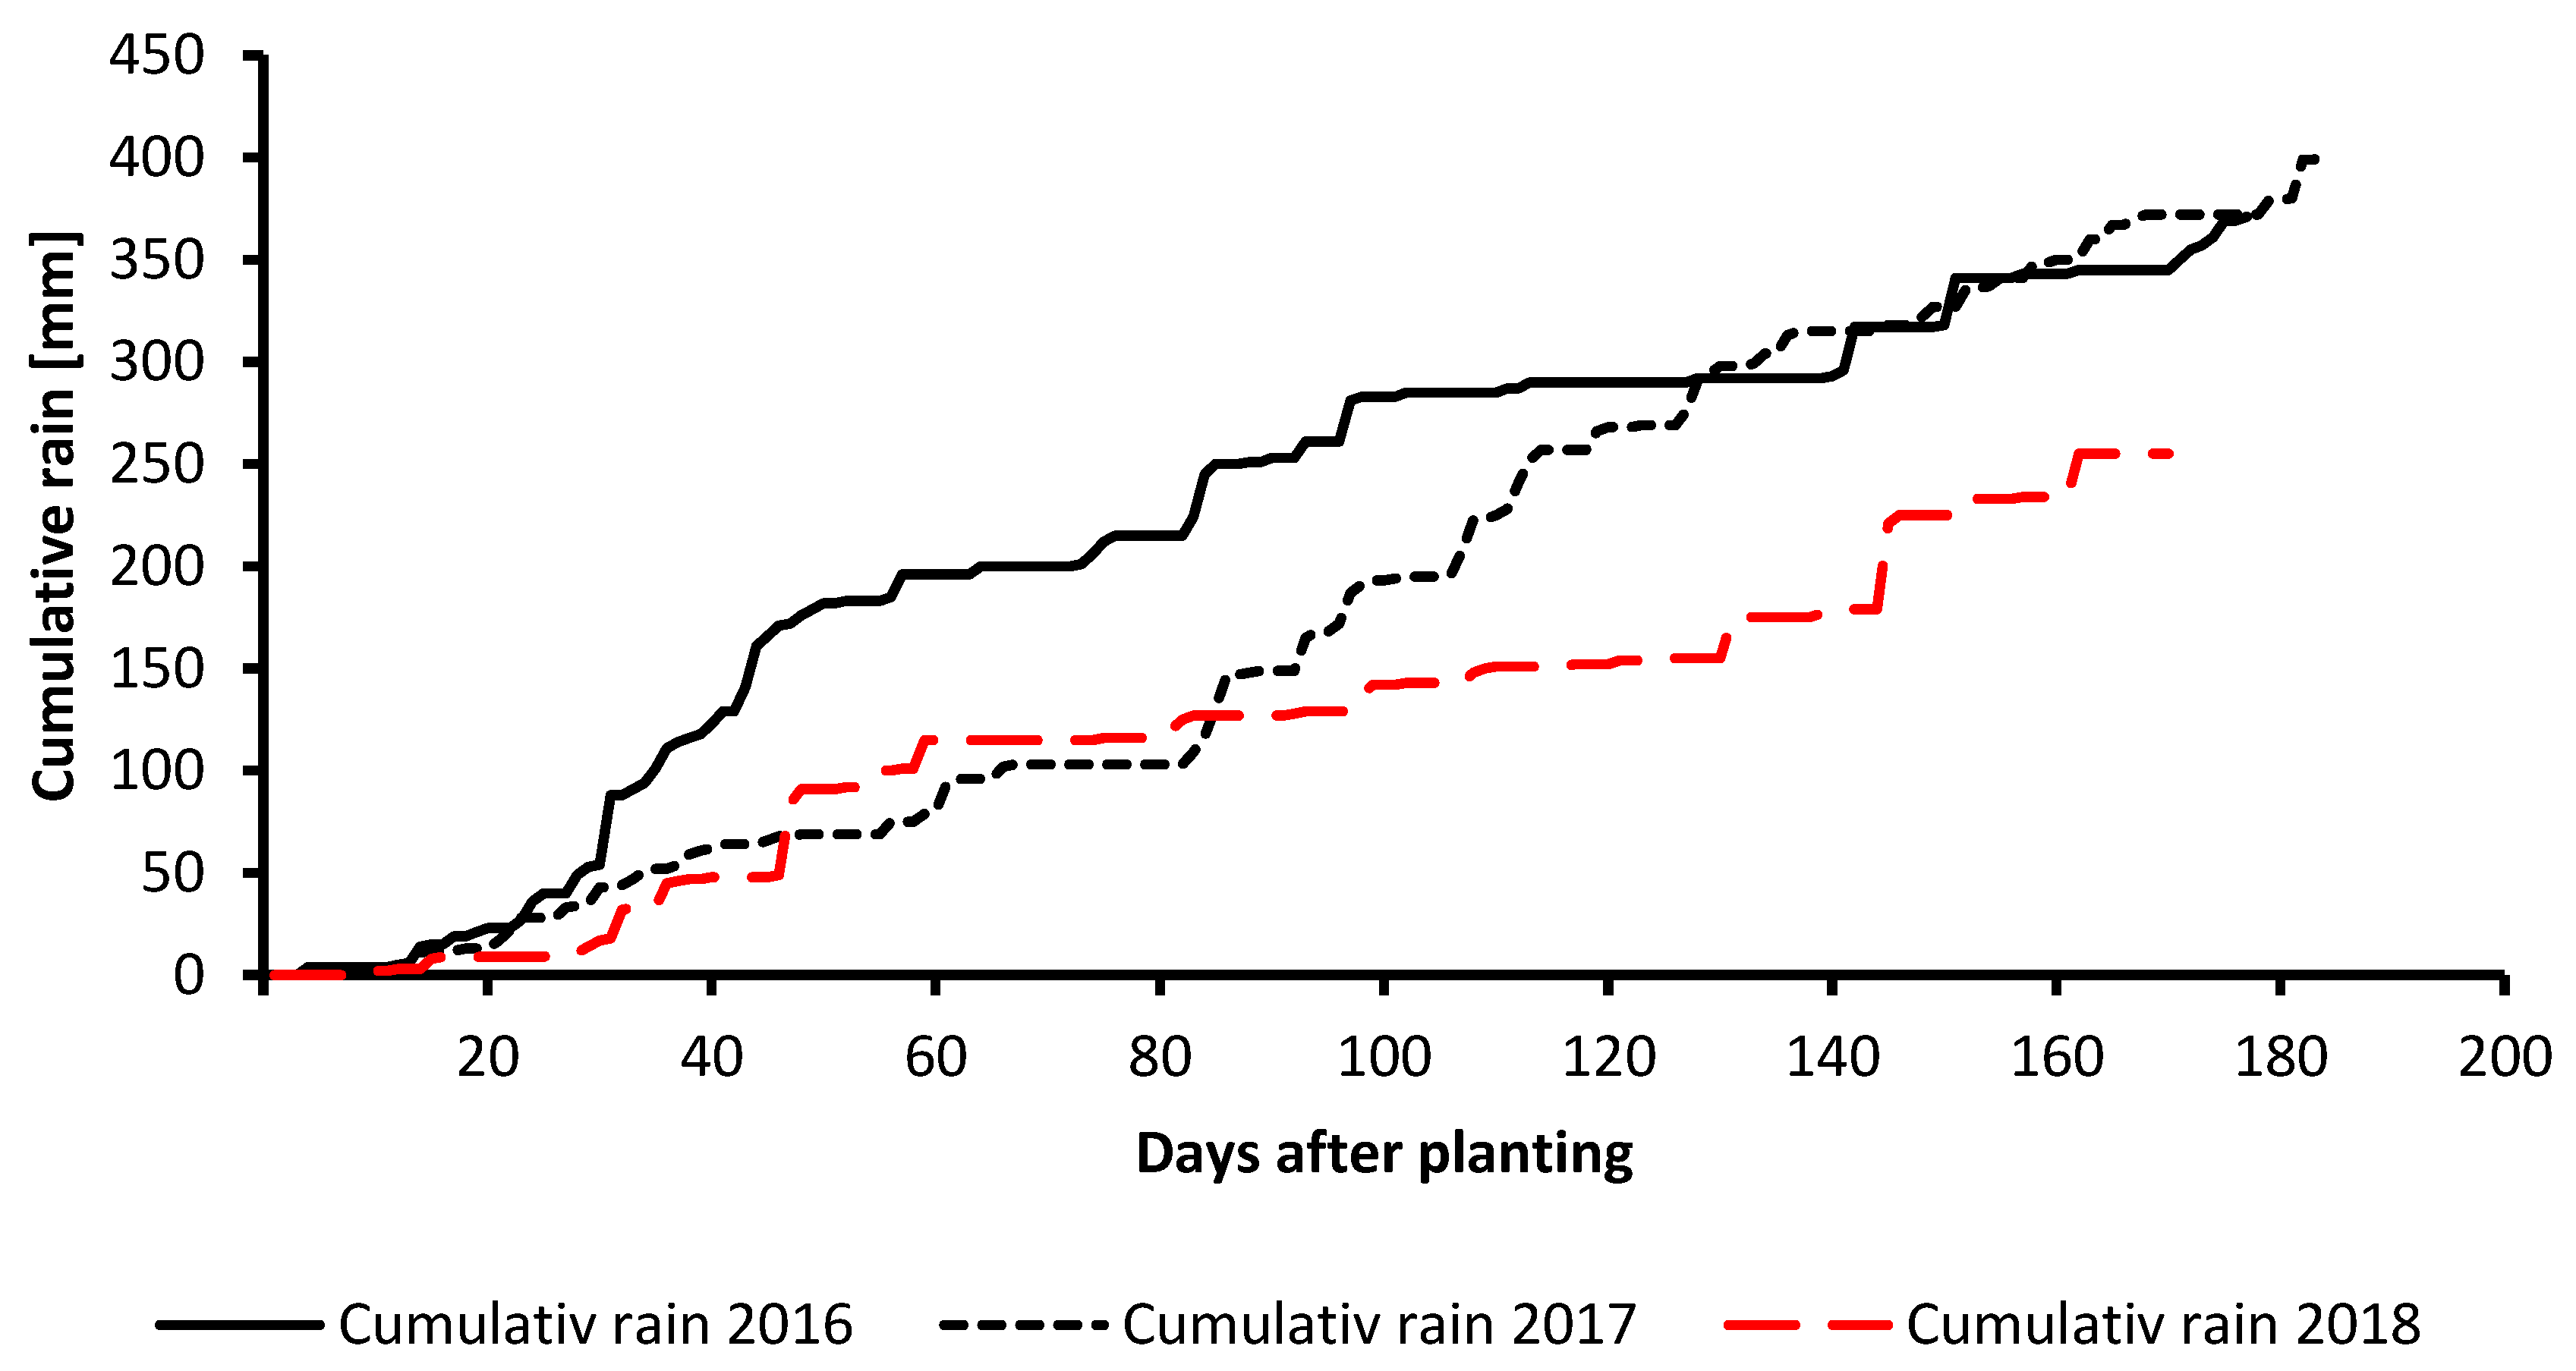
2.1. Field Experiment Description and Data Collection

In 2016–2018, field experiments were conducted at three different fields located at Ihinger Hof, Agricultural Research Station of Hohenheim University (30 km from Stuttgart, latitude: 48.666, longitude: 8.967, elevation: approximately 490 m). Weather data (solar radiation, rainfall, minimum and maximum temperature) for model simulations were collected from a local station 200–600 m away from the fields. According to the World Reference Base [22], experimental soils can be characterized as vertic Luvisol and vertic Cambisol. Organic carbon was assumed to be on average 3.8%, based on historic site measurements recorded at the research station over multiple years (unpublished).
In 2017, after sugar beet had been planted, temperatures dropped below 0 °C (Figure 1). Sugar beet in the field managed to recover, but in the model, low temperatures had a significant influence on the simulation of the crop emergence and early growth as can be seen in the results section.
In 2018, drought was recorded in the region as can be seen from seasonal cumulative rain curves shown in Figure 2, and the impact on simulated sugar beet growth was not entirely captured by the model.
The sugar beet cultivar BTS940 (Betaseed GmbH, 60,325 Frankfurt am Main, Germany), a Rhizomania tolerant cultivar moderately susceptible to Cercospora beticola, was planted in all experiments. In 2016, sugar beet was sown on 29 April 2016 (120th day of the year) and harvested 177 days after planting. In 2017, sugar beet was sown on 4 April 2017 (94th day) and harvested 184 days after planting. In 2018, sowing took place on 18 April 2018 (108th day) and sugar beet was harvested 169 days after planting. Furthermore, 107.000 seeds ha−1 were planted in 2 cm depth with Khun Maxima precision seed drill, with an inter-row spacing of 50 cm and intra-row spacing of 19 cm.
In 2016, five different fungicide levels, consisting of 0, 25, 50, 75 and 100% of the recommended rates, were applied. The fungicide Spyrale (Syngenta Agro, Basel, Switzerland) was applied twice (according to the application recommendation), first at the beginning of August and second three weeks later. For the 100% fungicide treatment, 1 L of Spyrale was solved in 350 L water for application per hectare. Treatments 75, 50, and 25% consisted of 0.75, 0.5, and 0.25 L, respectively. Fungicide levels 0, 50 and 100% were investigated in order to estimate level of disease leaf area within the plots (defined as plot-specific units). Respected repetitions for investigated treatments were averaged in order to get robust model evaluation values across different treatments. The plots were fully randomised with three replications in 2016. Observed values used for the simulations were the mean values of the three repetitions. Total plot size was 576 m2 (24 × 24 m) in 2016. Plots were evenly divided into sampling and harvesting areas.
In 2017 and 2018, the treatment consisted of different amounts of Cercospora beticola inoculum per plot named as 0% inoculum (no inoculum) and 100% inoculum (with inoculum), with 4 replications in both years. Inoculum was collected at the field in 2016 and 2017. The number of Cercospora beticola spores was analysed in the laboratory. In both years, 1 g m−2 of inoculum was applied with a rate of 5.35 × 10⁶ spores g−1 in the 100% inoculum treatments with Massey Ferguson (90 horsepower) at 4.5 km h−1 with 12 m wide sprayer. The sugar beets in the plots were first wetted with 400 L ha−1 and then an inoculum semolina mixture was spread. In 2017, plot size was 96 m2 (12 × 8 m) and in 2018, 192 m2 (24 × 8 m). Emergence rate was 7.5 beets m−2 in 2016, 9 beets m−2 in 2017 and 8 beets m−2 in 2018. In 2016, within a week after sowing, 130 kg N ha−1 was applied on the field as calcium ammonium nitrate (CAN, 27% N). In 2017, 150 kg ha−1 and in 2018 140 kg ha−1 was applied as CAN (27% N) within a week after sowing.
During the growing seasons, leaf area index (LAI) was measured every two weeks non-destructively using an LAI 2000 (LICOR Inc., Lincoln, NE, USA), by taking one reference measurement above the canopy and four measurements within the canopy. Top weight (leaves and petiole separately) and storage root weight were sampled in two to four week intervals during the growing period (2016–2018). For each storage root, sampling date, sugar yield was measured as percent of storage root dry matter. Each sampled beet (storage root) was cut in half, where one half was used for determining sugar content and the other half for nitrogen analysis. The sugar content was analysed according to the polarisation method [23].
Leaf disease ratings were conducted for Cercospora leaf spot, after canopy closure (approximately 90% of leaves from one row were touching those in neighbouring rows), starting at the end of June in each year. Minor incidents of Ramularia beticola and Pseudomonas syringae pathogens were observed in inspected plots. The damage caused by these two pathogens was minor, when compared to Cercospora beticola. Every 2–3 weeks, 10 middle leaves (long-term leaves) were inspected from 10 plants in 2016 (three plot repetitions), 4 plants in 2017 (four plot repetitions) and from 5 plants in 2018 (four plot repetitions) per plot, mostly as part of destructive sampling. Based on the diseased leaf area, plot-specific leaf area disease progress (%) was recorded (Table 1) and used as input for the model. Model calibration was conducted on the 2016 100% fungicide treatment. The remaining data of 2016 were used in addition to the treatments of the years 2017 and 2018 for model evaluation.

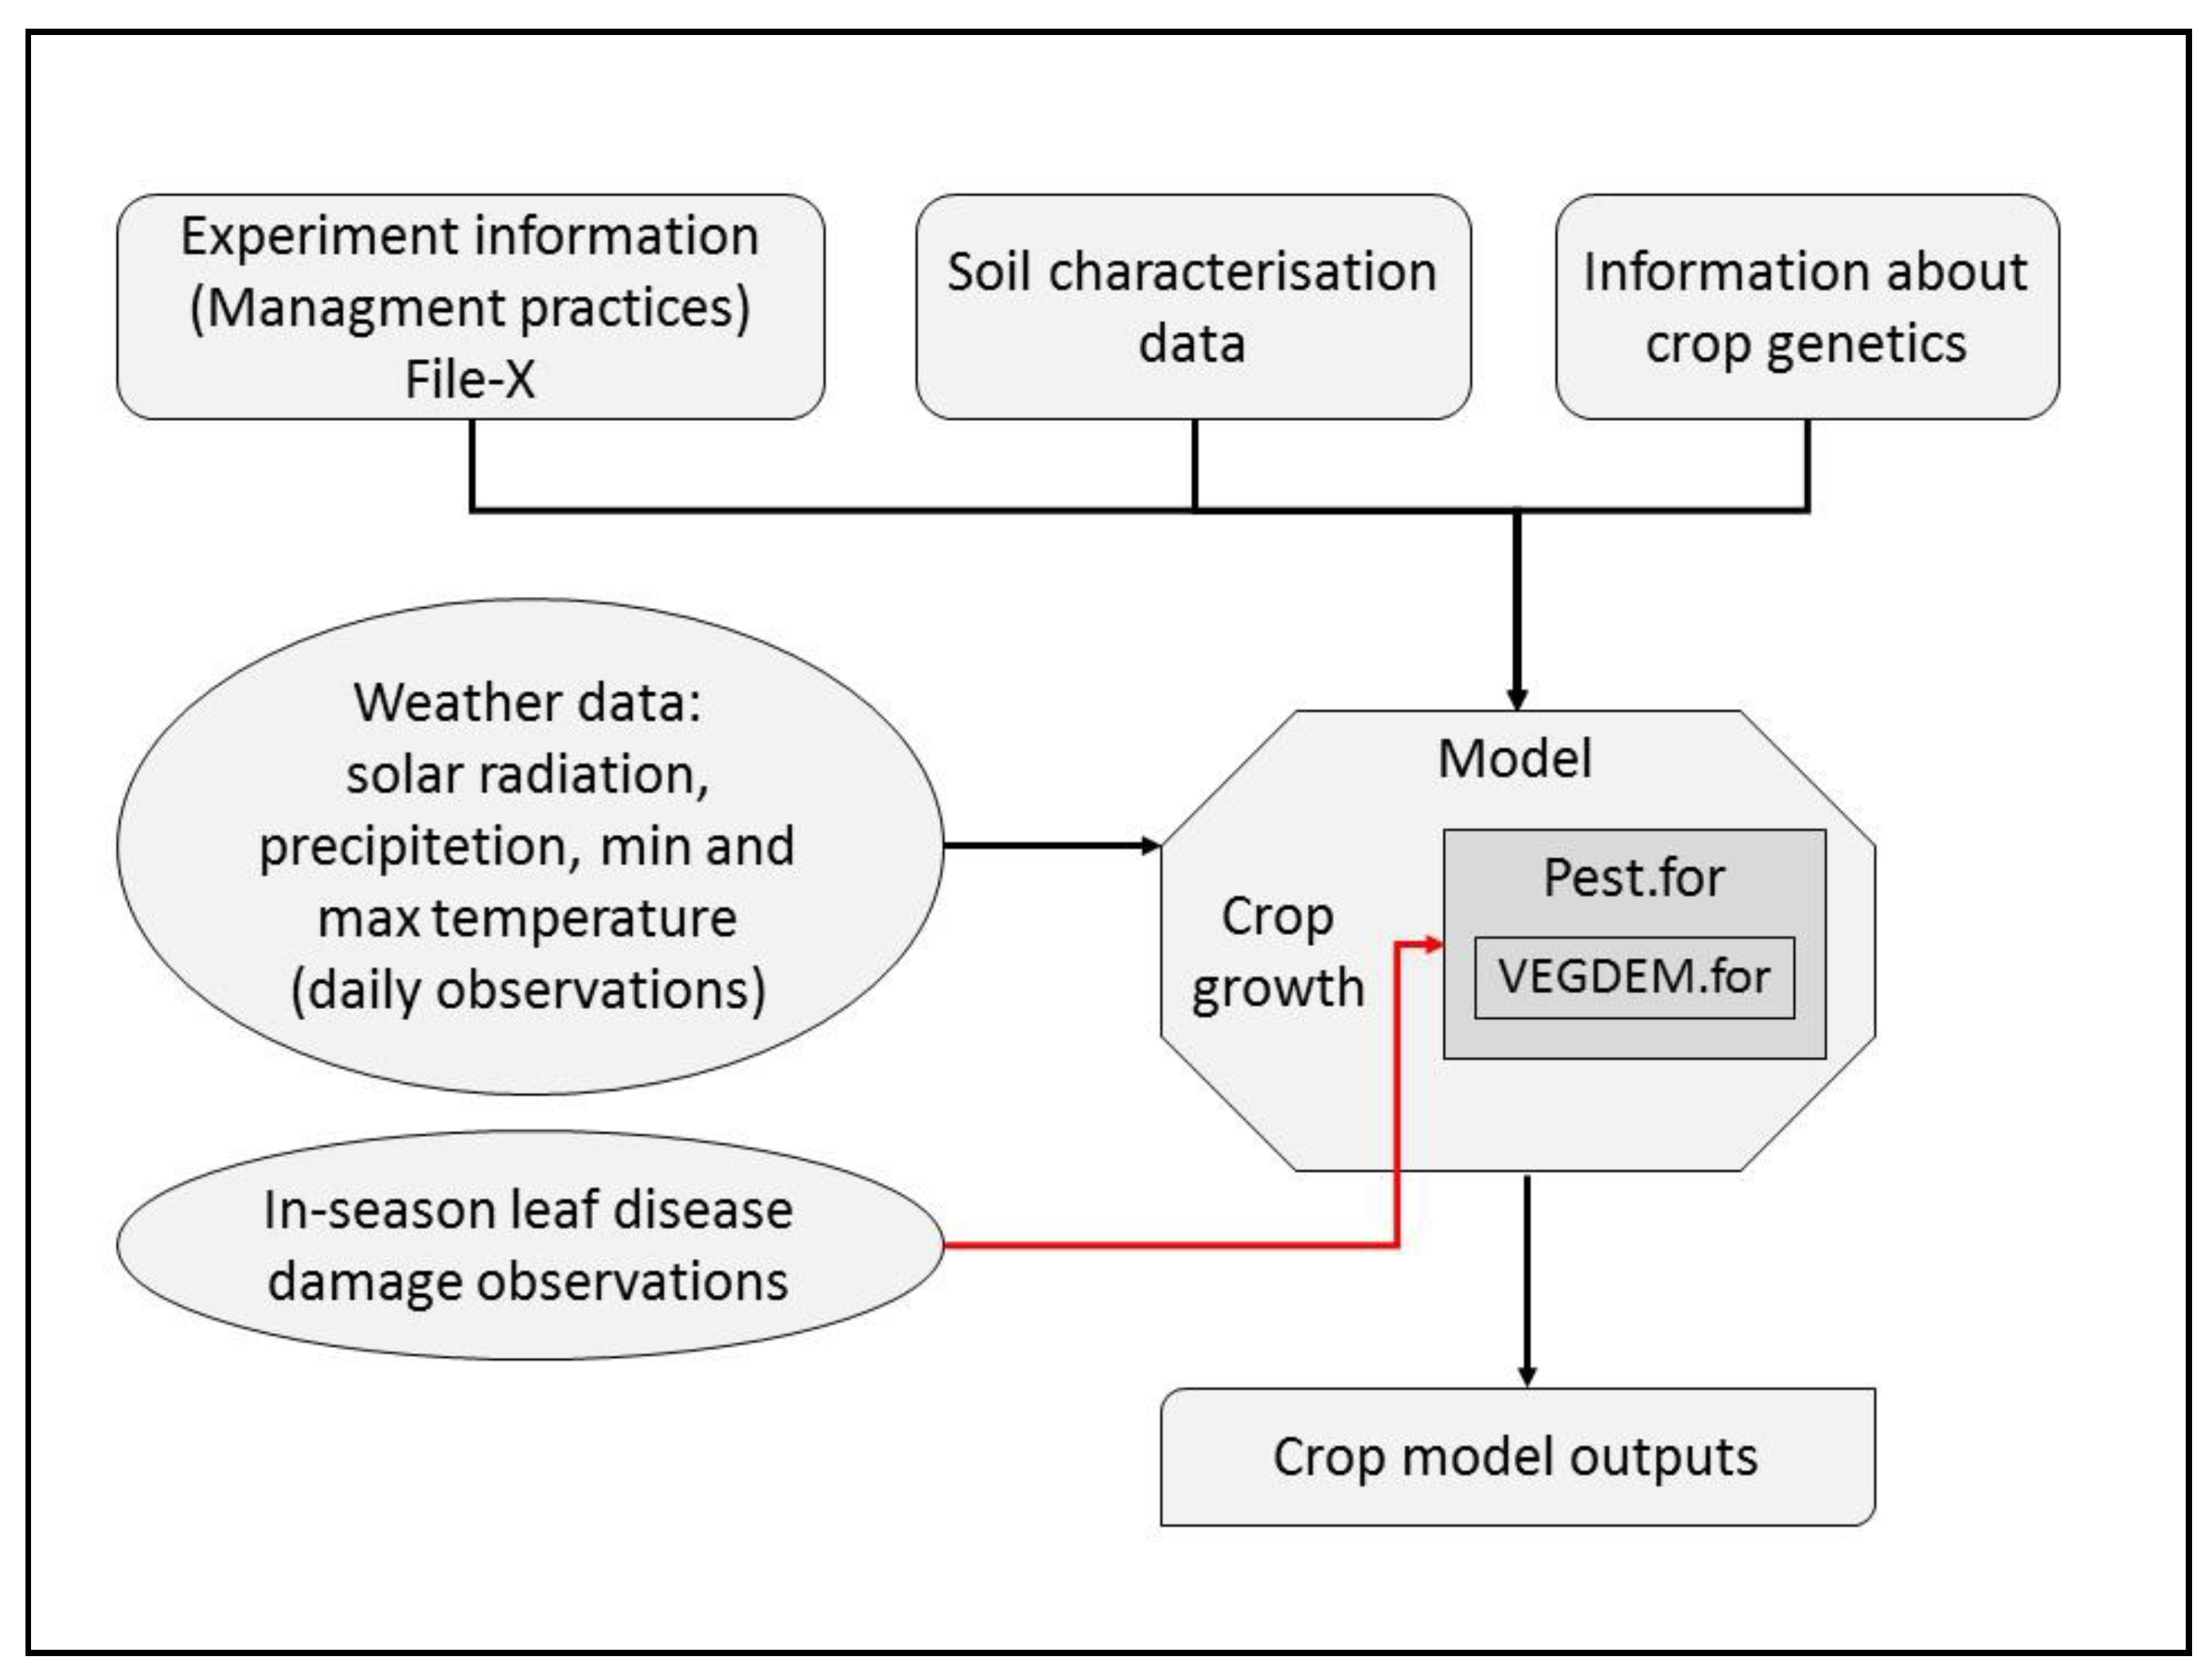
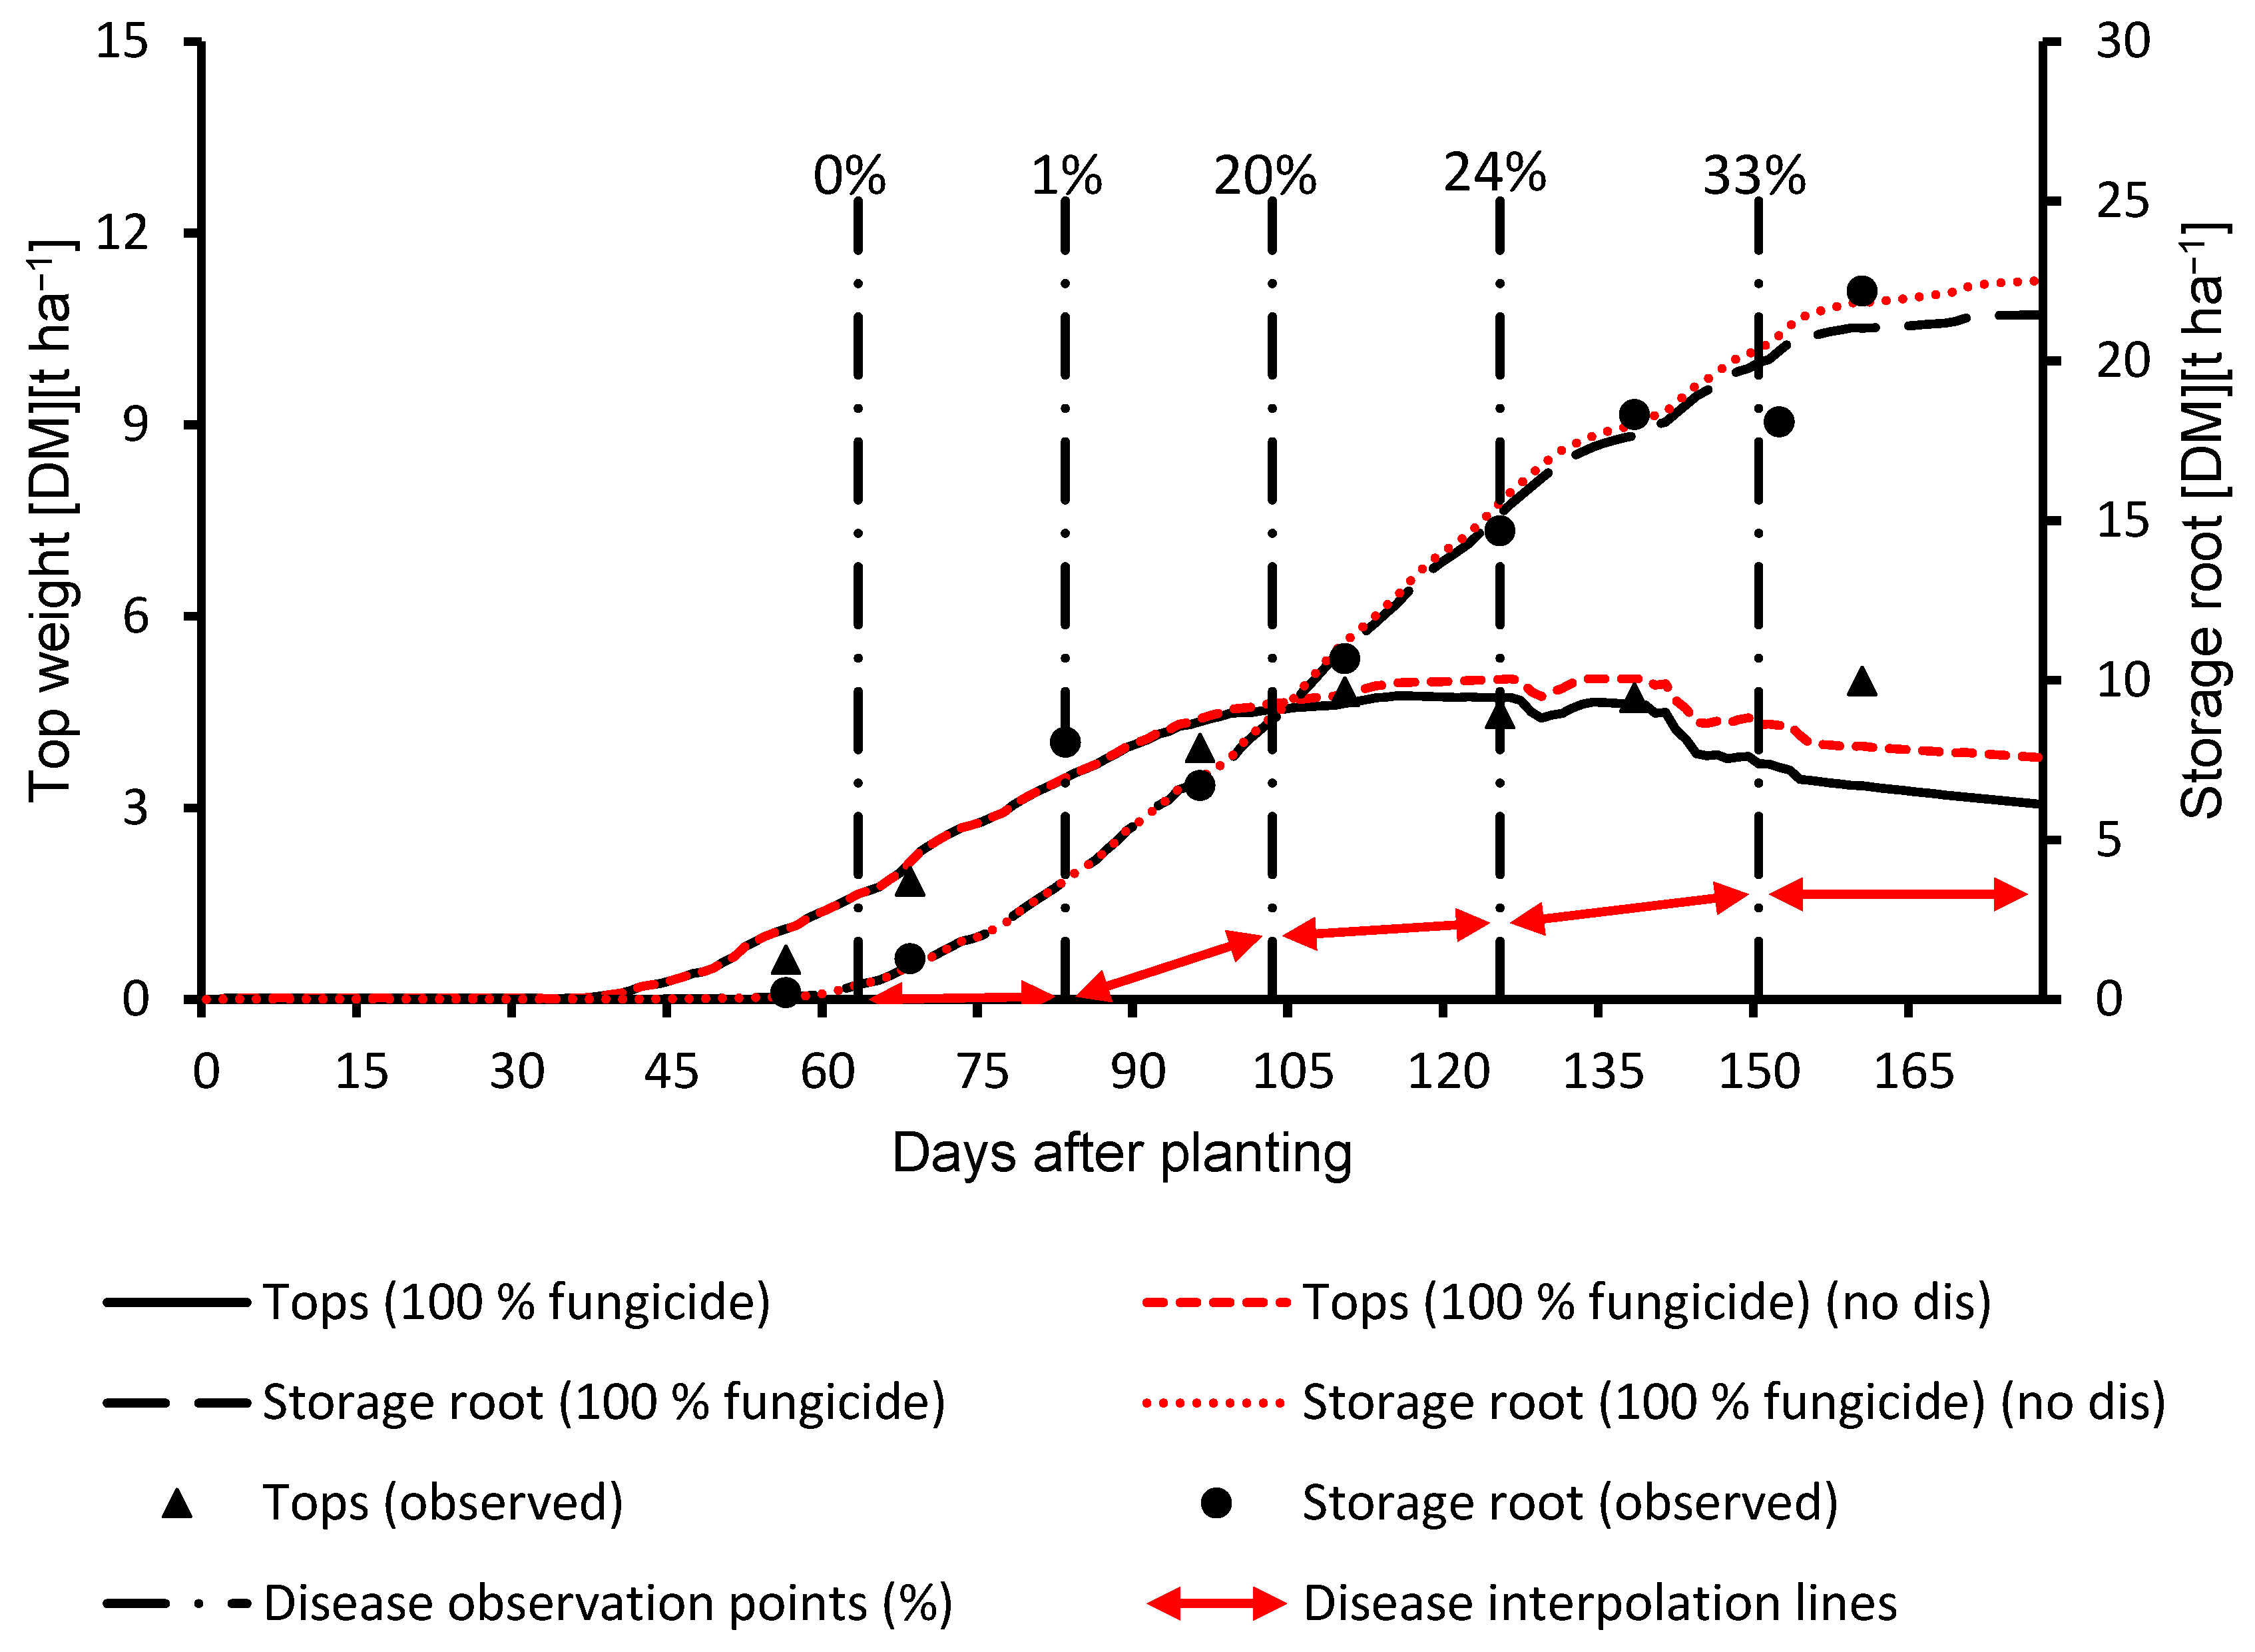
2.2. Leaf Disease Damage Coupling Points

The CSM-CERES-Beet model [12,18] inherited pest coupling points for simulation of many types of pest damage. Currently, there are four approaches for applying foliar damage through pest coupling points that reduce daily state variables or growth rate processes: (1) daily absolute damage rate, (2) percent observed damage (measured by comparison of different treatments), (3) daily percent damage rate, and (4) daily absolute damage rate with preference and competition [11]. The existing pest damage module structure in the DSSAT (Figure 3) was used for simulating Cercospora leaf spot impact on plant growth and yield by means of “daily percent damage rate (no. 3)”. This method was selected for introducing the damage caused by Cercospora leaf spot disease because it showed the required flexibility and reliability using the collected data. In combination with linear interpolation (between two in-season observations), the chosen approach provided acceptable results based on the model evaluation criteria described in the Results section.
Figure 3 shows the simplified modular structure with a minimal input data approach hypothetically required for evaluation of leaf disease impact on crop yield. The crop model simulates in-season crop growth and yield, which is then reduced by yield limiting factors such as leaf disease through the reduction in cumulative leaf area in the pest module (Pest.for) and damage calculated in the vegetation damage sub-module (VEGDEM.for) (Figure 3). In-season above- and below-ground accumulation rates are defined in the crop model genetic coefficients input file (Figure 3) and through genetic coefficients and above- and below-ground biomass in-season growth ratios, a direct connection is established between leaf disease damage (in this case, Cercospora leaf spot) and storage root (yield) simulated in the model. With this approach, Cercospora leaf spot damage does not have an instant effect on reduction in the storage root in the CSM-CERES-Beet model, but rather limits further storage root growth due to reduced photosynthesis rates and the radiation use efficiency approach implemented in the model. The disease damage passed into the model earlier had a more devastating effect on yield when compared to the damage introduced later (high percentages close to harvest time).
The foliar disease Cercospora leaf spot was integrated into the model based on Equations (1) and (2), where xit is the modified cumulative leaf area state variable after applying daily damage Di on cumulative leaf area state variable Xi on day t.
x i t = X i t D i t
The “percent of the cumulative leaf area” damage method was defined and selected in the crop model pest file, as shown in Table 2. Based on the selected method, Cercospora leaf spot damage is computed on a daily basis. The daily disease damage (WLIDOT) is subtracted from simulated plant leaf area (PLA), Equation (2). SENLA in Equation (2) refers to growth related senescence, and LFWT is simulated leaf weight dry matter based on the plant population (PLTPOP).
PLA = PLA WLIDOT × PLA SENLA LFWT × PLTPOP
For application of leaf damage caused by Cercospora beticola leaf pathogen, the model variables “LAI” and “cumulative leaf area” were selected as the primary coupling points. LAI is calculated from specific leaf area. Based on the calculations in the model and the direct relationship between leaf area and LAI, applied damage will affect both cumulative leaf area and LAI, as LAI damage is subsequently deduced based on cumulative leaf area damage. Leaf mass damage proportionally affects leaf N concentration, photosynthesis and subsequently storage root dry mater. The daily crop growth reduction rate computation is shown in Equation (3), where CARBO is daily biomass production and DISLA is photosynthesis reduction due to leaf disease.
CARBO = CARBO × [ 1 DISLA PLA × PLTPOP ]
Manual estimates of Cercospora leaf spot leaf disease area progress (%) (or sensor-based leaf disease area progress (%)) can be passed into the model as percent damage. Percent damage is calculated in Equation (4):
D i t = R i t 100     X i t
where Rit is the observed percent damage applied to the coupling point on day t. The CSM-CERES-Beet model simulates individual leaf development [12], and leaf area is computed based on leaf number and leaf weight. Leaf disease severity is measured in the field and computed as an average per plant. The model can simulate disease effects by entering observed leaf area disease progress levels in an input file, which is used to simulate daily damage on leaf area and subsequently, light interception and daily photosynthesis rate. This method computes cumulative leaf area damage rates between two disease observation points from scouting and uses a linear interpolation (for simplicity) to convert time-series scouting observations into daily damage. Disease progress interpolation between field observation dates is computed in the model. The leaf disease damage method with damage rates is defined in the pest definition file for DSSAT sugar beet model, BSCER047.PST (Table 2). A more detailed description of the disease related model structure can be found in the recent publication on leaf disease damage application in Cropsim-CERES-Wheat [6,7] and in Batchelor et al. [11].
Observed leaf disease percentages are passed into the model through the time-series file, called the T-File (treatment file), which contains observed damage on each field scouting day. The leaf area damage (LAD) method uses time series observations from the T-File to calculate percent leaf mass, leaf N and leaf area damage based on the LAD formulation in the code. The function uses a coefficient value of 2.0 to double the impact of necrotic leaf area on daily photosynthesis. The adapted damage approach in the model was based on the principle of defoliation by insects. Only physically missing leaf parts were reported in the model as observed damage affecting the overall photosynthetical activity of the plant. For Cercospora leaf spot, the diseased leaf is still present and absorbs light, but its photosynthetic activity is reduced. Jones et al. [24] reported that removal of the foliage (by 25%) mechanically at the eight-leaf stage did not have an appreciable effect on storage root weight and sugar content because leaves were able to re-grow and regain photosynthetic activity. Mechanically removed leaves do not block the sunlight for remaining leaves.

3. Results

The genetic coefficients of the model were calibrated using the 2016 100% fungicide treatment (the treatment, described in materials and methods section, in which 1 L of Spyrale was applied per hectare), based on given regulations in Germany that limited the amount of fungicide to be applied. The 100% fungicide application treatment was used to calibrate genetic coefficients, even though there were some disease incidents in this treatment. For calibration, a two-step approach was used. First, the genetic coefficients were calibrated assuming no disease was present, which helped us to understand the magnitude of each genetic coefficient required for the model to fit measured growth data. Next, the observed disease levels were incorporated into the model and the genetic coefficients were re-adjusted to attain the optimum calibration combination.
Genetic coefficients (Table 3) were manually adjusted to obtain the best visual and statistical fit, based on the crop model evaluation criteria used in this study, between simulated and observed values for LAI, top weight, and storage root. During the calibration process, each coefficient range was kept within minimum and maximum values recommended for the model.
For the evaluation, two treatments from 2016 (0 and 50% fungicide treatments) and treatments from 2017 (0% and 100% inoculum level) and 2018 (0 and 100% inoculum level) were used. The calibrated model was used to simulate LAI, top weight, and storage root dry weight.
For statistical evaluation (as model performance evaluation criteria) of the simulated results, the coefficient of determination, the root mean square error (RMSE) and the d-statistics (index of agreement) were used. RMSE was used to estimate the deviation between measured (xi) and simulated (yi) values in the same unit (absolute measure of fit) Equation (5).
RMSE = ( y i x i ) 2 / n
Model performance was evaluated with the index of agreement (unitless measure), because it is more sensitive to larger deviations than smaller, due to the calculation of the difference between simulated and observed as squared values by Equation (6), as described in Yang et al. [25].
d = 1 ( y i x i ) 2 / ( | y i x ¯ | + | x i y ¯ | ) 2
Variation range of the index of agreement is 0.0–1.0, and values closer to 1 indicate a better fit.

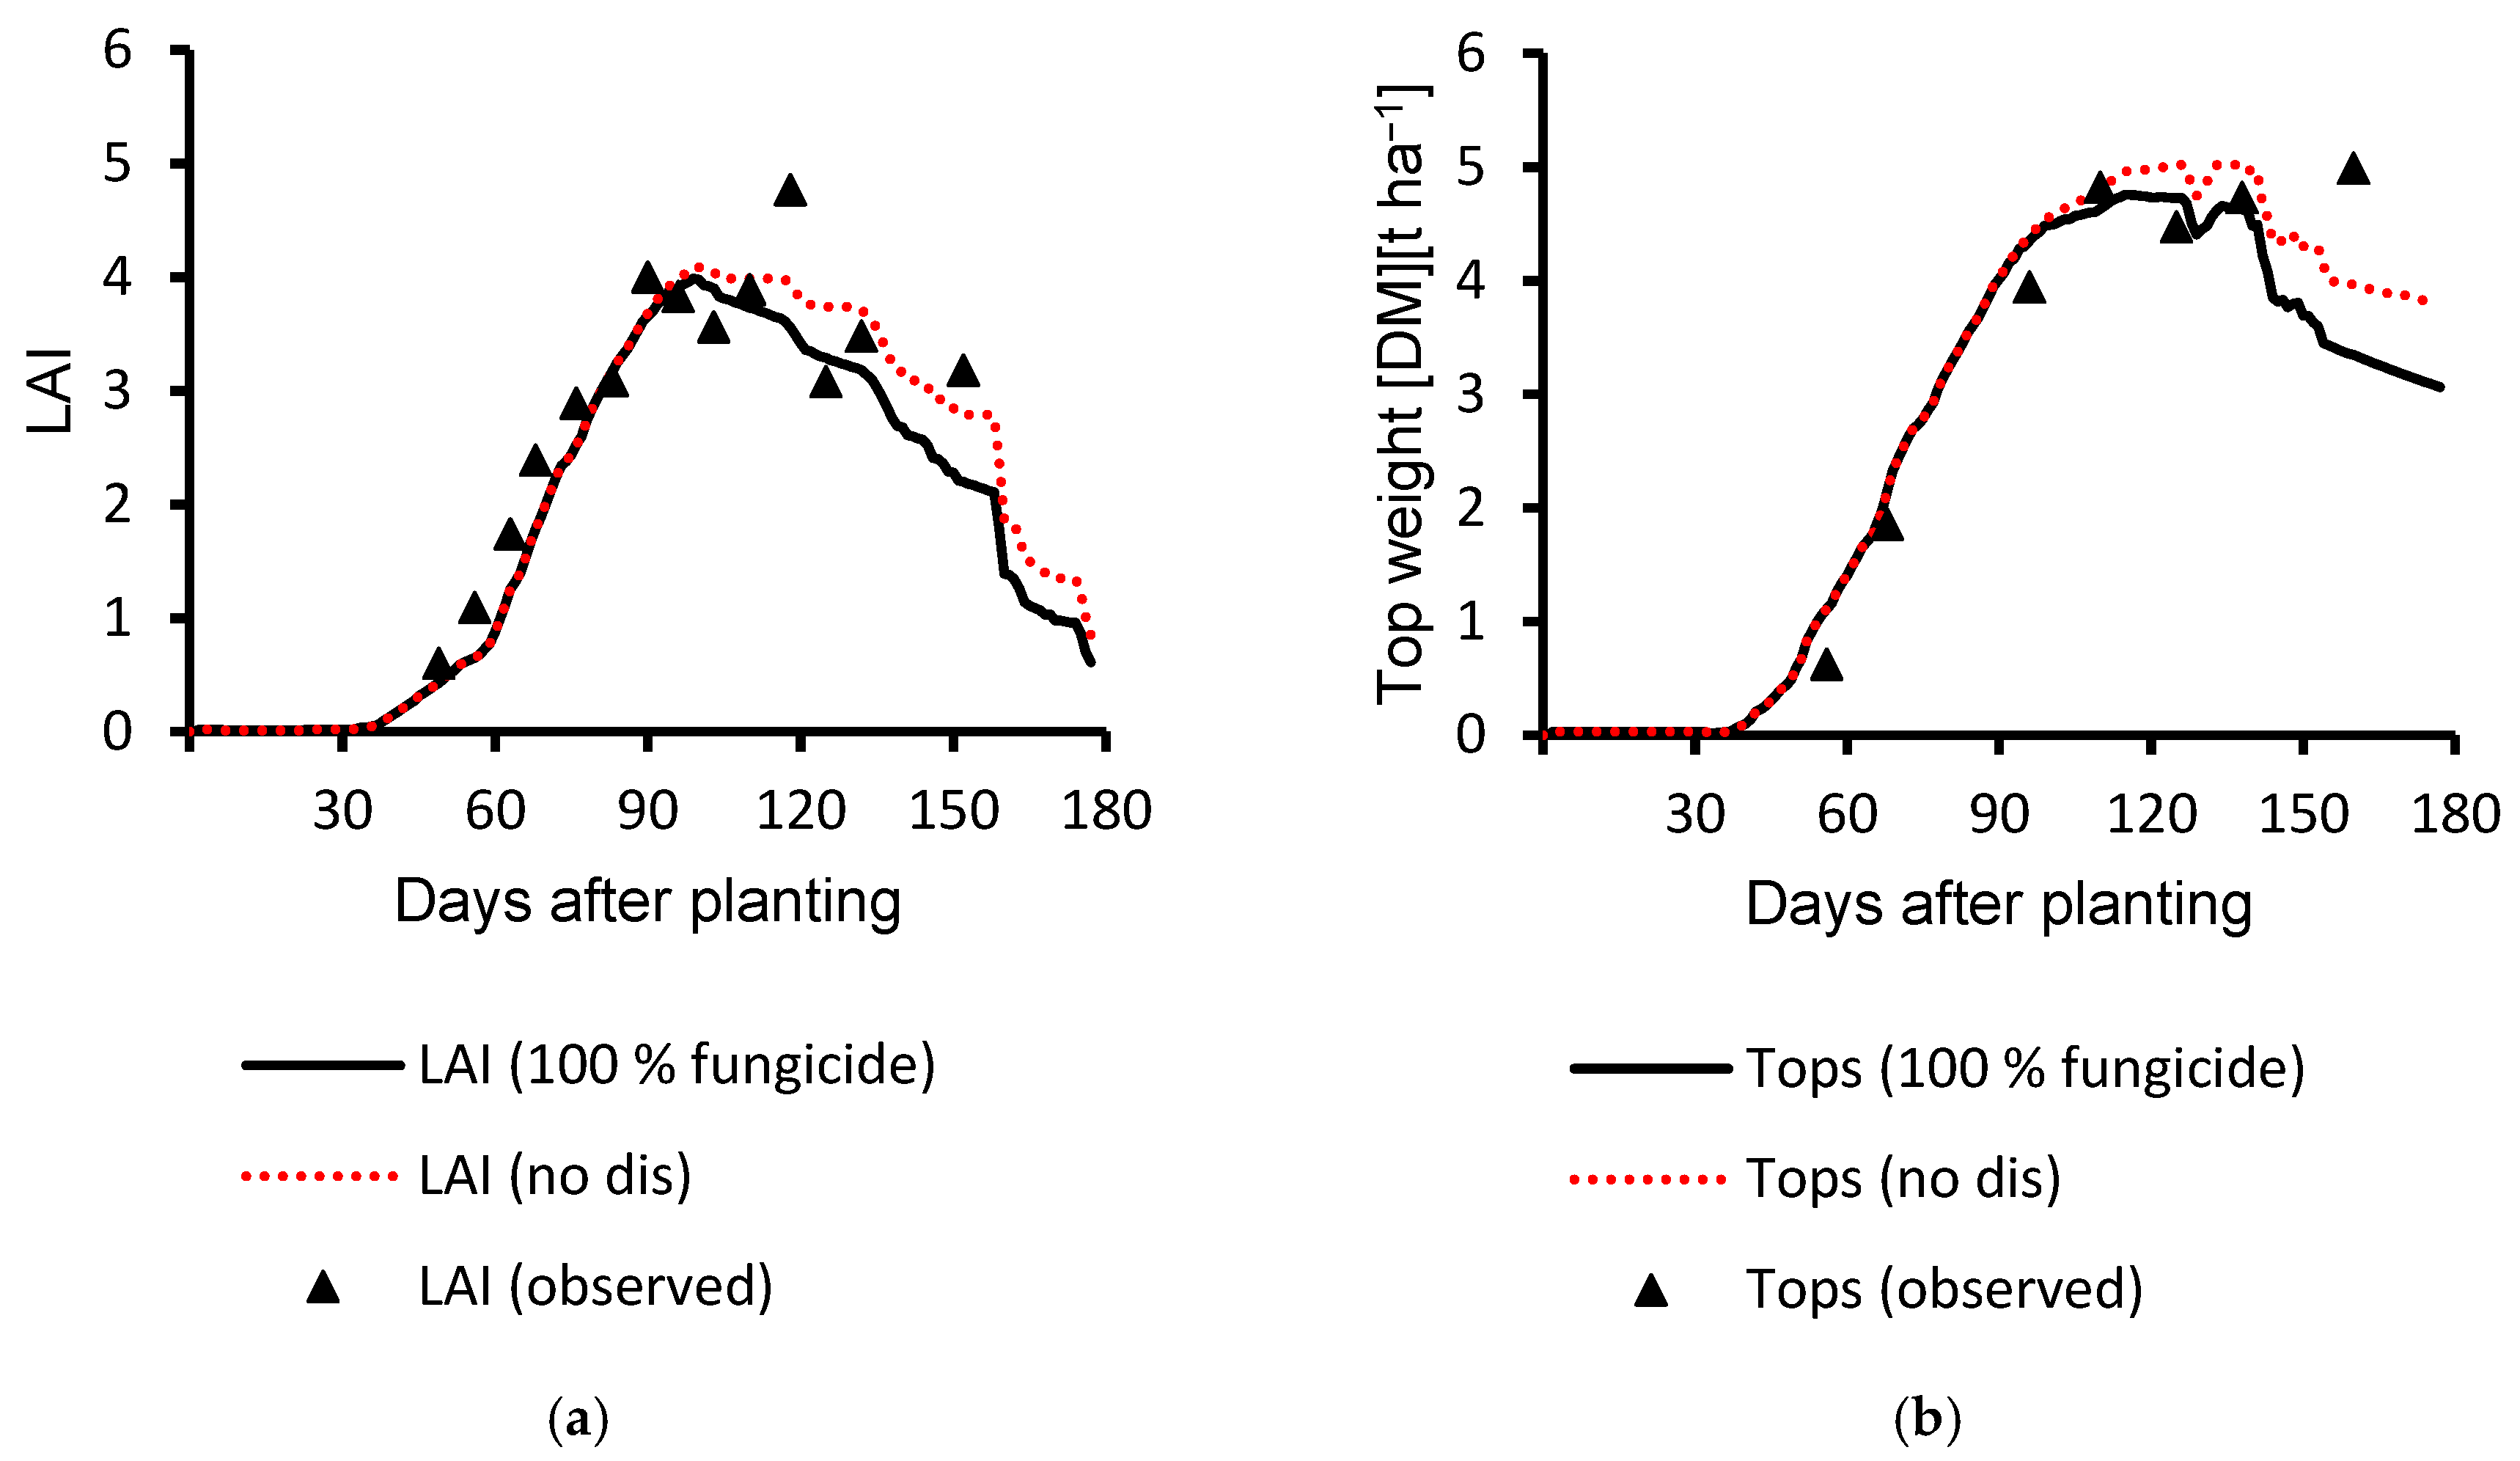
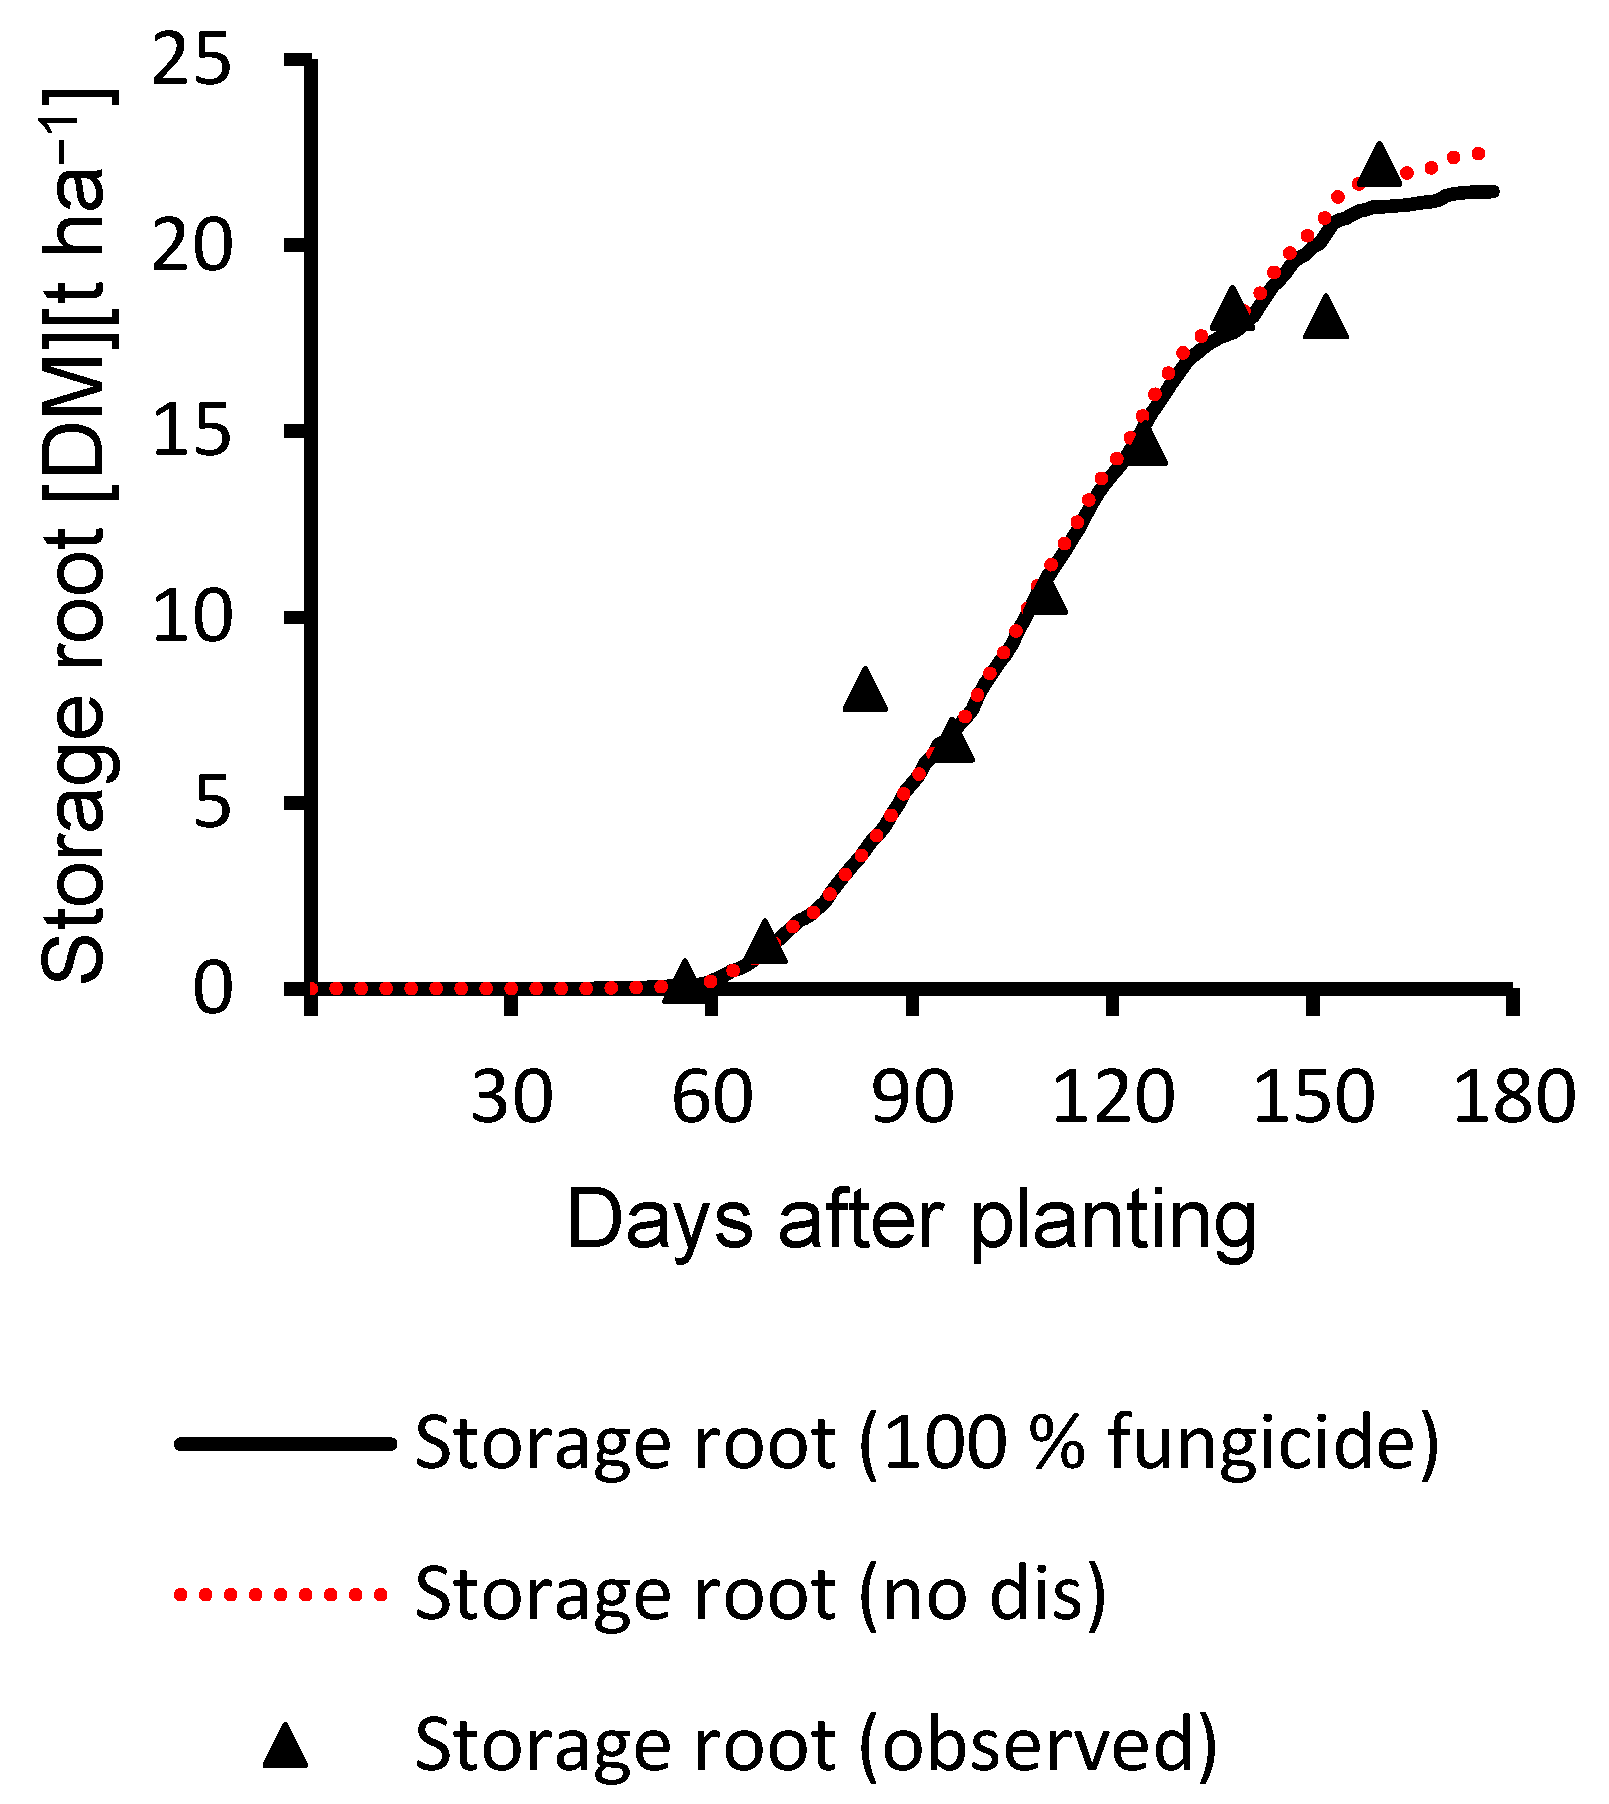
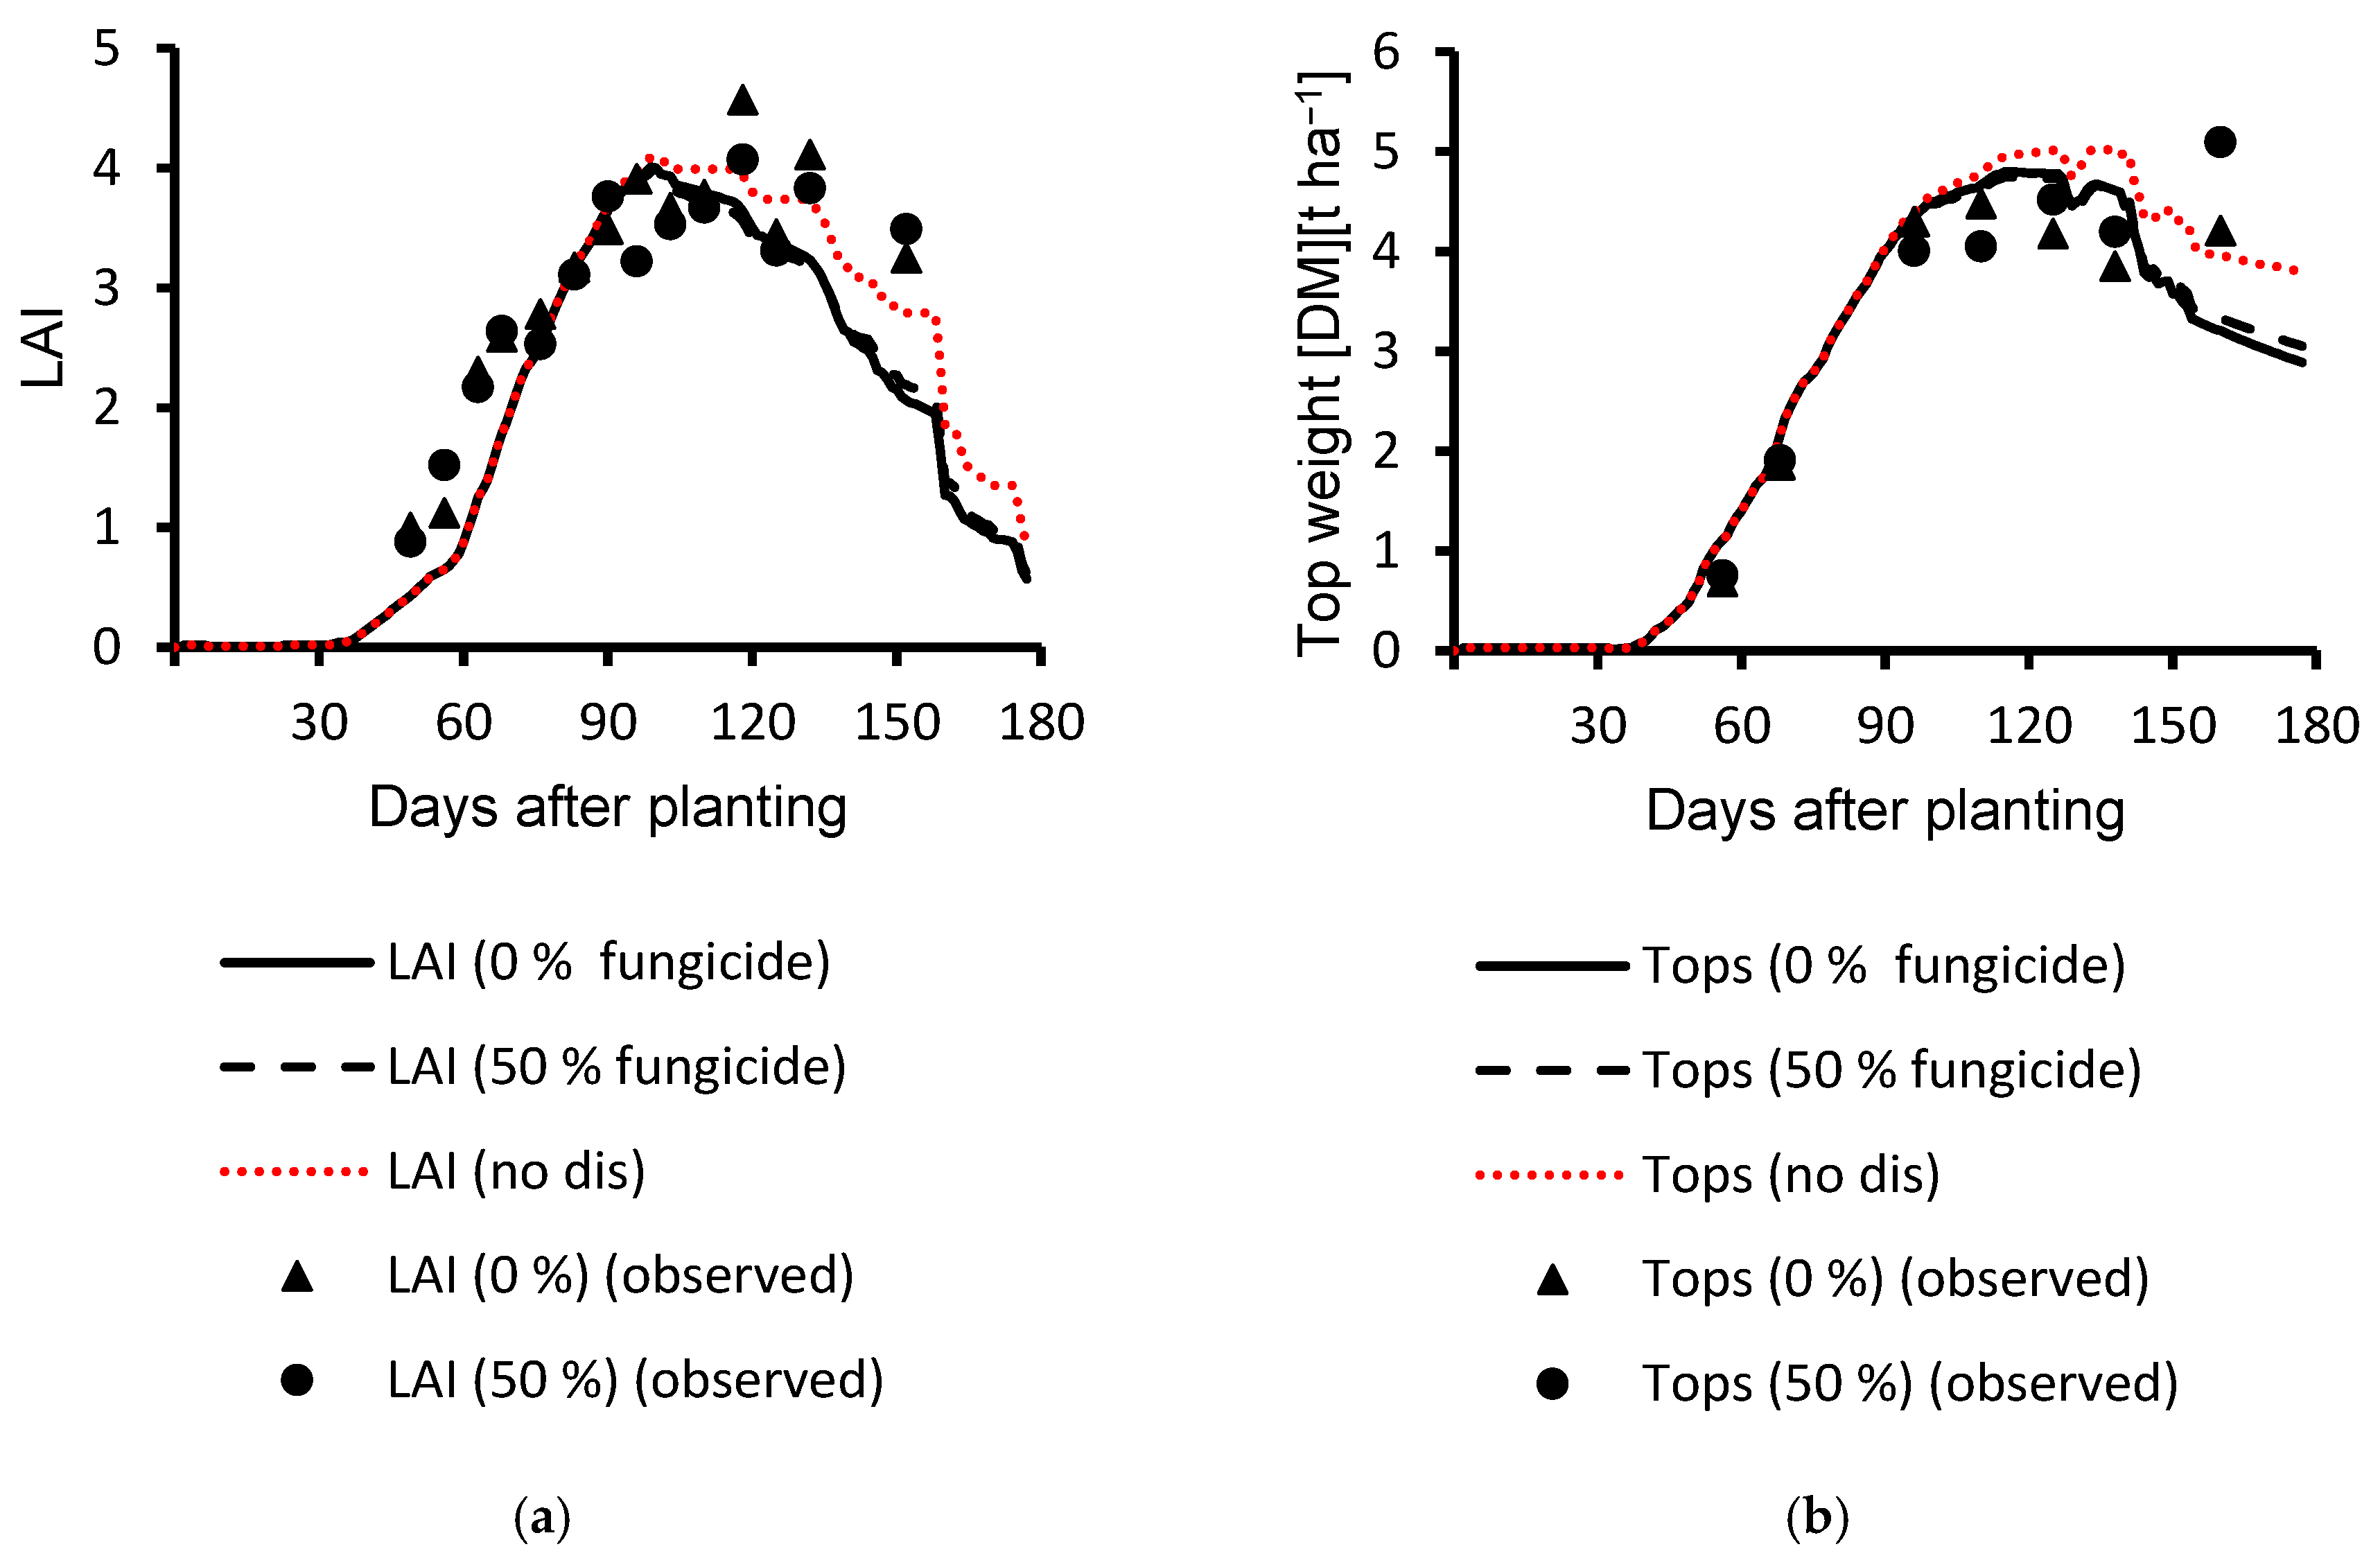
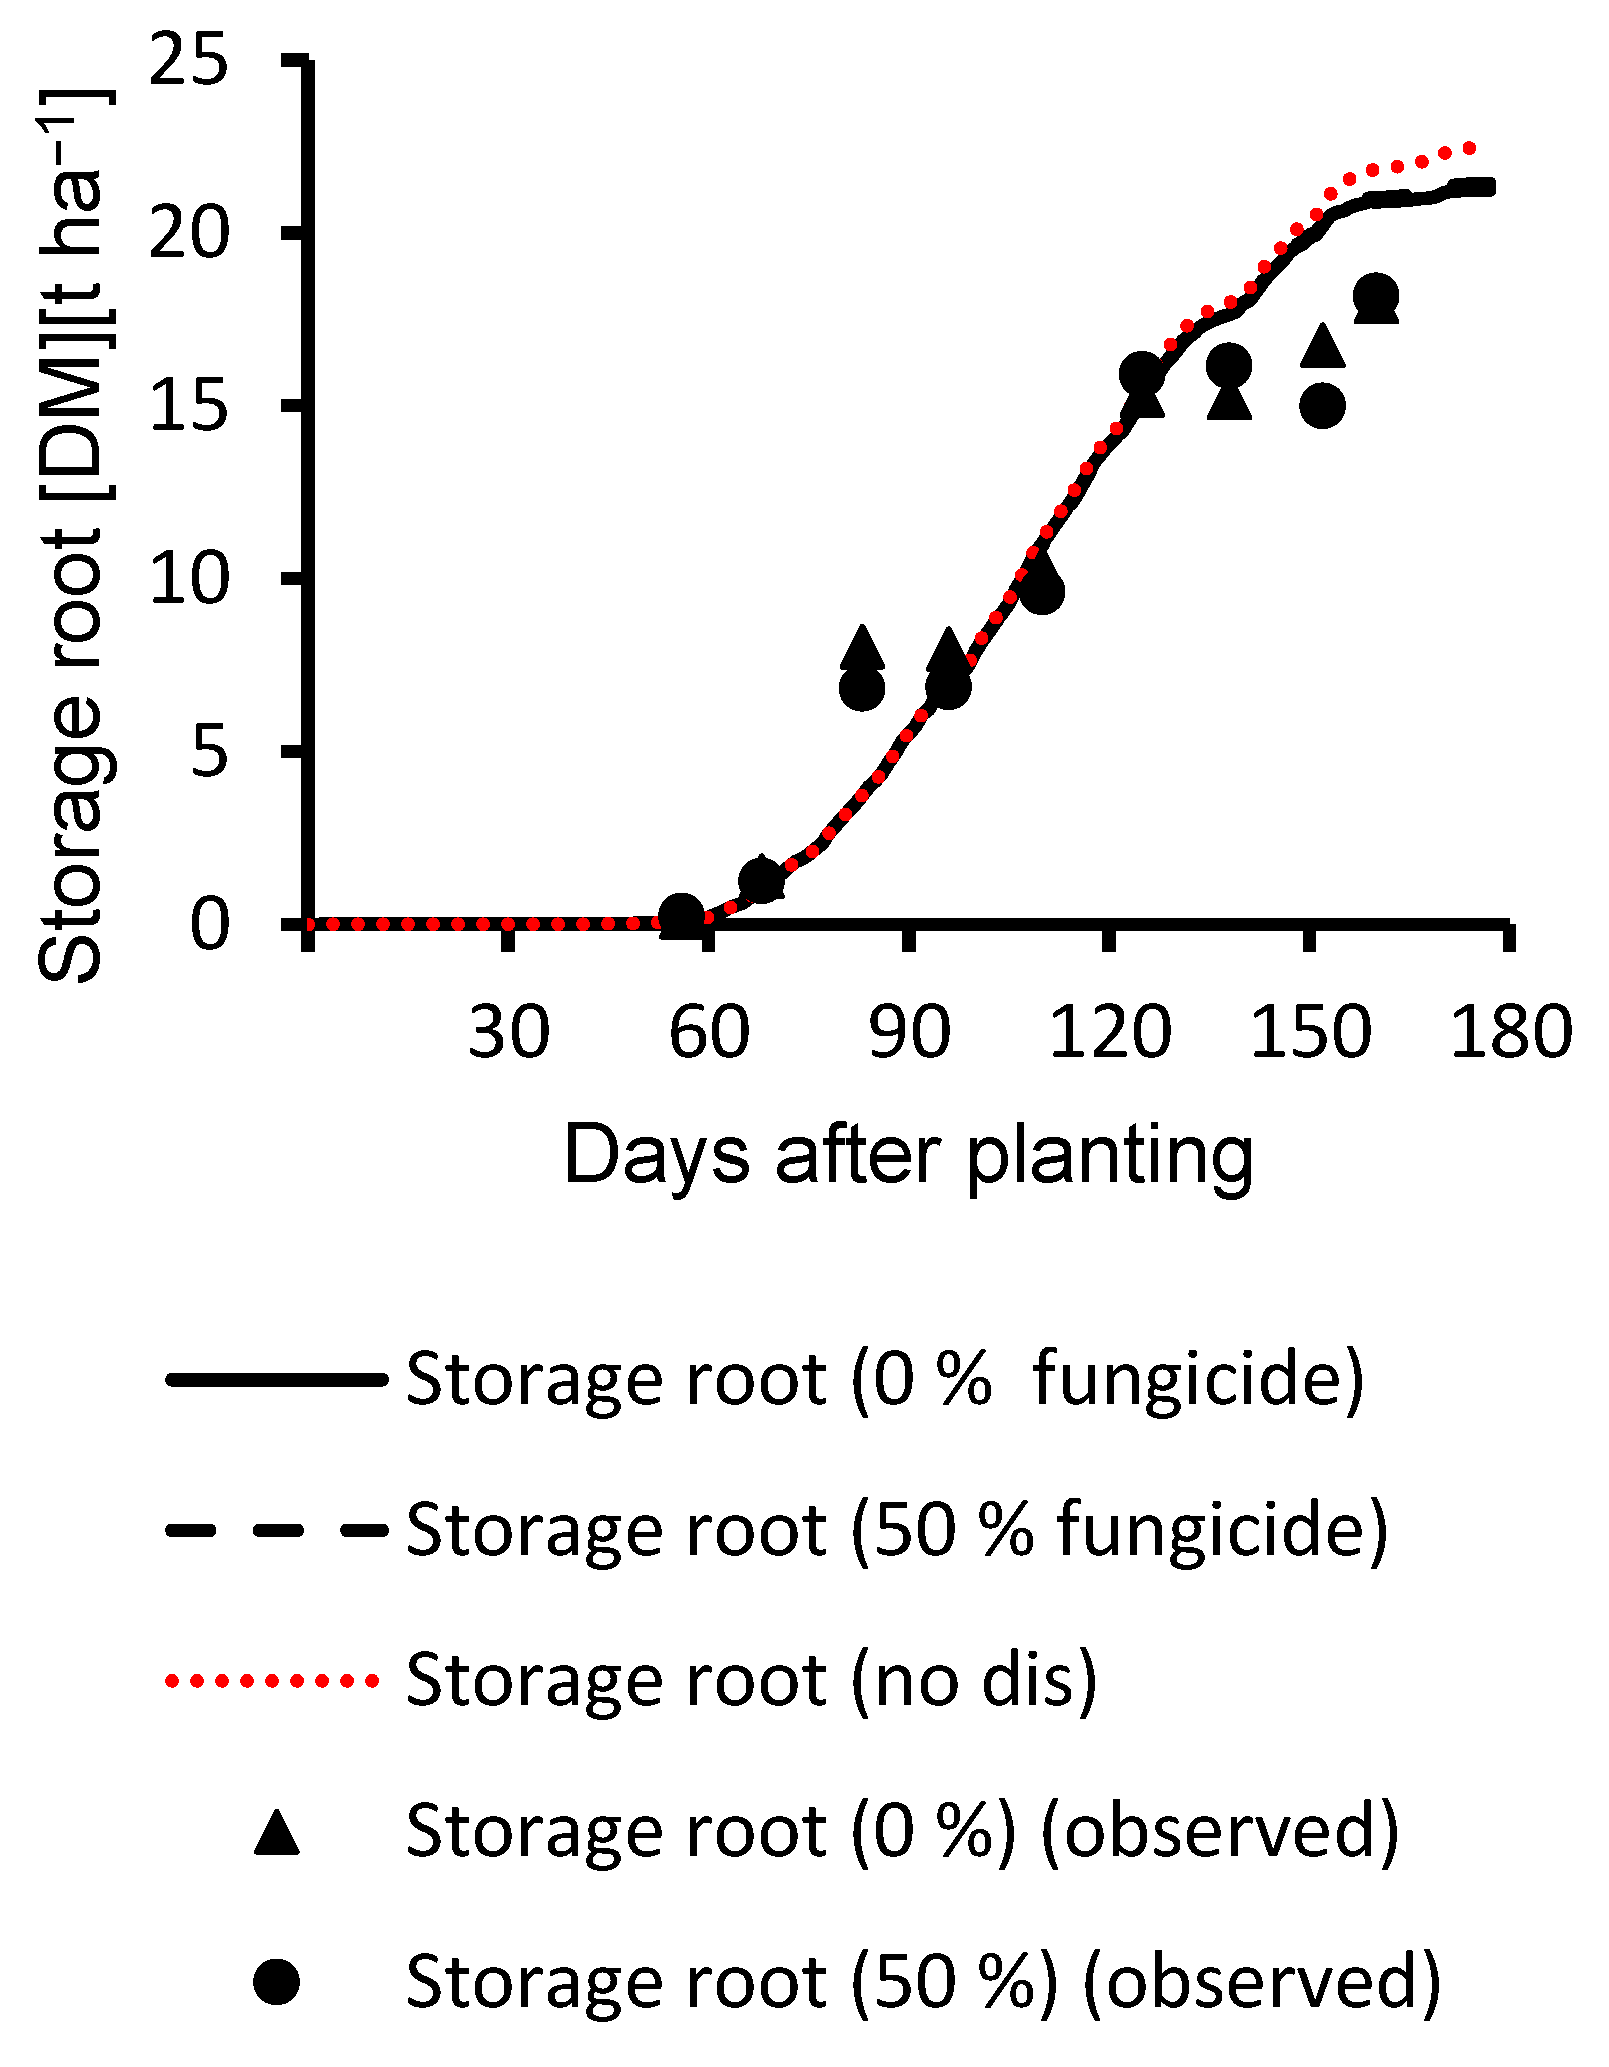
3.1. Calibration Results

Calibration results are shown as time series graphs (Figure 4 and Figure 5). As Cercospora leaf spot disease was introduced as damage on cumulative leaf area per plot, top and storage root weight were considered as important indicators of the overall model performance. In Figure 4, LAI (a) and top weight (b) are shown with observed values, and storage root yield in Figure 5. The model gave reasonably good estimations, based on the model evaluation criteria with high R2 and d-stat. and relatively low RMSE of observed data, as can be seen from figures and statistics in Table 4. For LAI, top weight, and storage root weight (DM) R2 were >0.82 and d-statistics > 0.94 (Table 4). Even though RMSE for storage root was 1696 kg ha−1, it is not an indicator of bad model performance due to the existence of two large deviations from the observed time-series trend (Figure 5, Table 4). The dip in the simulation curve of top weight (Figure 4b) on the 140th day after planting was not caused by Cercospora leaf spot disease damage integration as can be seen from the disease-free curve (“no-dis” sugar beet growth simulated with current genetics without disease ratings being included in simulation process—(red) dotted line), but a result of a structural issues within the model.
Detailed views of the measured data and the effects of disease levels on the calibration treatment (100% fungicide in 2016) are shown in Figure 6. Cercospora leaf spot disease impact on sugar beet growth was demonstrated with manually measured data with corresponding impacts on top weight (primary y axis) and storage root (secondary y axis) (Figure 6).

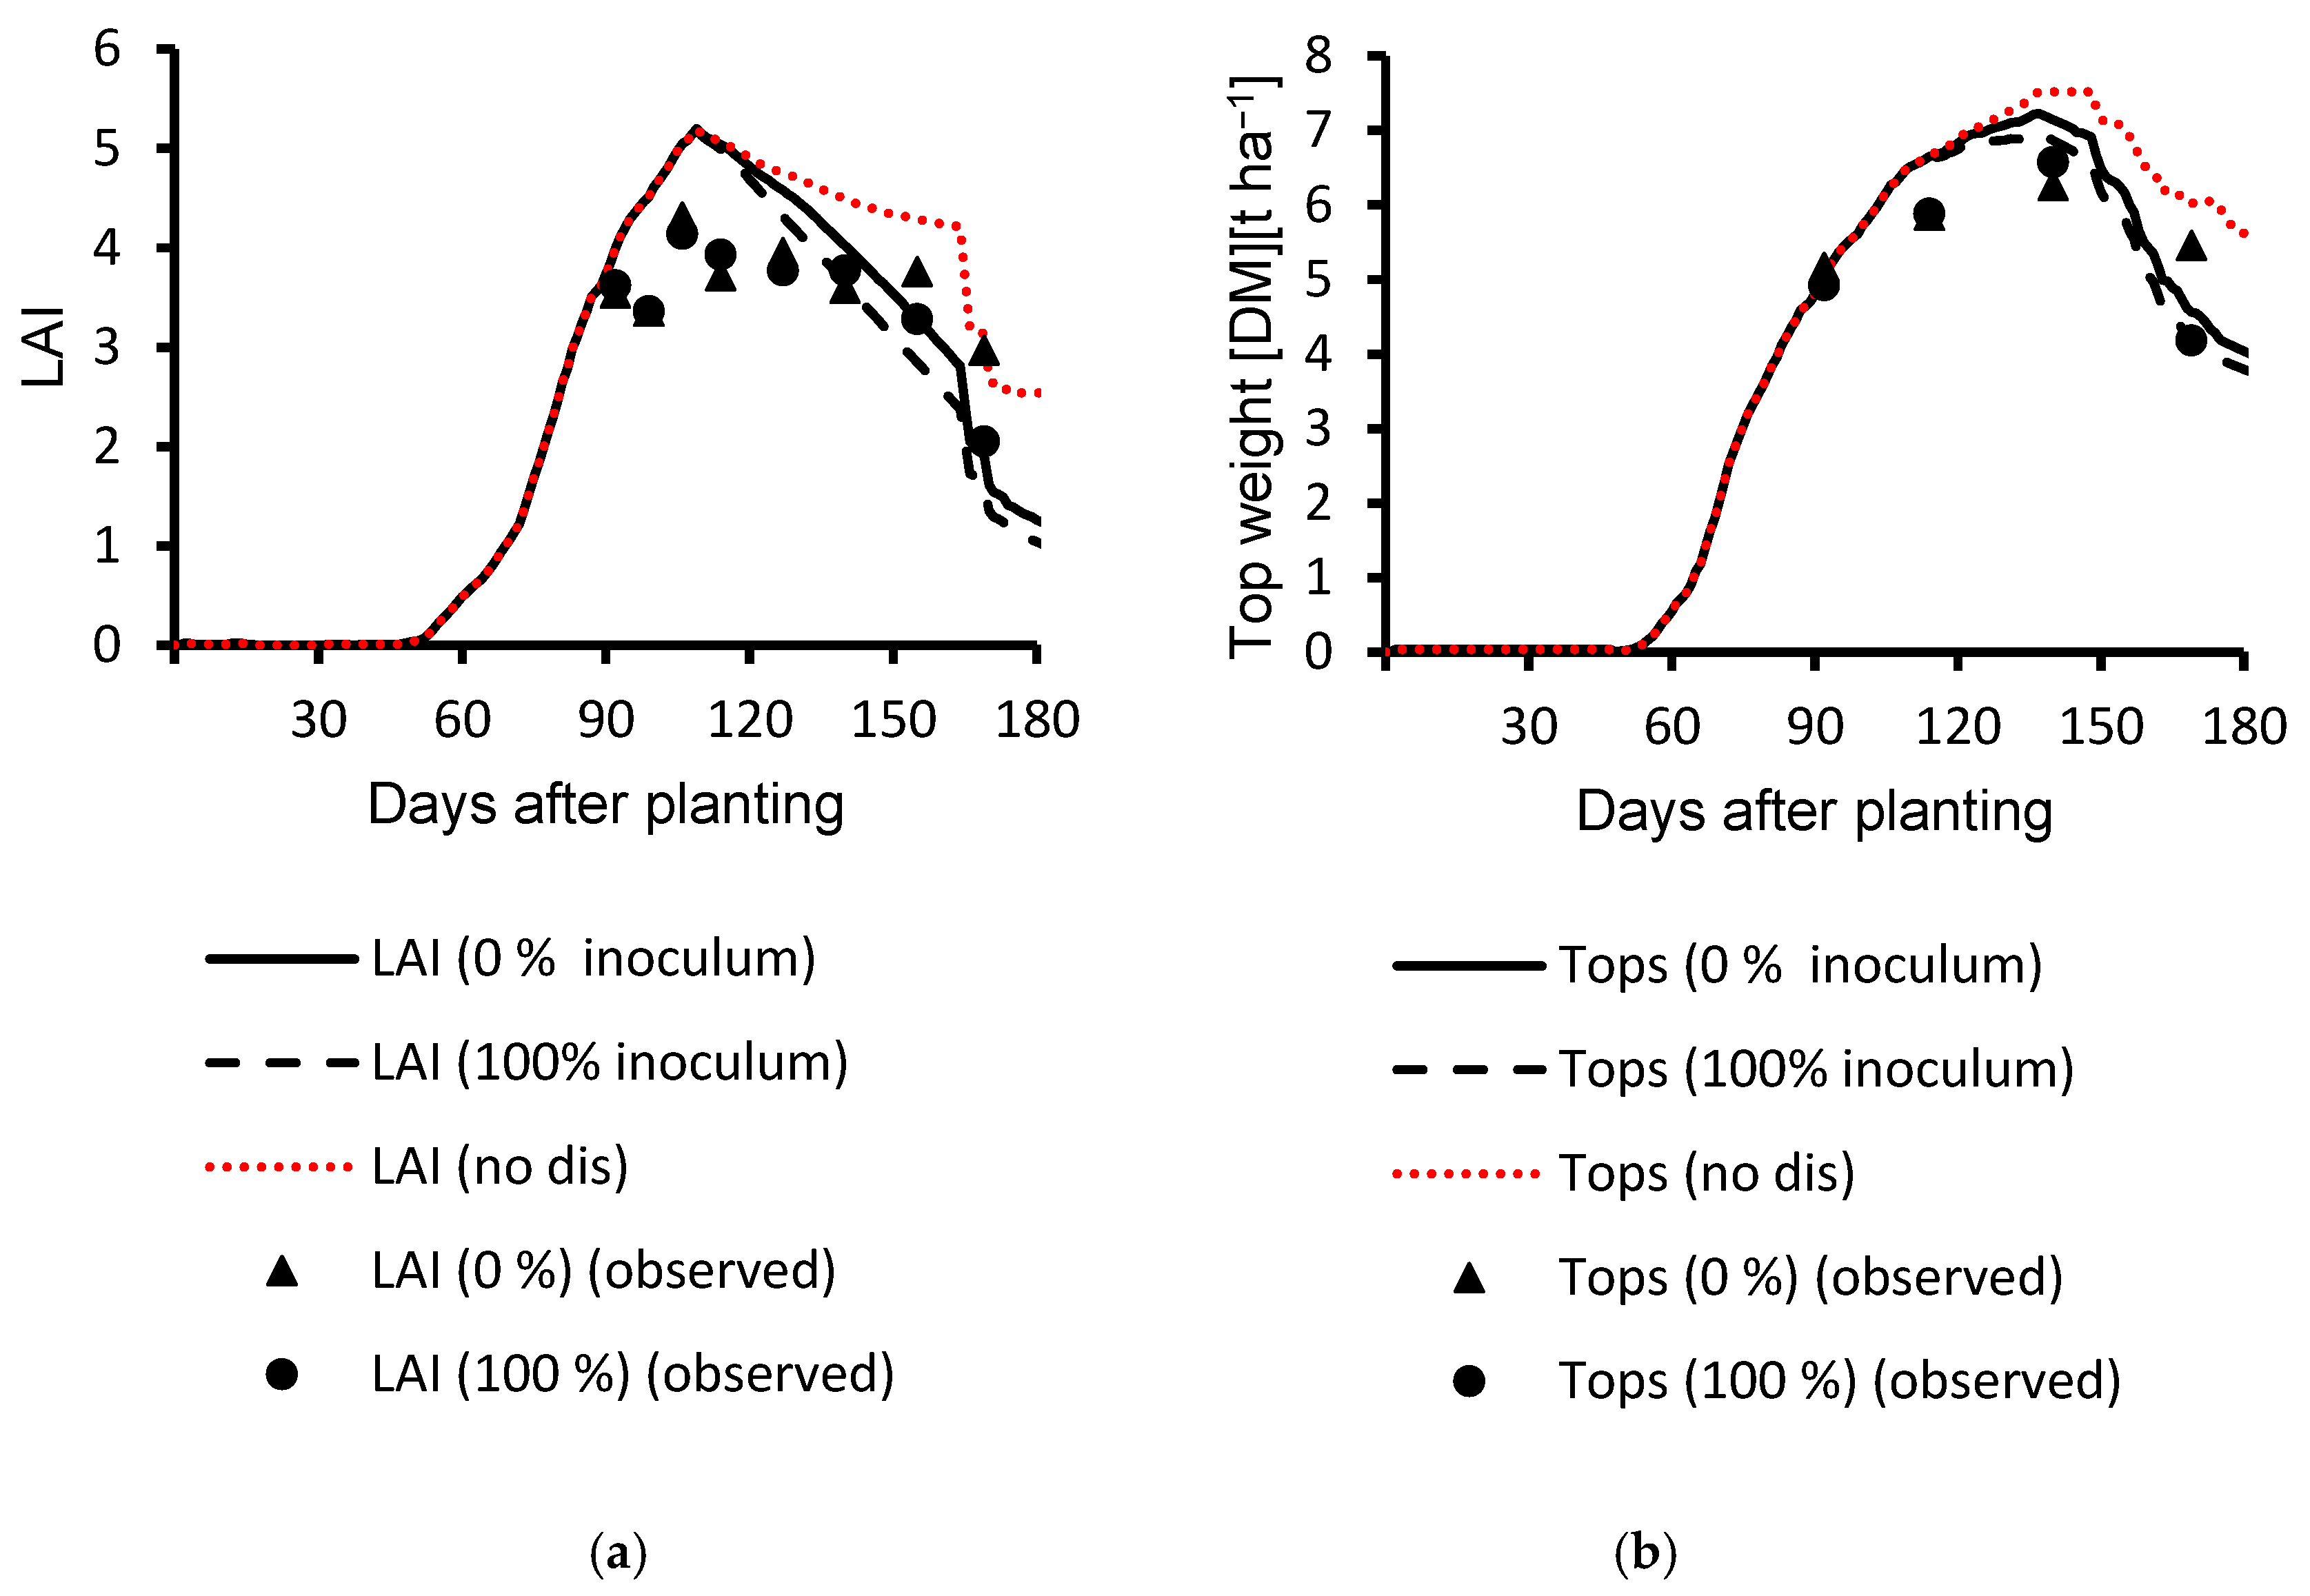
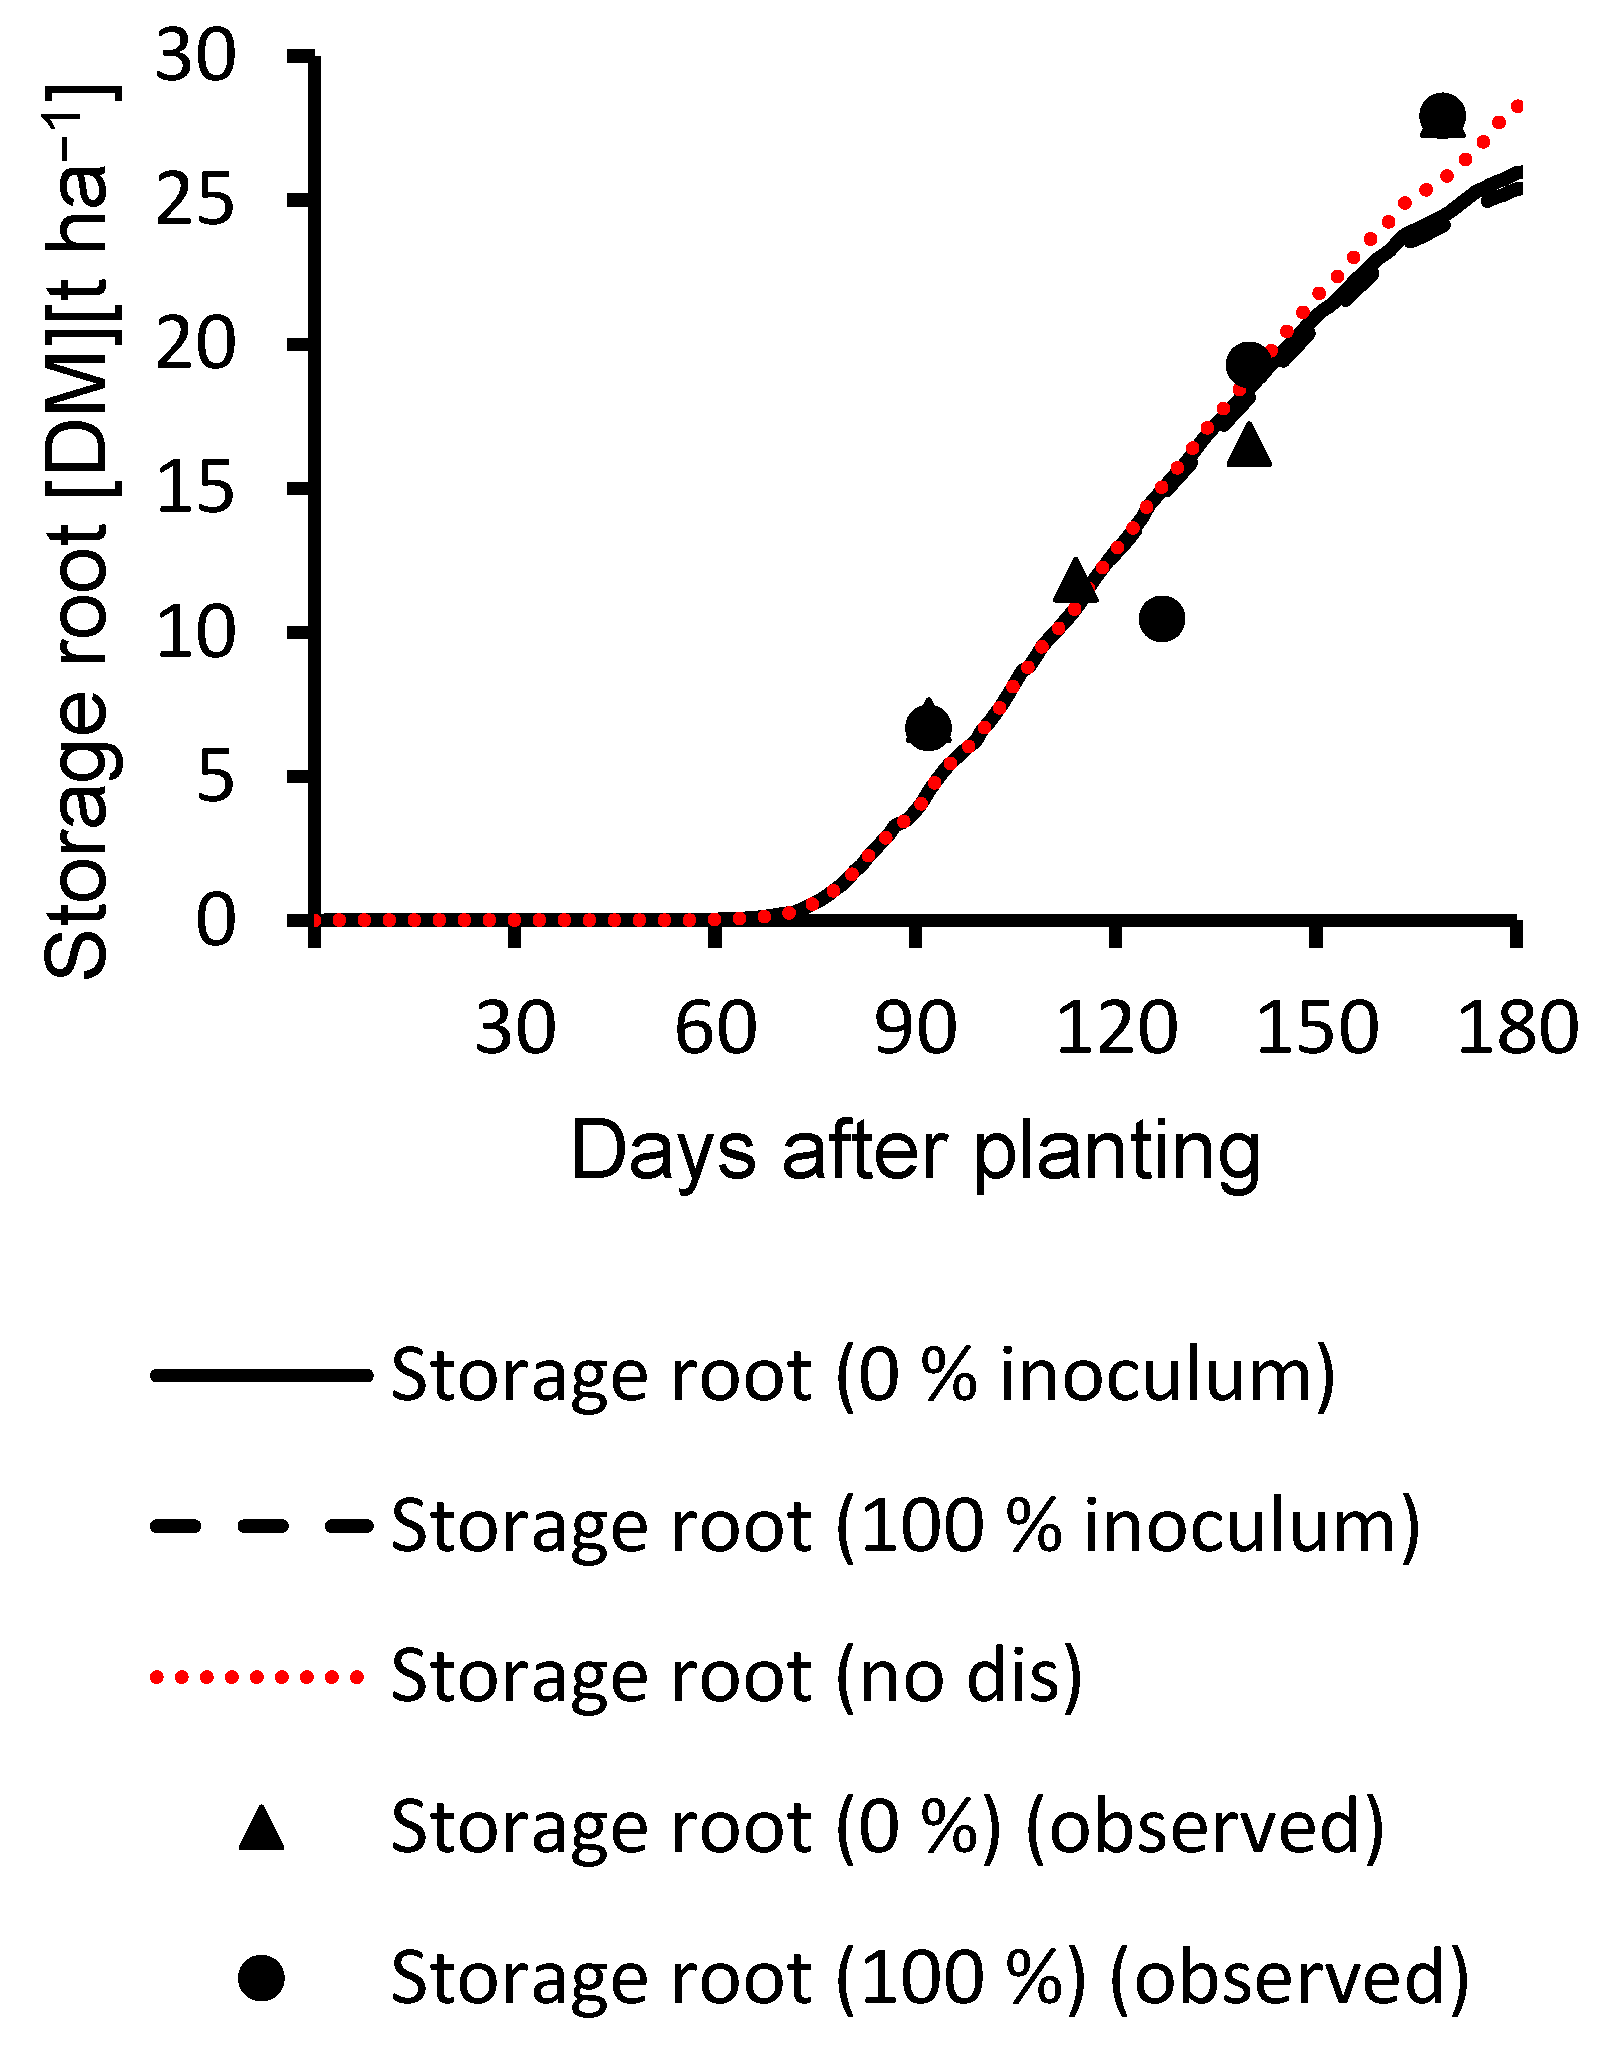
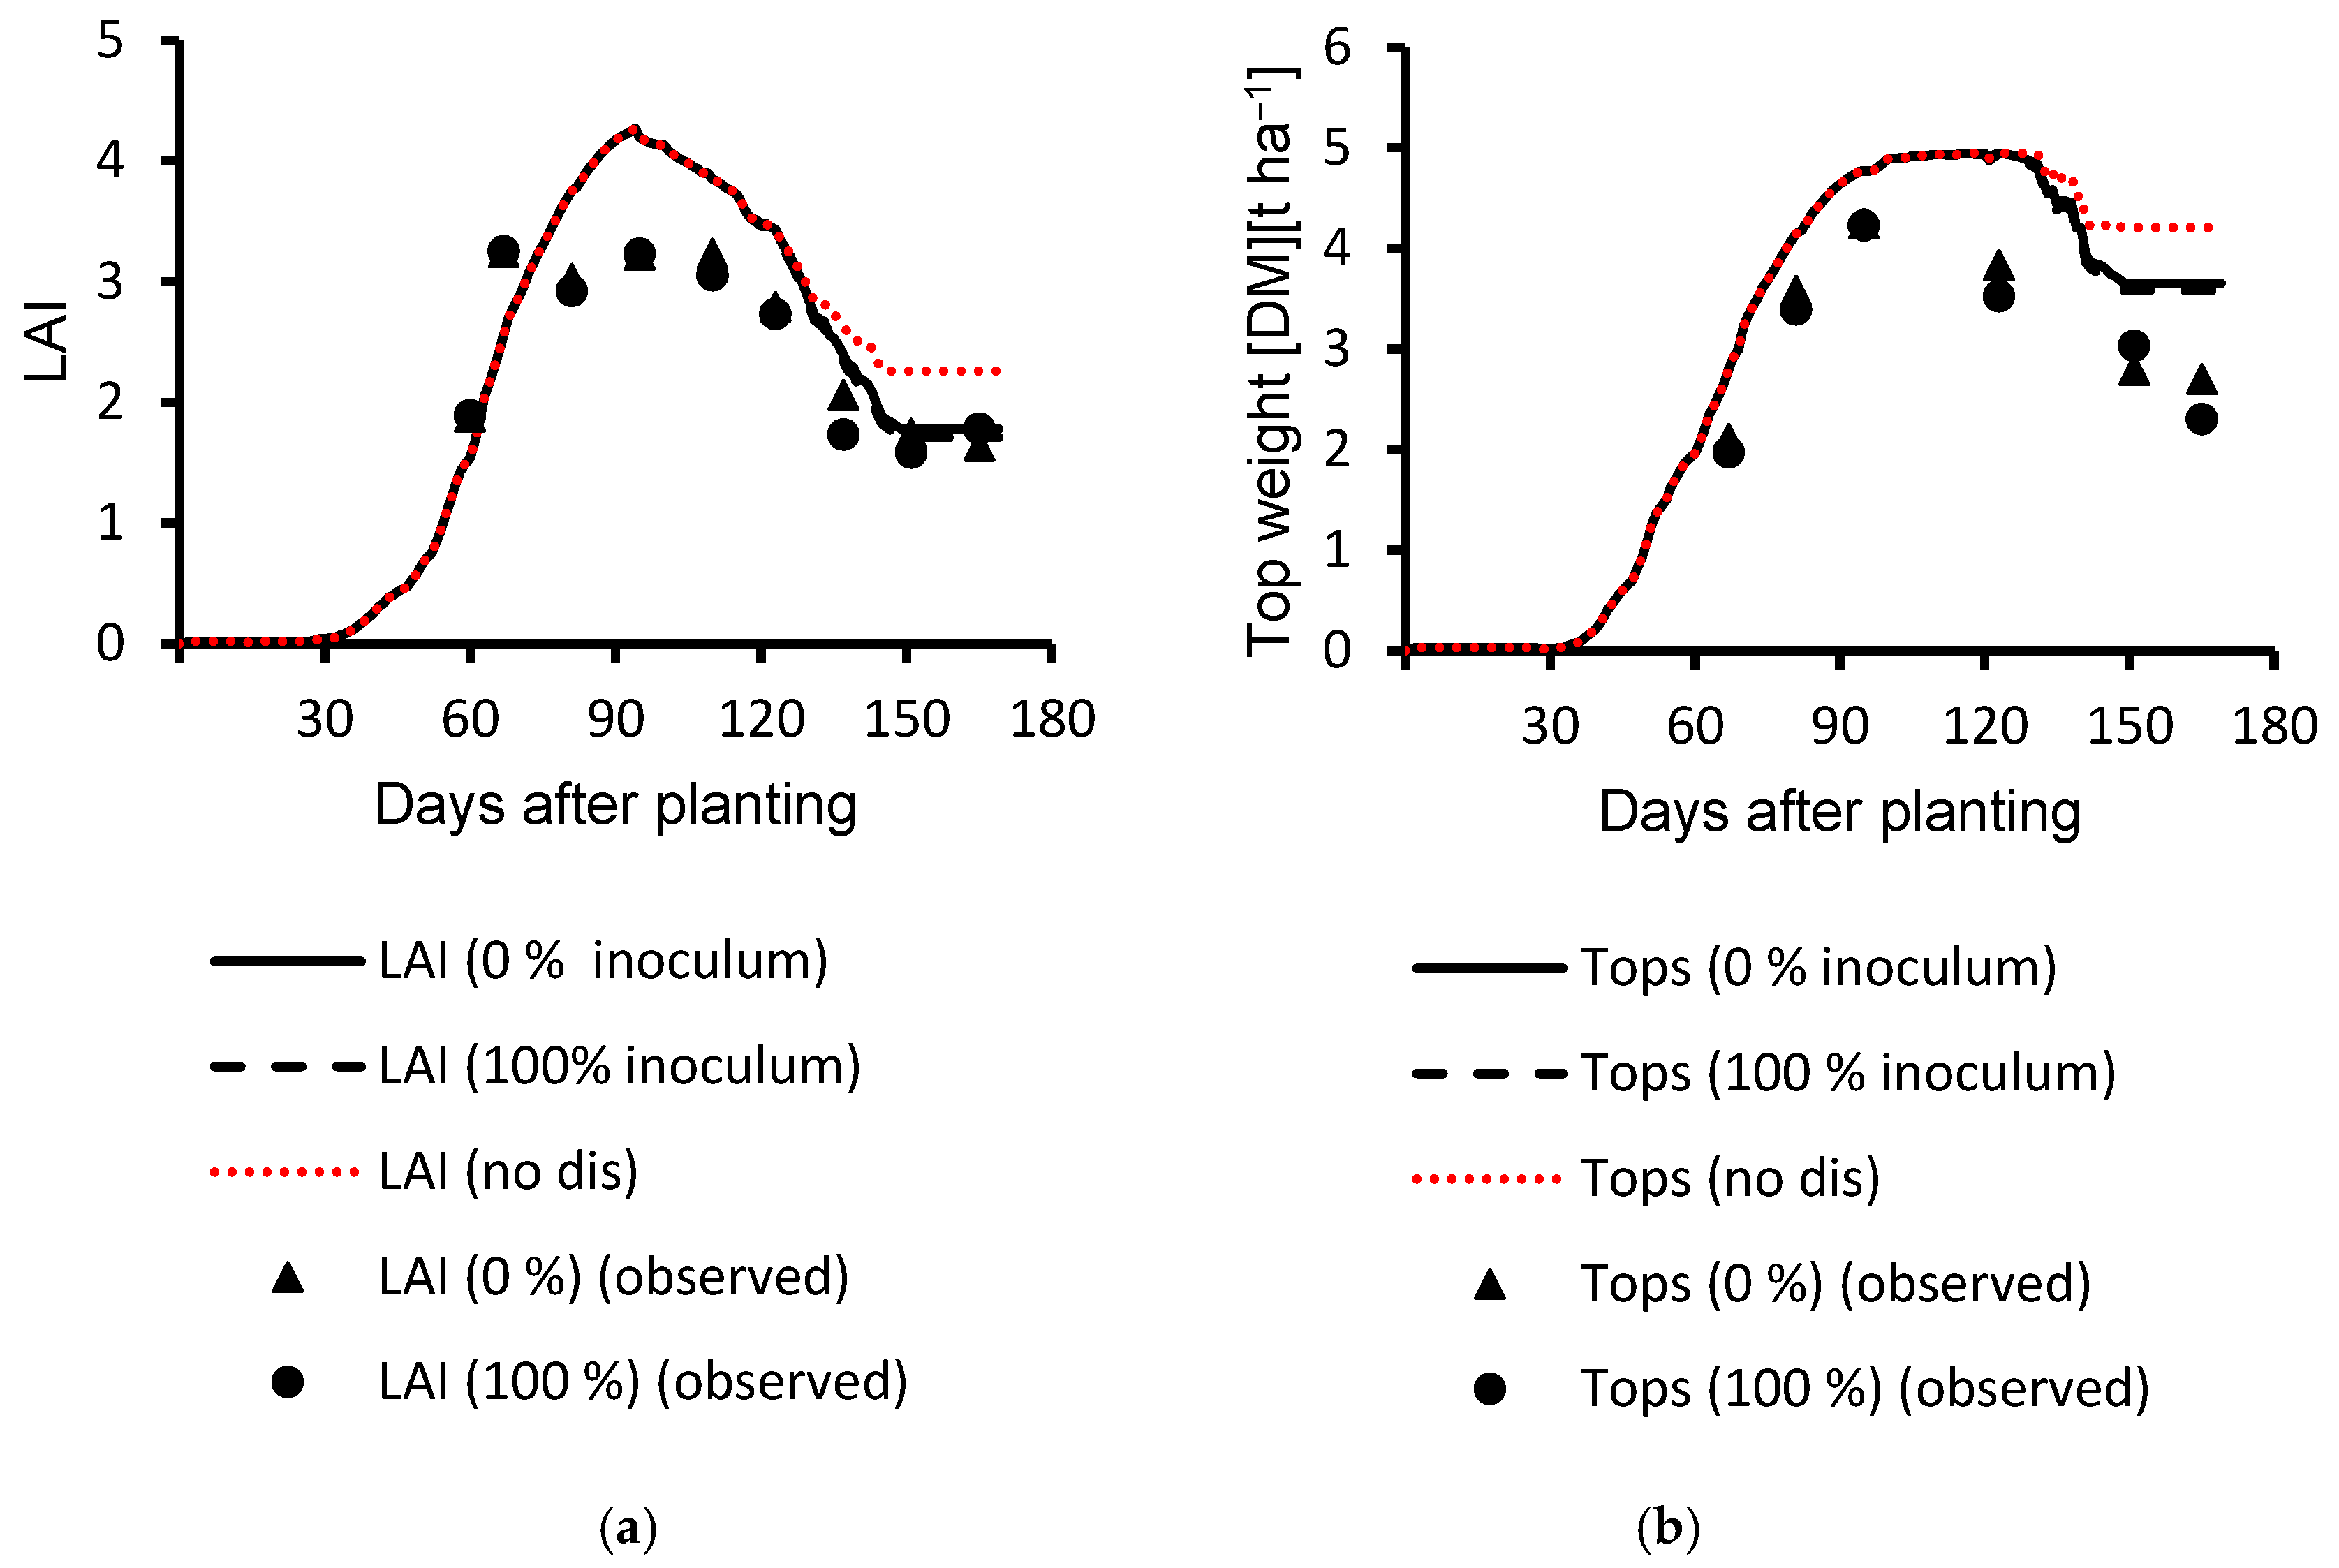
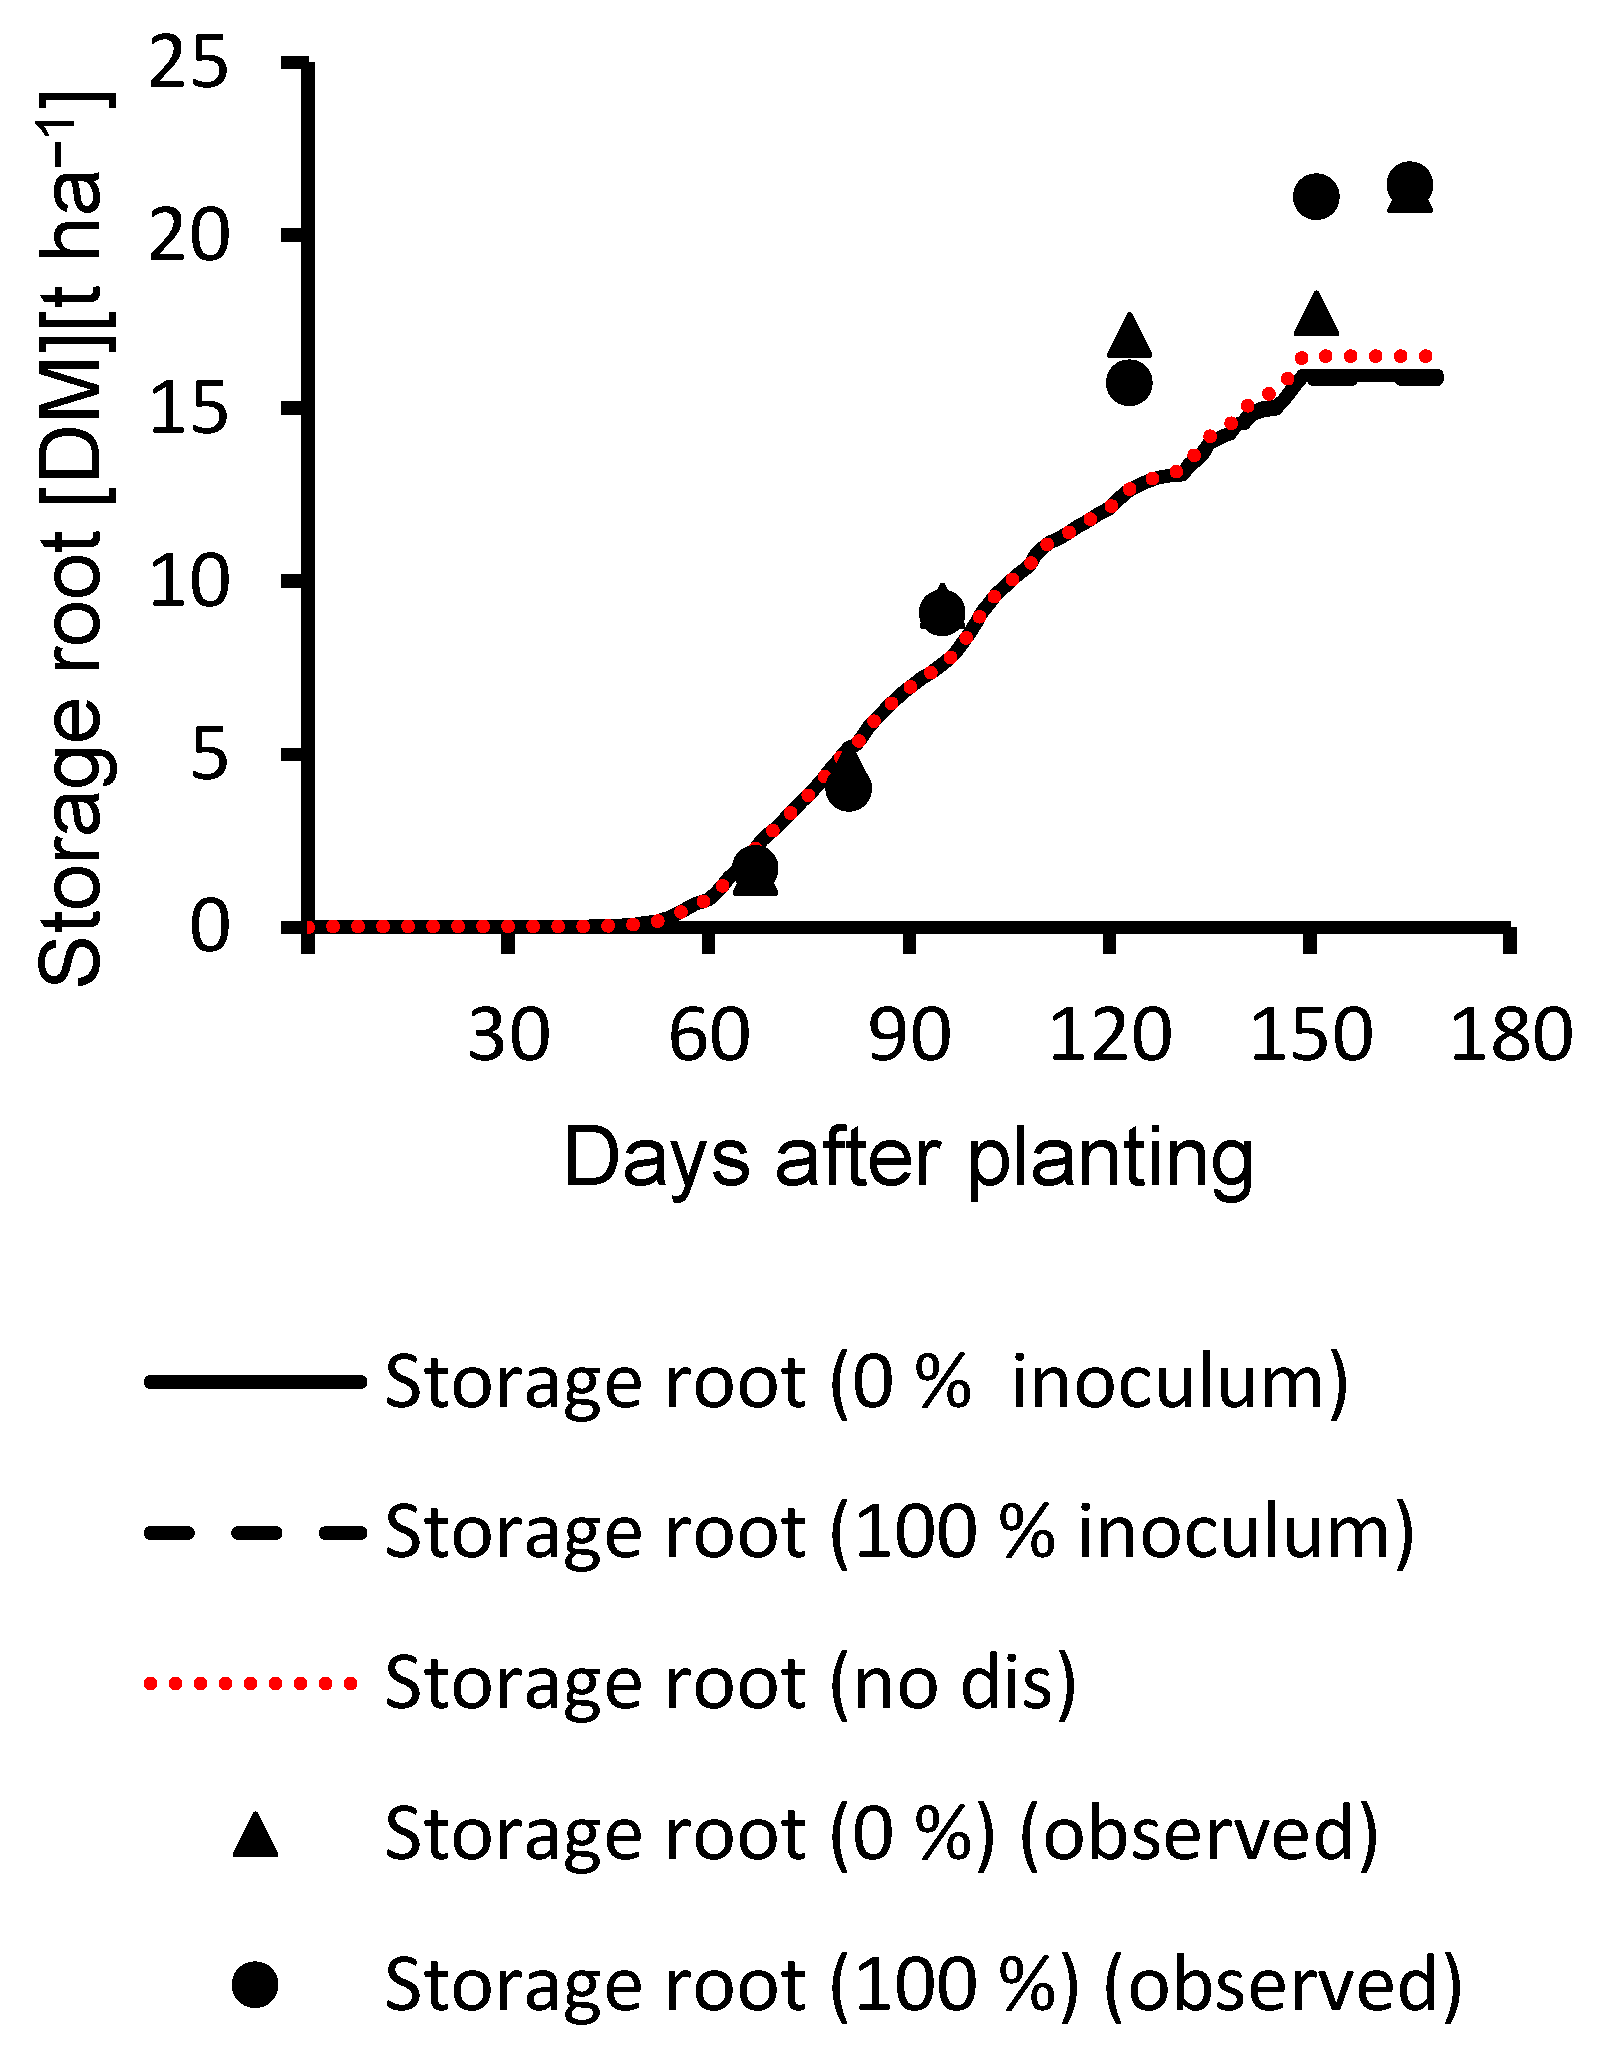
3.2. Evaluation Results

In 2016, the 0 and 50% fungicide treatments were available for evaluating model performance. For each evaluation treatment, 14 observations were available for LAI, seven for top weight and nine for storage root. Simulated LAI, top weight and storage root curves showed fewer fluctuations when compared among each other than observations on the same sampling dates across different treatments (Figure 7 and Figure 8). Simulated LAI was underestimated compared to observed values (Figure 7a). Overall statistics (Table 5) and visual fit (Figure 7a) were adequate for rough estimates, with d-statistics >0.91. Top weight (Table 5, Figure 7b) had the same problem as in calibration treatments after 140th day (the dip in simulation curve) but had a d statistic >0.92. Visual model fit for storage root (Figure 8) was good. Storage root R2 and d-statistics (Table 5) were very good with exception of the RMSE.
In 2017, the model simulated top weight and storage root well with the exception of the LAI. LAI was only partially satisfying (Figure 9a, Table 6) due to over-estimation of observed values with R2 being 0.54, 0.81 and d-statistics 0.63, 0.83 for 0% and 100% inoculum treatment, respectively (Table 6). Top weight (Figure 9b) and storage root (Figure 10) R2 and d-statistics were >0.96 with exception of top weight d-statistics for 0% inoculum treatment being 0.74 (Table 6).
Evaluation results for 2018 are shown in Figure 11 and Figure 12 with corresponding statistics in Table 7. In 2018, a drought period occurred in the region. The model did not entirely capture drought effects causing minor over- and under-estimations of observed values. Still, the visual fit (Figure 11 and Figure 12) indicated a satisfactory performance supported with reasonably good statistics (Table 7), based on the model evaluation criteria. R2 of 0.76 (0% inoculum treatment) and 0.70 (100% inoculum treatment) were due to the over-estimation of LAI. LAI curve trend was simulated well, as can be seen in Figure 11a and LAI d-statistics 0.87 and 0.84 for 0% inoculum and 100% inoculum treatment, respectively. The same over-estimation of the observed values occurred for top weight dry matter (Figure 11b) with slightly better R2 and d-statistics than for LAI (Table 7). Storage root dry matter simulation results (Figure 12) were partially satisfying with under-estimation close to harvest time. For both treatments, storage root dry matter R2 and d-statistics were >0.94 (Table 7).

3.3. Model-Based Yield Losses Evaluation Results

Sugar content was analysed for every sampling date, as described in the Methodology section. Sugar content was measured as percent of dry matter within weeks before harvest (three samples each in 1–2 weeks interval) and the average across all treatments (2016–2018) was 68% as shown in Table 8.
In retrospect, sugar yield was quantified as percent of dry matter per experimental plot (Table 8) and used for quantifying sugar yield in simulated dry matter. To simulate sugar yield losses (SY loss, based on the measured sugar content percentage shown in Table 8), the model-based storage root dry matter quantities (SRW) were evaluated by comparing the no disease treatment (“no dis”—Cercospora leaf spot disease damage ratings not included in the simulation process) and disease treatments (“dis”—with Cercospora leaf spot disease damage ratings included) based on Equation (7) with results shown in Table 9.
SRW loss [DM] = SRW no dis [DM] SRW dis [DM]
Sugar yield loss (SY loss kg ha−1) was then computed with Equation (8), by a sugar content (Sc) of 68% (Table 8) based on the storage root losses (SRW loss) shown in Table 9.
SY loss = SRW loss   [ DM ] × Sc [ % ]
The results of simulated sugar yield loss (SY loss) based on the simulated storage root weight loss (SRW loss) are shown in Table 10. In 2016, three fungicide application rates (0%, 50% and 100%) resulted in different observed leaf disease percentages. Higher applied fungicide amount resulted in lower disease damage and lower storage root loss and consequently lower sugar yield loss as shown in Table 10. In 2017 and 2018, Cercospora beticola inoculum was mechanically spread as two different treatments (0% and 100%) in order to cause additional leaf disease damage for investigating the impact on above-ground biomass and storage root accumulation rates. Applied inoculum resulted in higher observed leaf disease percentages that correlated with higher storage root losses (Table 10). For modelling purposes, in-field leaf disease was observed for designated plots without investigating direct relationships between observed leaf disease percentages and quantities of applied fungicide and inoculum.

4. Discussion

In 2017, sugar beet was planted at the beginning of April in a period with lower temperatures (Figure 1). The model simulated the overall LAI pattern quite well. However, likely due to the lower temperatures around emergence, the model did not simulate LAI growth correctly 20 to 30 days after planting.
The Cercospora leaf spot leaf area disease progress (%) was capturing plot-based disease status very well until leaf disease patches in the plots were observed (within days after leaf area disease progress (%) = 100). Above that level, leaf area disease progress (%) did not reflect the severity of the spread. During the study, Cercospora leaf spot patches were recorded on plot level. A further method needs to be developed that compliments the approach (leaf area disease progress (%)), to enable the user to add information on disease severity based on the observed Cercospora leaf spot disease patches. This additional method will help to integrate Cercospora leaf spot disease severity information from the point where leaf area disease progress (%) method of the middle 10 leaves (long-term leaves) lose explanatory power, closer to harvest time.
When interpreting the results, many factors have to be included, such as the length of the growing period, timing of Cercospora leaf spot occurrence and leaf area disease percentages. For example, lower Cercospora leaf spot disease damage introduced earlier in the CSM-CERES-Beet model led to higher reduction in above-ground biomass compared to higher leaf disease damage introduced in the model closer to the harvest time. Sugar beet has the ability to produce new leaves throughout its entire vegetative stage (in its first year). Depending on the soil and weather conditions, it can “replace” lost leaves. Currently, the model does not account for this, as it is accumulating dry matter on a daily basis.
The occurrence of Cercospora leaf spot disease depends on specific weather factors, as optimum daily temperatures are 20 to 25 °C [2]. Cercospora leaf spot can occur at lower temperatures and a broad range of humidity [2] and changing microclimates within a plant stand. It was observed in the experimental field that Cercospora leaf spot often exhibited a patchy distribution later in the growing season, close to harvest.
Reliable and timely assessments of Cercospora leaf spot occurrence and spread are the basis for planning targeted plant protection activities in the field. Visual plant disease estimations by extension officers is one way to collect these data, or leaf disease spread simulation models such as that developed by Rossi and Battailani. Rossi and Battailani [26] used the CERCOPRI model to quantify the effects of Cercospora leaf spot on sugar yield. Rossberg et al. [27] modified CERCOPRI in order to simulate early Cercospora leaf spot epidemic’s impact on sugar beet growth and yield and to evaluate the impacts of fungicide applications. Their work resulted in the development of CERCBET 1, which was further improved by Racca et al. [28]. Other significant Cercospora leaf spot forecasting models are: the leaf spot model for sugar beet [29], the integrated pest management system in Germany [2], and the integrated surveillance of leaf disease in sugar beet [30]. All of these model development efforts were conducted in order to moderate application of chemicals based on the environmental conditions combined with field scouting reports.
If crop growth models can be coupled in the future with suitable sensor technologies [31] or models capable of predicting leaf disease occurrence based on the leaf disease favouring weather conditions, their potential as decision support tools is enormous. Hyperspectral imaging can be used for analysis of Cercospora leaf spot as shown in Leucker et al. [32]. More importantly, various aspects of the crop growth and leaf disease dynamics and interactions can be investigated in detail. Using a crop model, impact of soil profile (e.g., soil texture, soil water holding capacity, soil organic matter etc.) and daily weather data (temperature minimum and maximum, precipitation, and solar radiation) on overall crop growth can be investigated in more detail. With the ability to estimate growth limiting factors and leaf disease effects, a detailed economic analysis can be conducted based on the detailed field information included in the crop model analysis. With further development and improvement, the CSM-CERES-Beet might be used as a decision support system, coupled with sensors capable of quantifying Cercospora leaf spot diseases in sugar beet. Overall, further model developments are needed as leaf disease severity information is used for the evaluation of sugar beet dry matter losses per defined plot. Nevertheless, three years of observed data for this specific cultivar are not enough for determining Cercospora leaf spot damage. There is a need to look at more than one cultivar and in a greater diversity of fields and environmental conditions to further improve the models.

5. Conclusions

Field experiments were conducted over three years to develop and test the Cercospora leaf spot disease subroutines for simulating the damage caused by Cercospora leaf spot disease in sugar beet with CSM-CERES-Beet. Values for Cercospora leaf spot leaf area disease progress (%) were converted into leaf disease damage rates (internally in the model) and applied to the selected disease coupling point. Introducing leaf disease impact played a very important role in simulating storage root yield and sugar content during the later sugar beet growing period and led to an overall better fit between observed and simulated values when compared to the results where disease damage was not reported or included. The approach can serve as a suitable decision support system to simulate the impact of observed Cercospora leaf spot damage on accumulated above-ground biomass and storage root yield on a plot/site-specific scale.

Author Contributions

Conceptualization, E.M., S.G.-H., O.H. and W.D.B.; methodology, E.M., S.G.-H., O.H. and W.D.B.; software, E.M. and W.D.B.; validation, E.M.; formal analysis, E.M.; investigation, E.M.; resources, S.G.-H.; data curation, E.M.; writing—original draft preparation, E.M.; writing—review and editing, E.M., S.G.-H., O.H. and W.D.B.; visualization, E.M., S.G.-H., O.H. and W.D.B.; supervision, S.G.-H., O.H. and W.D.B.; project administration, S.G.-H.; funding acquisition, S.G.-H. All authors have read and agreed to the published version of the manuscript.

Funding

The project was supported by funds of the Federal Ministry of Food and Agriculture (BMEL) based on a decision of the Parliament of the Federal Republic of Germany via the Federal Office for Agriculture and Food (BLE) under the innovation support program (GZ 313-06.01-28-1-57.054-15), and by the National Institute of Food and Agriculture, U.S. Department of Agriculture, Hatch project (ALA014-1-16016).

Conflicts of Interest

The authors declare no conflict of interest.

References

  1. Eurostat, Agricultural Production—Crops. Available online: https://ec.europa.eu/eurostat/statistics-explained/index.php/Agricultural_production_-_crops#cite_note-3 (accessed on 5 October 2020).
  2. Wolf, P.F.J.; Verreet, J.A. An integrated pest management system in Germany for the control of fungal leaf diseases in sugar beet. The IPM sugar beet model. Plant Dis. 2002, 86, 336–344. [Google Scholar] [CrossRef] [PubMed] [Green Version]
  3. Shane, W.; Teng, P. Impact of Cercospora leaf spot on root weight, sugar yield, and purity of Beta vulgaris. Plant Dis. 1992, 76, 812–820. [Google Scholar] [CrossRef]
  4. Jones, J.W.; Hoogenboom, G.; Porter, C.; Boote, K.J.; Batchelor, W.D.; Hunt, L.A.; Wilkens, P.; Singh, U.; Gijsman, A.; Ritchie, J.T. DSSAT cropping system model. Eur. J. Agron. 2003, 18, 235–265. [Google Scholar] [CrossRef]
  5. Olesen, J.E.; Trnka, M.; Kersebaum, K.C.; Skjelvåg, A.O.; Seguin, B.; Peltonen-Sainio, P.; Rossi, F.; Kozyra, J.; Micale, F. Impacts and adaptation of European crop production systems to climate change. Eur. J. Agron. 2011, 34, 96–112. [Google Scholar] [CrossRef]
  6. Röll, G.; Batchelor, W.D.; Castro, A.C.; Simón, M.R.; Graeff-Hönninger, S. Development and Evaluation of a Leaf Disease Damage Extension in Cropsim-CERES Wheat. Agronomy 2019, 9, 120. [Google Scholar] [CrossRef] [Green Version]
  7. Batchelor, W.D.; Suresh, L.M.; Zhen, X.; Beyene, Y.; Wilson, M.; Kruseman, G.; Prasanna, B. Simulation of Maize Lethal Necrosis (MLN) Damage Using the CERES-Maize Model. Agronomy 2020, 10, 710. [Google Scholar] [CrossRef]
  8. Bourgeois, G. Interrelationships between Late Leafspot Disease and Florunner Peanut: A Modelling Approach. Ph.D. Thesis, University of Florida, Gainesville, FL, USA, 1989. [Google Scholar]
  9. Boote, K.J.; Jones, J.W.; Mishoe, J.W.; Wilkerson, G.G. Modelling growth and yield of groundnut. In Agrometeorology of Groundnut Proceedings of the International Symposium, ICRISAT Sahelian Centre, Niamey, Niger, 21–26 August 1985; Sivakumar, M.V.K., Virmani, S.M., Eds.; ICRISAT: Patancheru, India, 1986; pp. 243–254. [Google Scholar]
  10. Nokes, S.E.; Young, J.H. Simulation of the temporal spread of leafspot and the effect on peanut growth. Trans. ASAE 1991, 34, 653–662. [Google Scholar] [CrossRef]
  11. Batchelor, W.D.; Jones, J.W.; Boote, K.J.; Pinnschmidt, H.O. Extending the use of crop models to study pest damage. Trans. ASAE 1993, 36, 551–558. [Google Scholar] [CrossRef]
  12. Leviel, B. Evaluation of Risks and Monitoring of Nitrogen Fluxes at the Crop Level on the Romanian and Bulgarian Plain. Application to Maize, Wheat, Rapeseed and Sugar-Beet. Ph.D. Thesis, Institut National Polytechnique de Toulouse, Toulouse, France, 2000. [Google Scholar]
  13. Leviel, B.; Crivineanu, C.; Gabrielle, B. CERES-Beet, a model for the production and environmental impact of sugar beet. In Proceedings of the Joint Colloquium on Sugar Beet Growing and Modelling, Lille, France, 12 September 2003; pp. 143–152. [Google Scholar]
  14. Anar, M.J.; Lin, Z.; Teboh, J.; Ostlie, M. Modeling energy beets using the Decision Support System for Agrotechnology Transfer. Trans. ASABE 2015, RRV15-048. [Google Scholar] [CrossRef]
  15. Baey, C.; Didier, A.; Lemaire, S.; Maupas, F.; Cournède, P.H. Parameterization of five classical plant growth models applied to sugar beet and comparison of their predictive capacity on root yield and total biomass. Ecol. Modell. 2014, 290, 11–20. [Google Scholar] [CrossRef] [Green Version]
  16. Hoogenboom, G.; Porter, C.H.; Boote, K.J.; Shelia, V.; Wilkens, P.W.; Singh, U.; White, J.W.; Asseng, S.; Lizaso, J.I.; Moreno, L.P.; et al. The DSSAT crop modeling ecosystem. In Advances in Crop Modeling for a Sustainable Agriculture; Boote, K.J., Ed.; Burleigh Dodds Science Publishing: Cambridge, UK, 2019; pp. 173–216. [Google Scholar] [CrossRef]
  17. Hoogenboom, G.; Porter, C.H.; Shelia, V.; Boote, K.J.; Singh, U.; White, J.W.; Hunt, L.A.; Ogoshi, R.; Lizaso, J.I.; Koo, J.; et al. Decision Support System for Agrotechnology Transfer (DSSAT) Version 4.7 (www.DSSAT.net); DSSAT Foundation: Gainesville, FL, USA, 2019. [Google Scholar]
  18. Anar, M.J.; Lin, Z.; Hoogenboom, G.; Shelia, V.; Batchelor, W.D.; Teboh, J.M.; Ostlie, M.; Schatz, B.G.; Khan, M. Modeling Growth, Development and Yield of Sugarbeet using DSSAT. Agric. Syst. 2019, 169, 58–70. [Google Scholar] [CrossRef]
  19. Jones, C.A.; Kiniry, J.R. CERES-Maize: A Simulation Model of Maize Growth and Development; Texas A&M University Press: College Station, TX, USA, 1986; p. 194. [Google Scholar]
  20. López-Cedrón, X.F.; Boote, J.K.; Piñeiro, J.; Sau, F. Improving the CERES-Maize Model Ability to Simulate Water Deficit Impact on Maize Production and Yield Components. Agron. J. 2008, 100, 296–307. [Google Scholar] [CrossRef]
  21. Memic, E.; Graeff, S.; Batchelor, W. Extending the CERES-Beet model to simulate leaf disease in sugar beet. In Precision Agriculture ’19 Proceedings of the European Conference on Precision Agriculture, Montpellier, France, 8 July 2019; John, V.S., Ed.; Wageningen Academic Publishers: Wageningen, The Netherlands, 2019. [Google Scholar] [CrossRef]
  22. World Reference Base for Soil Resources. World Soil Resources Reports No. 103; FAO: Rome, Italy, 2006. [Google Scholar]
  23. ICUMSA: Methods Book. Method GS6-3: The determination of the polarisation of sugar beet by the macerator or cold aqueous digestion method using aluminium sulphate as clarifying agent-official. In Internation-al Commission for Uniform Methods of Sugar Analysis; Elsevier: Berlin, Germany, 2003. [Google Scholar]
  24. Jones, F.G.W.; Dunning, R.A.; Hamphries, K.P. The effect of defoliation and loss of stand upon yield of sugar beets. Ann. Appl. Biol. 1955, 43, 63–70. [Google Scholar] [CrossRef]
  25. Yang, M.; Yang, J.Y.; Liu, S.; Hoogenboom, G. An evaluation of the statistical methods for testing the performance of crop models with observed data. Agric. Syst. 2014, 127, 81–89. [Google Scholar] [CrossRef]
  26. Rossi, V.; Battilani, P. CERCOPRI: A forecasting model for primary infections of Cercospora leaf spot of sugar beet. Bull. OEPP 1991, 21, 527–531. [Google Scholar] [CrossRef]
  27. Rossberg, D.; Racca, P.; Joerg, E.; Kleinhenz, B. Erste Erfahrung mit dem Modell CERCBET 1 (First application of CERCBEET 1 model). Nachr Dtsch Pflanzenschutzd 2000, 52, 153–159. [Google Scholar]
  28. Racca, P.; Jörg, E.; Mittler, S.; Petersen, J. CERCBET 3—A forecaster for epidemic development of Cercospora beticola. In Proceedings of the 67th IIRB Congress, Brüssel, Belgium, 11–12 February 2004. [Google Scholar]
  29. Windels, C.E.; Lamey, H.A.; Hilde, D.; Widner, J.; Knudsen, T.A. Cercospora leaf spot model for sugar beet: In practice by an industry. Plant Dis. 1998, 82, 716–726. [Google Scholar] [CrossRef] [PubMed] [Green Version]
  30. Mittler, S.; Petersen, J.; Jörg, E.; Racca, P. Integrierte Bekämpfung von Blattkrankheiten bei Zuckerrüben (Integrated treatment of leaf disease in sugar beet). In Proceedings of the 67th IIRB Congress, Brüssel, Belgium, 11–12 February 2004. [Google Scholar]
  31. Bock, C.H.; Barbedo, J.G.A.; Del Ponte, E.M.; Chiang, K.S.; Bohnenkamp, D.; Mahlein, A.K. From visual estimates to fully automated sensor-based measurements of plant disease severity: Status and challenges for improving accuracy. Phytopathol. Res. 2020, 2. [Google Scholar] [CrossRef] [Green Version]
  32. Leucker, M.; Wahabzada, M.; Kersting, K.; Peter, M.; Beyer, W.; Steiner, U.; Mahlein, A.K.; Oerke, E.C. Hyperspectral imaging reveals the effect of sugar beet quantitative trait loci on Cercospora leaf spot resistance. Funct. Plant Biol. 2017, 44, 1–9. [Google Scholar] [CrossRef] [PubMed]
Figure 1. Daily minimum temperatures (Min Temp) (°C) observed at the weather station near to the sugar beet field experiment (2016–2018).
Agronomy 10 01930 g001
Figure 2. Cumulative rain (mm) observed at the weather station near to the sugar beet field experiment (2016–2018).
Agronomy 10 01930 g002
Figure 3. Crop model inputs: experimental file, soil characterisation file, genotype file and daily weather observations in the model with pest modular structure and vegetation damage coupling point.
Agronomy 10 01930 g003
Figure 4. Simulated and observed values (2016: 100% fungicide) with Cercospora leaf spot ratings included in the simulation results: (a) leaf area index (LAI); (b) top weight (DM t ha−1) for the calibration treatment with sugar beet growth simulated with current genetics and without Cercospora leaf spot disease ratings being included in the simulation process as “no dis” treatment.
Agronomy 10 01930 g004
Figure 5. Simulated and observed values (2016: 100% fungicide) with Cercospora leaf spot ratings included in the simulation results: storage root weight (DM t ha−1) for the calibration treatment with sugar beet growth simulated with current genetics and without Cercospora leaf spot disease ratings being included in the simulation process as “no dis” treatment.
Agronomy 10 01930 g005
Figure 6. Simulated and observed values with Cercospora leaf spot ratings included in the simulation results: (y0 axis) top weight; (y1 axis) storage root weight and observed Cercospora leaf spot disease ratings on specific dates, and sugar beet growth simulated with current genetics without disease ratings being included in the simulation process as “no dis” treatment (100% fungicide in 2016) of top and storage root weight.
Agronomy 10 01930 g006
Figure 7. Simulated and observed values (2016) with Cercospora leaf spot ratings included in the simulation results: (a) LAI; (b) top weight (DM t ha−1) for the evaluation treatments with sugar beet growth simulated with current genetics and without Cercospora leaf spot disease ratings being included in the simulation process as “no dis” treatment.
Agronomy 10 01930 g007
Figure 8. Simulated and observed values (2016): storage root weight (DM t ha−1) for the evaluation treatments with (0% fungicide, 50% fungicide) and without (‘no dis”) Cercospora leaf spot ratings included in the simulation.
Agronomy 10 01930 g008
Figure 9. Simulated and observed values (2017): (a) LAI; (b) top weight (DM t ha−1) for the evaluation treatment with (0% inoculum, 100% inoculum) and without (“no dis”) simulated Cercospora leaf spot disease damage included in the simulation.
Agronomy 10 01930 g009
Figure 10. Simulated and observed values (2017): storage root weight (DM t ha−1) for the evaluation treatment with (0% inoculum, 100% inoculum) and without (“no dis”) simulated Cercospora leaf spot disease damage ratings included in the simulation.
Agronomy 10 01930 g010
Figure 11. Simulated and observed values with Cercospora leaf spot ratings included in simulation results: (a) LAI; (b) top weight (DM t ha−1) for the evaluation treatment with sugar beet growth simulated with current genetics and without Cercospora leaf spot disease ratings being included in the simulation process as “no dis” treatment.
Agronomy 10 01930 g011
Figure 12. Simulated and observed values with Cercospora leaf spot ratings included in simulation results: storage root weight (DM t ha−1) for the evaluation treatment with sugar beet growth simulated with current genetics and without Cercospora leaf spot disease ratings being included in the simulation process as “no dis” treatment.
Agronomy 10 01930 g012
Table 1. Observed Cercospora leaf spot, as leaf area disease progress (%), on indicated days after planting (DAP) for three different fungicide treatments: 0%, 50% and 100% in which 0, 0.5, and 1 L ha−1 of Spyrale fungicide was applied, respectively, and 0% and 100% inoculum treatments in which 0 and 1 g m−2 of inoculum was applied, respectively.
YearDAPCercospora Leaf Spot Leaf Area Disease Progress (%)
2016 0% fungicide50% fungicide100% fungicide
63000
83331
103132020
125222124
138472522
152483333
177483333
2017 0% inoculum100% inoculum
10600
1271846
1405674
16992100
18492100
2018 0% inoculum100% inoculum
10600
11917
1264652
1334957
1477579
154100100
169100100
Table 2. Information and format of the pest definition file for the CSM-CERES-Beet (Cropping System Model-Crop Environment Resource Synthesis-Beet) model, used for defining coupling point and damage method in the crop model programming code (BSCER047.PST).
No.PID 1Method NameDM 2CP 3Coeff. 4
1PCLA 5Observed % defoliation3LAD2.0
1 PID—leaf disease damage identifier. 2 DM—damage characterisation method: 1–4 (3—daily percent damage rates). 3 CP—coupling point identifier in the model. 4 Coeff.—damage application rates. 5 PCLA—percent cumulative leaf area.
Table 3. Sugar beet cultivar specific genetic coefficients for CSM-CERES-Beet model (BTS940).
DefinitionUnitsBTS940
P1Growing Degree Days from the seedling emergence to the end of juvenile phase (juvenile group of leaves, depending on the cultivar up to 15–20 leaves)°C-d760.0
P2Photo period sensitivityhr−10.0
P5Thermal time from leaf growth to physiological maturity°C-d700.0
G2Leaf expansion rate during leaf growth stagecm2 cm−2 d−1420.0
G3Maximum root growth rategm−2 d−127.5
PHINTPhyllochron interval, the interval in thermal time between successive leaf tip appearances°C-d43.0
Table 4. Detailed statistics for simulated and observed values of LAI (m2 m−2), top weight (DM) kg ha−1, and storage root weight (DM) kg ha−1 for the calibration treatment (100% fungicide in 2016).
YearVariableTreatmentR2RMSEd Stat.Total Obs. 1
2016LAI100% fungicide0.870.520.9514
Top weight100% fungicide0.826860.947
Storage root100% fungicide0.9516960.999
1 Total Obs.—number of in-season observations used.
Table 5. Detailed statistics for simulated and observed values of LAI (m2 m−2), top weight (DM) kg ha−1 and storage root weight (DM) kg ha−1 for the evaluation treatments 0% and 50% fungicide in 2016.
YearVariableTreatmentR2RMSE (kg ha−1)d Stat.Total Obs. 1
2016LAI0% fungicide0.850.630.9214
LAI50% fungicide0.800.630.9114
Top weight0% fungicide0.855650.957
Top weight50% fungicide0.747510.927
Storage root0% fungicide0.9422700.979
Storage root50% fungicide0.9423620.979
1 Total Obs.—number of in-season observations used.
Table 6. Detailed statistics for simulated and observed values of LAI (m2 m−2), top weight (DM) kg ha−1, and storage root weight (DM) kg ha−1 for the evaluation treatments 0% and 100% inoculum in 2017.
YearVariableTreatmentR2RMSE
(kg ha−1)
d Stat.Total Obs. 1
2017LAI0% inoculum0.540.850.638
LAI100% inoculum0.810.720.838
Top weight0% inoculum0.807470.744
Top weight100% inoculum0.964020.964
Storage root0% inoculum0.9323990.984
Storage root100% inoculum0.8731240.964
1 Total Obs.—number of in-season observations used
Table 7. Detailed statistics for simulated and observed values of LAI (m2 m−2), top weight (DM) kg ha−1, and storage root weight (DM) kg ha−1 for the evaluation treatments 0% and 100% inoculum in 2018.
YearVariableTreatmentR2RMSE (kg ha−1)d Stat.Total Obs. 1
2018LAI0% inoculum0.760.570.879
LAI100% inoculum0.700.640.849
Top weight0% inoculum0.928120.786
Top weight100% inoculum0.819530.716
Storage root0% inoculum0.9730450.946
Storage root100% inoculum0.9934860.936
1 Total Obs.—number of in-season observations used.
Table 8. Observed storage root weight (SRW) (DM) kg ha−1, sugar yield (SY) kg ha−1 and sugar content as (%) of (DM) (Sc (%)) for three different fungicide treatments: 0%, 50% and 100% in which 0, 0.5, and 1 L ha−1 of Spyrale fungicide was applied, respectively, and 0% and 100% inoculum treatments in which 0 and 1 g m−2 of inoculum was applied, respectively.
DAYSRW
kg ha−1
SY
kg ha−1
Sc
(%)
SRW
kg ha−1
SY
kg ha−1
Sc
(%)
SRW
kg ha−1
SY
kg ha−1
Sc
(%)
2016 0% fungicide50% fungicide100% fungicide
13815,24110,1716716,15310,6256618,31912,43868
15216,76811,3436815,00599066618,09112,36668
16018,02412,0726718,18012,2316722,18414,91167
Avg. 67 66 68
2017 0% inoculum100% inoculum
11411,82082337010,461710968
14016,53810,9706619,27013,38469
16927,95620,1667227,91519,94471
Avg. 69 69
2018 0% inoculum100% inoculum
11917,11511,8396915,73610,93770
14717,74812,8427221,11113,94166
16121,30814,8907021,46215,53372
Avg. 70 69
Table 9. Simulated storage root (DM) kg ha−1: disease free storage root (“no dis”—Cercospora leaf spot disease ratings not included in the model input files), storage root simulated quantity with Cercospora leaf spot disease ratings included in the model input files (“dis”) and storage root weight (SRW) losses.
Simulated Storage Root (DM) (kg ha−1)
DAY‘No Dis’‘Dis’SRW Loss‘Dis’SRW Loss‘Dis’SRW Loss
2016 0% fungicide50% fungicide100% fungicide
63478478047804780
83373837281037281037353
103886787769187411268759108
12515,56515,26929615,20236315,207358
13817,98317,63634717,64533817,655328
15220,80220,22158120,29151120,307495
17722,50621,232127421,424108221,4401066
2017 0% inoculum100% inoculum
10627422742027420
127979297875977913
14012,57712,5294812,456121
16921,10820,48162720,145963
18428,51826,068245025,4893029
2018 0% inoculum100% inoculum
10610,97110,971010,9710
11912,65412,651312,63222
12613,17113,0828913,047124
13314,41814,18723114,133285
14716,50615,93956715,841665
15416,50615,93956715,841665
16916,50615,93956715,841665
Table 10. Simulated storage root weight (DM) losses (SRW) (kg ha−1) and corresponding sugar yield losses (SY) (kg ha−1) at harvest as days after planting (DAY).
YearDAYTreatmentsSRW Loss (DM)
(kg ha−1)
SY Loss
(kg ha−1)
20161770% fungicide1274866
50% fungicide1082735
100% fungicide1066725
20171840% inoculum24501666
100% inoculum30292060
20181690% inoculum567386
100% inoculum665452
Publisher’s Note: MDPI stays neutral with regard to jurisdictional claims in published maps and institutional affiliations.

