Article

Study on Anti-Friction Mechanism of Canna-Leaf Biomimetic Micro-Textured Fruit Tree

1
College of Engineering, South China Agricultural University, Guangzhou 510642, China
2
School of Materials, The University of Manchester, Manchester M139PL, UK
*
Author to whom correspondence should be addressed.
Agronomy 2020, 10(12), 1866; https://doi.org/10.3390/agronomy10121866
Submission received: 13 October 2020 / Revised: 19 November 2020 / Accepted: 23 November 2020 / Published: 26 November 2020

Abstract

:
Fruit tree pruning is an important part of orchard management. In this paper, the force on and the wear of the pruner in the pruning process were studied with a canna-leaf biomimetic convex-hull pruner. The pruner was formed by laser etching technology. The influence of laser power and scanning speed on the geometric dimensioning of the micro texture was analyzed. The shear force calculation model was built to obtain the positive pressure load during the pruning process, while the model accuracy was verified in the static pressure shear test, and the wear mechanism was analyzed in the wear test. The real pruning process was simulated to compare the worn areas of the textured and non-textured pruners and the number of cuts in fixed wear condition, for proving the wear reduction characteristics of the micro-textured pruner. The results show that: the optimal forming parameters are 70 W 1.6 mm/s (10 mm-diameter branches), 80 W 2.4 mm/s (15 mm-diameter branches) and 80 W 1.6 mm/s (20 mm-diameter branches), and the convex hull spacing is 300 μm. Laser power affects the depth and width of the texture, while scanning speed affects the depth of the texture. The positive pressure on the pruner is proportional to the modulus of elasticity, moment of inertia, cut depth, and bevel angle, whilst it is inversely proportional to the distance from the fixed point of the blade to the positive pressure. The wear test shows that the anti-wear performance of the textured pruner is not obvious at the load of 300 g, while the anti-wear performance of the textured pruner is significant at the loads of 1000 g and 2000 g. The wear mechanism shifts from the abrasive wear in the early stage to more complex oxidative wear and adhesive wear. The actual shear test shows that the textured pruner wears less than the non-textured pruner and enters the stable shear faster.

1. Introduction

China is a big country that grows fruits. As of 2018, China’s fruit yield (excluding melons) ranks No.1 in the world [1]. Fruit tree pruning is an important process in orchard management, which can effectively enhance the nutrient distribution of fruit trees and improve fruit quality and yield through reasonable pruning during the fruiting period [2]. The traditional orchard pruning machinery is mainly unpowered manual tools [3,4], which is associated with large labor intensity, low efficiency, high labor cost and heavy burden on the fruit farmers; meanwhile, the manual pruning can easily cause the branch epidermal to rupture with poor incision that heals slowly and is susceptible to pests and diseases, seriously affecting fruit quality and yield [5]. At present, developing countries mainly use electric pruning shears [6] to achieve orchard pruning mechanization, but as litchi and longan trees are branch wood with high hardness that requires high strength to shear fibers [7,8]. In a high-intensity intensive working environment, given that the electric pruning shear head is squeezed and worn by the fibers and branches, the blades are often turned or chipped, which reduces the service life of the pruner and limits the pruning efficiency, hurting the application and promotion of orchard electric pruners [9,10,11].
Etsion [12] studied the surface texture of the pruner formed with laser technology. The results show that: due to the local cavitation of the pruner surface, the bearing capacity of the pruner is increased with improved entrainment and retention of the lubricant, whilst the foreign matter or wear debris is stored in the cavitation area to reduce the further damage to the surface. Gachot C [13] and Shaofeng, Wu [14] and others found that the regular textured surface can effectively improve the wear performance of the material. Wu, Ze [15] studied the friction and wear properties of a titanium alloy surface with a lattice structure in the case of adding solid lubricants, and they found that reducing the distance between lattices and increasing the depth of the lattice can effectively improve the anti-friction and anti-wear performance of titanium alloys. Lattice distance and depth have over 90% effect on wear rate. Janssen, Andreas [16] studied the tribological properties of micro-textured steels with oil lubrication of 1–20 μm sand shale grains. The results show that the micro texture has 10–25% effect on friction performance when the ratio of the size in the sliding direction to the depth is 1:10. A number of experiments have shown that the geometry of the surface texture has a significant effect on the friction and wear properties [17,18,19]. Braun, D [20] of the Karlsruhe Institute of Technology in Germany studied the micro texture of uncoated cemented carbide pruners, and they found that the textured pruner processed by laser surface forming technology can increase the stability of the blade and improve the anti-wear performance of the pruner. Han Zhiwu et al. [21] used laser etching technology to form four kinds of bionic non-smooth surface morphology on the material, analyzed the metallographic structure of the textured surface, and studied the anti-wear performance. The results showed that a fine hard metallographic structure is formed on the surface of the material by laser treatment, which can further improve the anti-wear performance of the surface, and the laser-treated scale-shaped surface has the optimal anti-wear performance.
The above studies show that the micro texture formed by the laser can enhance the wear performance and improve the service life of the pruner, and at present they mainly focus on the modification of cutting tools made of metal materials [22,23,24,25,26,27], while no studies have yet been reported on the modification of the fruit tree pruner. In this paper, based on the existing fruit tree pruners on the market, laser etching technology was used to form the canna-leave biomimetic convex-hull micro texture on the main worn area of the pruner. The wear mechanism of the textured and common pruners is analyzed by the friction and wear test. The anti-friction characteristics of the biomimetic convex-bulk micro-textured pruner were verified by the actual shear test.

2. Experiment

2.1. Experimental Materials and Equipment

2.1.1. Pruner Materials and Processing Equipment

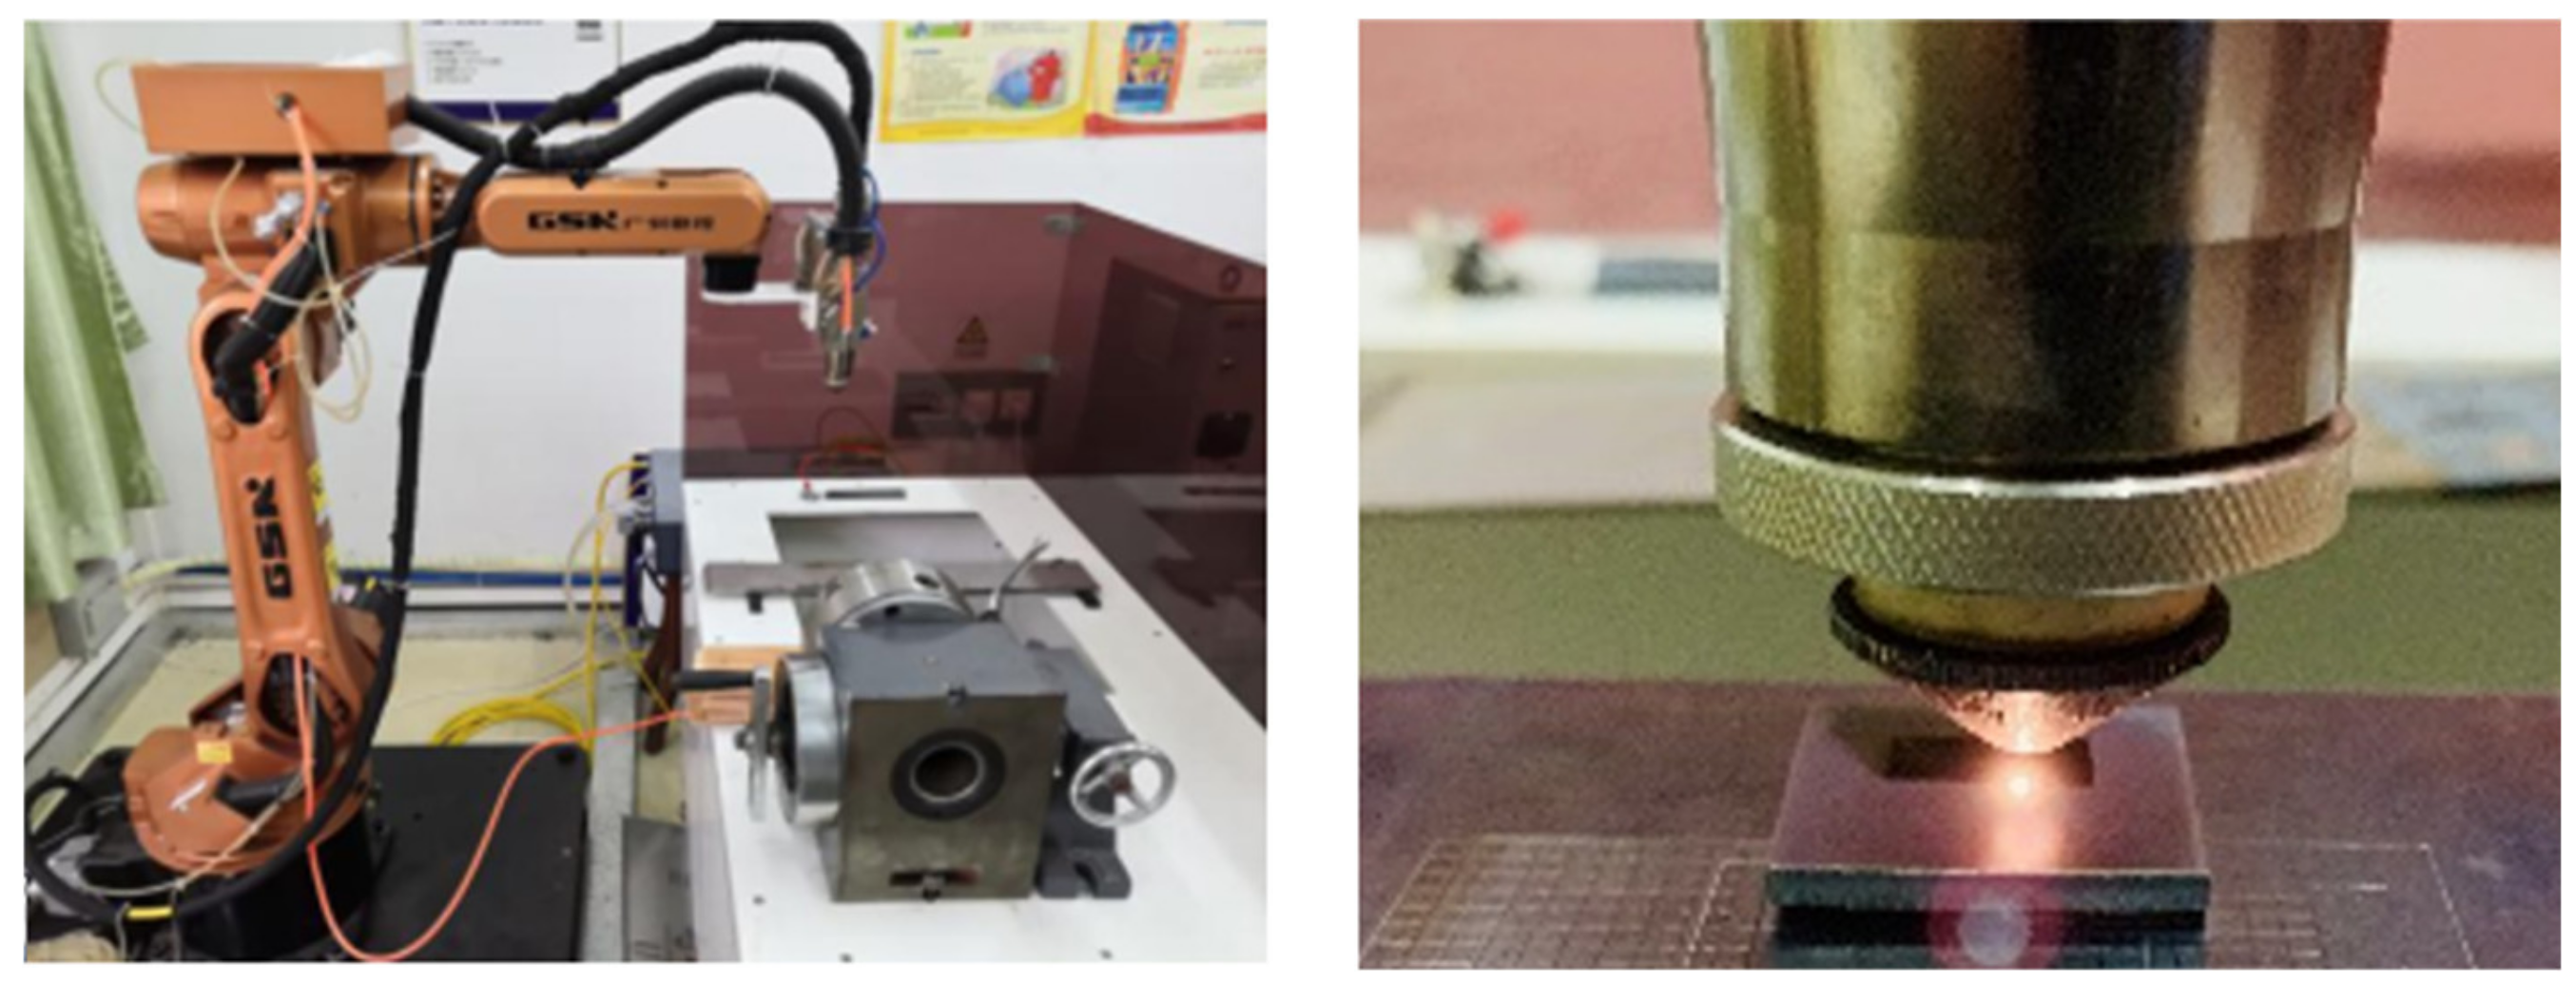
The cutting tool is SK-5 steel (high carbon steel), the tool size is 90 mm × 30 mm × 4 mm, the blade inclination angle is 20° to take into account the tool force and longer service life. The hardness of SK-5 was 79HRA and the surface roughness was Ra1.25. The morphology is shown in Figure 1, and the chemical composition is shown in Table 1. Figure 2 shows the selection of a GS301A industrial robot laser manufacturing workstation (Guangzhou Numerical Control Equipment co., LTD., Guangzhou, China) for convex hull cutter forming equipment. The laser processing parameters are shown in Table 2. The laser processing parameters are: laser power is 60 W, 65 W, 70 W, 75 W, 80 W, scanning speed is 1.6 mm/s, 2.4 mm/s, 3.2 mm/s, 4.0 mm/s, 4.8 mm/s, protective gas is argon.
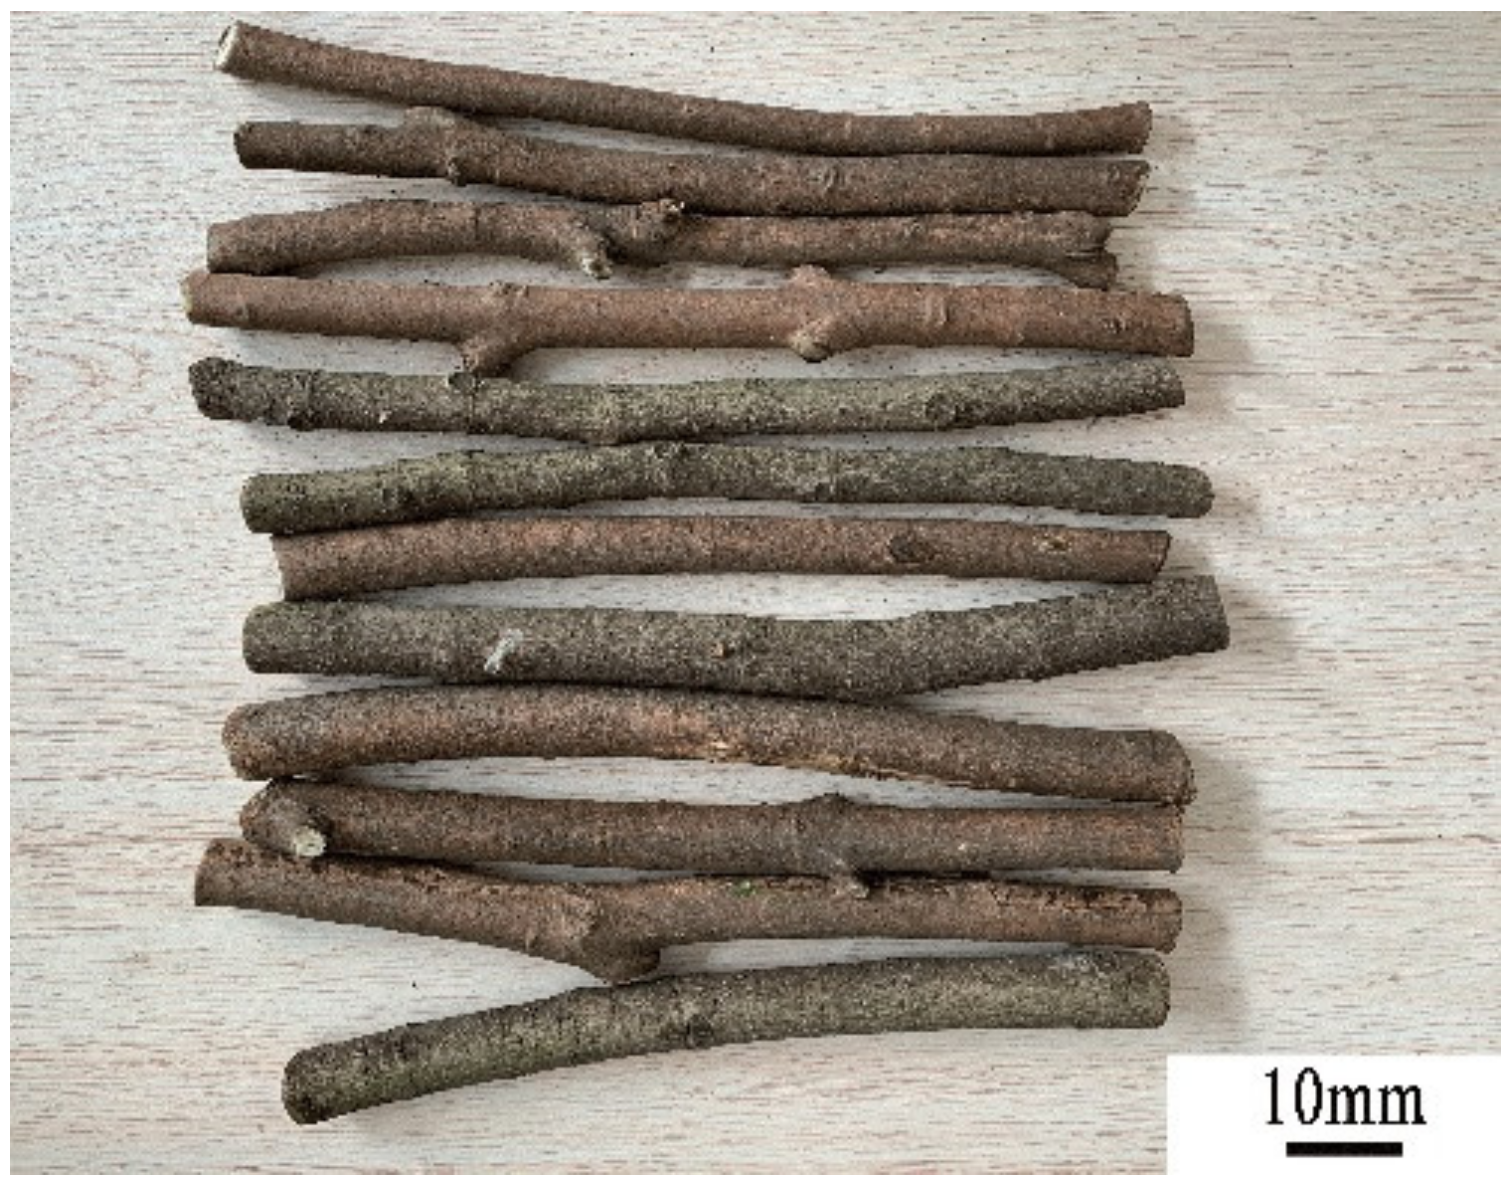
Longan branches that are often found in southern China were selected as twig samples, and the surface roughness of the branch was Ra10. The fruit varieties chosen for sampling were Shi Xia, the sampling time for the fruit tree pruning period was after fruit harvest, the branches were measured by the uniform diameter change of the less straight section. They were cut off from branch to branch, tailoring equidistant (240 mm) samples, as shown in Figure 3. Then they were put into the homemade electric shear to test the shear platform in the hole within 10 min after branch collection.

2.1.2. Friction and Wear Test Materials and Equipment

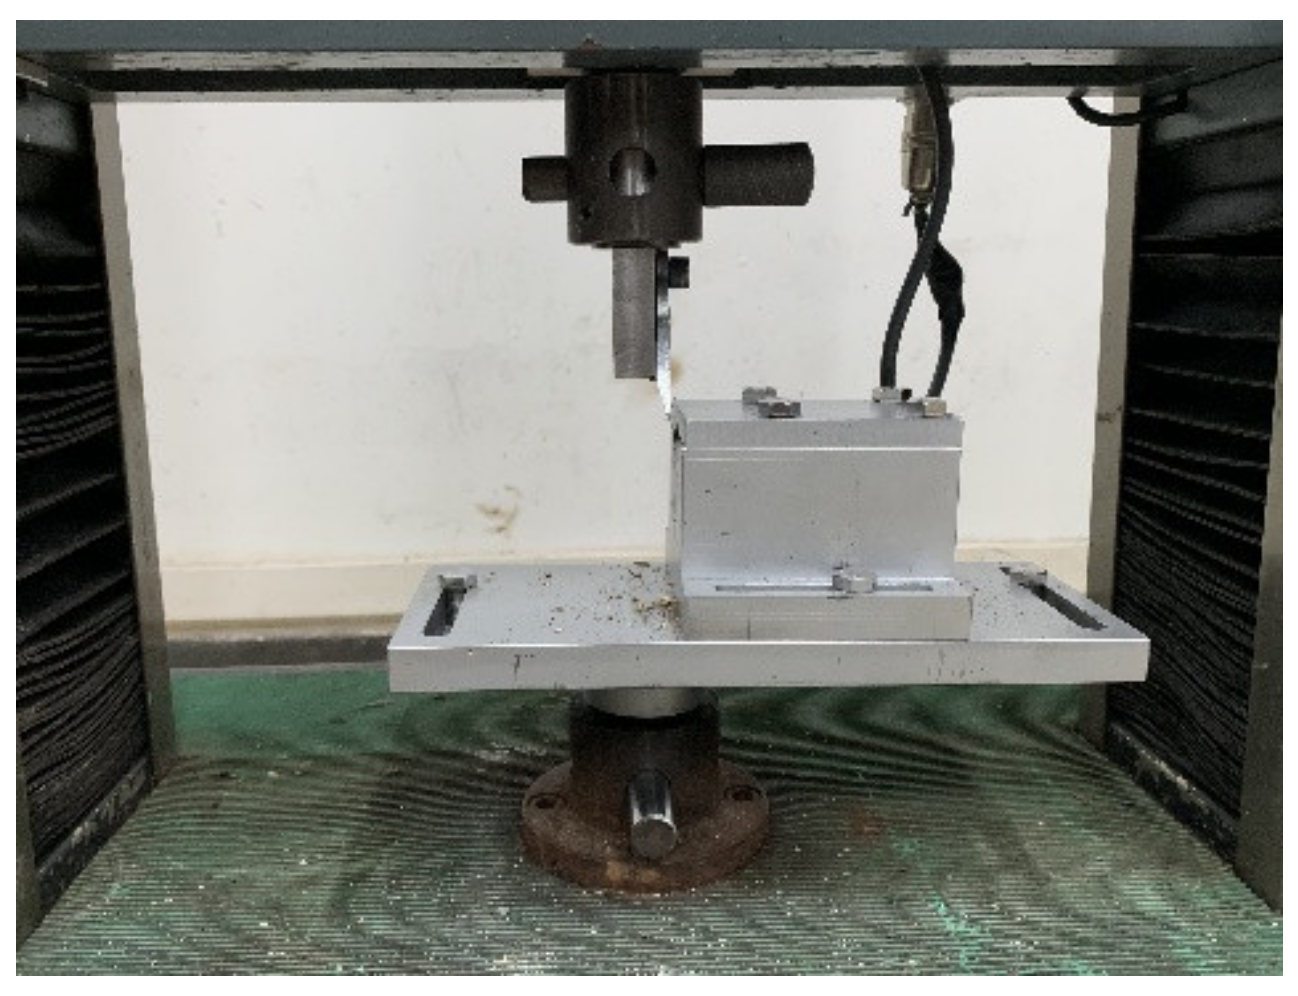
A WD-E compact micro-control electronic universal tester, as shown in Figure 4 (shear force sensor of 20 KN, test load speed of 250 mm/min, data sampling speed of 10/s), was used for a static pressure shear test of various diameter branches. In order to improve the accuracy of the data collected by the cutter when cutting branches, a branch fixture was made by ourselves based on 45# steel material, as shown in Figure 5. The shear force equation was established to obtain the positive pressure in shearing different branches, and then to derive the wear load. It can be known from [28] that to obtain wear data of the pruner, the hardness of the upper grinding sample should be higher than that of the lower grinding sample in the wear test. In actual practice, the electric pruner head is used to cut branches, and the hardness of wood is less than that of the tool. When wood is used as the upper grinding sample, the wood wears during the operation, and the friction coefficient is to characterize the wood. Therefore, a tungsten steel ball with hardness of 92HRA was used as the upper grinding sample (the parameters of YG6 are shown in Table 3), because its hardness is greater than that of the SK-5 steel pruner (79HRA), meeting the test requirements for the wear process.
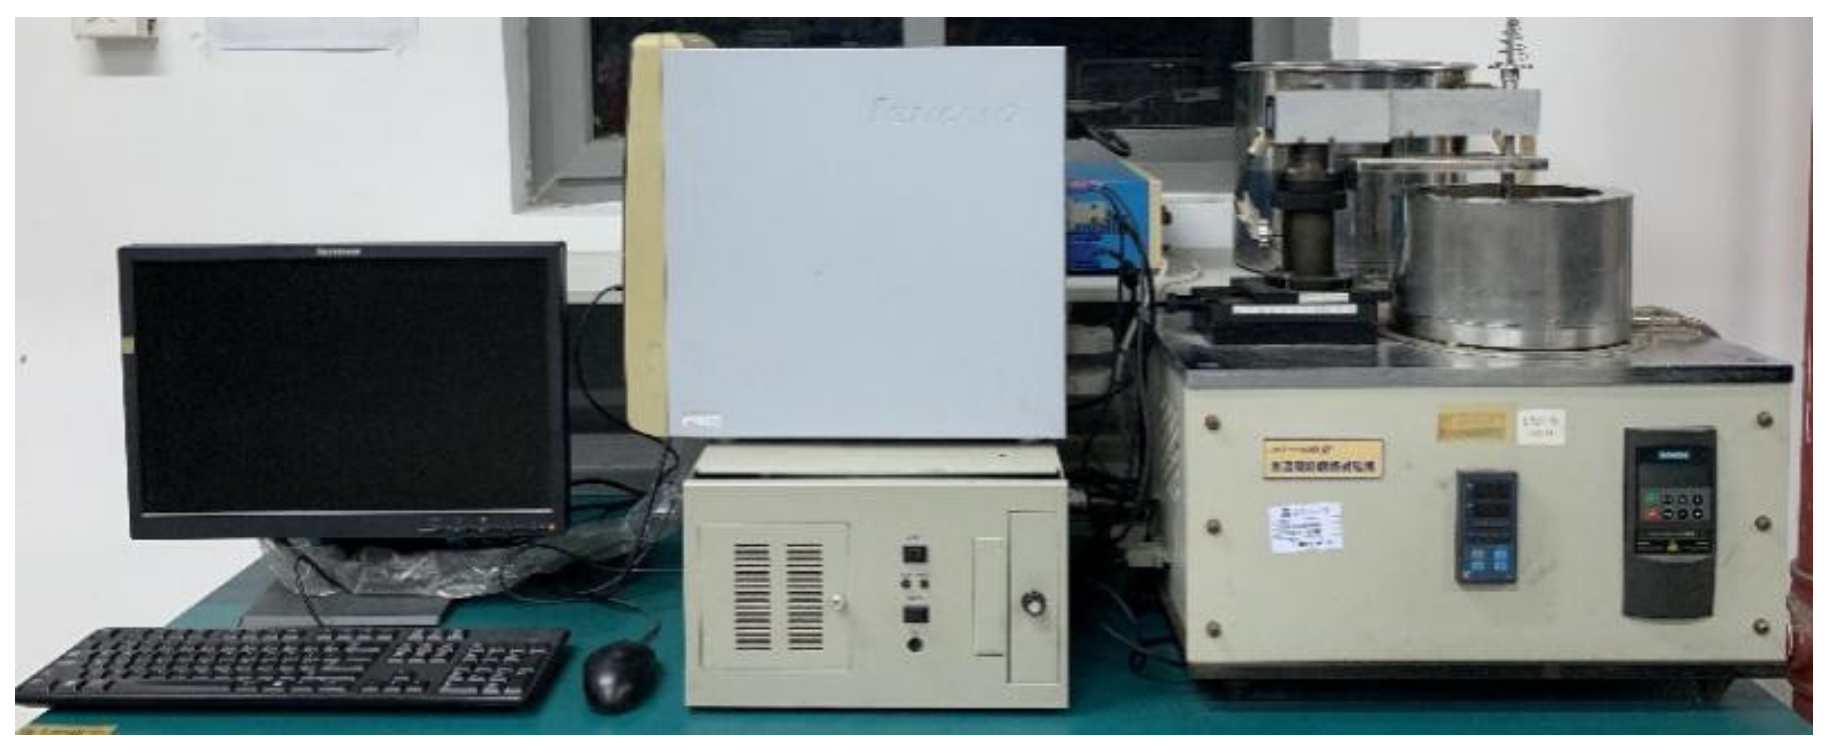
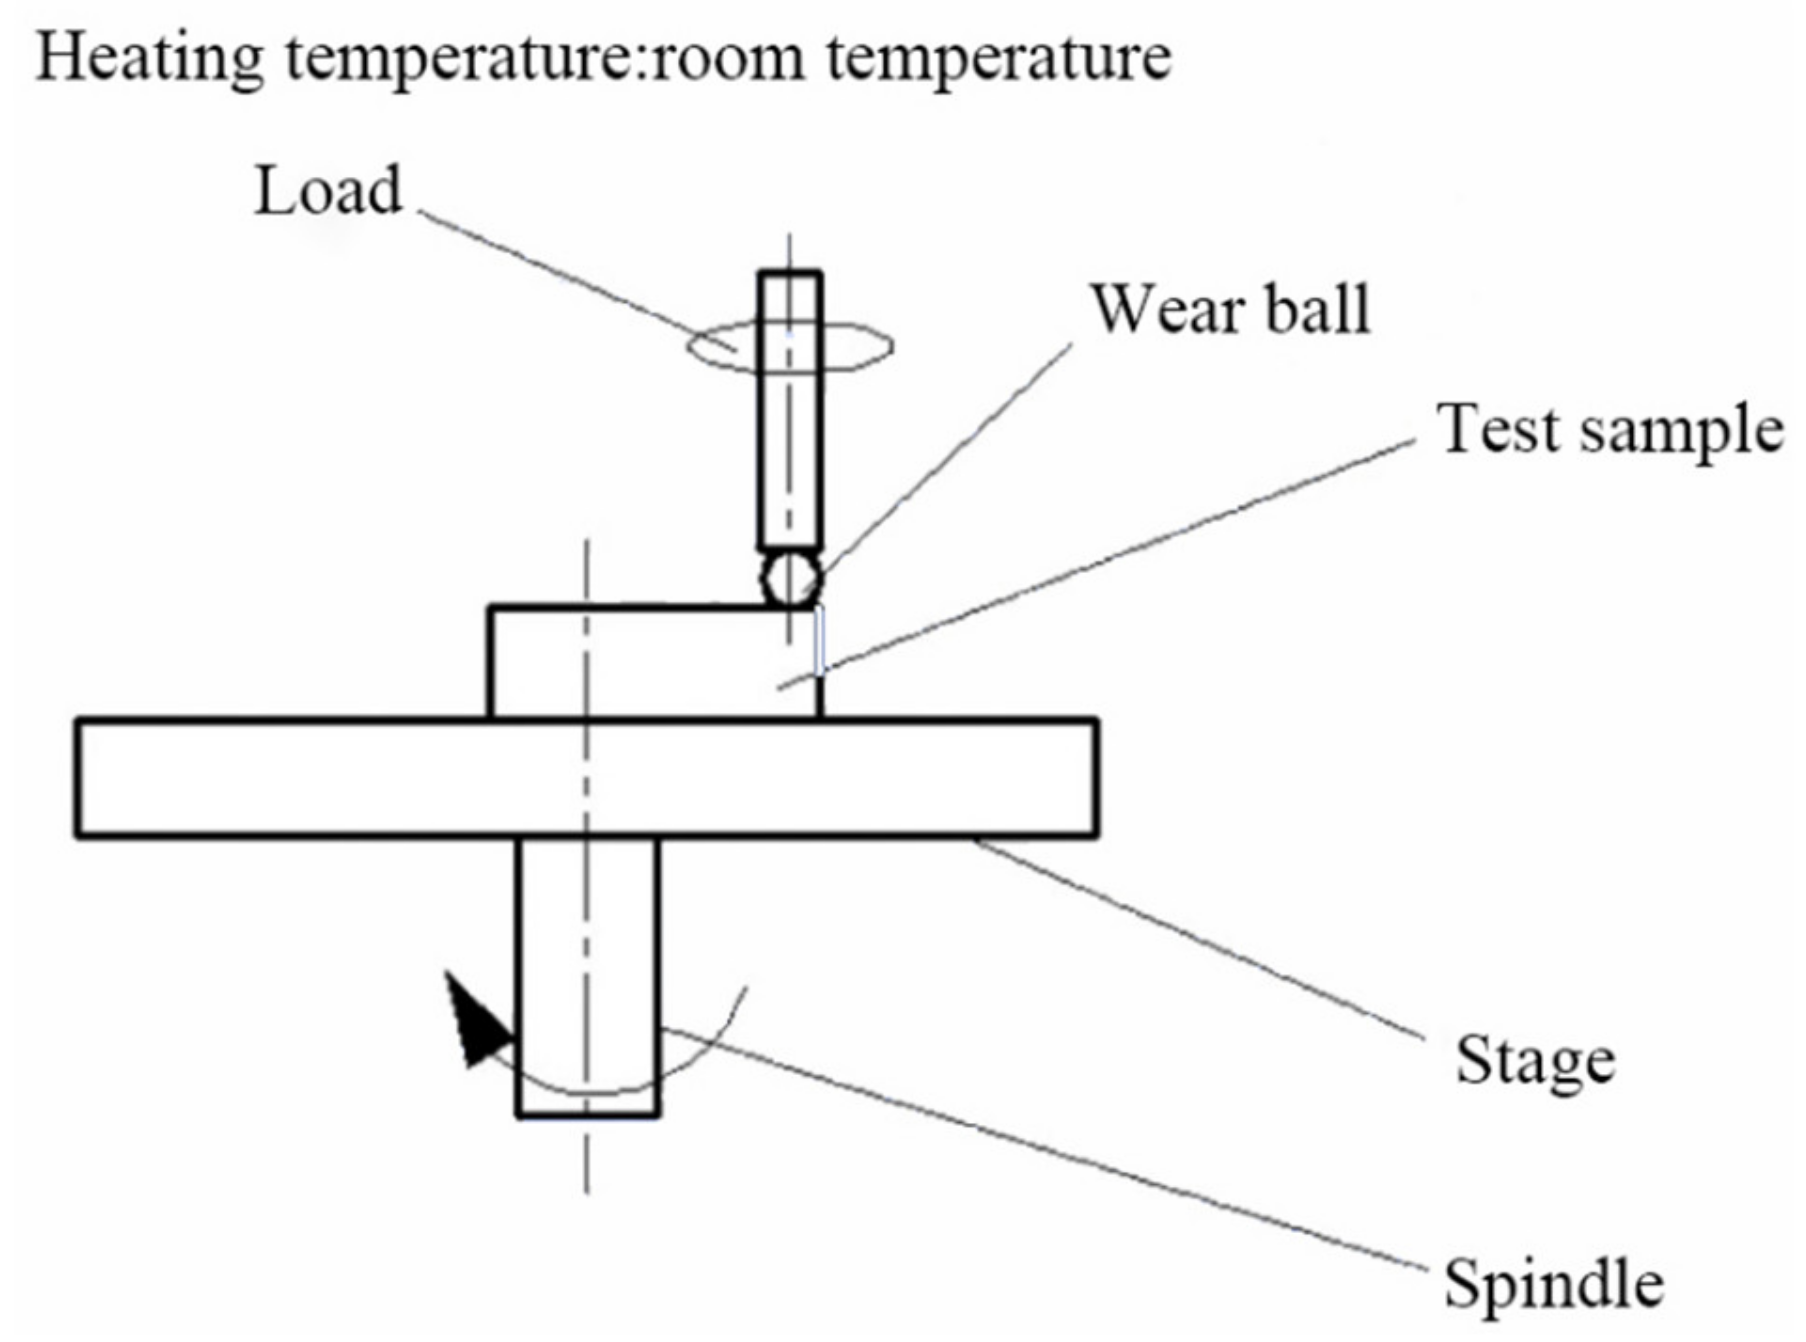
The HT-500 high temperature friction and wear tester (developed by the Lanzhou Institute of Chemical Physics, Chinese Academy of Sciences) is shown in Figure 6; a schematic diagram of friction and wear test is shown in Figure 7. According to test environment requirements, the high temperature furnace heated to the required temperature value within the sample temperature (room temperature environment without heating), by the loading mechanism and to test the required load, driven by the active motor sample rotation, with no rotation dual surface sliding friction (or bolt), calculated by the master program in a computer, intuitively shows the experimental temperature, load value, the change of the coefficient of friction values, and graphical display. The specific parameters of the wear testing machine are shown in Table 4.

2.1.3. Shear Test Materials and Equipment

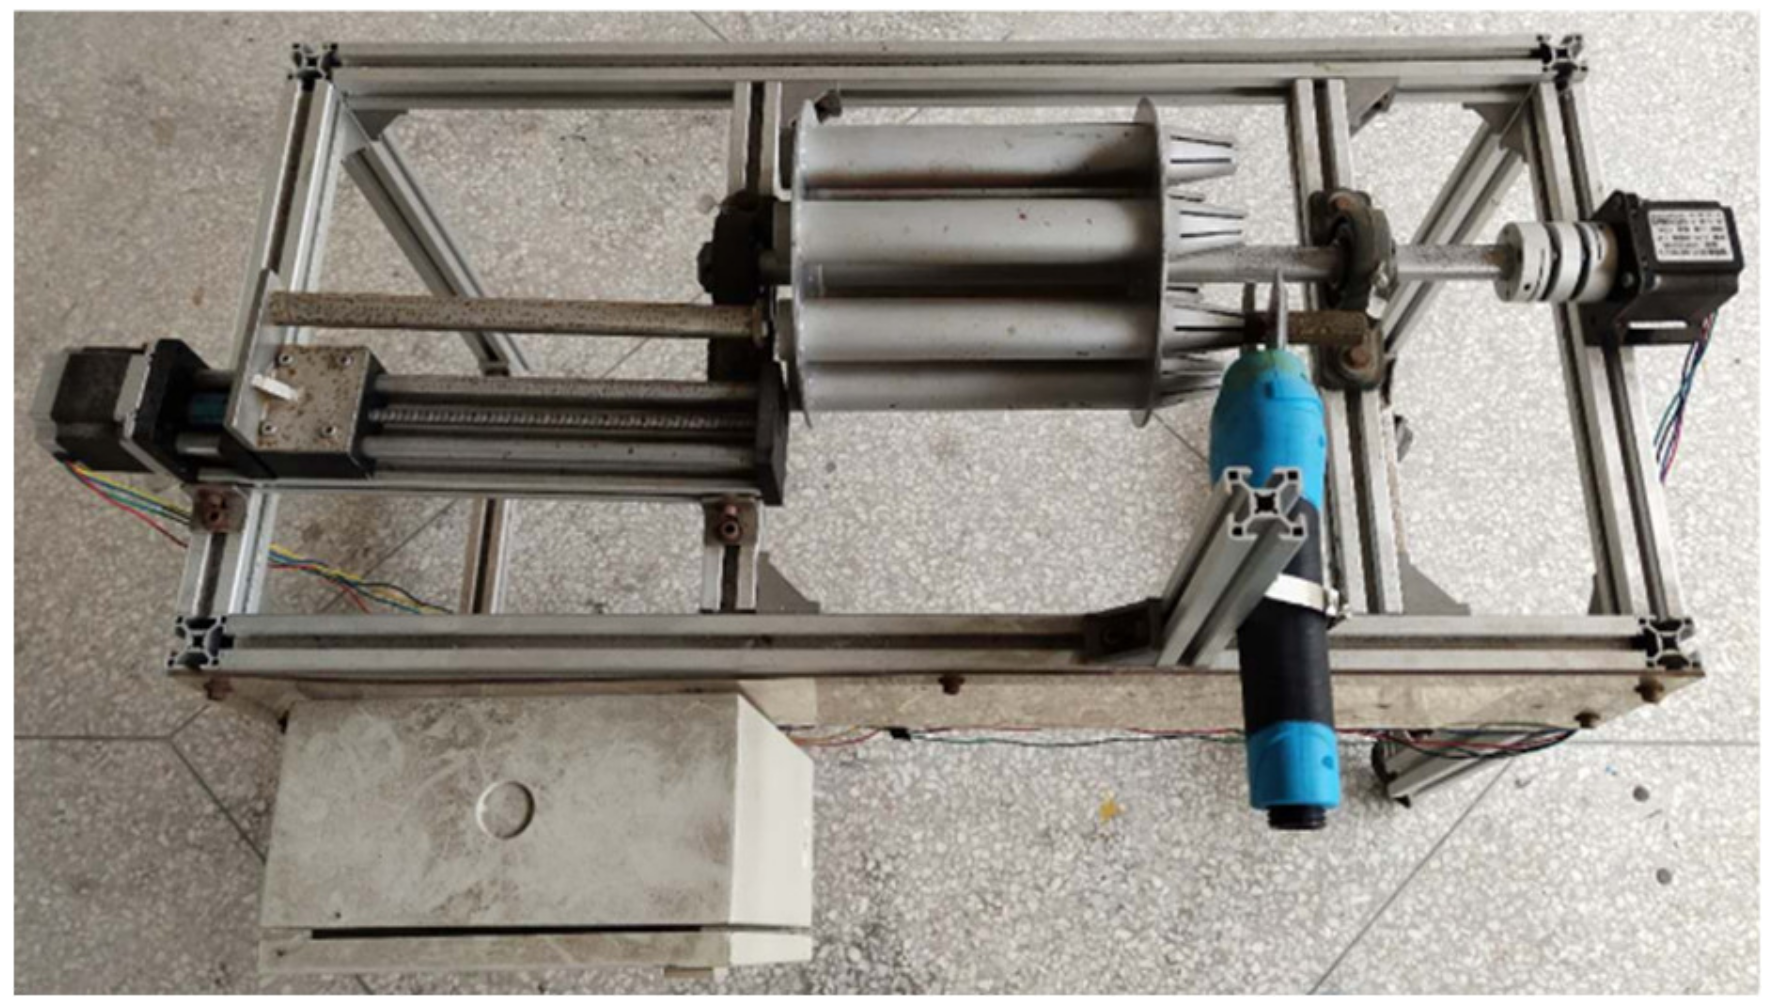
A SUCA3601 electric pruning machine was selected, the SUCA3601 electric pruning machine has a rated input power of 450 W, a maximum shear diameter of 30 mm, and can work continuously for up to 8 h when fully charged, which is 8–10 times the efficiency of traditional manual pruning. The electric shears were installed on the self-made electric shears platform (as shown in Figure 8) for real shear tests to verify the wear resistance characteristics of the bionic convex hull microstructure.

2.2. Verification Method

2.2.1. Forming of Biomimetic Convex-Hull Pruner

The canna-leaf texture (Figure 9a,b) proposed by Liu [29] has a convex-hull structure with spacing of 300 um. The bionic convex hull morphology is etched on the SK-5 cutting tool and the shape of the molding tool is shown in Figure 9c. The KQ-600DE numerically controlled ultrasonic cleaner was adopted to remove carbides and oxides on surface of the pruner by cleaning the tool in absolute ethanol for 20 min. An ultra-depth microscope (model: VHX-900F), laser confocal microscope (model: OLS4000) and SEM were used for observation and measurement. Each depth and spacing of the convex hull were measured three times and averaged.

2.2.2. Wear Test

To determine the loads in the wear test, the WD-E universal tester was used in the shear test. The 10/15/20 mm-diameter branches were fixed in the self-made fixture. The shearing interval of the moving knife and the fixed knife was set as 0.1 mm, and the blades moved downward vertically and uniformly to cut the branch, which was driven by the universal tension and compression tester, so as to obtain the maximum shear force, and then derive the maximum positive pressure on the main cutting surface.
The wear test was carried out by an HT-500 high temperature friction and wear testing machine. The main parameters in the wear test are as follows: the loading load is 300/1100/2000 g, each tool is worn for 60 min, the motor speed is 200 r/min, and it is carried out in a normal temperature environment. The specific friction and wear test parameters are shown in Table 5. The loading load of the wear test is a positive pressure load obtained by the static pressure shear test. After the wear test, the surface morphology of the sample was observed by three-dimensional morphometry, a laser confocal microscope, SEM and EDS.

2.2.3. Shear Test

In the shear test, the hardness and anti-wear performance of the electric pruner were much higher than that of the branches. To increase the significance of the test results, the rake face of the pruner was uniformly painted in the test. On the self-made electric smart pruning deck, the 10/15/20 mm-diameter branches were pruned on the deck. The wear condition of the pruner surface was measured once every 10 cuts by photographing, recording times, and calculating the worn area, until the worn area of the pained surface became stable. The worn area of the painted surface was obtained by image processing software ImageJ. The relationship between the number of cuts and the worn area of the non-textured and textured pruners when cutting branches of different diameters was comparatively analyzed.

3. Experimental Results and Analysis

3.1. Surface Topography Analysis of Biomimetic Convex-Hull Micro-Textured Pruner

As shown in Figure 10a, at the same scanning speed, the texture width increases as the laser power increases. At the same power, scanning speed has lesser effect on the texture width. Figure 10a shows that when the power is 60 W, the texture width is at least 115 μm, and when the power is 80 W, the texture width is up to 153 μm, up by 38 μm, or 33%. As shown in Figure 10a, when the laser power is over 70 W, the texture average widths are over 130 μm. The texture average width is 153 μm at a scanning speed of 3.2 mm/s and a power of 80 W, followed by a texture average width of 150 μm at a scanning speed of 2.4 mm/s and a power of 80 W, and a texture average width of 141 μm at a scanning speed of 1.6 mm/s and a power of 70 W. It can be seen from Figure 10a that the change in laser power is more likely to affect the change in texture average width. The higher the laser power, the greater the texture average width.
With the increase in power, the morphology of the microtextured convex hull at 70 W power is more clear and complete than that at 60 W power, and the slag on the surface is more obvious. When the power reaches 80 W, the micro-texture convex hull is deeper and wider, and the convex hull morphology and structure are more clear and complete. As the power increases, the micro-texture becomes more complete and the surface becomes rougher.
As shown in Figure 10b, at the same scanning speed, the texture depth increases as the laser power increases. At the same power, the texture depth decreases as the scanning speed increases. When the laser power is 60 W, the texture depth is 5.117 μm at the scanning speed of 4.8 mm/s, and when the laser power is 80 W, the maximum texture depth is up to 46.459 μm at the scanning speed of 1.6 mm/s, up by 41.342 μm, or a factor of eight. As shown in Figure 10b, when the scanning speed is 1.6 mm/s, 2.4 mm/s, or 3.2 mm/s, all the maximum depths of texture are over 40 μm, and the texture depth is large at the power of 80 W. When the laser power is 80 W, the maximum texture depth is 46.459 μm at the scanning speed of 1.6 mm/s, followed by 41.441 μm at the scanning speed of 3.2 mm/s, and 39.703 μm at the scanning speed of 2.4 mm/s. At the laser power of 80 W, the texture depth continues to decrease as the scanning speed further increases. As shown in Figure 10b, the lower the speed, the higher the laser power, and the deeper the texture.
Figure 10 and Figure 11 show that the laser power has a great influence on the texture depth and width, while the scanning speed has a small influence on the texture width and a great influence on the texture depth. The parameters of convex hull weaving are: the laser powers are 60 W, 70 W and 80 W, and the scanning speeds are 1.6 mm/s, 2.4 mm/s and 3.2 mm/s.

3.2. Force Analysis of the Main Blade

Branch pruning is a complex process in which branches interact with moving and fixed knives. To obtain the force condition of the pruner in the real shear test and provide a basis for load in the wear test, the force model of the main blade in the pruning process was constructed. It can be seen from [30] that during the pruning process, the main blade of the moving knife moves downward at a constant speed to cut branches under the action of the external load, and the force is shown in Figure 12.
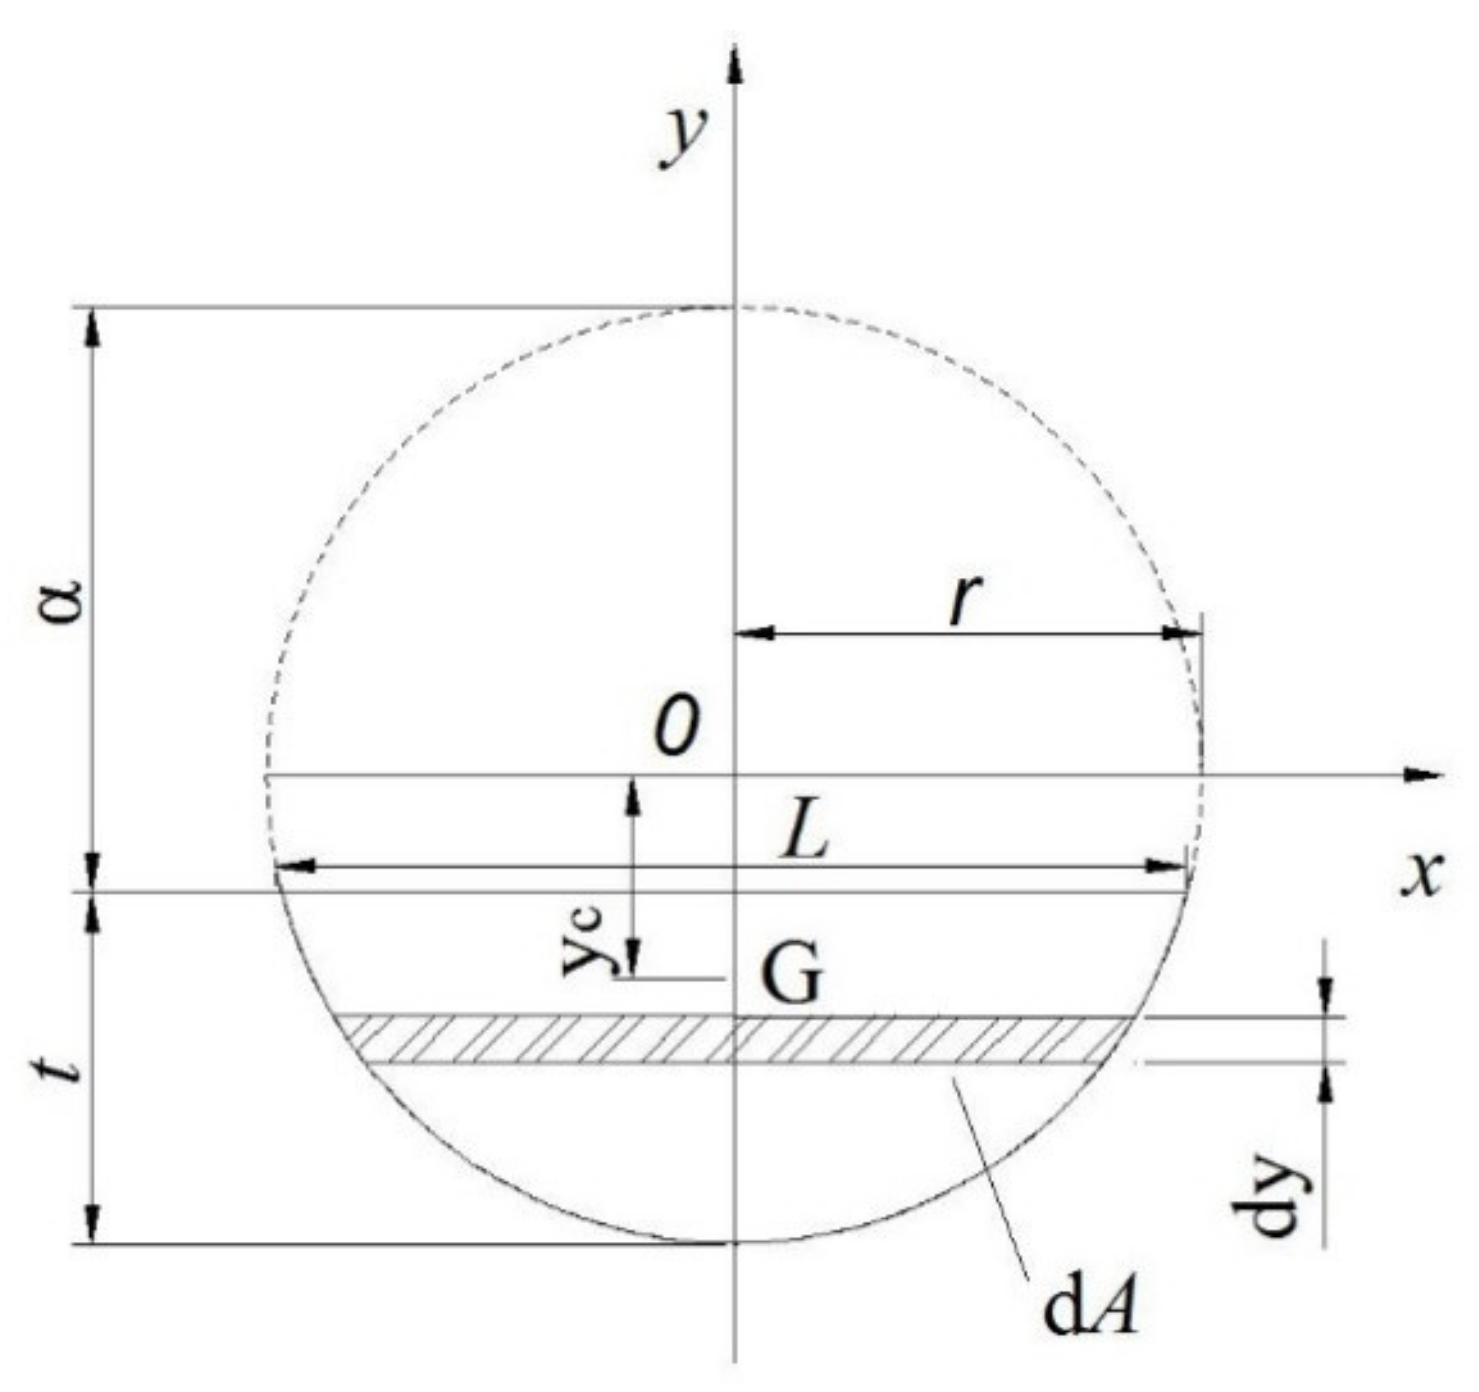
As shown in Figure 13, the main blade is mainly subjected to the resistance force Z of the branch to the blade, the positive pressure N2 and the frictional force f2 on the blade from the branch on the left, the positive pressure N1 and the frictional force f1 on the blade from the branch on the right, and the external load F. The positive pressure N1 and the frictional force f1 on the blade from the branch on the right can be combined into the whole reaction force FR, which is decomposed into the horizontal direction force FRx and the vertical direction force FRy. The cross-section schematic diagram of the branch sheared is shown in Figure 13.
As can be seen from Figure 13, the area enclosed by the solid line below the circular cross section is the uncut part. Let the radius of the branch be r(r = d/2) (mm), the cut depth be a (mm), the height of the uncut part of the branch be t (mm), the centroid of the cross section of the uncut part be G, the length of the contact line of the blade and the branch be L (mm), the area of the cut part of the branch A (mm2), and the geometric relationship is as follows:
L = 2 2 r a a 2
A = ( a r ) 2 r a a 2 + r 2 arcsin a r r + π r 2 2
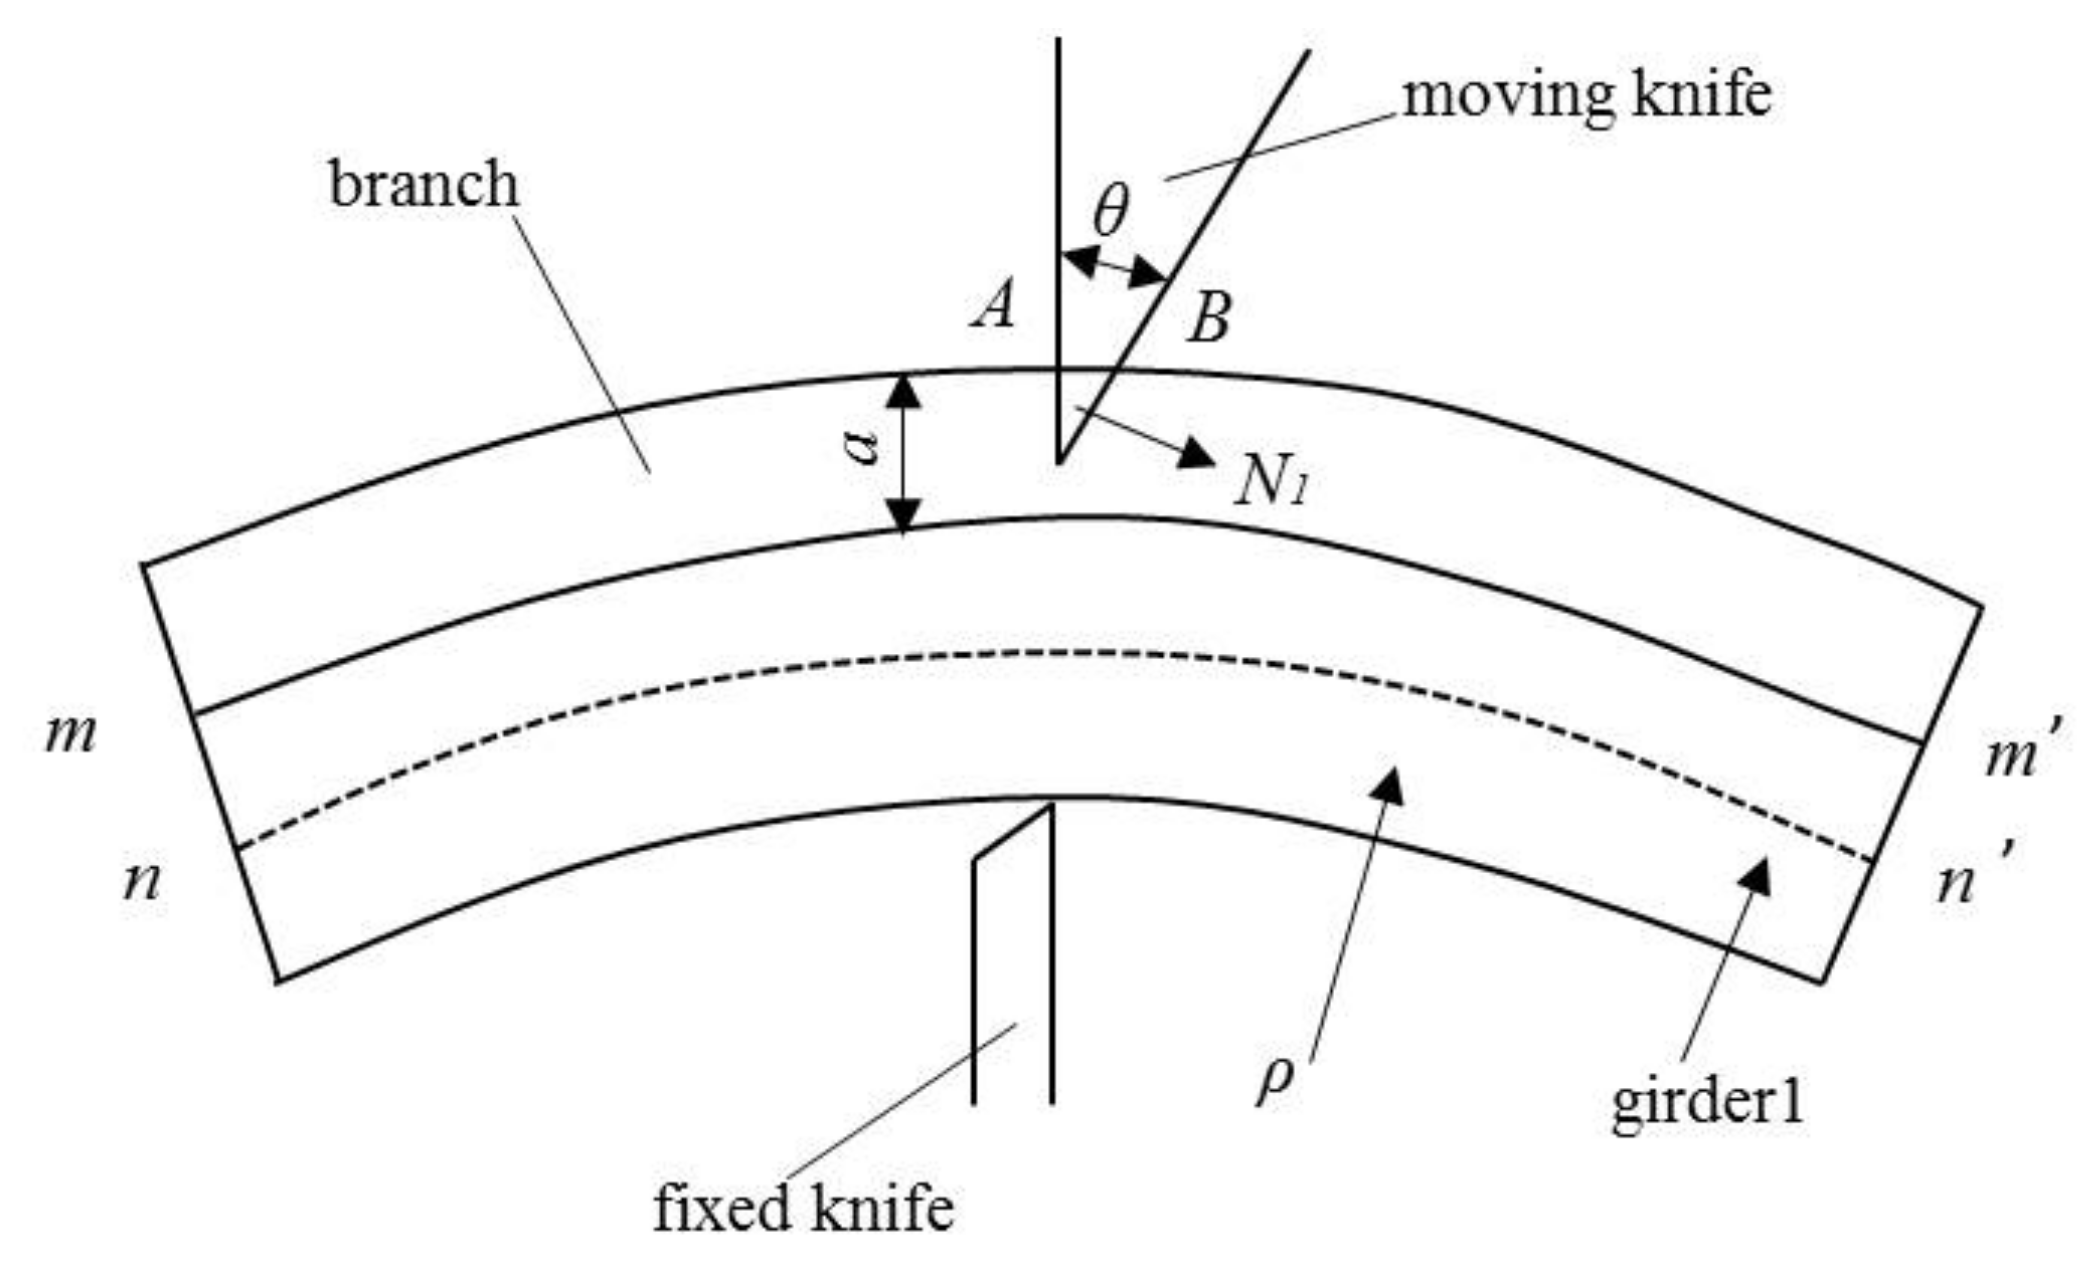
When the blade cuts into the branches, the thickness of the blade itself will squeeze the branches on both sides. If the uncut branches are viewed as the beam 1, the beam 1 will bend under the action of the extruding force, as shown in Figure 14 below.
S x stands for the area of the cross section of the beam 1 for the x-axis and can be expressed as follows:
S x = a r r r 2 y 2 d y
y c for the distance from the centroid G to the x-axis:
y c = S x a
I x for the moment of inertia of beam 1 can be expressed as:
I x = r t r 2 r 2 y 2 ( y y c ) 2 d y
Influenced by the bending, the arc length c and the branch height t are satisfied: as t decreases, c decreases; if c = α t , α is coefficient, γ is the angle corresponding to the arc nn’, then:
α t + a tan θ = γ π ( ρ + y c + r ) 180
α t = γ π ρ 180
From Equations (6) and (7), the radius of curvature corresponding to beam 1 can be obtained:
ρ = α t a tan θ ( y c + r )
From the beam bending theory in [31]:
1 ρ = M E I x
where E (Pa) is the modulus of elasticity along the grain of the branch, I x (mm4) is the moment of inertia of the beam 1, and M (N.m) is the bending moment acting on beam 1. The bending moment M of the beam can be derived from the above Equations (5) and (8). If the height of the blade is j , the distance l from the support point C of the fixed knife to the positive pressure N 1 is obtained:
l = a 2 cos θ + ( 2 r a ) cos θ ; a j
l = j 2 cos θ + ( 2 r a ) cos θ ; a > j
l (mm) is the distance from the support point C of the fixed knife to the positive pressure N 1 , and j (mm) is the height of the blade.
According to the Equations (8)–(11), the positive pressure N 1 can be expressed as:
N 1 = M l = E I x a tan θ l α t ( y c + r )
It can be derived from Equation (12) that the load is proportional to the modulus of elasticity, moment of inertia, cut depth and bevel angle, and inversely proportional to the distance from the support point of the fixed knife to the positive pressure.
The positive pressure values are calculated by the Equation (12) while cutting 10/15/20 mm-diameter branches and the curve is as shown in Figure 15. It can be seen from Figure 15 that the force of the moving knife increases first and then decreases as the cut depth increases. The theoretical peak shear forces are 303/1066/2675N while cutting 10/15/20 mm-diameter branches.
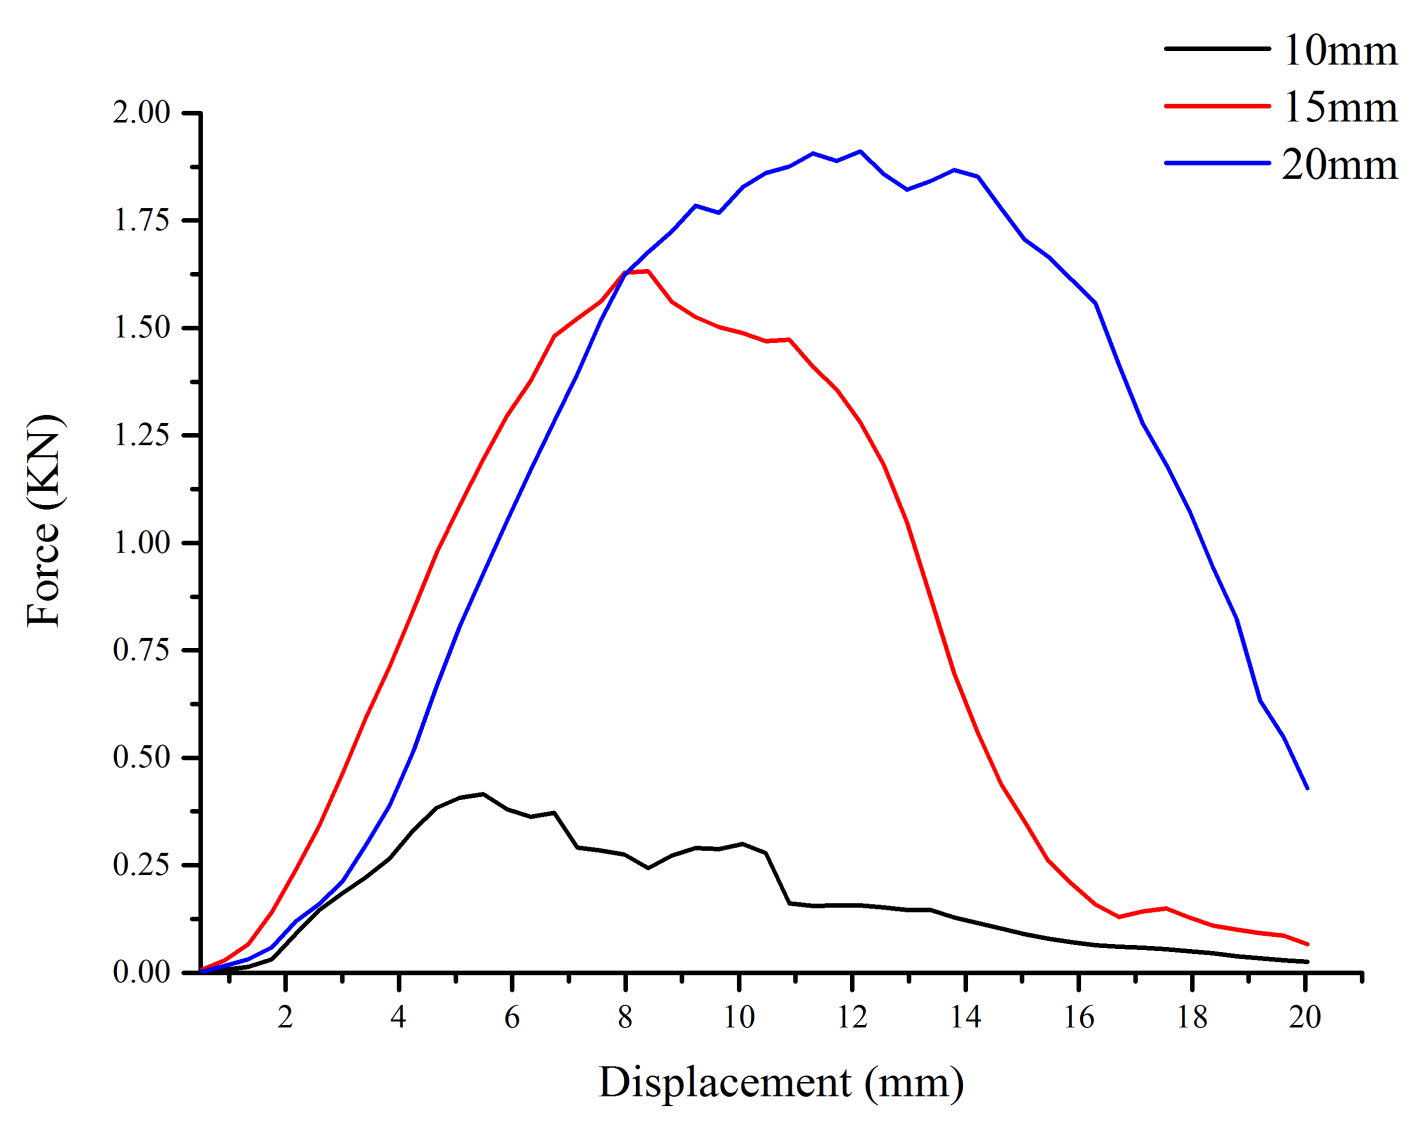
10/15/20 mm-diameter branches were selected for static pressure shear test on a WD-E universal tester. The result details are shown in Figure 16. The trends in Figure 15 and Figure 16 are almost the same with the shear force first increasing and then decreasing. There is a significant inflection point while the shear force is rising. Table 6 shows that the theoretically calculated value is smaller than the actual shear force value while cutting the 10/15 mm-diameters branches, and the theoretical value is greater than the actual value at the diameter of 20 mm. This is because the branches are not purely sheared in the actual shear test. In the initial stage of static pressure shearing, due to the thickness of the pruner, the branches undergo elastoplastic deformation after the surface is squeezed by the pruner, and the crack appears and expands when the branches are torn once it exceeds the plastic deformation limit with further increased pressure. Afterwards, the branches undergo approximately pure shear. At the end of the cut, the part of the branches that is about to fall under the force of gravity, brings the bending moment to the cutting surface, and the branches are broken. Therefore, the branches are subjected to forces in various forms such as pressing, cutting and bending during static shearing. The shear model established in this paper ignores the final bending force, and the larger the diameter of the branch, the greater the bending force, so there is an error.
As the relationship between the pressure sensor and the actual force of the HT-500 high temperature friction and wear tester satisfies F N = N G 10 , and the maximum load of the HT-500 is 2000 g, the load in the friction and wear test for the 20 mm-diameter branch is 2000 g and the gravity G is 10.

3.3. Wear Analysis

3.3.1. Friction and Wear Test Results and Analysis

The average friction coefficient at different loads is shown in Table 7. Figure 17 is a graph showing the friction coefficient of the pruner surface with time at the loads of 300 g to 2000 g in a full factor experiment.
At the load of 300 g, the friction coefficient at the power of 60 W–80 W first increases and then decreases, and finally stabilizes. In Figure 17a–c, the friction coefficient increases first and then decreases in the first 5–10 min, and then enters the stationary period after 10 min of wear. In Figure 17a,c, the wear curve of the non-textured pruner is lower than that of the textured pruner, indicating that the micro-textured pruner does not show an anti-friction effect at the powers of 60 W and 80 W at the load of 300 g. In Figure 17b, after 15 min of wear, the wear curve of the non-textured pruner is higher than that of the textured pruner at the speeds of 1.6 mm/s and 3.2 mm/s and power of 70 W, whilst the friction reduction effect appears. In Table 7, the average friction coefficient of the non-textured pruner at the load of 300 g is 0.1685, and the average friction coefficient of the textured pruner at the power of 70 W and speed of 1.6 mm/s is 0.1667, representing 1.5% lower than that of the non-textured pruner and the lowest average friction coefficient. The surface friction coefficient of the textured pruner fluctuates between 0.1610 and 0.2820. As the wear time increases, it finally stabilizes at 0.1930. At the load of 300 g, only the micro-textured pruner at the power of 70 W and speed of 1.6 mm/s has a slight anti-friction effect, which is 1.5%.
At the load of 1100 g, in Figure 17d–f, the wear curve at the power of 60 W/70 W/80 W increases first and then decreases in the first 10 min, and it tends to be stable after 10 min. In Figure 17d, only the wear curve of the micro-textured pruner at the power of 60 W and speed of 1.6 mm/s is above the wear curve of the non-textured pruner. Among them, the wear curve of the non-textured pruner in Figure 17e,f is much higher than the wear curve of the micro-textured pruner. After 20 min–30 min of wear, the wear curves in Figure 17e,f show large fluctuations, because the wear becomes severe with increasing load, and the increase in the friction coefficient caused by the surface roughness is weakened. The wear curve of the micro-textured pruner at various scanning speeds is gradually moving close, with reduced changes of the friction coefficient. In Table 7, at the load of 1100 g, the average friction coefficient decreases as the laser power increases. Among them, the micro-textured pruner at the power of 80 W and speed of 2.4 mm/s has the lowest average friction coefficient 0.2378, or 65.87% of the friction coefficient of the non-textured pruner, and the friction reduction effect is obvious.
At the load of 2000 g, in Figure 17g–i, the wear curve increases first and then decreases with wear time at the powers of 60 W/70 W/80 W, and finally tends to be stable. In Figure 17 g, after 40 min of wear, the wear curve of the textured pruner at the power of 60 W and speeds of 1.6 mm/s and 2.4 mm/s is higher than the wear curve of the non-textured pruner. When the laser power is 70 W, Figure 17 h shows that only the wear curve of the textured pruner at the power of 70 W and speed of 1.6 mm/s is higher than the wear curve of the non-textured pruner. When the laser power is 80 W, the wear curve of the textured pruner is much lower than the wear curve of the non-textured pruner. In Table 7, as the laser power increases, the average friction coefficient decreases. From Table 7 and Figure 17g–i, we can see that the textured pruner at the power of 80 W and speed of 1.6 mm/s has the lowest average friction coefficient 0.1209, or 50.54% of the friction coefficient of the non-textured pruner, and the friction reduction effect is obvious.
At the load of 300 g, the pruner at the power of 70 W and speed of 1.6 mm/s has the lowest average friction coefficient 0.1667, showing a slight anti-friction effect. At the load of 1100 g, the textured pruner at the power of 80 W and speed of 2.4 mm/s has the lowest average friction coefficient 0.2378, and the friction reduction effect is obvious. At the load of 2000 g, the textured pruner at the power of 80 W and speed of 1.6 mm/s has the lowest average friction coefficient 0.1209, representing the lowest friction coefficient in the wear test, or almost half of the friction coefficient of the non-textured pruner, and the anti-wear characteristics are remarkable.
In Figure 17 and Table 7, the surface friction coefficient increases first and then decreases with the wear time, and it tends to be stable. Except for the textured pruner at the power of 70 W and speed of 1.6 mm/s, the surface friction coefficient of all pruners increases first and then decreases with increasing load. At the small load of 300 g, the textured pruner enters into a wear-stable stage after 10 min of wear. Although the textured pruner has no obvious anti-friction advantage compared with the non-textured tool, the textured pruner enters the wear-stable period faster. At the loads of 1100 g and 2000 g, the friction coefficient of the textured pruner is smaller than that of the non-textured pruner, and the friction and wear plateau is half that of the non-textured pruner.
As the laser power increases, the friction coefficient decreases. This is because at higher power, more energy enters the surface of the pruner to deepen the texture and increase the surface roughness. As the load increases, the initial friction coefficient increases, and the initial wear progresses vigorously. With increasing wear, the surface roughness has a weakened effect on the friction coefficient, while the friction reduction effect of deep texture is excellent, and it enters the plateau more quickly.

3.3.2. Analysis of Volumetric Wear Loss of Pruner Surface at the Load of 300 g~2000 g

From [32], we know that the volumetric wear loss is:
Δ V = L 0 + [ R 2 arcsin D 2 R D 2 R R 2 ( D 2 ) 2 ]
In the formula: L 0 (mm) is the circumference of the wear scar, R (mm) is the radius of the YG6 tungsten steel ball, and D (mm) is the width of the wear scar.
The volumetric wear rate at different loads is:
Q = Δ V / v T
In the formula: Δ V (mm/min) is wear linear velocity of the grinding ball, T (min) is the wear time, v (mm/min) is wear line speed of the grinding ball.
The volumetric wear loss and rate of the samples in the test were calculated from Equations (13) and (14), and the detailed morphology of the wear scars was observed using a super depth-of-field microscope and a field emission scanning electron microscope. The detailed wear test data are shown in Table 8, and the curve of volumetric wear loss of textured pruners with various loads is shown in Figure 18.
From the Equations (13) and (14), we can see that the wear scar width, the volumetric wear loss and the volumetric wear rate are positively correlated. Therefore, we mainly analyze the trend of volumetric wear loss in this paper.
In Figure 18 and Table 8, for non-textured pruners, the volumetric wear loss increases with increasing load. At the load of 300 g~1100 g, the volumetric wear loss increases greatly from 11.8189 mm3 to 35.8454 mm3, up by 203%. At the load of 300 g, the volumetric wear loss is the smallest in the group of tests. At the load of 2000 g, the volumetric wear loss increases from 35.8454 mm3 to 42.2921 mm3, up by 18%, which is the largest volumetric wear loss in the group of tests. Compared with the load of 300 g~1100 g, the increment is rather moderate.
At the power of 60 W, the volumetric wear loss of the textured pruner increases with increasing load. At the load of 300 g, the minimum volumetric wear loss is 23.9707 mm3 at the speed of 3.2 mm/s, and the maximum volumetric wear loss is 31.1930 mm3 at the speed of 1.6 mm/s, up by 7.2223 mm3, or 30.1%. At the load of 1000 g, the minimum volumetric wear loss is 30.3255 mm3 at the speed of 3.2 mm/s, and the maximum volumetric wear loss is 37.8902 mm3 at the speed of 1.6 mm/s, up by 7.5647 mm3, or 24.9%. At the load of 2000 g, the minimum volumetric wear loss is 40.5797 mm3 at the speed of 3.2 mm/s, and the maximum volumetric wear loss is 77.2919 mm3 at the speed of 2.4 mm/s, up by 36.7122 mm3, or 90.4%.
At the power of 70 W, the volumetric wear loss of the textured pruner increases gently with increasing load. At the load of 300 g, the minimum volumetric wear loss is 26.1805 mm3 at the speed of 1.6 mm/s, and the maximum volumetric wear loss is 39.7081 mm3 at the speed of 3.2 mm/s, up by 13.5276 mm3, or 51.7%. At the load of 1000 g, the minimum volumetric wear loss is 29.9472 mm3 at the speed of 1.6 mm/s, and the maximum volumetric wear loss is 34.9197 mm3 at the speed of 3.2 mm/s, up by 4.9725 mm3, or 16.6%. At the load of 2000 g, the minimum volumetric wear loss is 47.2318 mm3 at the speed of 2.4 mm/s, and the maximum volumetric wear loss is 52.5880 mm3 at the speed of 3.2 mm/s, up by 5.3562 mm3, or 11.3%.
At the power of 80 W, the volumetric wear loss of the textured pruner increases sharply with increasing load. At the load of 300 g, the minimum volumetric wear loss is 30.3992 mm3 at the speed of 2.4 mm/s, and the maximum volumetric wear loss is 35.9052 mm3 at the speed of 3.2 mm/s, up by 5.506 mm3, or 18.1%. At the load of 1000 g, the minimum volumetric wear loss is 39.5301 mm3 at the speed of 3.2 mm/s, and the maximum volumetric wear loss is 42.9274 mm3 at the speed of 1.6 mm/s, up by 3.3973 mm3, or 8.6%. At the load of 2000 g, the minimum volumetric wear loss is 69.7000 mm3 at the speed of 2.4 mm/s, and the maximum volumetric wear loss is 83.2349 mm3 at the speed of 1.6 mm/s, up by 13.5390 mm3, or 19.4%.
At the load of 300 g, the maximum volumetric wear loss is 39.7081 mm3 at the power of 70 W and speed of 3.2 mm/s. At the load of 1100 g, the maximum volumetric wear loss is 42.9274 mm3 at the power of 80 W and speed of 1.6 mm/s. At the load of 2000 g, the maximum volumetric wear loss is 83.2349 mm3 at the power of 80 W and speed of 1.6 mm/s.

3.3.3. Analysis of Wear Scar Morphology

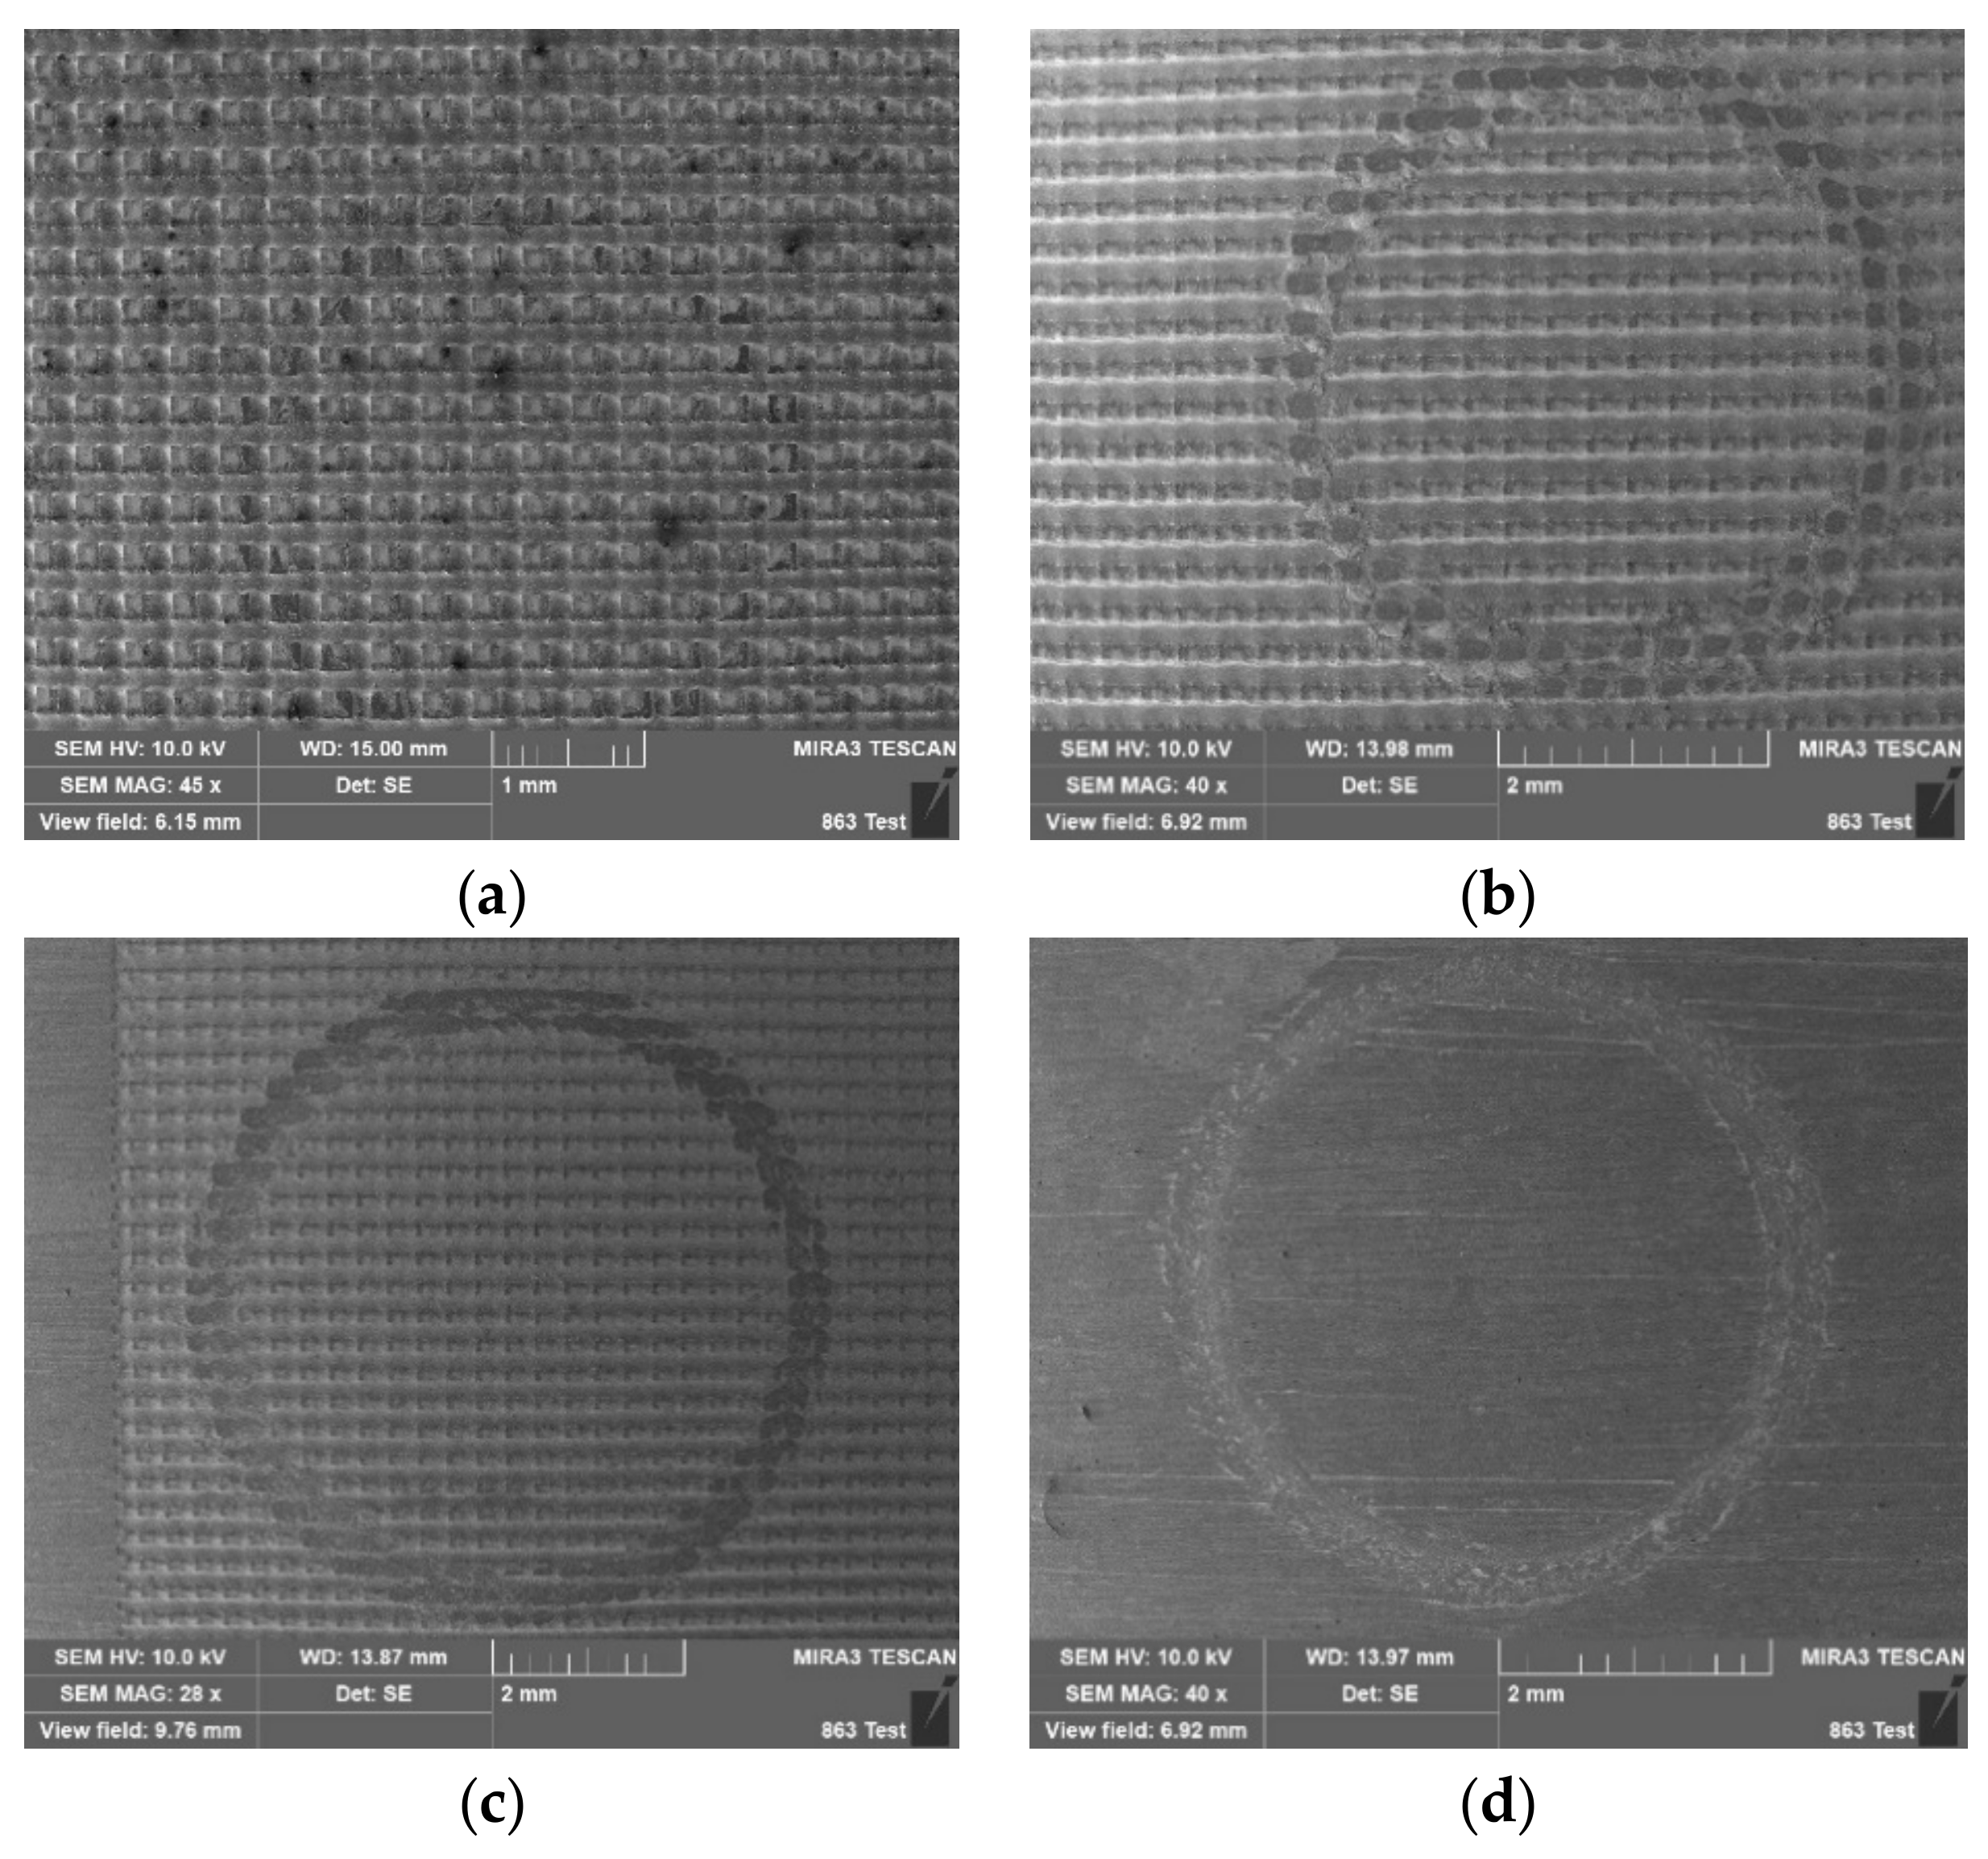
Figure 19 shows the wear scar morphology of the convex-hull textured pruner at different loads. In Figure 19a, the wear scar morphology is not obvious at the load of 300 g, while the wear scar morphology is obvious at the load of 1100 g–2000 g. At the lower load, the upper friction pair did not deeply wear the pruner texture, but reciprocated sliding friction on the surface. As the load increases, the pruner is squeezed by the upper friction pair, and the depth and width of the wear scar improve significantly. As shown in Figure 19b, compared with the load of 300 g, the width of surface wear scar changed clearly at the loads of 1100 g and 2000 g, while the wear scar width did not change greatly below the loads of 1100 g and 2000 g. This is because, as the load increases, the contact area of the pruner surface and the steel ball increases, and the wear is more significant at a heavy load than a light load. However, when both are at a heavy load, the wear quickly enters the plateau without obvious changes in the width of the wear scar. Therefore, in this paper, we introduce the wear loss for explanation.
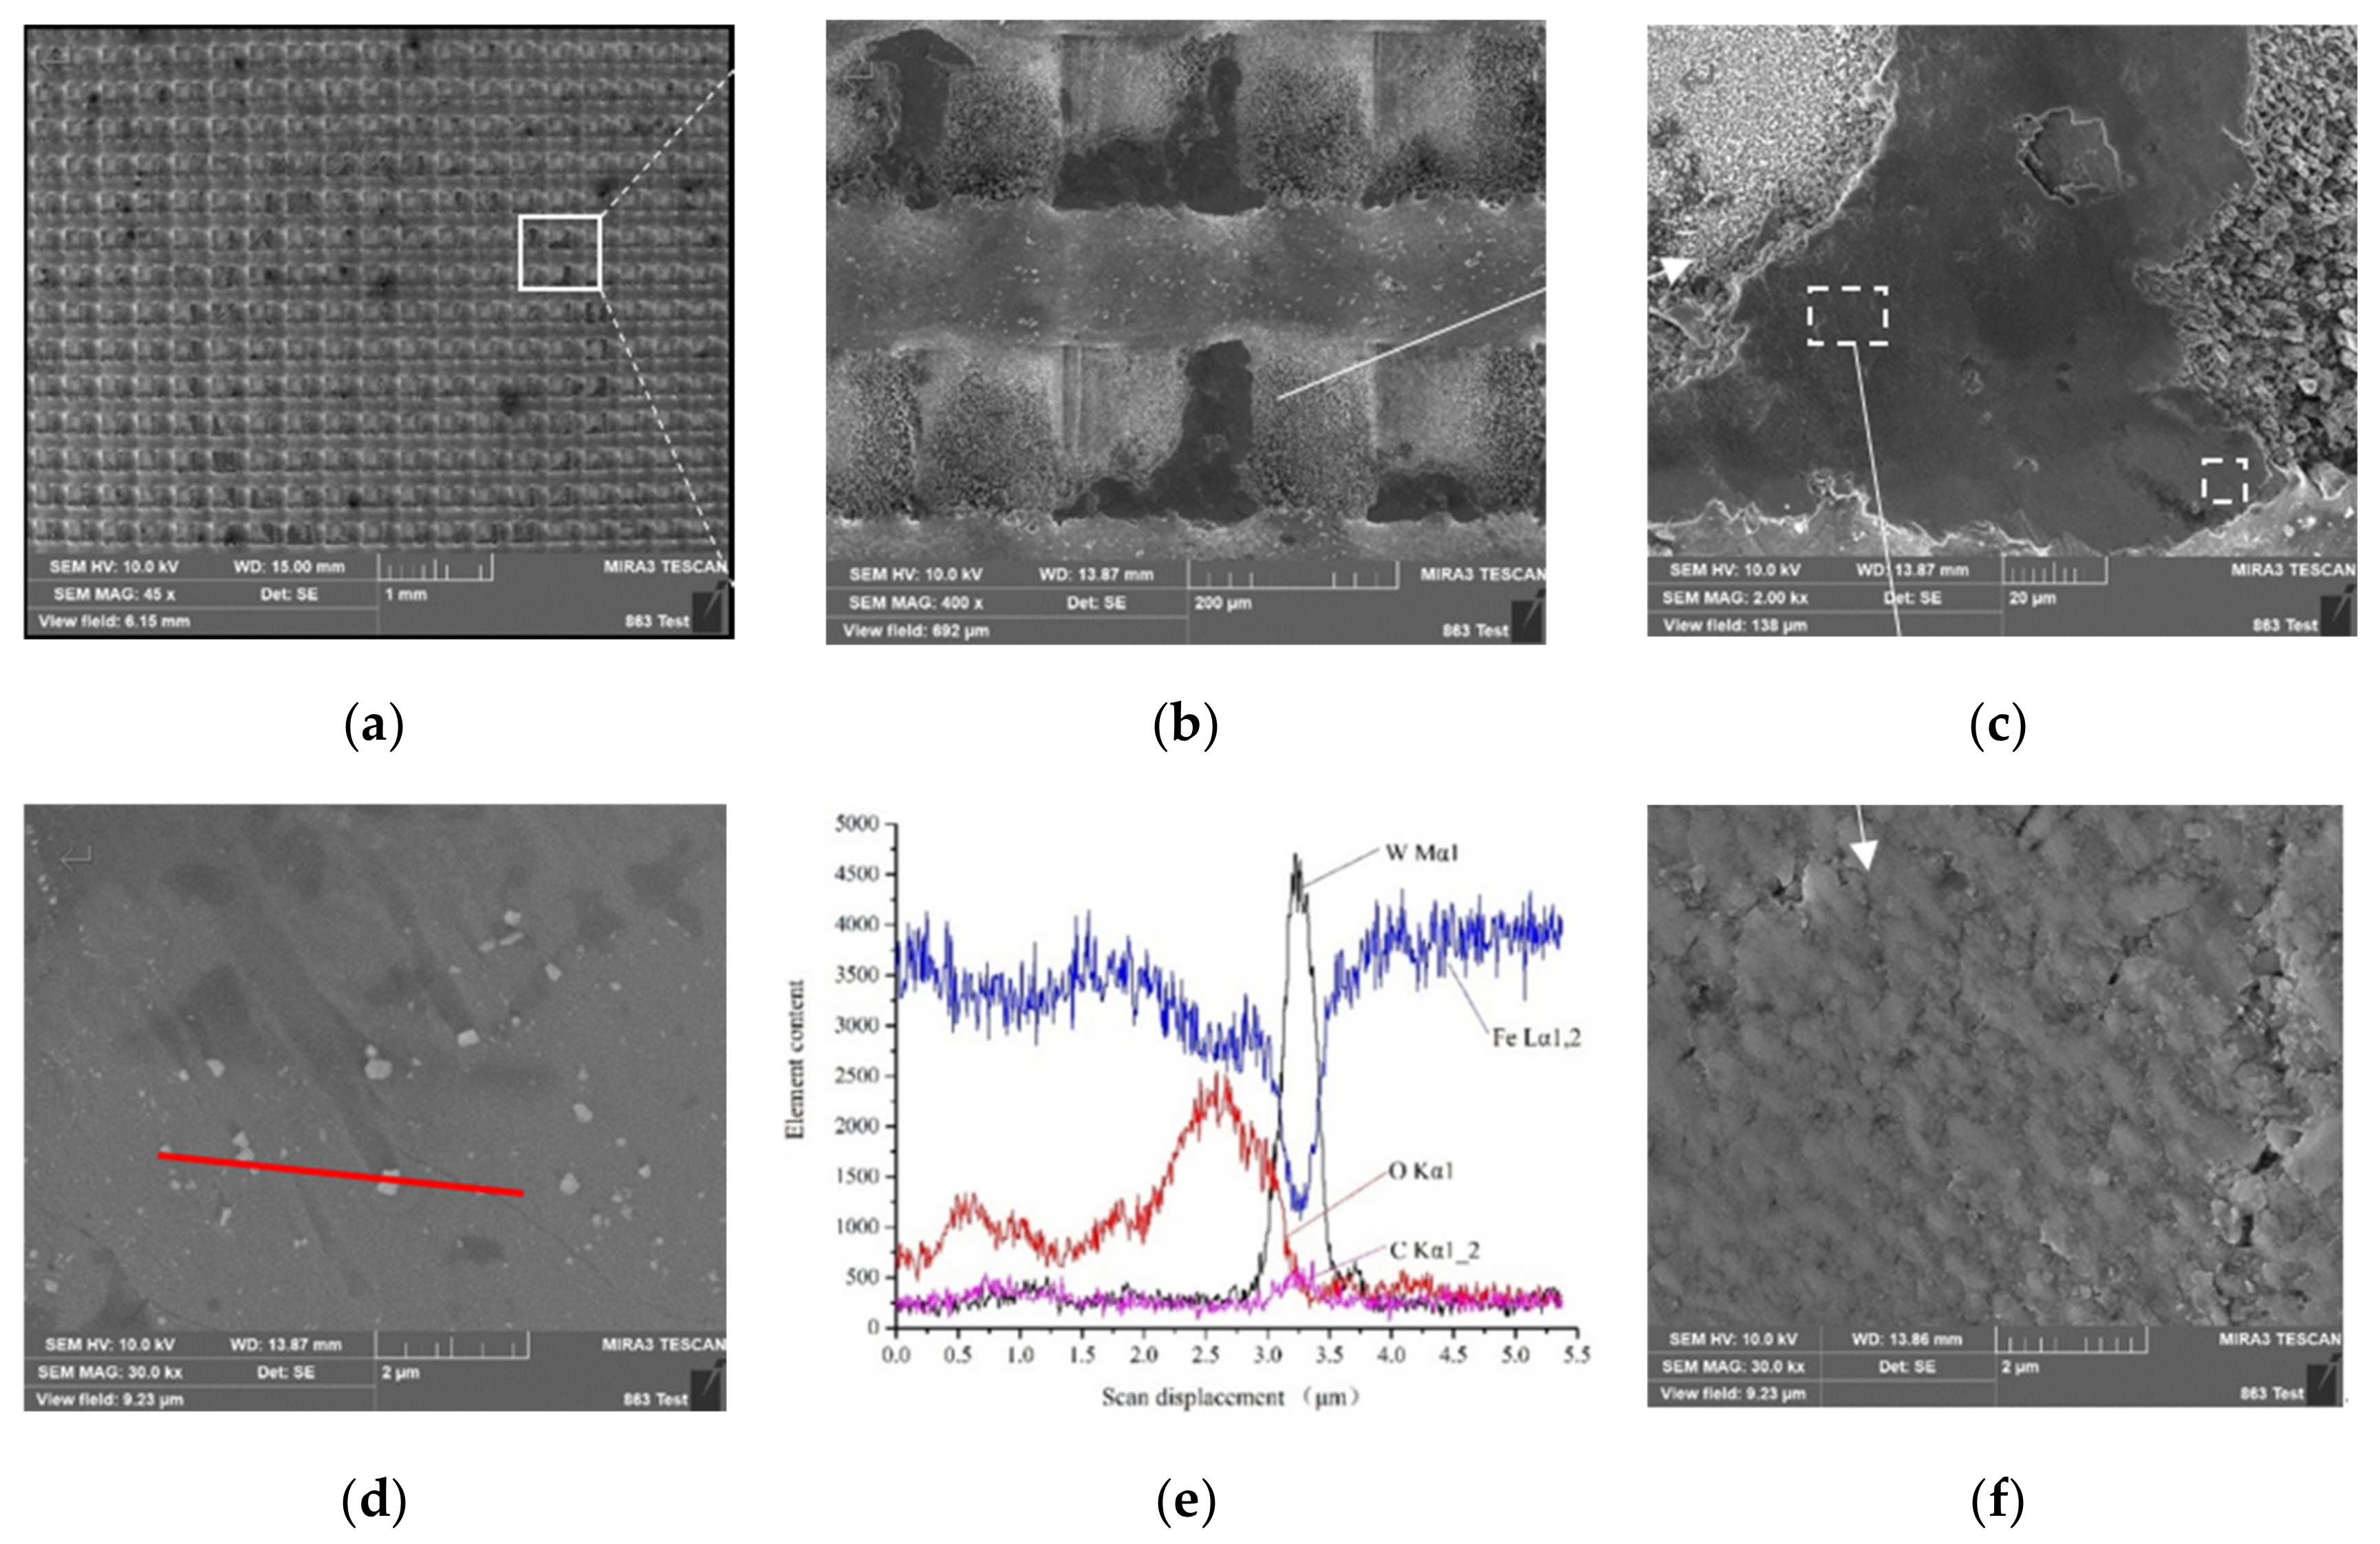
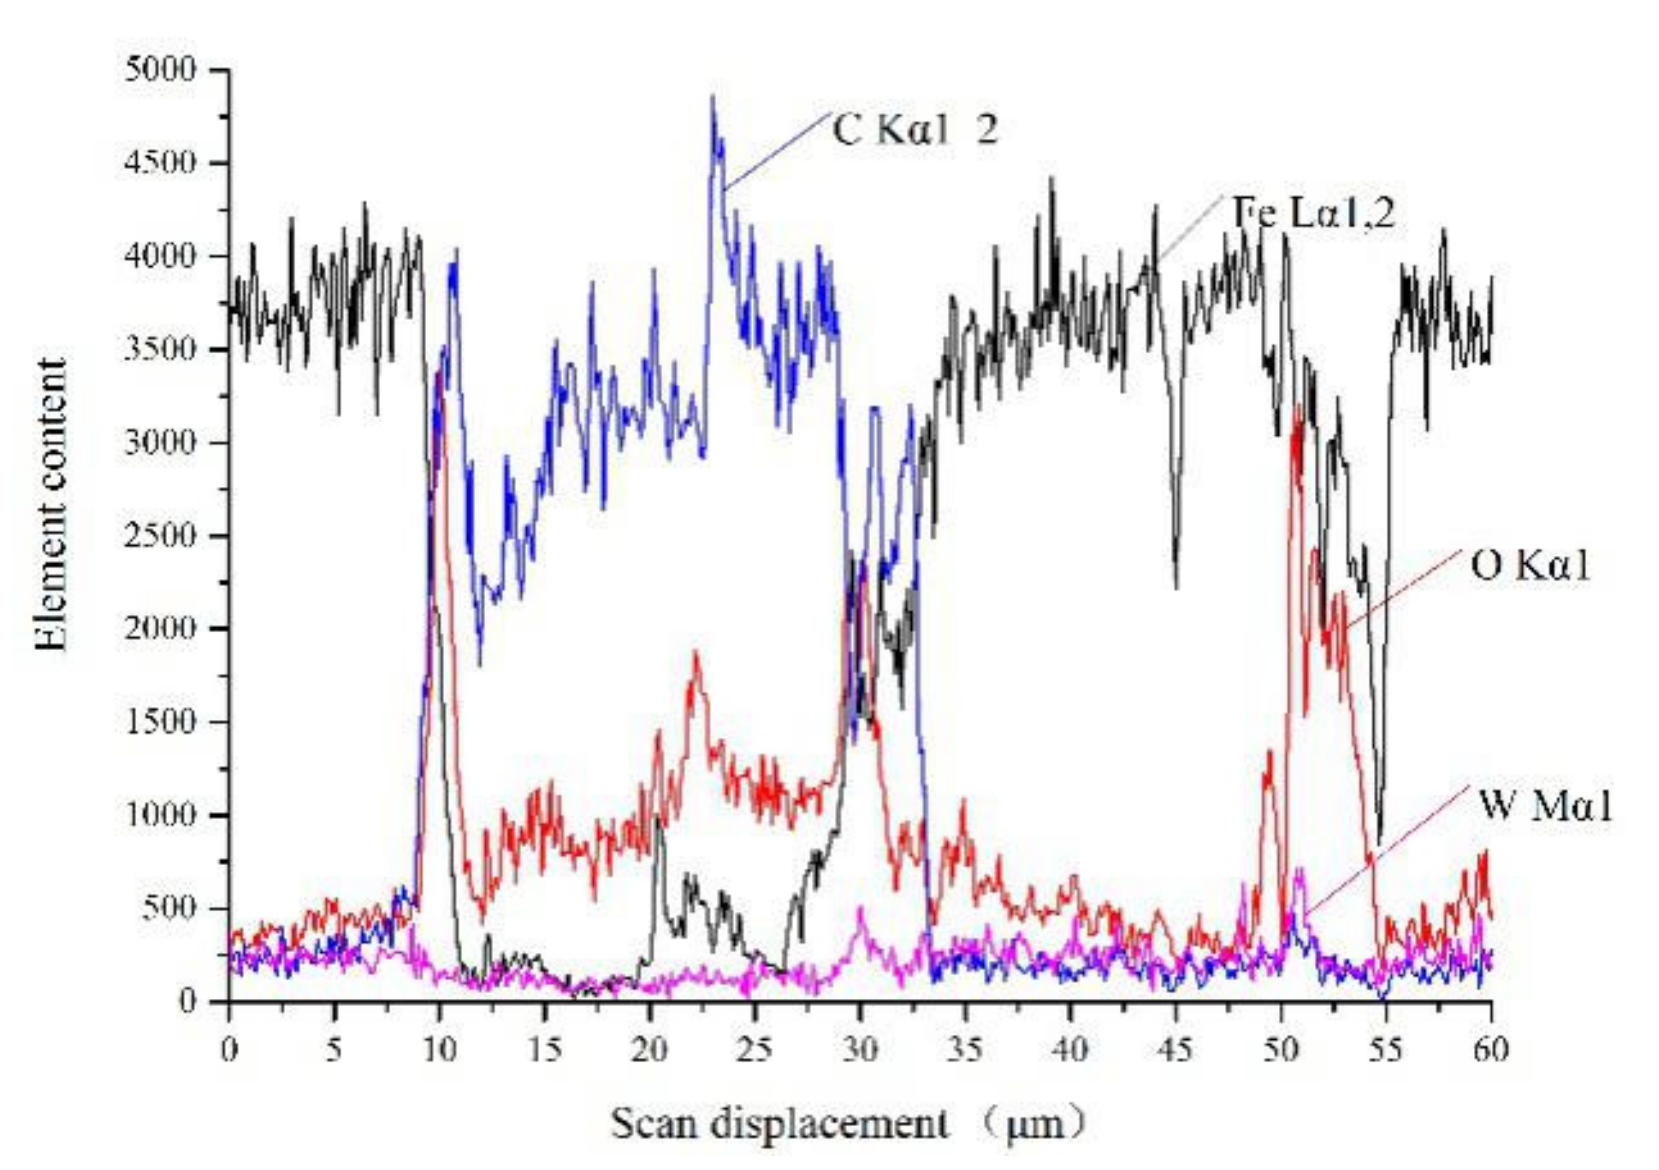
In Figure 20a, the wear scar is shallow at the load of 300 g without obvious scratches and tears, and no wear debris is found in the groove. Figure 20c is an enlarged view of Figure 20b. We can see that the edge of the convex hull of the pruner is slightly damaged, and the friction coefficient approximates that of the non-textured pruner, showing no friction reduction effect. Figure 20e EDS shows that the main elements of the worn surface at the load of 300 g are Fe, W and O. Among them, elements like Fe, W and O have clear fluctuations. In Figure 20d, the white granular structure contains more W which mainly originates from the upper friction pair. During the wearing process, the upper friction pair is worn away, and abrasive wear occurs. Figure 20f is a partially enlarged view of Figure 20c. We can see that squeezing and peeling occur at the load of 300 g, and the plastic flow of the friction surface and the nearby surface layer continued to accumulate, causing the secondary surface to crack and develop parallel to the surface. Eventually the crack will further extend and cause the branch to fall off.
Figure 21b is an enlarged view of the wear scar at the load of 1100 g. There is clear wear debris in the convex-hull grooves. At a heavy load, the connection which occurs between the convex hulls and the latter is ground flat. In Figure 21c, the surface has obvious tearing and adhesion areas. Figure 21c corresponds to the EDS1 in Table 9, which shows that the convex hull surface is torn by the upper friction pair at a heavy load, with the high carbon steel substrate exposed. The EDS1 has high iron content, low oxygen content, and no element W. The wear is abrasive wear, during which the base material is stripped away by the upper friction pair. Figure 21c corresponds to EDS2 and EDS3 in Table 9, which shows that EDS2 and EDS3 have high oxygen content, and that oxidative wear occurs during the wear process. Moreover, EDS2 and EDS3 also have high W content which mainly originates from the upper friction pair and abrasive wear occurs during the wearing process. Meanwhile, Figure 21c also shows that there is a little abrasive particle adhered to the obvious cracks and peeling on the convex hull surface. It shows that the hard particles of the upper friction pair cause the micro crack occurrence, expansion and fracture on and falling off from the surface layer of the material, resulting in micro fracture and squeezed peeling. With increasing load, the wear strength increases, and a large amount of wear debris is transferred into the groove under the action of adhesive force for cutting and wearing. The wear mechanism changes from abrasive wear to oxidative wear and adhesive wear.
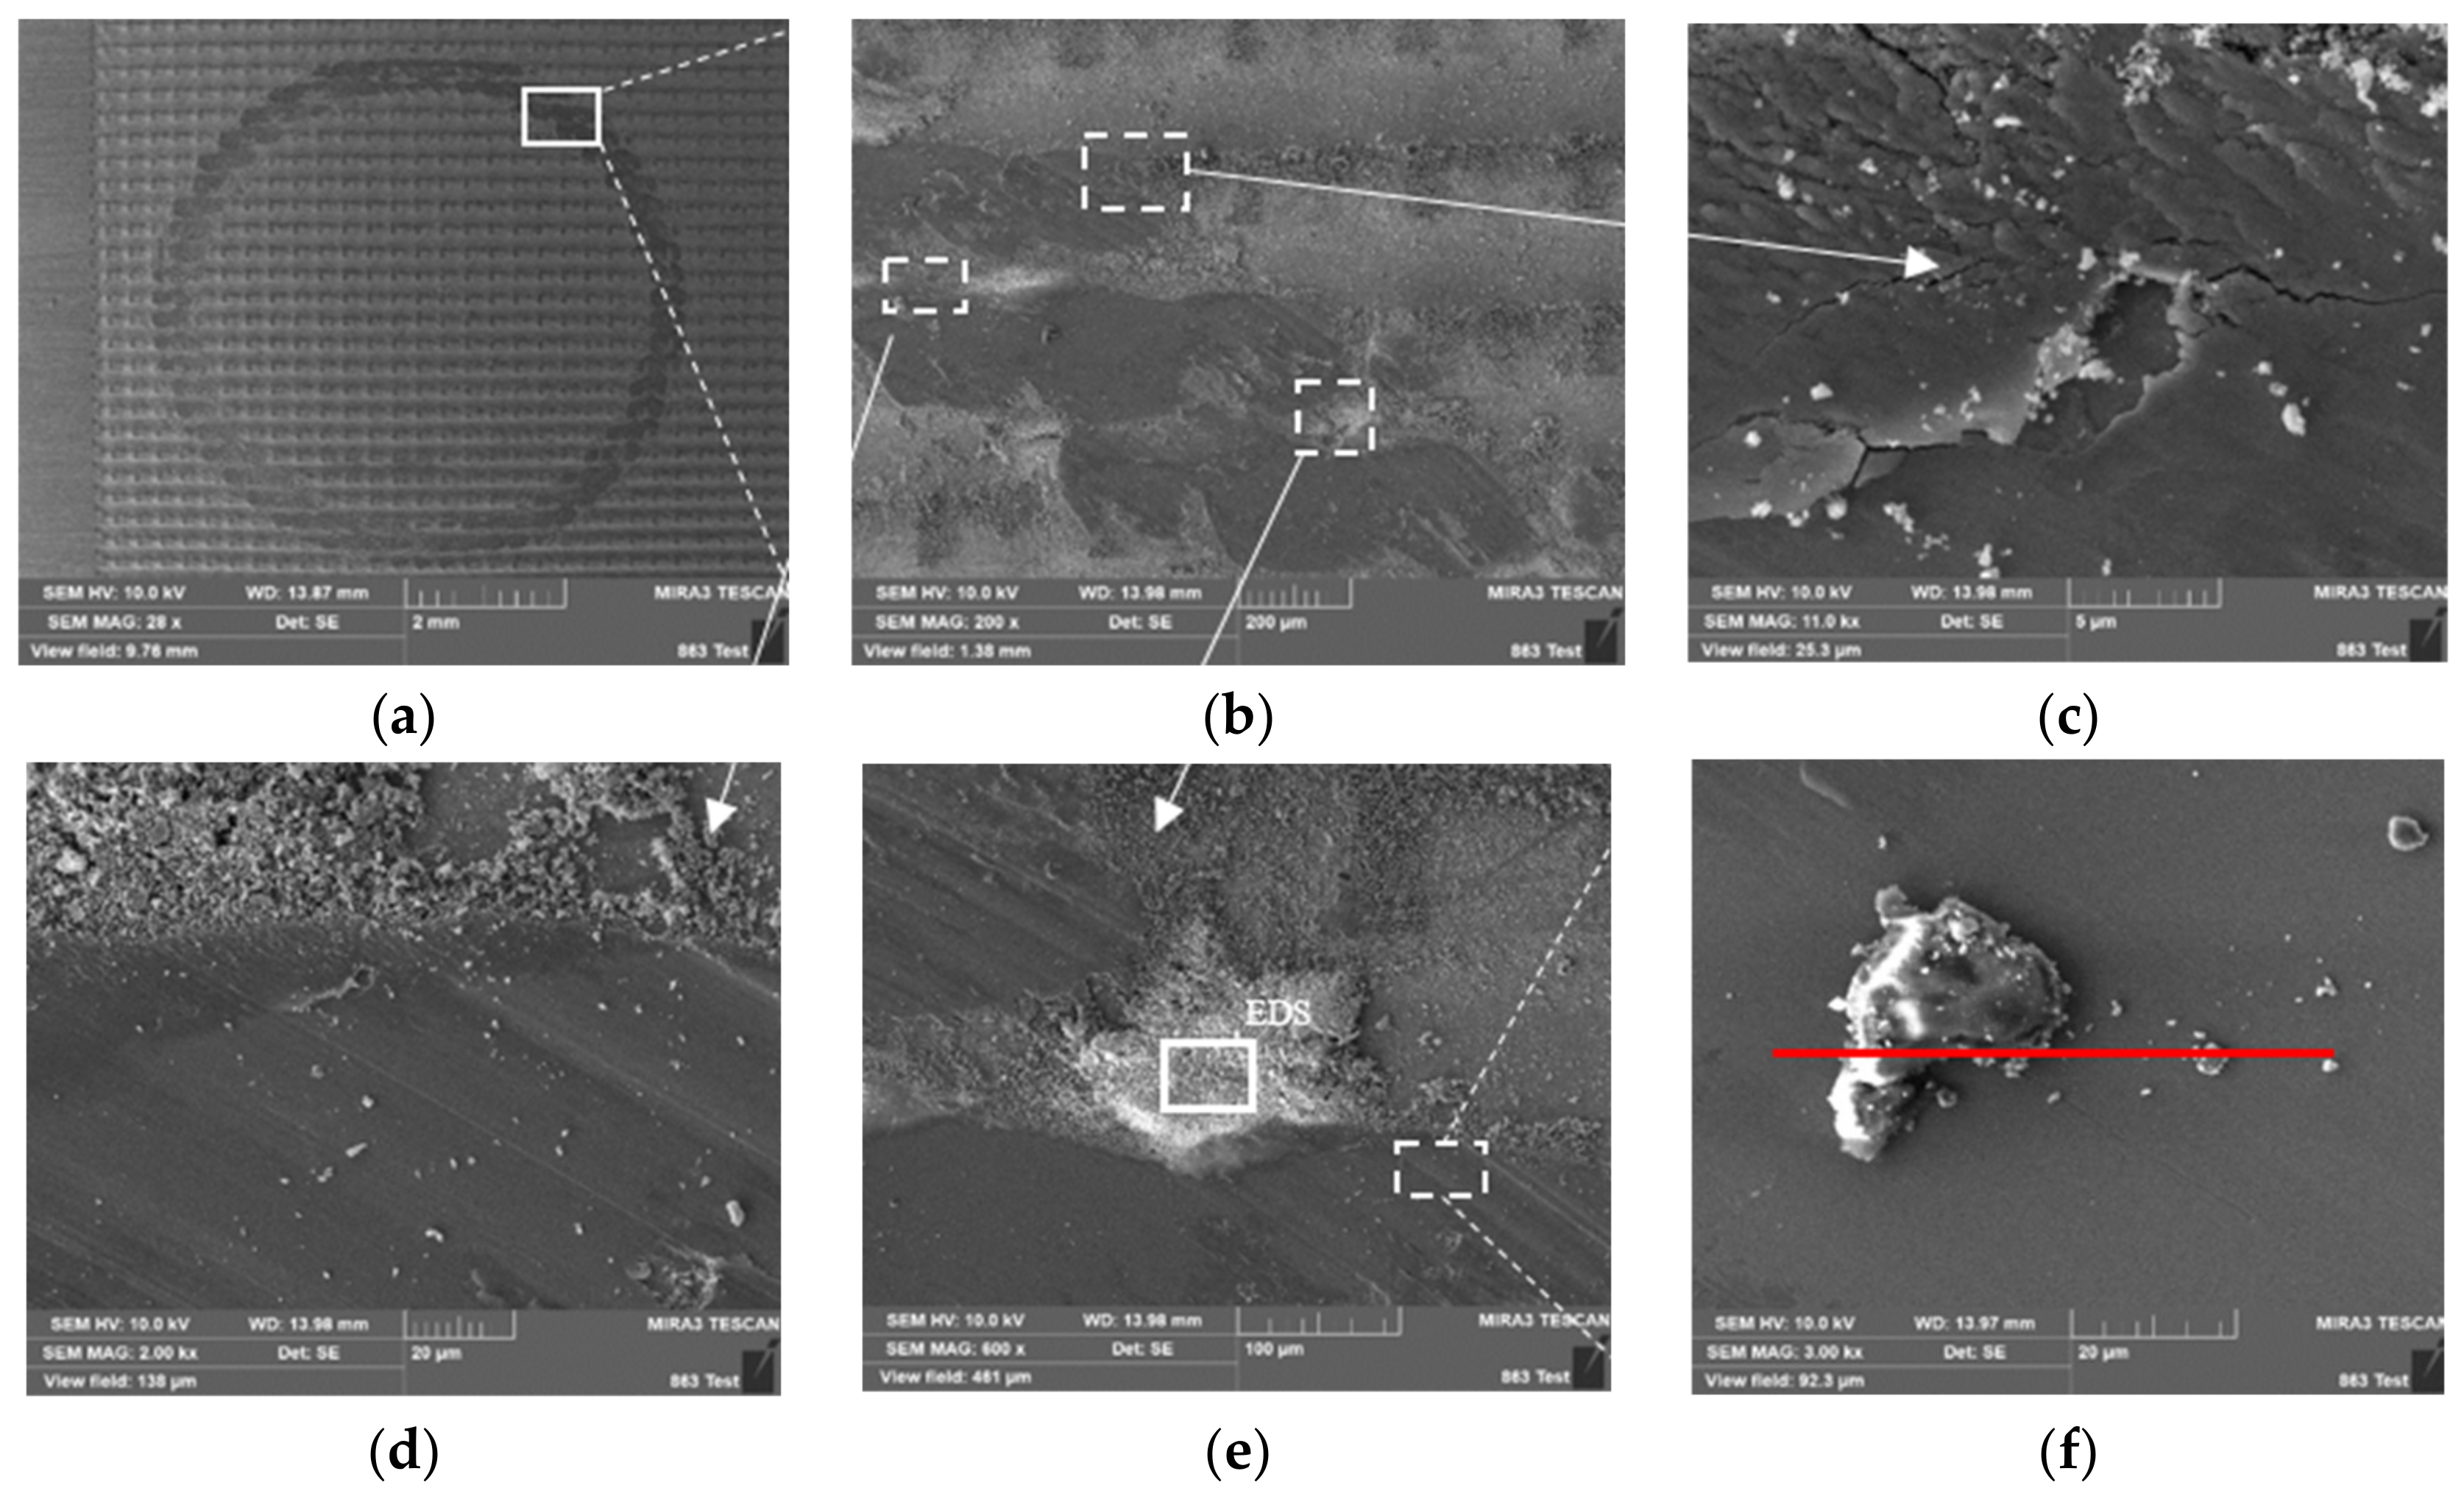
At the load of 2000 g, the wear scar is more distinct, and the micro-textured surface is completely worn away, as shown in Figure 22b. Furthermore, the surface adhesion and peeling are rather serious as shown in Figure 22c, because as the load increases, cold welding occurs between the steel ball and the textured surface, and the atoms of the upper friction pair and the lower friction pair are combined due to the atomic bond. In the subsequent sliding, the adhesion point is sheared. Figure 22c has obvious water ripple morphology attributable to the fact that the surface pressure at a heavy load is large, and the upper friction pair and the substrate surface demonstrate a strong tearing. Meanwhile, micro-fatigue occurs from continuous contact with surface under the action of heavy load, and strong energy hits the surface adhered by cracks, causing cracks in the substrate and producing water ripple morphology. At the same time, the layered or scale-like peeling debris on the surface of the material also indicates that squeezed peeling has occurred. In Figure 22d, at the load of 2000 g, there is little wear debris remaining on the surface during the wear process, and the abrasive wear has been alleviated. As shown in Figure 22e, a large amount of wear debris is stored in the groove of the texture. As the wear time and surface pressure increase, the depth of the furrow increases, resulting in cutting wear. From Figure 22f, a partial enlarged view of Figure 22e, we can see that the storage of wear debris in the groove is most obvious at a heavy load, followed by abrasive wear. Figure 22e shows that there are clear white particles on the surface of the wear scar. The corresponding Table 10 shows that the wear debris contains more O and W elements. It shows that the adhesion phenomenon is more serious when the upper friction pair and the lower friction pair are combined at a heavy load. We randomly selected some wear debris of Figure 22e, as shown in Figure 22f. We carried out EDS analysis of Figure 22f, as shown in Figure 23. As the content of O, C, W, and Fe elements in Figure 22 fluctuates greatly, there are fewer iron elements and more carbon and oxygen elements in white particles, indicating that the white particles are abrasive oxides. Figure 22 further proves that with increasing load and wear time, the wear mechanism changes from the abrasive wear in the early stage to the composite of oxidative wear and adhesive wear.

3.4. Shear Test Analysis

From the above friction and wear test, it is can be seen that at the load of 300 g, the friction coefficient of the textured pruner is the minimum at the power of 70 W and speed of 1.6 mm/s. At the load of 1100 g, the friction coefficient of the textured pruner is the minimum at the power of 80 W and speed of 2.4 mm/s, while at the load of 2000 g, the friction coefficient of the textured pruner is the minimum at the power of 80 W and speed of 1.6 mm/s texture tool. According to the shear force analysis of the branches, the 10/15/20 mm-diameters branches were cut at the load of 300 g/1100 g/2000 g, respectively.
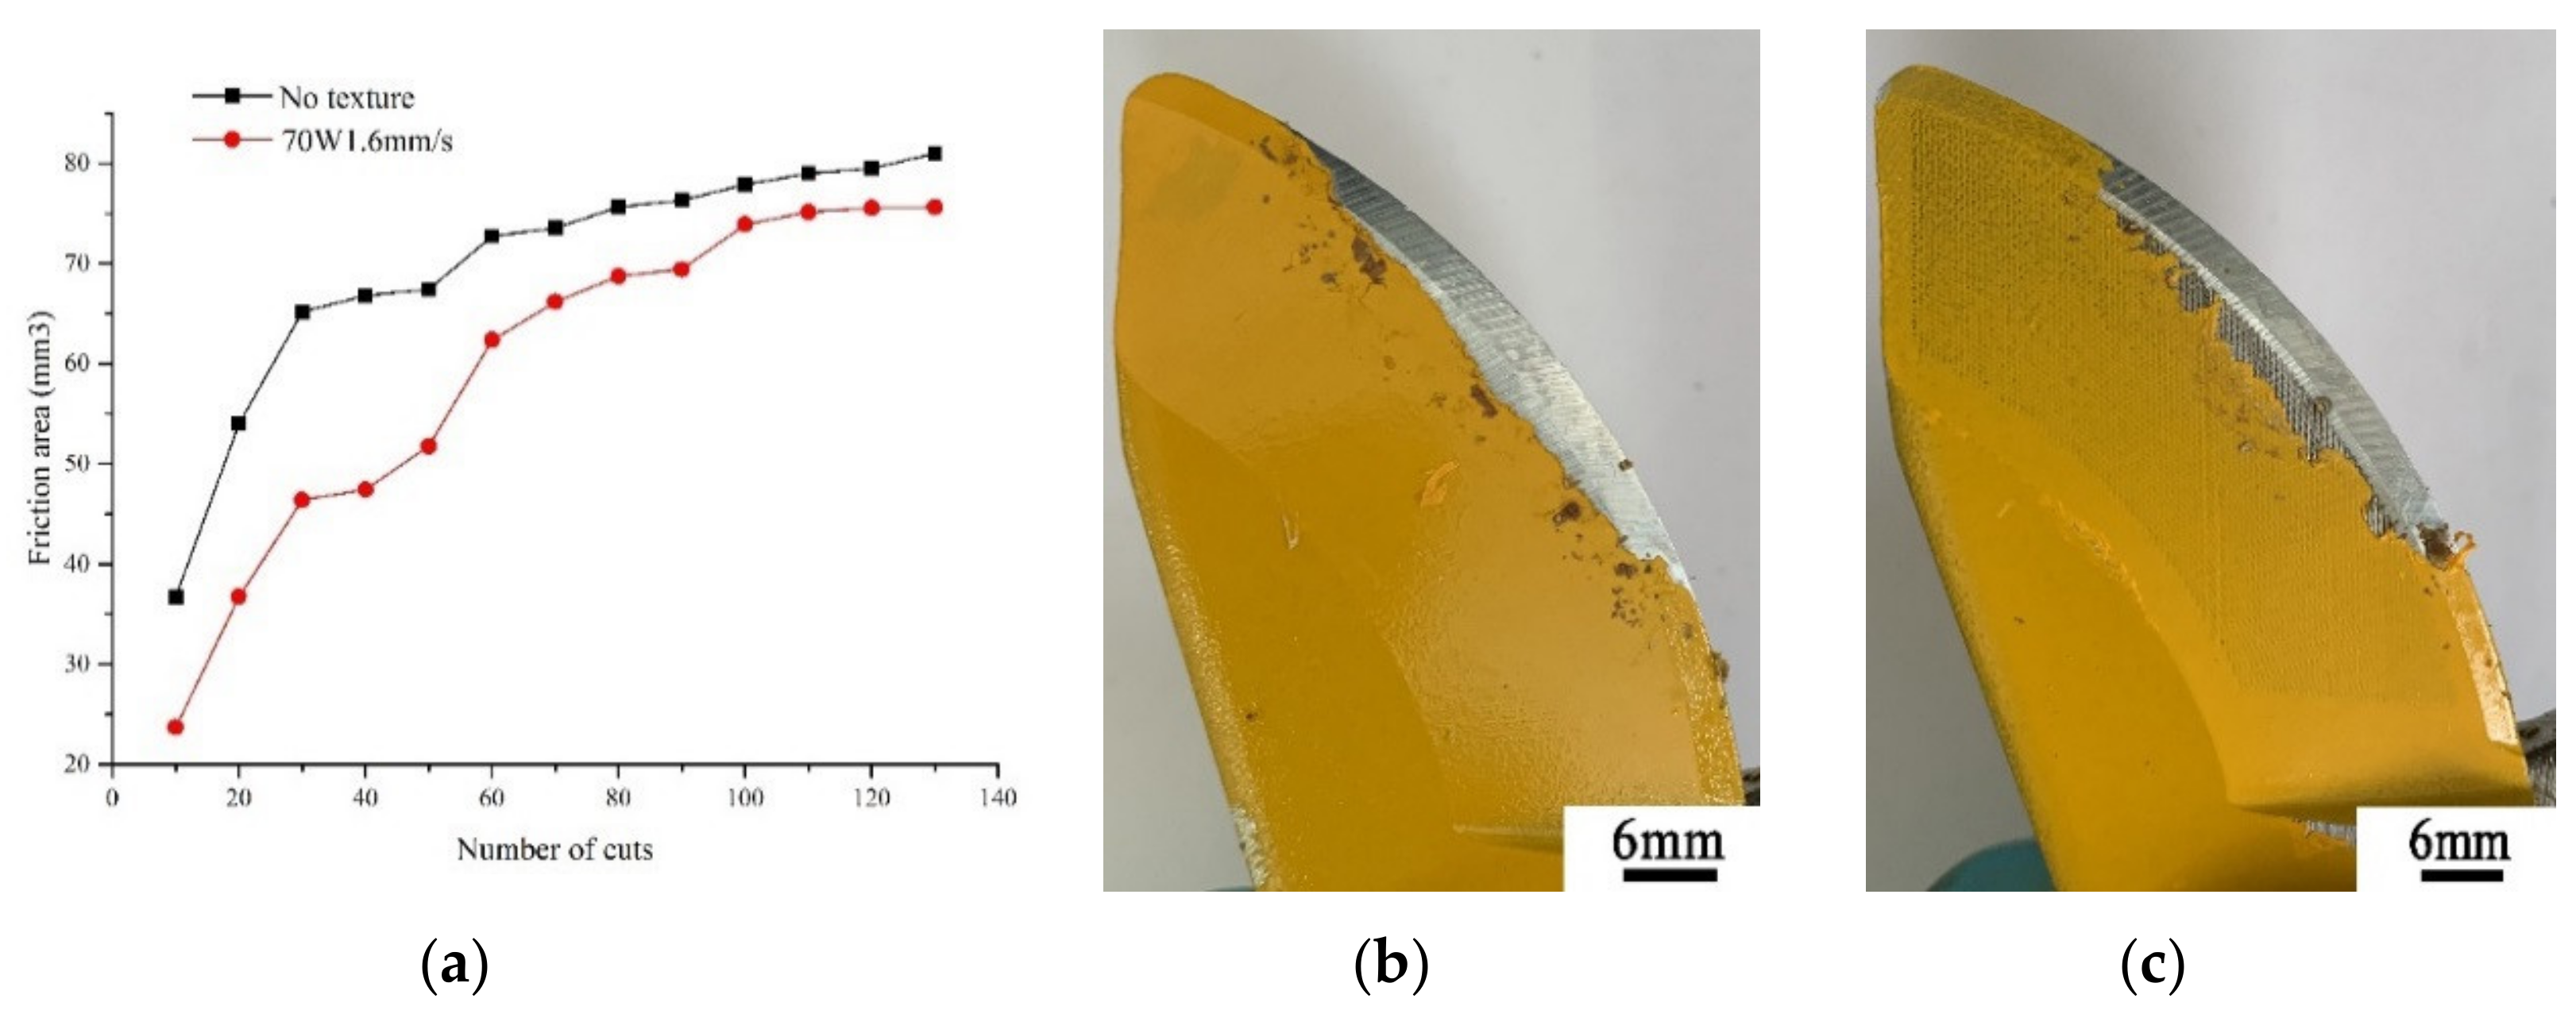
Figure 24a–c are the curves of the painted worn area of the pruner with the increasing number of cuts after cutting 10 mm-diameter branches and the actual pictures after cutting.
In Figure 24a above, while cutting 10 mm-diameter branches, the painted worn area of the non-textured pruner increases from 37 mm2 to 81 mm2 with increasing number of cuts, up by 44 mm2. The painted worn area grows slowly after 50~60 cuts, and it tends to be stable after 120~130 cuts. As for the textured pruner at the power of 70 W and speed of 1.6 mm/s, the pained worn area increases from 24 mm2 to 76 mm2 with increasing number of cuts, up by 52 mm2. The painted worn area grows slower after 100 cuts, and it stabilizes after 120 cuts. Compared with non-textured pruners, the painted worn area is reduced by 5 mm2 after stabilization. For 10 mm-diameter branches, the textured pruners show slight anti-wear performance.
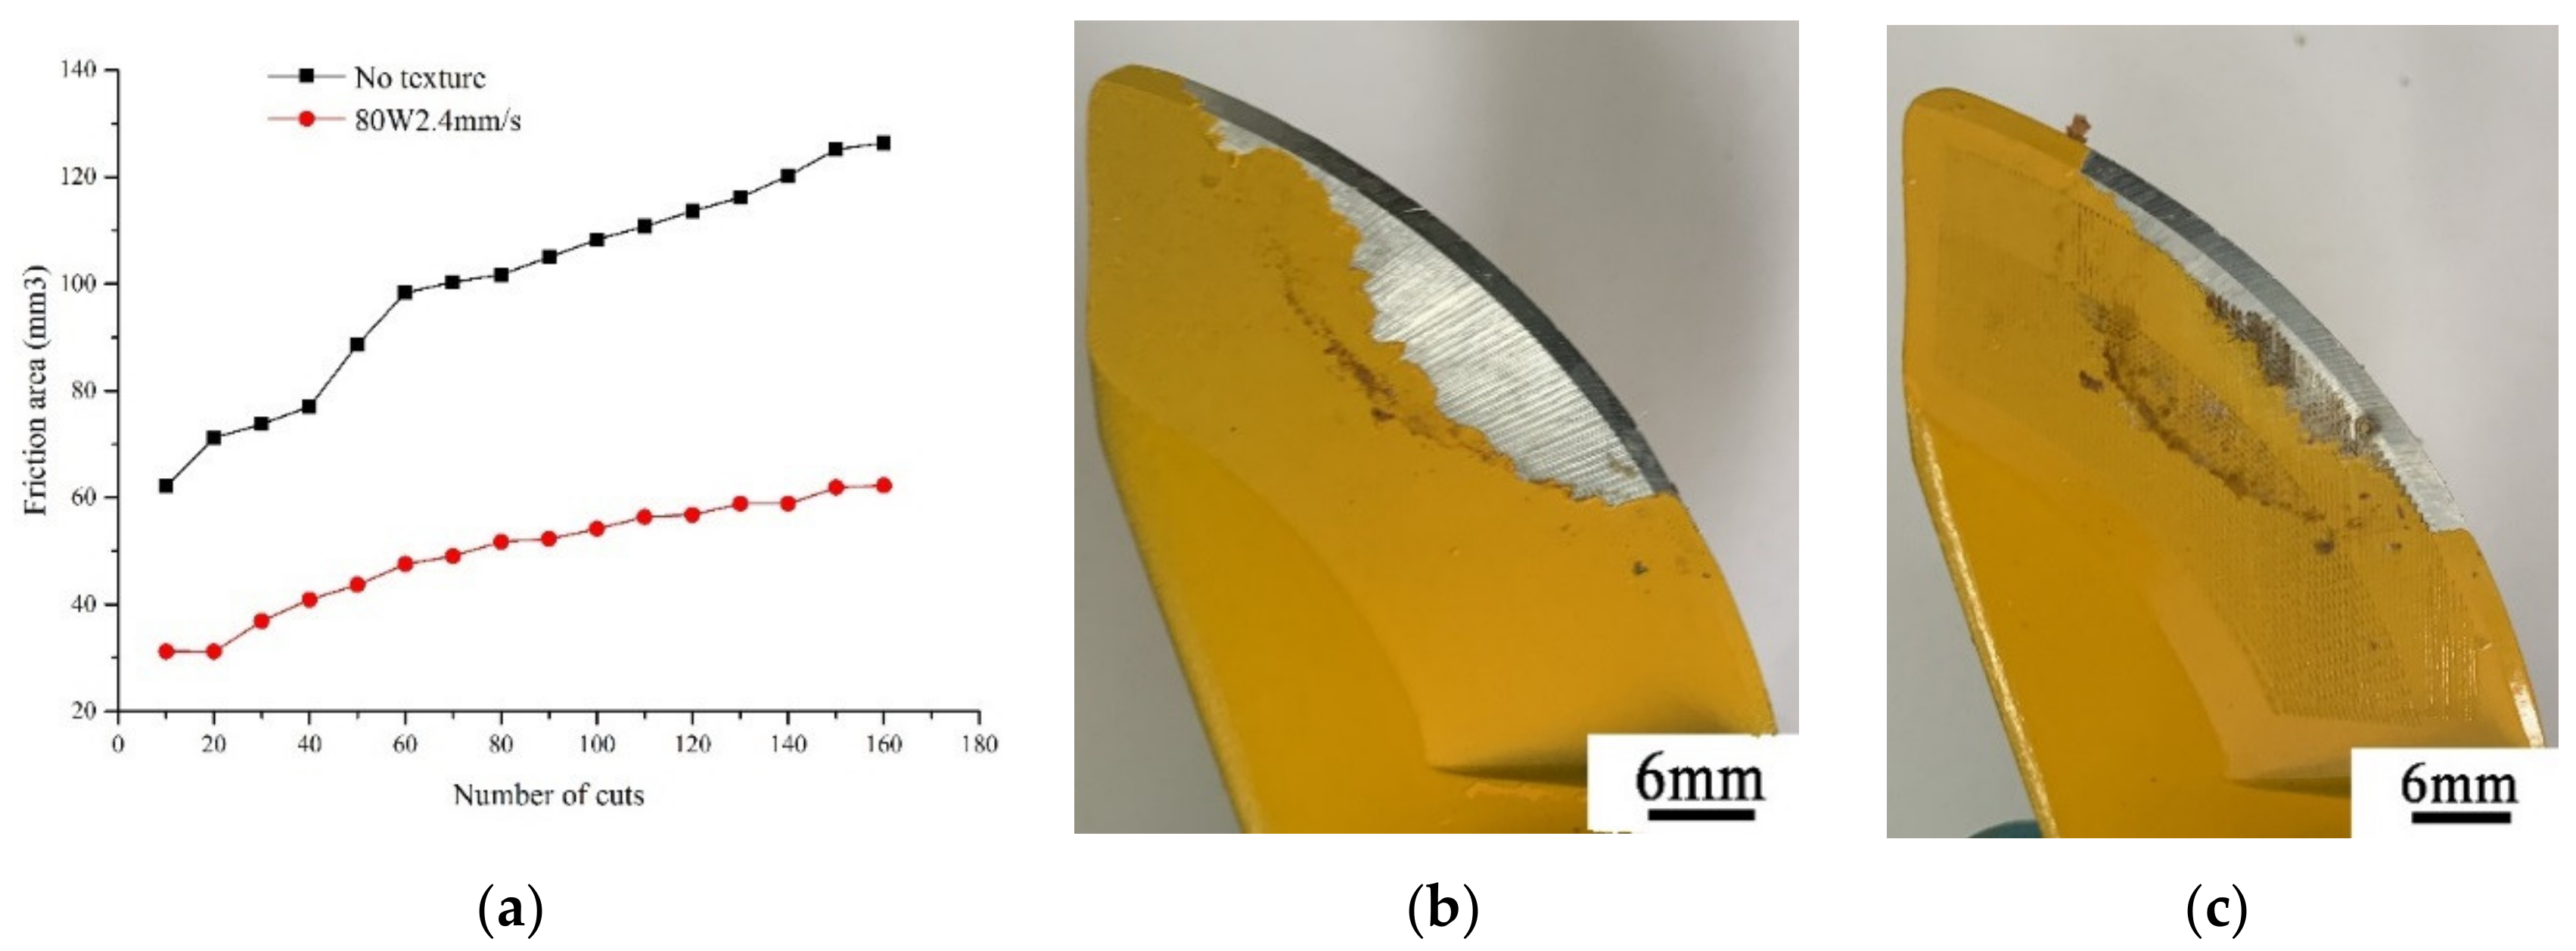
Figure 25a,b are the curves of the painted worn area of the pruner with the increasing number of cuts after cutting 15 mm-diameter branches and the actual pictures after cutting.
In Figure 25a, the painted worn area increases as the cutting times of the non-textured pruner and the textured pruner increase. For the non-textured pruner, the painted worn area increases from 62 mm2 to 130 mm2, up by 68 mm2. The increase in painted worn area slows down after 60~70 cuts, and the painted worn area becomes stable after 150~160 cuts. As for the textured pruner at the power of 80 W and speed of 2.4 mm/s, the pained worn area increases from 31 mm2 to 62 mm2 with increasing number of cuts, up by 31 mm2. The painted worn area grows slower after 30 cuts, and it stabilizes after 140 cuts. Compared with non-textured pruners, the painted worn area is reduced by 68 mm2, or 52% after stabilization. When cutting 15 mm-diameter branches, the textured pruners enter the wear plateau faster and the worn area is smaller, showing better anti-wear performance.
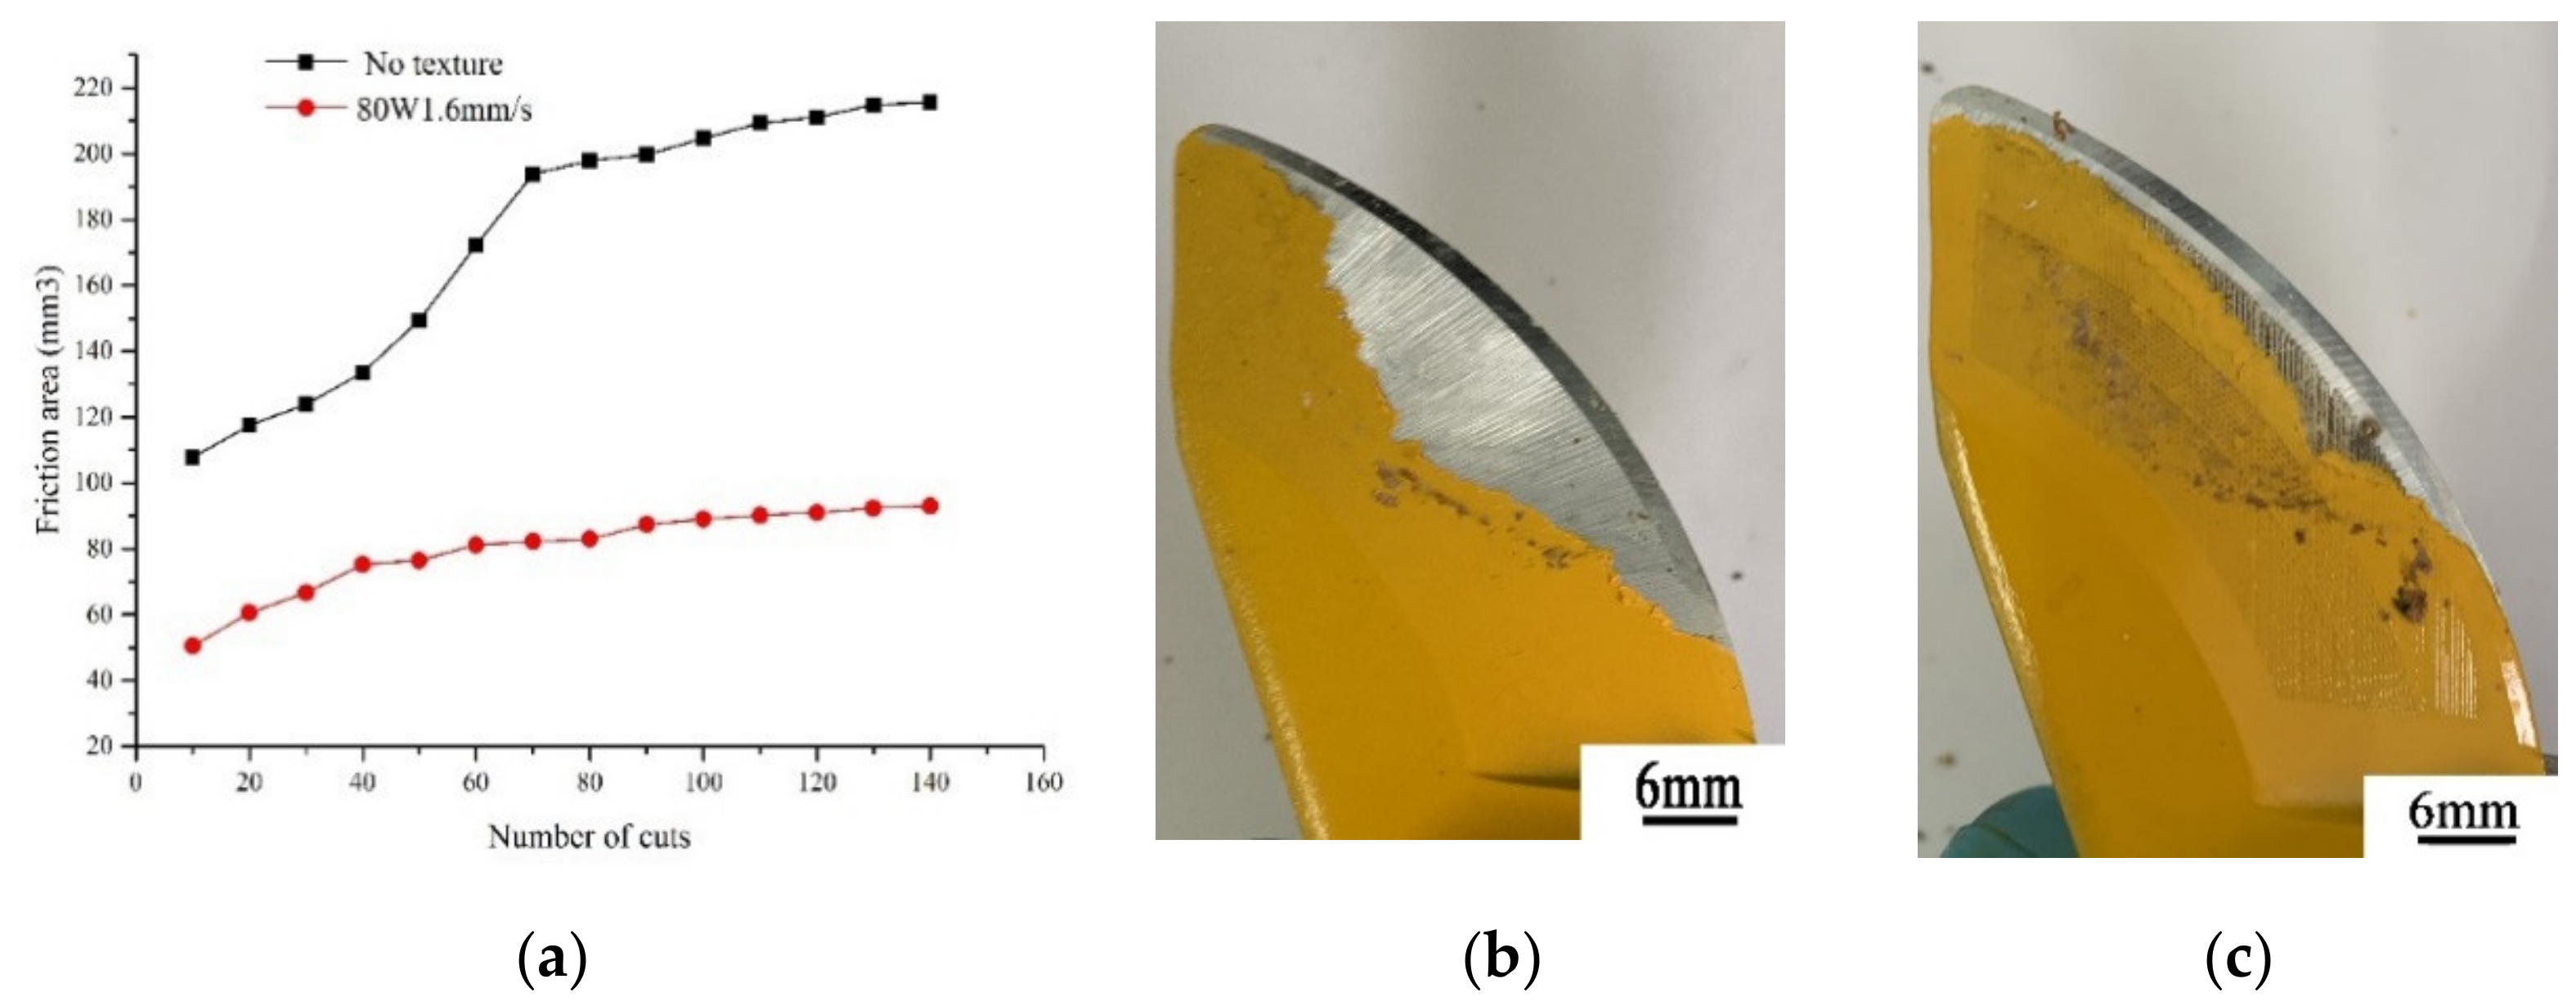
Figure 26a,b are the curves of the painted worn area of the pruner with the increasing number of cuts after cutting 20 mm-diameter branches and the actual pictures after cutting.
In Figure 26a, for the non-textured pruner, the painted worn area increases from 107 mm2 to 215 mm2, up by 108 mm2. The increase in painted worn area slows down after 70 cuts, and the painted worn area becomes stable after 130 cuts. As for the textured pruner at the power of 80 W and speed of 1.6 mm/s, the pained worn area increases from 50 mm2 to 93 mm2 with the increasing number of cuts, up by 43 mm2. The painted worn area stabilizes after 100 cuts. Compared with non-textured pruners, the painted worn area is 122 mm2 less, and reduced by 57%, which shows better stability and excellent anti-wear performance.
As the diameter of the branches increases, the depth of the moving blade cutting into the branches increases, and the maximum worn area of the pruner and the number of stable cuts increase. According to the growth of the worn area of the painted pruner, the painted worn area increases rapidly and then increases slower, which indicates that the front edge of the moving blade is greatly affected by the friction force while cutting into the branch, and is significantly affected by the increase in the extruding force of the branch. With increasing depth of cutting, under the influence of the blade inclination angle, the extruding force and friction force at the rear end of the moving blade decrease, and the painted worn area increases slowly. As the diameter of the branches increases, the worn area of the painted textured pruner is smaller than that of the non-textured pruner, because while cutting branches with larger diameters, the cutting depth of the blade and the friction area increase, and the surface of the textured pruner shows good anti-wear performance. Where the number of cuts is same, the worn area of the painted textured pruner is smaller. The more the diameter of the branches increases, the more obvious the anti-wear performance is, and the longer the service life of the pruner.

3.5. Analysis of Anti-Friction Theory Model

Figure 27 shows the cutting mechanism of ordinary and micro-textured pruners during the cutting process. For ordinary pruners, as shown in Figure 27a, during the cutting process, the pruner and the surface of the tree branch are squeezed by each other, generating a force to break the cutter. For textured pruners, as shown in Figure 27b, as there are grooves on the surface of the pruner, the contacting area of the pruner and branch is smaller, and the extruding force is less than that of ordinary pruners, the friction between the pruner and the branch is smaller. During the cutting process, for the textured pruner, the fine convex hull texture edge will squeeze part of the surface of the branch into the groove. The branch in the groove is affected by the direction of the groove during the cutting process, which changes the direction of the cutting movement, effectively increases the rake angle and reduces the shear force [33]. At the same time, because pressure on the pruner is directly proportional to the contact point, the micro texture reduces the contact length of the pruner and reduces the cutting force of the pruner [34].

4. Conclusions

In this paper, we mainly studied the forming parameters and anti-friction and anti-wear performance of the convex hull micro-textured pruner. The major conclusions are as follows: The forming parameters with the smallest friction coefficient in the trimming of 10/15/20 mm-diameter branches include the power of 70 W and speed of 1.6 mm/s, power of 80 W and speed of 2.4 mm/s, and power of 80 W and speed of 1.6 mm/s, respectively, as well as the convex hull spacing of 300 μm. The laser power affects the depth and width of the texture. The scanning speed has a strong influence on the texture depth only; in the calculation of shear theory, the positive pressure on the pruner is proportional to the modulus of elasticity, the moment of inertia, and the bevel angle, and is inversely proportional to the distance from the support point of the fixed knife to the positive pressure. The anti-wear performance of the textured pruner is not obvious at the load of 300 g, which is significant at the loads of 1000 g and 2000 g. The wear mechanism changes from the abrasive wear in the early stage to the oxidative wear and adhesive wear. When cutting 10 mm-diameter branches, the painted worn area of the textured pruner is 6% less than that of the non-textured pruners. When cutting 15 mm-dimeter branches, the painted worn area of the textured pruner is 52% less than that of the non-textured pruner. When cutting 20 mm-diameter branches, the painted worn area of the textured pruner is 57% less than that of the non-textured pruners. In all shear tests, the textured pruners enter the plateau faster than the non-textured tools.

Author Contributions

Conceptualization, J.S.; writing—Original Draft, J.S.; formal analysis, B.L.; methodology, B.L.; data curation, K.X.; software, Z.L.; funding acquisition, Z.Y. All authors have read and agreed to the published version of the manuscript.

Funding

This research was funded by the Pearl River Technology New Star Project of Guangdong Province (201710010105), the Natural Science Foundation Project of Guangdong Province (2019A1515011039), and the China Agriculture Research System (CARS-31-10). The authors wish to thank their generous financial assistance.

Conflicts of Interest

The authors declare no conflict of interest.

References

  1. National Bureau of Statistics. China Statistical Yearbook-2018; China Statistics Press: Beijing, China, 2018; (In Chinese with English abstract).
  2. Sahin, H.T.; Arslan, M.B. Properties of orchard pruning and suitability for composite production. Sci. Eng. Compos. Mater. 2013, 20, 337–342. [Google Scholar] [CrossRef]
  3. Ding, S.; Xue, X.; Cai, C.; Cui, L. Optimization and experiment of blade parameter for pear branches cutting device. Nongye Gongcheng Xuebao 2015, 31, 75–82. [Google Scholar]
  4. Velazquez, M.B.; Fernandez, G.E. The influence of mechanical pruning in cost reduction, production of fruit, and biomass waste in citrus orchards. Appl. Eng. Agric. 2010, 26, 531–540. [Google Scholar] [CrossRef]
  5. Martin-Gorriz, B.; Torregrosa, A.; Brunton, J.G. Post-bloom mechanical thinning for can peaches using a hand-held electrical device. Sci. Hortic. 2012, 144, 179–186. [Google Scholar] [CrossRef]
  6. Fu, W.; Liu, Y.; Kan, Z.; Pan, J.B.; Cui, J.; Zhang, H.M. The Situation and Expectation of Fruit Tree Pruning Machine. Agric. Mech. Res. 2017, 39, 7–11, (In Chinese with English abstract). [Google Scholar]
  7. Li, J.; Lu, H.; Yang, Z.; Lü, E.L. Orchard facilities and equipment for litchi and longan in China. In Proceedings of the 2011 American Society of Agricultural and Biological Engineers Annual International Meeting, Louisville, KY, USA, 7–10 August 2011; pp. 2421–2428. [Google Scholar]
  8. Wu, L.; Yang, Z.; Li, H.; Wu, W.; Lu, E.L. Experiment of mechanical properties of longan branch for pruning machine design. J. Hunan Agric. Univ. (Nat. Sci. Ed.) 2018, 44, 210–215, (In Chinese with English abstract). [Google Scholar]
  9. Poni, S.; Tombesi, S.; Palliotti, A.; Ughinia, V.; Gattia, M. Mechanical winter pruning of grapevine: Physiological bases and applications. Sci. Hortic. 2016, 204, 88–98. [Google Scholar] [CrossRef]
  10. Antonov, S.; Nikitenko, G.; Grinchenko, V.; Molchanov, A.; Avdeeva, V. Electromechanical secateurs based on linear electric motor and determination of cutting force of branches of fruit trees. Jelgava Latv. 2018, 514–518. [Google Scholar]
  11. Zhang, L.; Koc, A.B.; Wang, X.N.; Jiang, Y.X. A review of pruning fruit trees. IOP Conf. Ser. Earth Environ. Sci. 2018, 153, 6. [Google Scholar] [CrossRef]
  12. Etsion, I.; Burstein, L. A Model for Mechanical Seals with Regular Microsurface Structure. Tribol. Trans. 1996, 39, 677–683. [Google Scholar] [CrossRef]
  13. Gropper, D.; Wang, L.; Harvey, T.J. Hydrodynamic lubrication of textured surfaces: A review of modeling techniques and key findings. Tribol. Int. 2016, 94, 509–529. [Google Scholar] [CrossRef] [Green Version]
  14. Wu, S.; Gao, D.; Liang, Y.; Chen, B. Influence of non-smooth surface on tribological properties of glass fiber-epoxy resin composite sliding against stainless steel under natural seawater lubrication. Chin. J. Mech. Eng. 2015, 28, 1171–1176. [Google Scholar] [CrossRef]
  15. Wu, Z.; Xing, Y.; Huang, P.; Liu, L. Tribological properties of dimple-textured titanium alloys under dry sliding contact. Surf. Coat. Technol. 2017, 309, 21–28. [Google Scholar] [CrossRef]
  16. Janssen, A.; Pinedo, B.; Igartua, A.; Liiskmannc, G.; Sextondet, L. Study on friction and wear reducing surface micro-structures for a positive displacement pump handling highly abrasive shale oil. Tribol. Int. 2017, 107, 1–9. [Google Scholar] [CrossRef]
  17. Nakano, M.; Korenaga, A.; Korenaga, A.; Miyake, K.; Murakami, T.; Ando, Y.; Usami, H.; Sasak, S. Applying Micro-Texture to Cast Iron Surfaces to Reduce the Friction Coefficient Under Lubricated Conditions. Tribol. Lett. 2007, 28, 131–137. [Google Scholar] [CrossRef]
  18. Mezghani, S.; Demirci, I.; Zahouani, H.; Mansoria, M.E. The effect of groove texture patterns on piston-ring pack friction. Precis. Eng. 2012, 36, 210–217. [Google Scholar] [CrossRef] [Green Version]
  19. Guo, Z.; Xie, X.; Yuan, C.; Bai, X. Study on influence of micro convex textures on tribological performances of UHMWPE material under the water-lubricated conditions. Wear 2019, 426–427, 1327–1335. [Google Scholar] [CrossRef]
  20. Kümmel, J.; Braun, D.; Gibmeier, J.; Schneidera, J.; Greinera, C.; Schulzeab, V.; Wannera, A. Study on micro texturing of uncoated cemented carbide cutting tools for wear improvement and built-up edge stabilisation. J. Mater. Process Technol. 2015, 215, 62–70. [Google Scholar] [CrossRef]
  21. Han, Z.; Ren, L.; Liu, Z. Investigation on Anti-Wear Ability of Bionic Nonsmooth Surfaces Made by Laser Texturing. J. Tribol. 2004, 24, 289–293, (In Chinese with English abstract). [Google Scholar]
  22. Wang, L.; Guo, S.; Wei, Y.; Yuan, G. Experimental Study on the Influence of Surface Microtexture on the Tribological properties of 45# Steel Friction Pairs. Surf. Technol. 2018, 47, 149–154, (In Chinese with English abstract). [Google Scholar]
  23. Pang, M.; Nie, Y.; Shen, F.; Ma, L. Tribological Effect of Tool Surface Texturing on Tool-Chip Interface. Surf. Technol. 2018, 47, 109–118, (In Chinese with English abstract). [Google Scholar]
  24. Xiang, D.; Feng, H.; Guo, Z.; Zhang, L.; Wu, B. Preparation technology and properties of microtexture diamond-coated tools. Int. J. Refract. Metals Hard Mater. 2018, 76, 16–24. [Google Scholar] [CrossRef]
  25. Sasi, R.; Kanmani, S.S.; Palani, I.A. Performance of laser surface textured high speed steel cutting tool in machining of Al7075-T6 aerospace alloy. Surf. Coat. Technol. 2017, 313, 337–346. [Google Scholar] [CrossRef]
  26. Grzesik, W.; Niesłony, P.; Habrat, W.; Sieniawskib, J.; Laskowskic, P. Investigation of tool wear in the turning of Inconel 718 superalloy in terms of process performance and productivity enhancement. Tribol. Int. 2018, 118, 337–346. [Google Scholar] [CrossRef]
  27. Obikawa, T.; Kamio, A.; Takaoka, H.; Osadac, A. Micro-texture at the coated tool face for high performance cutting. Int. J. Mach. Tools Manuf. 2011, 51, 966–972. [Google Scholar] [CrossRef]
  28. ASTM. Standard Test Method for Determining the High Stress Abrasion Resistance of Hard Materials; ASTM International: West Conshohocken, PA, USA, 2018. [Google Scholar]
  29. Liu, C.; Zhu, L.; Bu, W.; Liang, Y. Superhydrophobic surfaces: From nature to biomimetic through VOF simulation. Micron 2018, 107, 94–100. [Google Scholar] [CrossRef]
  30. Wang, W.; Wu, L.; Yang, Z.; Lu, H.; Wang, L.; Guo, X. Development and verification of a mathematical model of straight blade cutting longan branches. J. South China Agric. Univ. 2016, 37, 105–111, (In Chinese with English abstract). [Google Scholar]
  31. Liu, H. Material Mechanics, 5th ed.; Higher Education Press: Beijing, China, 2011; (In Chinese with English abstract). [Google Scholar]
  32. Shen, L.; Zhang, Q.; Song, J. Wear behavior under high temperature and lubrication condition of Fe-based alloy coating formed by laser cladding. Strong Laser Particle Beam 2009, 21, 1628–1632, (In Chinese with English abstract). [Google Scholar]
  33. Liu, Y.; Deng, J.; Wang, W.; Duan, R.; Xing, Y. Characterization of green Al2O3ceramics surface machined by tools with textures on flank-face in dry turning. Int. J. Appl. Ceram. Technol. 2019, 16, 1159–1172. [Google Scholar] [CrossRef]
  34. Guo, D.; Guo, X.; Zhang, K.; Chen, Y.; Zhou, C.; Gai, L. Improving cutting performance of carbide twist drill combined internal cooling and micro-groove textures in high-speed drilling Ti6Al4V. Int. J. Adv. Manuf. Technol. 2019, 100, 381–389. [Google Scholar] [CrossRef]
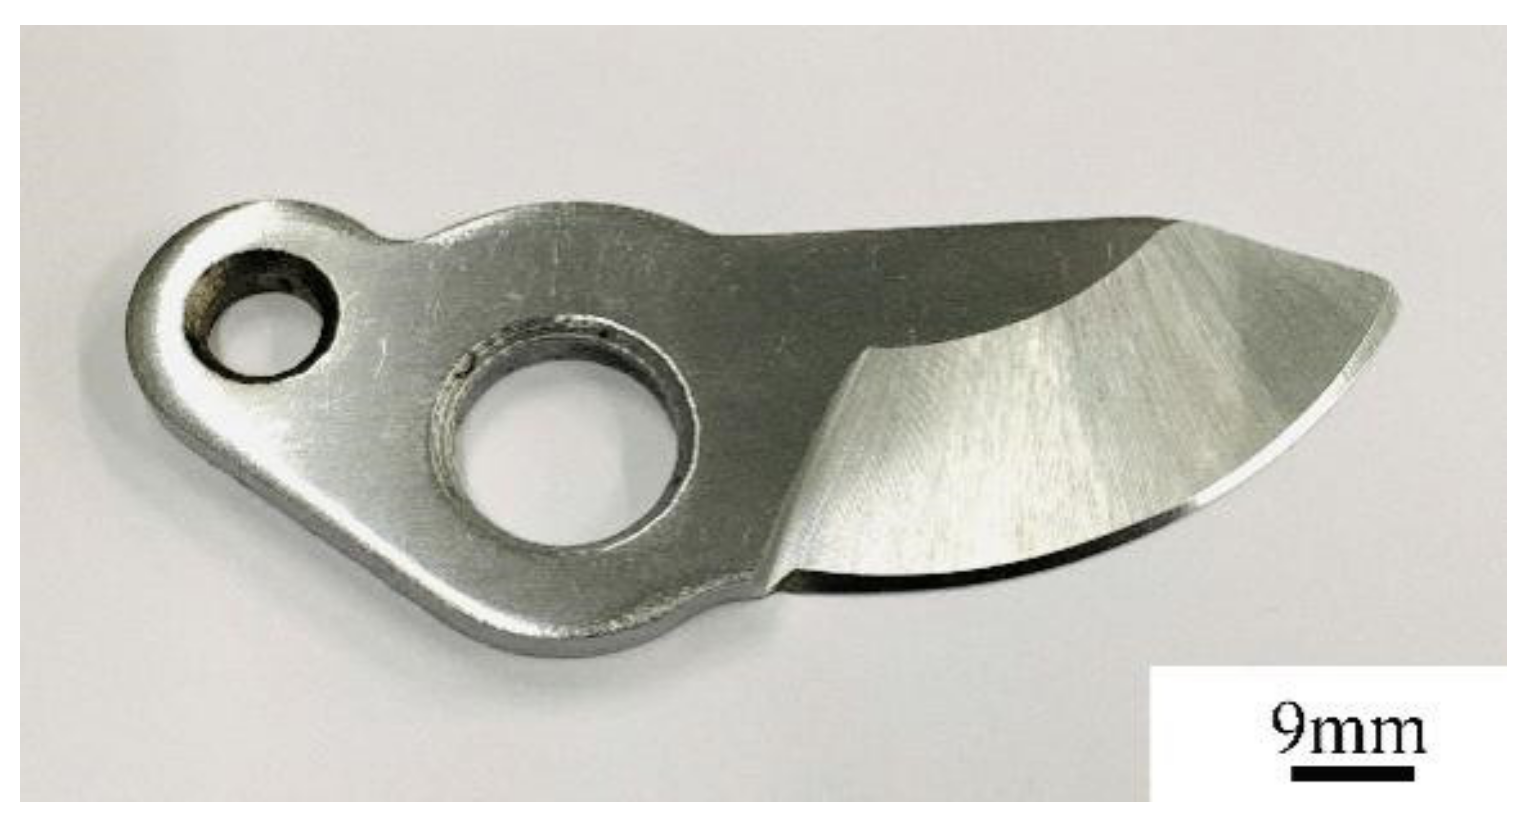
Figure 1. SK-5 High-carbon steel pruner.
Agronomy 10 01866 g001
Figure 2. Laser manufacturing workstation of industrial robot.
Agronomy 10 01866 g002
Figure 3. Branch sample.
Agronomy 10 01866 g003
Figure 4. Shearing platform of universal tester.
Agronomy 10 01866 g004
Figure 5. Self-made fixture structure diagram.
Agronomy 10 01866 g005
Figure 6. HT-500 high temperature friction and wear tester.
Agronomy 10 01866 g006
Figure 7. Schematic diagram of the friction and wear test.
Agronomy 10 01866 g007
Figure 8. Self-made electric pruning deck.
Agronomy 10 01866 g008
Figure 9. Canna leaf and Convex-hull textured pruner: (a) Canna leaf; (b) enlarged structure of Canna leaf; (c) convex-hull textured pruner. (Laser power: 70 W, scanning speed: 3.2 mm/s).
Agronomy 10 01866 g009
Figure 10. Microtexture geometry change with laser power and scanning speed: (a) width; (b) depth.
Agronomy 10 01866 g010
Figure 11. Microtexture morphologies under different laser powers at 1.6 mm/s scanning speed: (a) 60 W microtexture; (b) 70 W microtexture; (c) 80 W microtexture.
Agronomy 10 01866 g011
Figure 12. Force diagram of the moving knife during pruning.
Agronomy 10 01866 g012
Figure 13. Schematic diagram of the pruned branch.
Agronomy 10 01866 g013
Figure 14. Beam bend under the action of the extruding force of the moving knife.
Agronomy 10 01866 g014
Figure 15. Force diagram of shear theory.
Agronomy 10 01866 g015
Figure 16. The actual force of static pressure shearing of branches.
Agronomy 10 01866 g016
Figure 17. Curves of the friction coefficient of different pruners over time under different loads: 300 g-load (a) laser power 60 W, (b) laser power 70 W, (c) laser power 80 W; 1100 g-load (d) laser power 60 W, (e) laser power 70 W, (f) laser power 70 W; 2000 g-load (g) laser power 60 W, (h) laser power 70 W, (i) laser power 80 W.
Agronomy 10 01866 g017aAgronomy 10 01866 g017b
Figure 18. Curve of average volumetric wear loss with various loads.
Agronomy 10 01866 g018
Figure 19. Wear scar morphology of convex-hull textured pruner at different loads: (a) wear scar at the load of 300 g; (b) wear scar at the load of 1100 g; (c) wear scar at the load of 2000 g; (d) wear scar of non-textured pruner at the load of 2000 g.
Agronomy 10 01866 g019
Figure 20. SEM and EDS images of the 70 W power group at 1.6 mm/s and at the load of 300 g: (a) wear scar morphology; (b) enlarged view of wear scar; (c) enlarged view of worn convex hull; (d) enlarged view of part of the worn area in Figure c; (e) elemental line analysis chart of Figure d; (f) enlarged view of part of the worn area in Figure c.
Agronomy 10 01866 g020
Figure 21. SEM image of wear of the 80 W power group at 2.4 mm/s at the load of 1100 g: (a) wear scar morphology; (b) enlarged view of micro-textured wear; (c) enlarged view of; (b) texture wear and tear image.
Agronomy 10 01866 g021
Figure 22. SEM image of the 80 W power group 1.6 mm/s at the load of 2000 g: (a) wear scar morphology; (b) enlarged view of localized wear; (ce) enlarged view of textured wear; (f) enlarged view of (e) abrasive particles.
Agronomy 10 01866 g022
Figure 23. It is the EDS data of Figure 22f.
Agronomy 10 01866 g023
Figure 24. Shear test on the 10 mm-diameter branch: (a) relationship between worn area and number of cuts; painted worn area: (b) non-textured pruner, (c) textured pruner at the power of 70 W and speed of 1.6 mm/s.
Agronomy 10 01866 g024
Figure 25. Shear test on the 15 mm-diameter branch; (a) relationship between worn area and number of cuts; painted worn area. (b) Non-textured pruner, (c) textured pruner at the power of 80 W and speed of 2.4 mm/s.
Agronomy 10 01866 g025
Figure 26. Shear test on the 20 mm-diameter branch: (a) relationship between worn area and number of cuts; painted worn area. (b) Non-textured pruner, (c) textured pruner at the power of 80 W and speed of 1.6 mm/s.
Agronomy 10 01866 g026
Figure 27. The cutting process of ordinary pruners and micro-textured pruners: (a) the cutting process of ordinary pruners; (b) the cutting process of textured pruners.
Agronomy 10 01866 g027
Table 1. Chemical component of SK-5 high-carbon steel.
ElementCSiMnPSCrNiCuFe
Weight (%)0.80–0.900.10–0.350.10–0.50≤0.030≤0.030≤0.250≤0.200≤0.300Residual
Table 2. Specific parameters of laser processing equipment.
Laser ModelCentral Wavelengt (nm)Modulation Frequency (KHz)Power Range (W)Fiber Core Diameter (μm)
YLR-500-MM-WC1070 ± 100–5010–50050
Table 3. Main performance parameters of YG6 tungsten steel ball.
WC%Co%Density (g/cm)Hardness (HRA)Tensile Strength (MPa)Abrasion Resistance (N/cm)
94614.5–14.9921451380
Table 4. Performance parameters of the friction and wear tester.
Spindle Speed of Friction Pair (r/min)High-Temperature Furnace Heating Temperature (°C)Loading Range (N)Coefficient of FrictionDisplay Accuracy (FS)
200–2800Room temperature-5001–200.001–21.000.2%
Table 5. Wear test parameters.
Load (g)Wear Time (min)Radius of Steel Ball (mm)Wear Radius (mm)Rotating Speed (r/min)Test Temperature (°C)
300/1100/2000602.5220026
Table 6. Theoretical and experimental shear data.
ParameterData
Branch diameter10 mm15 mm20 mm
Positive pressure303 N1066 N2675 N
Test value415 N1632 N1910 N
Wear test load300 g1100 g2000 g
Table 7. Average friction coefficients of all factor tests under different loads.
Pruner TypeLoad/g
30011002000
Average Friction Coefficient
Non-textured pruner0.16850.37470.2392
60 W 1.6 mm/s0.27570.44100.2477
60 W 2.4 mm/s0.21900.31580.2099
60 W 3.2 mm/s0.22900.31980.1983
70 W 1.6 mm/s0.16670.25210.2836
70 W 2.4 mm/s0.23640.28080.1709
70 W 3.2 mm/s0.17710.24680.1405
80 W 1.6 mm/s0.23130.26680.1209
80 W 2.4 mm/s0.25050.23780.1335
80 W 3.2 mm/s0.23670.23950.1262
Table 8. Wear test data.
Pruner TypeLoad (g)Wear Scar Width (mm)Volumetric Wear Loss (mm3)Volumetric Wear Rate (%)
Non-textured pruner300
1100
2000
0.134
0.397
0.422
11.8189
35.8454
42.2921
0.0350
0.1061
0.1251
60 W 1.6 mm/s300
1100
2000
0.365
0.446
0.422
31.1930
37.8902
64.2311
0.0923
0.1121
0.1901
60 W 2.4 mm/s300
1100
2000
0.307
0.423
0.665
24.0573
33.2013
77.2919
0.0712
0.0983
0.2288
60 W 3.2 mm/s300
1100
2000
0.300
0.388
0.367
23.9707
30.3255
40.5797
0.0775
0.0898
0.1201
70 W 1.6 mm/s300
1100
2000
0.382
0.400
0.503
26.1805
29.9472
50.1615
0.0775
0.0887
0.1485
70 W 2.4 mm/s300
1100
2000
0.351
0.477
0.467
29.7963
34.7733
47.2318
0.0882
0.1029
0.1398
70 W 3.2 mm/s300
1100
2000
0.354
0.390
0.343
39.7081
34.9197
52.5880
0.1175
0.1034
0.1557
80 W 1.6 mm/s300
1100
2000
0.378
0.458
0.523
33.7938
42.9274
83.2349
0.1000
0.1270
0.2464
80 W 2.4 mm/s300
1100
2000
0.367
0.445
0.574
30.3992
40.6048
69.7000
0.0899
0.1202
0.2063
80 W 3.2 mm/s300
1100
2000
0.376
0.457
0.528
35.9052
39.5301
78.5542
0.1063
0.1170
0.2325
Table 9. Figure 20c EDS data.
Spectrum LabelsCOSiFeW
EDS 10.231.540.2398.00
EDS 20.6228.7560.739.90
EDS 30.1527.7860.8011.27
Table 10. EDS data of Figure 22e.
Spectrum LabelsCOFeW
EDS0.3524.4363.5511.68
Publisher’s Note: MDPI stays neutral with regard to jurisdictional claims in published maps and institutional affiliations.