Article

Linking Cover Crop Residue Quality and Tillage System to CO2-C Emission, Soil C and N Stocks and Crop Yield Based on a Long-Term Experiment

by
Otávio A. Leal
1,2,*,
Telmo J. C. Amado
1,
Jackson E. Fiorin
3,4,
Cristiano Keller
1,
Geovane B. Reimche
1,
Charles W. Rice
5,
Rodrigo S. Nicoloso
6,
Rafael P. Bortolotto
4 and
Rai Schwalbert
1
1
Soils Department, Federal University of Santa Maria, 97105-900 Santa Maria, RS, Brazil
2
Institute of Bio- and Geosciences, IBG-3: Agrosphere, Forschungszentrum Jülich GmbH, 52425 Jülich, Germany
3
Cooperativa Central Gaúcha Ltd.a, 98005-970 Cruz Alta, RS, Brazil
4
Department of Agronomy, University of Cruz Alta, 98020-290 Cruz Alta, RS, Brazil
5
Department of Agronomy, Kansas State University, Manhattan, KS 66506, USA
6
Embrapa Swine and Poultry, 89715-899 Concordia, SC, Brazil
*
Author to whom correspondence should be addressed.
Agronomy 2020, 10(12), 1848; https://doi.org/10.3390/agronomy10121848
Submission received: 16 October 2020 / Revised: 13 November 2020 / Accepted: 16 November 2020 / Published: 24 November 2020
(This article belongs to the Special Issue Conservation Tillage in Sustainable Agro-Ecosystems)

Abstract

:
Cover crops (CC), particularly legumes, are key to promote soil carbon (C) sequestration in no-tillage. Nevertheless, the mechanisms regulating this process need further elucidation within a broad comprehensive framework. Therefore, we investigated effects of CC quality: black oat (Avena strigosa Schreb) (oat), common vetch (Vicia sativa L.) (vetch), and oat + vetch on carbon dioxide-C (CO2-C) emission (124 days) under conventional- (CT), minimum- (MT) and no-tillage (NT) plots from a long-term experiment in Southern Brazil. Half-life time (t1/2) of CC residues and the apparent C balance (ACB) were obtained for CT and NT. We linked our data to long-term (22 years) soil C and nitrogen (N) stocks and crop yield data of our experimental field. Compared to CT, NT increased t1/2 of oat, oat + vetch and vetch by 3.9-, 3.1- and 3-fold, respectively; reduced CO2-C emissions in oat, oat + vetch and vetch by 500, 600 and 642 kg ha−1, respectively; and increased the ACB (influx) in oat + vetch (195%) and vetch (207%). For vetch, CO2-C emission in MT was 77% greater than NT. Legume CC should be preferentially combined with NT to reduce CO2-C emissions and avoid a flush of N into the soil. The legume based-NT system showed the greatest soil C and N sequestration rates, which were significantly and positively related to soybean (Glycine max (L.) Merrill) and maize (Zea mays L.) yield. Soil C (0–90 cm depth) and N (0–100 cm depth) sequestration increments of 1 kg ha−1 corresponded to soybean yield increments of 1.2 and 7.4 kg ha−1, respectively.

1. Introduction

One-third of the soils worldwide are degraded and losing productivity [1], while only 10% of agricultural lands are improving in soil health [2]. Based on the world’s growing population and climate change projections, this scenario may aggravate, threatening food security and urging for the increase of crop yield and mitigation of greenhouse gas (GHG) emissions to the atmosphere [3].
Native ecosystems converted to agriculture cover at least one-third of the global terrestrial ecosystems, resulting in depletion of soil organic carbon (SOC) stock >25–30% [4]. Modeling projections onto a world without agriculture suggest a global soil carbon (C) debt of 133 petagrams (0–2 m depth) due to this activity, with SOC loss rates drastically increasing in the past 200 years [5]. Conservation agriculture (CA) systems that include no-tillage (NT), and the use of cover crops (CC) are efficient tools to mitigate GHG emissions [6], and to enhance soil health and crop yields [7], while addressing societal concerns of food and environmental security.
Although CA has been implemented on 180 Mha worldwide (12.5% of the global cropland) by 2016 [8], the three interconnected principles of CA (no or minimum mechanical soil disturbance, permanent soil cover and crop rotation) are hardly fully applied, which compromises soil environmental services and health [1,9]. In Brazil, NT increased from 1 to 35 Mha between the 1980s and 2016, which closely accompanied the expansion of soybean area, from nearly 9 to 34 Mha in the same period [8,10]. Studies in Southern Brazil demonstrated that long-term NT combined with intensive and diverse cropping systems partially or entirely restored SOC stocks in Oxisols compared to native vegetation reference sites [11,12]. Nevertheless, the C and nitrogen (N) balance in most NT soybean lands in Brazil is often neutral or negative [13], suggesting the lack of crop diversity limits SOC and N storage increments. Optimizing SOC storage in NT is key to meet Brazil’s goal to reduce its GHG emissions by 37% below 2005 levels by 2025 [14].
Depending on crop residue quality and soil tillage, among other factors, residues can undergo varied decomposition rates in the soil [15]. The emission of C as carbon dioxide (CO2-C) due to crop residues decomposition may contribute substantially (approx. 50%) to the total CO2 emitted from terrestrial agroecosystems to the atmosphere [16,17]. Additionally, the dynamics of residue decomposition affect the flush of organic compounds and N entering the soil and the allocation of C and N derived from these residues in different soil compartments, ultimately influencing the potential of cropping systems as CO2 sink or source [18,19,20].
According to Cotrufo et al. [21], the particulate organic matter (POM) predominantly consists of plant derived-compounds with low N content, and persists in the soil through biochemical recalcitrance, occlusion in aggregates and/or microbial activity inhibition. Whereas, according to these authors, the organic matter (OM) associated with soil minerals (OMAM) consists of N-rich microbial products, and persists in the soil longer than POM due to chemical interactions with minerals and occlusion in small aggregates. High-quality biomass (i.e., low C/N ratio) amendment is shown to increase the content of high-N microbial compounds in the soil, especially fungal products [22]. These compounds stimulate organo-mineral associations and aggregate formation, and therefore SOC stabilization, especially in NT [21,23,24,25]. In addition, the positively charged functional groups of N-rich microbial products may preferentially adsorb to mineral surfaces compared to C-rich compounds [26]. Accordingly, Arachchige et al. [27] reported that bacterial/hyphal debris and clay association confer greater stability to small microaggregates (20–53 µm) in comparison with fungal and plant debris in larger microaggregates (53–250 µm).
Different studies suggest that once legumes may add proportionally more N to soil compared to grasses, it may potentially increase SOC sequestration, particularly in NT, where residues are decomposed more gradually [22,23]. Accordingly, for a subtropical Ferric Oxisol, Sisti et al. [13] reported that, in crop rotations including N2-fixing plants as vetch, the SOC stock (0–1 m depth) in NT was 17.0 Mg ha−1 greater compared to conventional tillage (CT). This study corroborates findings of a 30-year old experiment carried out in a Subtropical Brazilian Acrisol, where the SOC sequestration rate in NT with legume CC was 0.5 and 1.2 Mg ha−1 year−1 (0–1 m depth) greater in relation to the NT without legumes and to the counterpart CT, respectively [28]. Yet, the authors reported that crop rotations that included vetch and maize stimulated native soil OM decomposition in CT, but not in NT. In a Ferralsol in Southern Brazil, Santos et al. [29] reported that even though the grass-based crop rotation (oat–maize–wheat–soybean) added 13% more C to the soil compared with the legume-based rotation (vetch–maize–wheat–soybean), it promoted a SOC sequestration rate 43% lower. According to Cotrufo et al. [21], OMAM confers slow soil OM turnover rates, but it may require the input of high-quality crop residues to accumulate, while POM is more sensitive to tillage but its accumulation in the soil is less dependent on high-quality residues. Furthermore, slower CC residue decomposition and N release to soil may attenuate N loss and favor N use efficiency in NT compared to CT [30].
The role of legumes to enhance N supply to subsequent crops is well-documented [31,32,33]. However, legume CC may not necessarily increase soil C and N stocks and cash crop yields in CT when compared to grass CC [34,35]. Moreover, long-term studies relating CC quality to crop yield in different tillage systems are less known [36], discouraging farmers to use high-quality CC in NT croplands.
Studies conducted in the long-term field experiment (began in 1985) in Cruz Alta, Southern Brazil, where the present study was developed, revealed that compared to CT, NT promoted greater: geometric mean diameter of aggregates, aggregates stability and C occlusion in aggregates [37,38]; POM content and quality (lower C/N ratio) as well as C management index [39]; soil C and N sequestration rates and stocks [30,40,41,42]; soil OM stability [27,38]; total fungal and arbuscular mycorrhizal fungal biomass [43,44]; and grain crop yields [45], and lower CO2-C emissions [46], especially in crop rotations including vetch. Most of these studies had specific objectives, which should be interlinked to improve our understanding on mechanisms of SOC sequestration in NT.
Taking into account the importance of legume CC for SOC sequestration in NT and our long-term experiment databases, we aimed to: (a) improve our understanding on how vetch contributes to increase SOC sequestration in NT; (b) interlink our findings with our databases to investigate relations between CC decomposition, GHG emissions, soil C and N stocks and crop yields. For that, we studied how CO2-C emissions and the apparent C balance (ACB) were affected by CC quality: black oat (Avena strigosa Schreb) (oat), common vetch (Vicia sativa L.) (vetch) and oat + vetch under different tillage systems. We hypothesize that compared to CT, NT: (i) slows CC residue decomposition and reduces CO2-C emission; (ii) increases ACB (C influx) and thus iii) increases soil C and N stocks, which are related to soybean (Glycine max (L.) Merrill) and maize (Zea mays L.) yield, especially if NT is combined with legume CC.

2. Materials and Methods

2.1. Experimental Site

Prior to 1965 the experimental site was under open araucaria woodland (Araucaria angustifolia) and native grass vegetation (Paspalum notatum Fluegge) [47]. Between 1965 and 1980, the area was under CT, continuous wheat/soybean and poor soil management (burn of crop residues, long fallow periods and frequent disk operation to control fallow weeds) [47]. From 1980 to 1985, the site was under reduced tillage [47]. In 1985, the experiment was initiated to investigate CA systems and crop rotations to soybean production to support farmers that started to adopt NT in Southern Brazil.
The experiment site is located in Cruz Alta (28°83′30″ S, 53°84′00″ W), Brazil, 409 m above sea level and slope of 4.7%. The climate is humid subtropical (Cfa according to Koppen’s classification). The average annual precipitation is 1774 mm and air temperature is 19.2 °C. The soil (Oxisol) is a Typic Hapludox [48], with average clay, silt and sand contents (0–20 cm depth) of 51.5, 23.5 and 25.0%, respectively. Kaolinite and iron and aluminum oxides are the dominant minerals in clay [46]. Iron content is 63.5 g kg−1, and hematite predominates over goethite [49].
In this experimental site, CT and NT are the main plots and three crop rotations are conducted in the subplots: R0—continuous wheat (Triticum aestivum L.)/soybean; R1—winter crop rotation wheat/soybean/black oat/soybean; and R2—full crop rotation (summer and winter) black oat/soybean/black oat + common vetch/maize/oilseed radish (Raphanus sativus var. oleiferus Metzg.)/wheat/soybean. Details on fertilization, liming and experiment conduction are available in previous papers [11,30,41,43,46,47,49,50,51].

2.2. Evaluations of CO2-C in Different Tillage and Cover Crop Combinations

2.2.1. Treatments and Practices

The CO2-C emission experiment was conducted in a split-plot randomized complete block design (four replicates), with three tillage systems in the main plot: CT, minimum tillage (MT), and NT; and four CC types in the subplot (40 × 60 m): no cover crop—bare soil (ncc), black oat (oat), black oat+common vetch (oat + vetch), and common vetch (vetch), totaling 48 experimental units. This CO2-C experiment was conducted on CT and NT experimental plots described in Section 2.1. CO2-C evaluations in MT treatments were conducted in adapted NT plots once the original experiment design has CT and NT plots only, as previously described in Section 2.1. Treatments having only oat as CC were installed in R1 subplots, because R1 has only grasses in winter rotation. Treatments having oat + vetch were installed in R2 subplots, because R2 includes grass and grass+legume in winter rotation. For vetch (alone) treatments, the residues of oat + vetch in R2 subplots were replaced with only vetch residues.
Before tillage operations for soybean planting, the CC (oat, oat + vetch, vetch) were sprayed with glyphosate herbicide [N-(phosphonomethyl) glycine] 1.5 L ha−1. In CT, the CC residues were incorporated into the soil with complete soil turn using a four blade disk plow to a depth of 0.20 m, followed by two passes with a tandem disk containing 36 blades to a depth of 0.15 m. For MT, the CC residues were partially incorporated into the soil (around 30%) with limited disturbance using a five shanks (spaced in 0.35 m) chisel plow (Jumbo Matic®) operating at 0.25 cm depth. In NT, the CC residues were left on the soil surface as mulch. Soybean planting and fertilization were performed using a NT seeder with 17 rows spaced 0.45 m (Model Semeato SHM 15/17) 10 days after CC dissection. All plots were fertilized at seeding with 50 kg ha−1 of phosphorus (P2O5) and potassium (K2O) and no N. The source of P was triple superphosphate (41% P2O5) and of K was potassium chloride (65% K2O).

2.2.2. CO2-C Emission Measurements

The CO2 emission was quantified in situ using an infrared CO2 gas flux analyzer (LI-COR 8100, Lincoln, NE, USA), which uses an infrared absorption spectrometer to measure CO2 and H2O concentration inside a chamber. The chamber, which is a closed system, was placed at the top of a PVC pipe (20 cm diameter, 4823.9 cm3 inner volume, and 317.8 cm2 circular soil contact area) previously pressed into the soil at 0.10 m depth at each experimental unit. After soybean sowing, the chambers were inserted into the soil between crop rows to reduce root account for CO2 measurements. Voluntary weeds emerged inside the chambers were regularly eliminated by hand.
The CO2 measurements started one day before soil tillage on 22 November 2013, and ended at soybean harvest in 25 March 2014, totaling 124 days. Measurements were performed daily in the first 11 days, every two days between 13th and 33rd day, weekly in the next month, and then twice a month until the end of the experiment, totaling 28 CO2 measuring days. The CO2 emission was measured three times a day (8:00–10:00 a.m., 1:00–3:00 p.m. and 05:00–07:00 p.m.) to take into account the daily average CO2 emission. The total accumulated CO2 was calculated according to Equation (1).
Eftx = Efp + (tx − tp) × [(Efpst − Efp)/(tpst − tp)],
where: Eftx = efflux at time “x”, Efp = prior efflux, tx = time “x” (days), tp = prior time, Efpst = posterior efflux, and tpst = posterior time.
The infrared gas analyzer measured the CO2 concentration during 1.5 min every 2.5 s in each experimental unit. The CO2 emission was calculated from the slope of the linear regression between CO2 concentration and time, according to La Scala et al. [52]. Flux measurements with R2 value below 0.85 were discarded. Afterwards, CO2 emissions were converted into CO2-C (kg ha−1). In our study, CO2-C corresponds to soil + CC residues CO2 emissions, except for ncc treatments, where CO2-C corresponds to soil CO2 emissions.

2.2.3. Soil Temperature and Moisture Measurements and Supporting Weather Conditions

Near-surface soil temperature was monitored using a thermistor-based probe inserted at 0.05 m depth into the soil near to the PVC pipes (CO2 measurements), and the volumetric water content of the soil was measured with a TDR (Time Domain Reflectometry) system (Model HydroSense II CS 659, Campbell Scientific, Australia). The thermistor probe and the TDR were coupled to the LAI-8100 system, and soil temperature and water content were monitored simultaneously with CO2 measurements.
The water-filled soil porosity space (WFSP) was calculated as WFSP = [(gravimetric moisture/soil bulk density)/(total porosity × water density) × 100]. The soil bulk density for CT, MT and NT treatments was 1.08, 1.13 and 1.18 kg dm−3, respectively. Water density was assumed as 1.00 kg dm−3, and total porosity = 1 − (soil bulk density/soil particle density), where soil particle density was assumed as 2.65 kg dm−3.
The rainfall volume and air temperature data related to the experimental period were acquired at a meteorological station located 150 m from the study site.

2.3. Cover Crops Biomass Input to Soil, Residue Decomposition in Litter Bags and Half-Life Time

Samples of CC biomass were taken within 0.5 m2 per subplot to obtain CC aboveground dry biomass, and C and N content (four replicates). At biomass sampling (10 November) oat was at final flowering and vetch at the early-flowering stage. The biomass samples were oven-dried at 65 °C until constant weight and milled to pass a 0.09 mm sieve (mesh 170). The biomass C content was determined by wet oxidation with K-dichromate and sulfuric acid solution with external heating [53,54]. Biomass N content was determined after sulfuric digestion by micro Kjeldahl method [55].
The in-situ field residue decomposition study was performed using nylon litter bags (0.20 × 0.20 m) with an aperture of 0.5 mm mesh size. Field CC residue samples were cut to 0.19 m length pieces, weighted to obtain the amount proportional to the total dry biomass production in each treatment, and placed into the litter bags. The litter bags were deployed on November 23, pinned horizontally on the soil surface in NT plots and buried in pits with 0.10 m depth in CT plots. The litter bags were positioned nearby CO2 measuring chambers. Residue decomposition under MT was not investigated because residue incorporation by chisel shanks is very difficult to reproduce. In total, 240 litter bags (6 treatments, 10 sampling times and 4 replicates) were prepared to allow periodic collection of bags for tracking of remaining biomass over time. Litter bags were retrieved at 8, 15, 22, 29, 43, 60, 73, 85, 101 and 123 days after tillage. Residues remaining into the litter bags were carefully collected, gently soil cleaned using a brush, oven-dried to constant weight at 65 °C, weighed, ground to pass a 2 mm sieve, and analyzed for C content (as previously described for total CC biomass C). An asymptotic exponential decay function was used to describe the CC residue decomposition over the time of experiment [56], as shown in Equation (2):
Y(t) = a + b × e−kt,
where: Y(t) = amount of residue remaining at a specific time, a = asymptotic remaining fraction not showing sign of decomposition, b = magnitude of the active fraction decomposed during the complete measuring period, k = a non-linear decay constant of the decomposed fraction, and t = time (days).
The half-life time (t1/2) of residues, which expresses the time needed for 50% of the residue to decompose, was calculated according to Plant and Parton [57], as t1/2 = ln2/k, where k is the decay constant rate obtained in Equation (2).

2.4. Apparent C Balance Calculation

The ACB was calculated as described in Equation (3):
ACB (kg C ha−1) = Ciccb − CCO2 − Crccb,
where: ACB = apparent C balance, Ciccb = amount of C present in the initial CC biomass input, CCO2 = accumulated CC-derived CO2-C of 124 days, and Crccb = amount of C in the biomass remaining in the litter bags after 124 days. The CCO2 was calculated by subtracting the total accumulated CO2-C emission from the treatment without CC (ncc, bare soil) from those respective treatments with CC residue. A linear interpolation was applied to generate temporal values between two measurement dates for the 124-day period.

2.5. Statistical Analysis

Unreasonable CO2 emission, soil temperature and moisture values were examined for single-point extreme outliers (box and whisker plot) and removed if found. In order to test the treatment effect in the measured variables, analysis of variance (ANOVA) using a split-plot model was conducted with the “lme” function from the “nlme” package [58], in R software version 3.6.3 [59]. Normality and equality of variances were tested using the Shapiro-Wilk test and the Levene’s test, respectively. The Tukey adjustment method was used for post-hoc multiple pairwise comparisons between least-square means of the levels for each significant fixed effect. Regression analysis was used to identify the response relationship of CO2-C emission to soil temperature and moisture, and the CC residues remaining biomass over time. Best-fit parameters for these exponential decay models were estimated using the Nonlinear Least Square function “nls” in R software [59]. All statistical significances were set at α = 0.05.

3. Results and Discussion

A compilation of data from the long-term experiment is presented in Supplementary Materials Table S1 in order to support and allow a broad comprehension of our results. Briefly, the table compares NT and CT systems under the full (summer and winter) crop rotation (R2) with respect to multiple soil, crops, and CO2-C flux attributes, highlighting the benefits of NT combination with legume CC for SOC sequestration, soil health and crop yields. ANOVA results of our experiment are shown in Table S2.

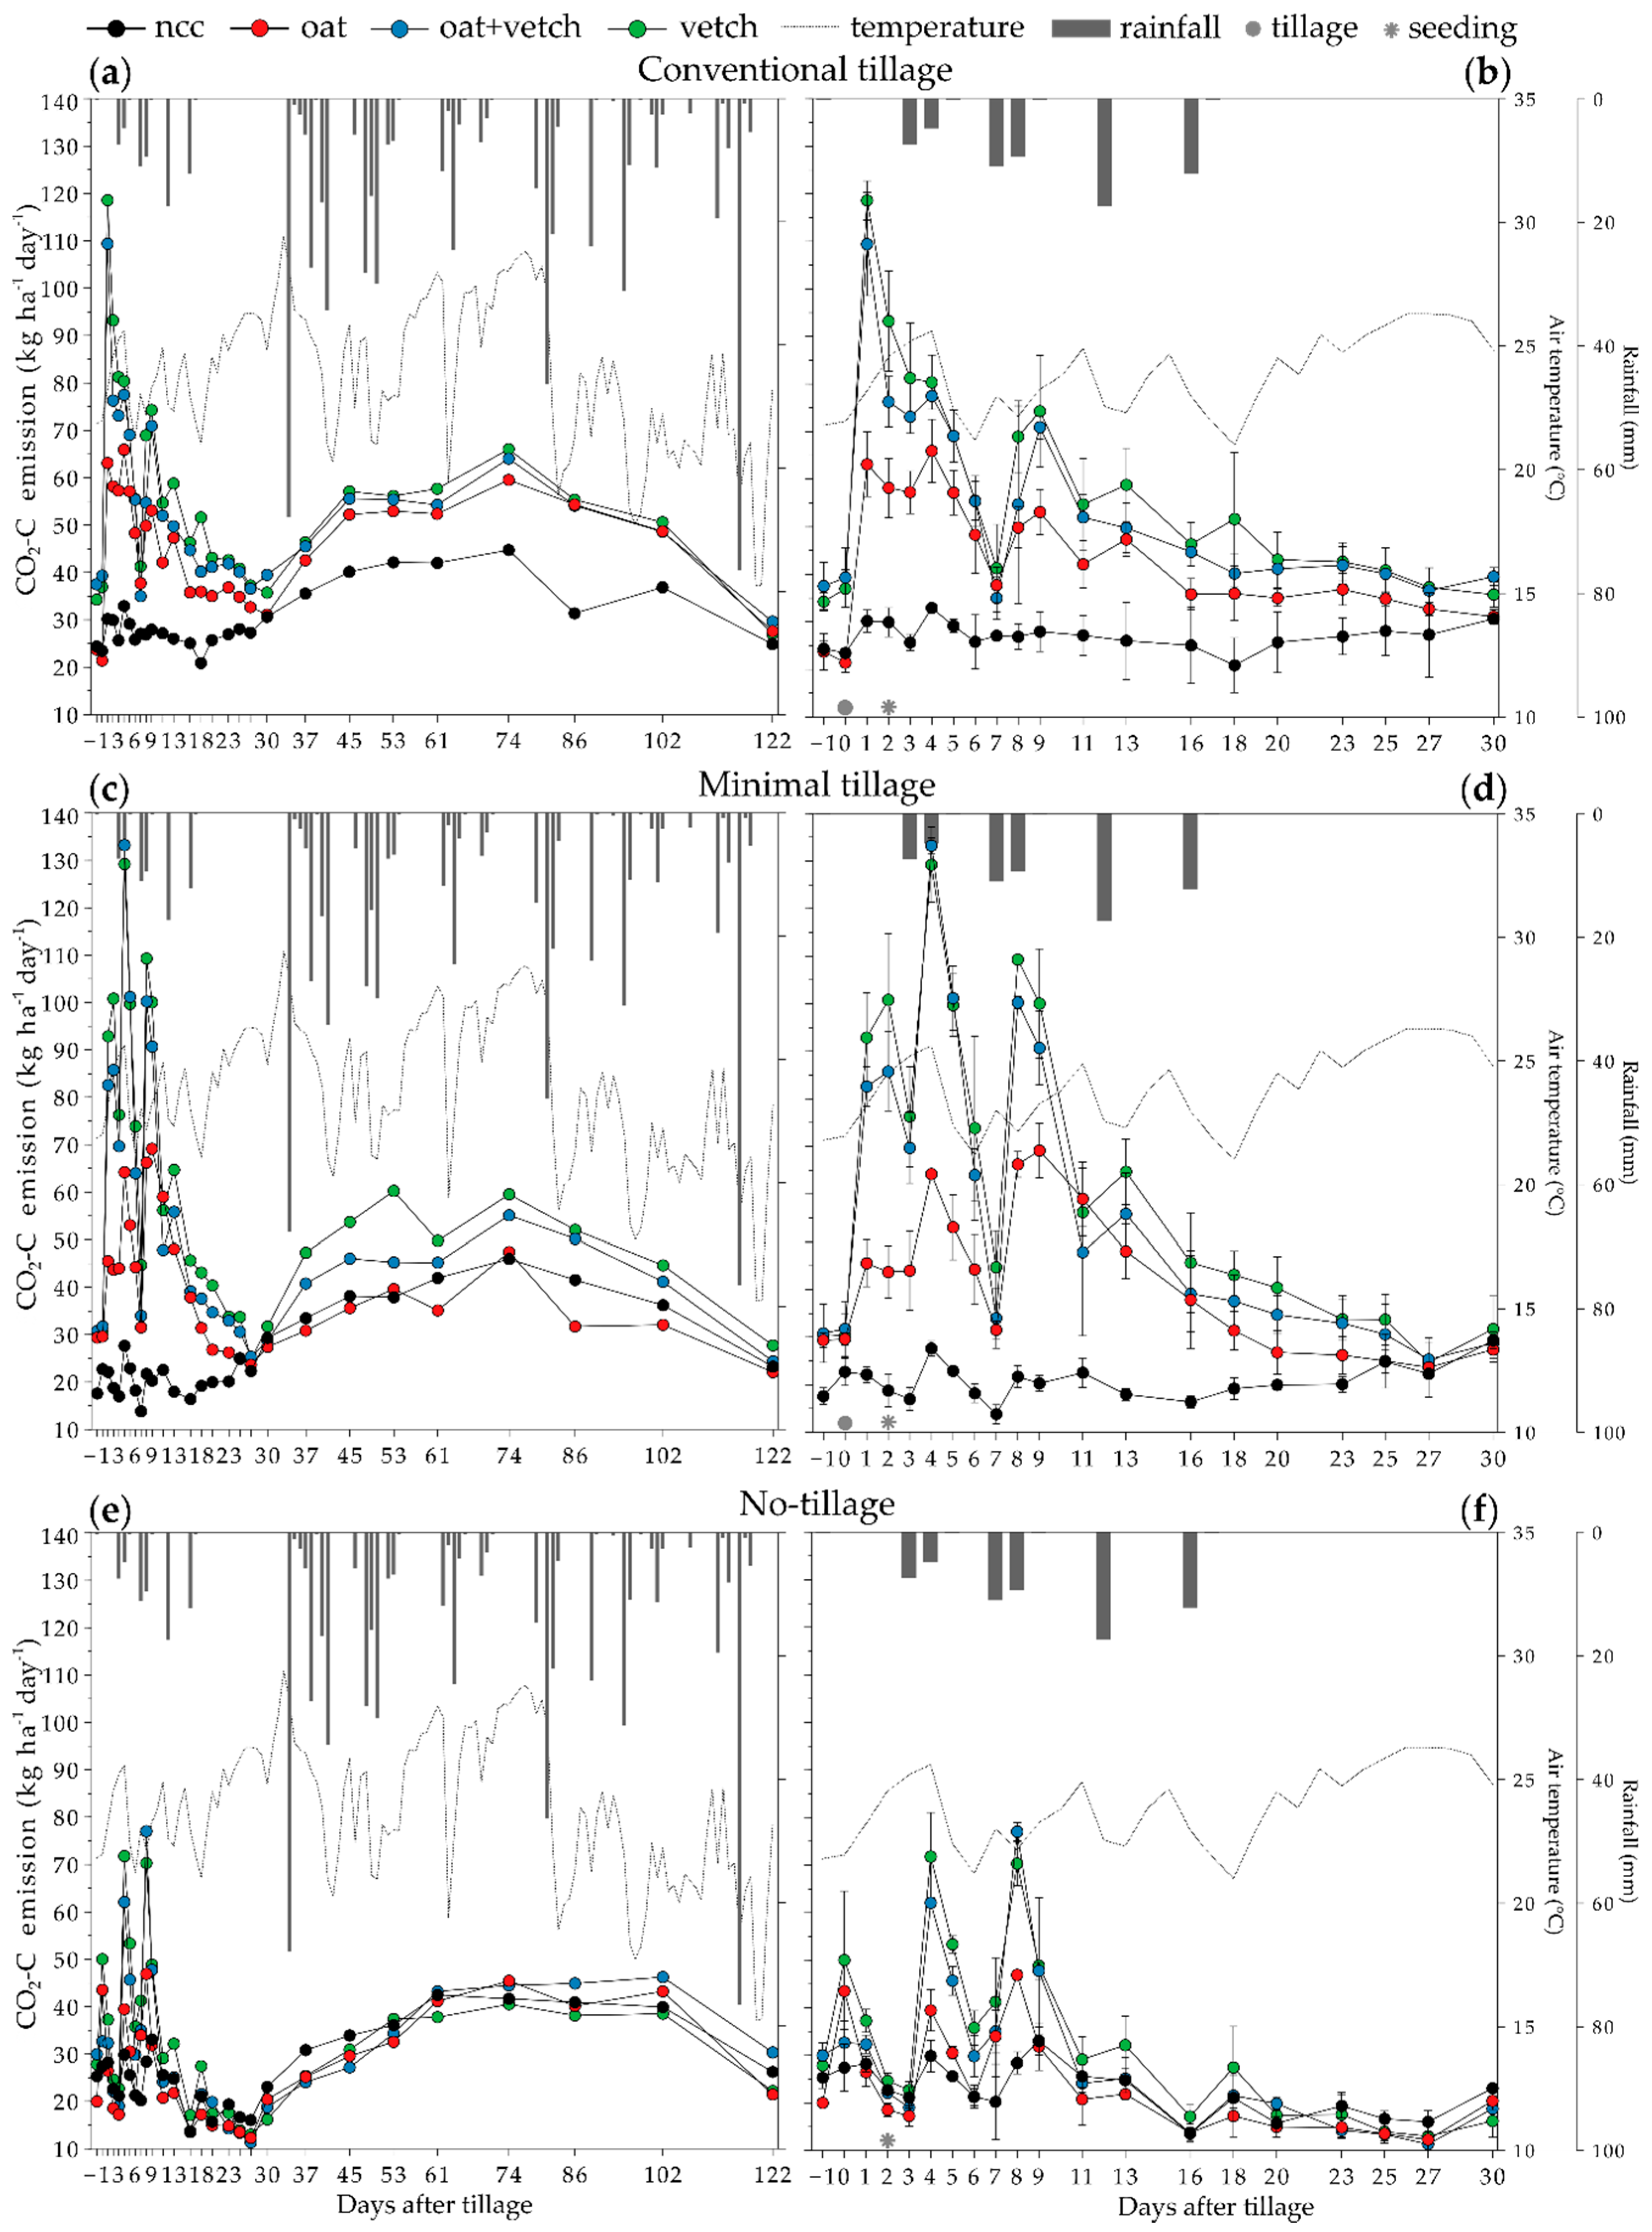
3.1. Weather Conditions, and Soil Temperature and Moisture Relation with Temporal CO2-C emission

Figure 1 shows the rainfall distribution and air temperature throughout the period of study. The average air temperature (23.7 °C) and the accumulated rainfall (650 mm) were close to that reported in previous studies performed in the same municipality (Cruz Alta) [40,46,60,61]. Daily maximum temperature (24.9 °C) occurred in December 2013 and the minimum (21.3 °C) in March 2014. Relative air humidity ranged from 64.1% (November 2013) to 71.9% (March 2014).
Soil temperature was affected neither by tillage system (CT = 28.8 °C, MT = 28.1 °C, NT = 27.7 °C) nor by CC type (ncc = 29.3 °C, oat = 27.7 °C, oat + vetch = 27.9 °C, vetch = 27.8 °C) (Table S3). Soil temperature values registered in our experiment are within the range favorable to microbial activity, from 20 to 30 °C [62,63]. The average volumetric soil moisture content in MT and NT was 31 and 25% greater compared with CT (0.16 m3 m3), respectively (Table S3). The WFSP ranged from 44.8 (MT) to 47.6% (NT) (Table S3) and was within the critical thresholds (30 to 60%) for aerobic microbial activity [64]. The reduced soil penetration resistance, enhanced water infiltration and soil surface protection in MT compared to CT may explain the WFSP results [40,46,52]. In NT, crop residues maintained on soil surface reduce water evaporation. In addition, long-term NT is known to enhance soil structure and OM content, favoring water infiltration and retention in the soil [61].
To capture the effects of soil temperature and moisture on CO2-C emissions, a regression analysis was performed separately for four time intervals after tillage (1st, 2nd, 3rd–6th and 7th–18th week). A significant relationship of CO2-C emission with soil temperature and moisture was found in most treatments and time intervals (Table S4). In general, the greatest CO2-C emission peaks occurred within the 1st week after tillage (Figure 1). In this period, CO2-C emissions were not significantly related to soil temperature or moisture in CT and MT with CC (Table S4). Once soil temperature and moisture were not restrictive for microbial activity in our study, greater soil aeration [65] and soil-CC residue contact [66] due to tillage may be the main drivers of CO2-C emission in this case, corroborating Campos et al. [40]. Accordingly, in NT, where soil disturbance and residue incorporation were minimal or absent, soil moisture and temperature were significantly related to CO2-C emissions (Table S4), corroborating Hendry et al. [67].
Overall, in the 1st week period, side effects of soil tillage were predominant on CO2-C emissions. Afterwards, emissions were more closely related to soil moisture and temperature (Table S4), as expected since these are generally the major abiotic drivers of soil respiration [40,46,68].

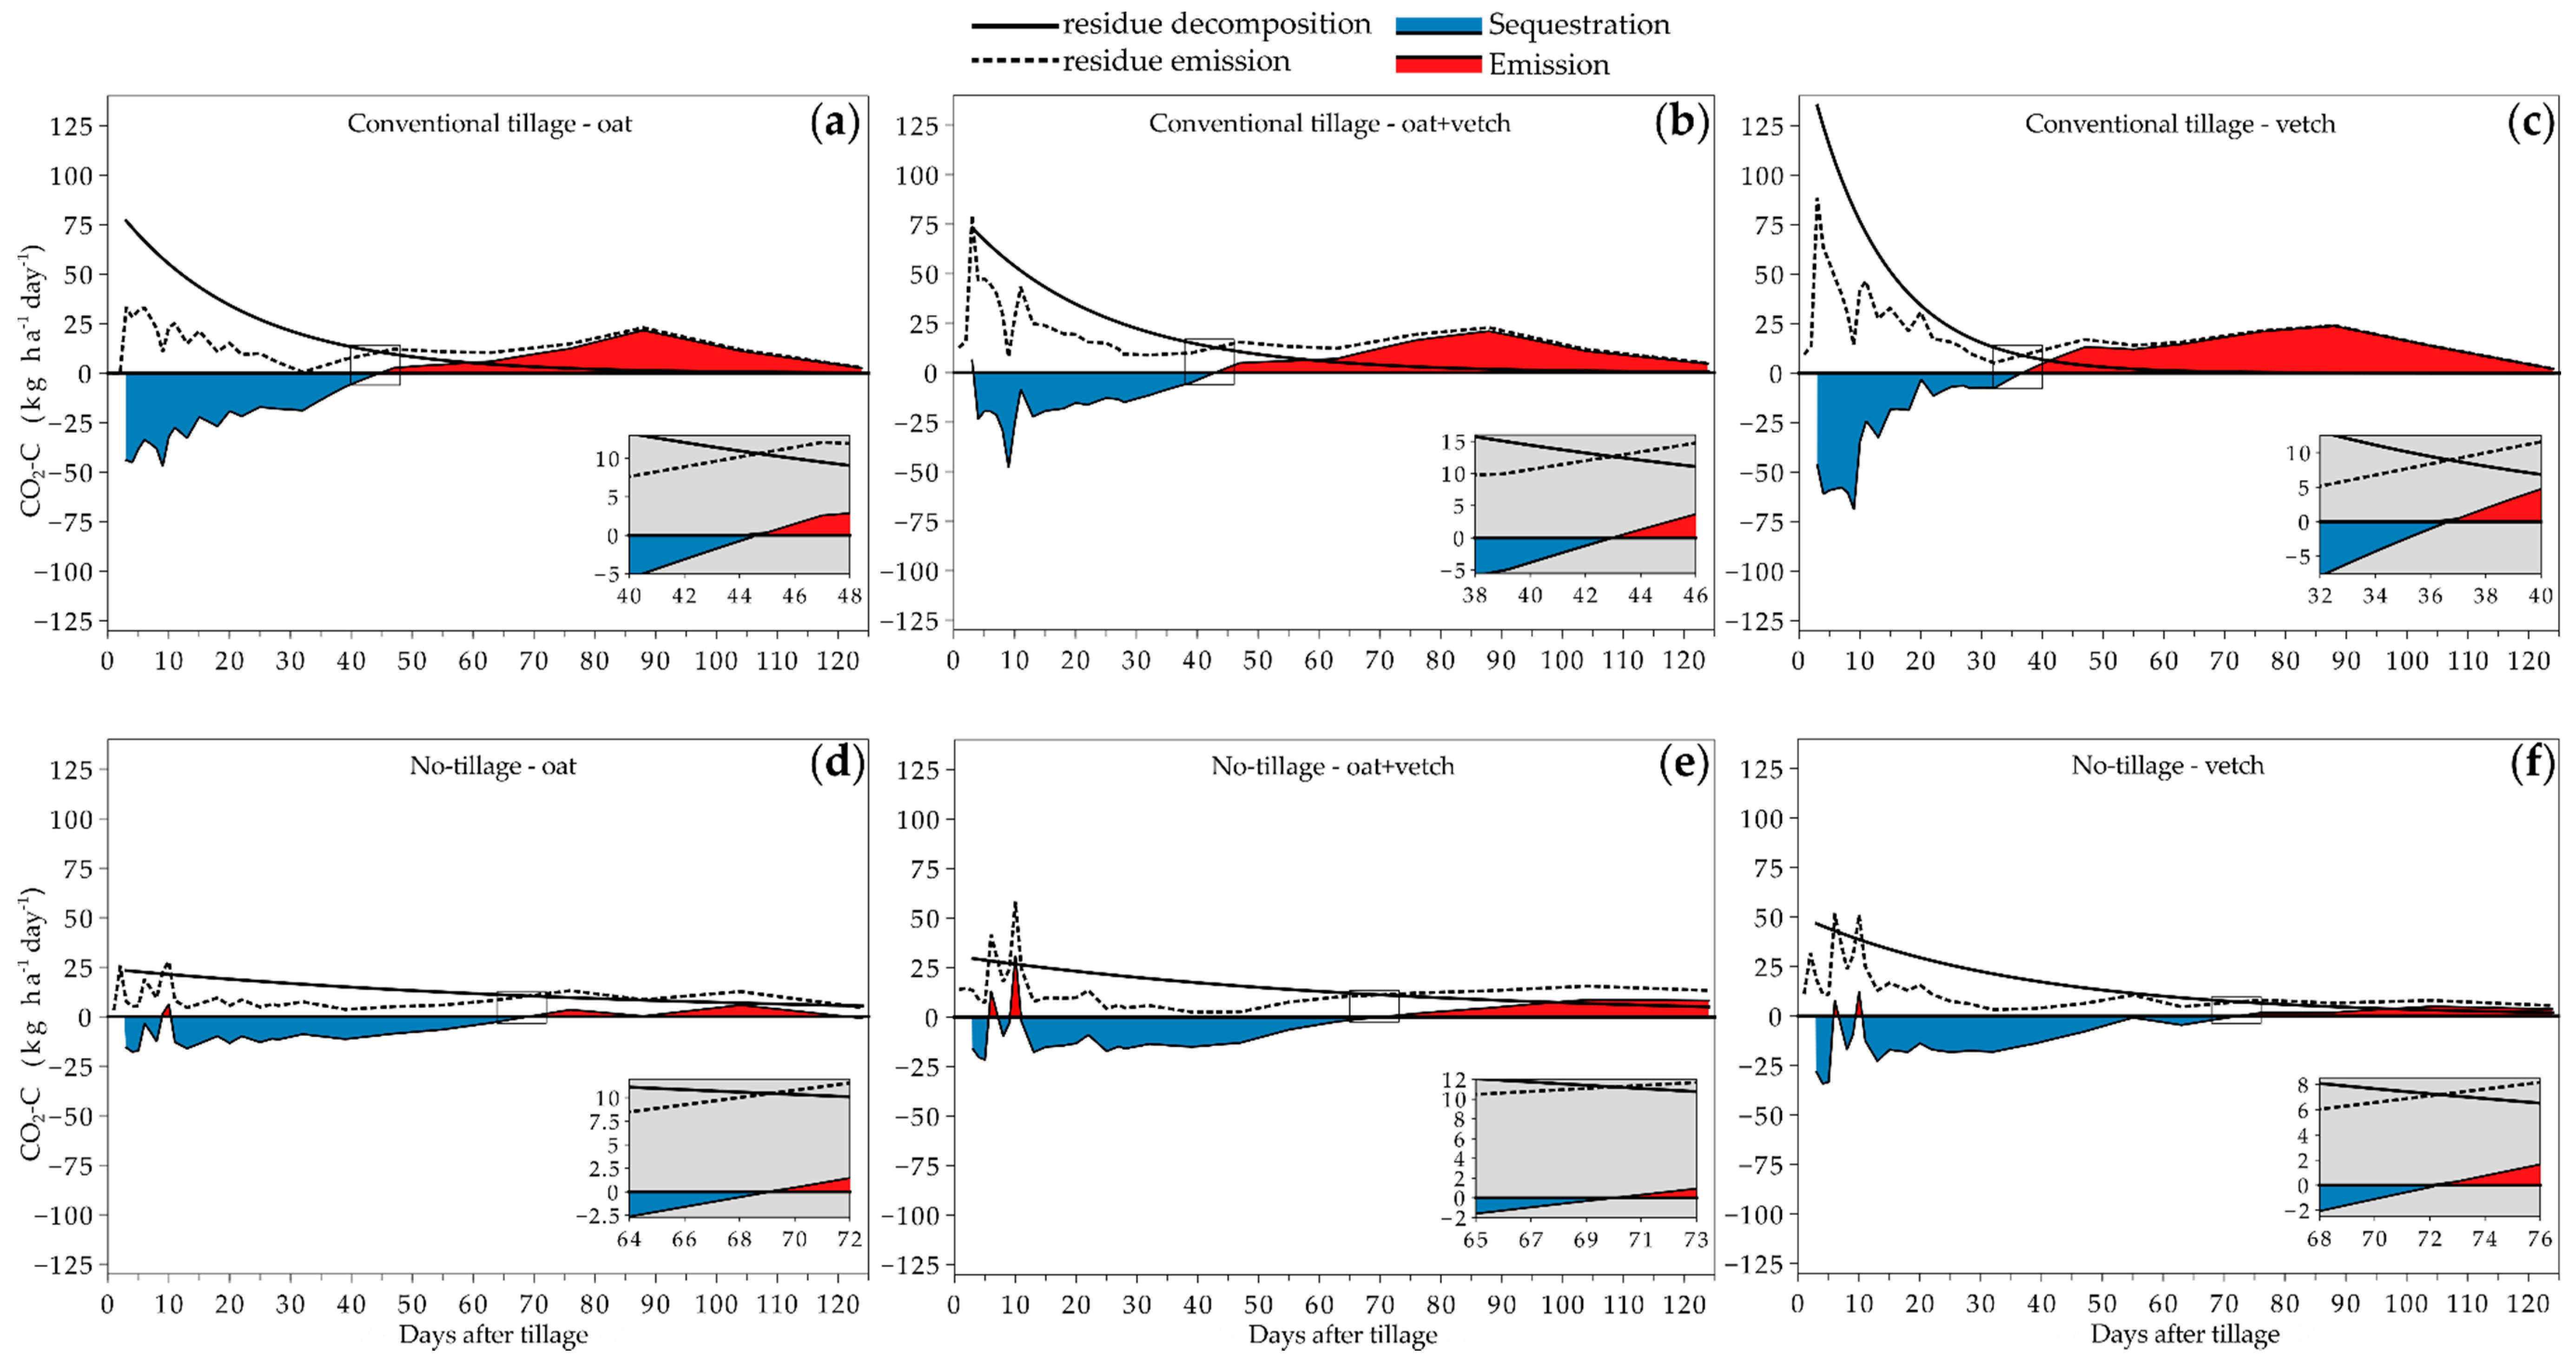
3.2. Temporal CO2-C Emission in Different Tillage and Cover Crop Combinations

Figure 1 shows the temporal evolution of CO2-C emission for the different CC types within tillage systems throughout the total experimental period (124 days) and within the first 30 days after tillage. Overall, the CO2-C emission in ncc treatments were notably lower compared to the treatments with CC, independent of tillage system, as similarly reported by previous studies [42,46]. In CT and MT with ncc, this result is mainly explained by the lack of easily decomposable biomass input to the soil. Additionally, more than 70% of the SOC in this soil is stored as OMAM [39,42], which is less sensitive to soil tillage compared to labile OM [35]. In NT with ncc, in addition to the previous factors, the low soil disturbance and the greater OM protection in aggregates may explain the lower CO2-C emissions in NT compared to CT and MT with ncc [40,46,69].
The time for the greatest peak of CO2-C emission was notably different between tillage systems, CT: 1st day after tillage in vetch; MT: 4th day after tillage in oat + vetch; and NT: 8th day after tillage in oat + vetch (Figure 1). Early CO2-C emissions shortly after tillage in CT were also reported by Reicosky and Lindstrom [70] and La Scala et al. [52,71]. The greatest CO2-C peak in MT and CT were 73 and 54% greater than that in NT (77.0 kg ha−1 day−1), respectively (Figure 1). The short-term and great magnitude of CO2-C emission peaks in tilled systems is usually associate with enhanced aeration induced by tillage, which enable rapid O2/CO2 exchange with the atmosphere; increase of soil OM turnover rate in response to greater soil aeration and water infiltration; mechanical fragmentation of crop residues and incorporation into the soil; and disruption of soil aggregates [69,72,73]. The magnitude of the greatest peak of CO2-C in MT was 12.4% greater than in CT. As the peak in MT followed rainfall events (Figure 1), it suggests that a greater water infiltration and soil aeration associated with deep voids (up to 25 cm) created by shanks in MT (compared to disk operation up to 20 cm in CT) may explain the greater CO2-C emission peak in MT. Reicosky and Archer [74] reported that in relation to NT, CO2-C emissions increased by 3.8, 6.7, 8.2 and 10.3 times in response to increasing tillage depth to 10.2, 15.2, 20.3 and 28.0 cm, respectively, possibly due to greater amount of aggregates disruption. Furthermore, soil CO2 concentration increases with soil depth, and more CO2 is released to the atmosphere once soil is disturbed [65,75]. In addition, the greater soil moisture in MT compared with NT (Table S3) may have stimulated microorganisms’ activity, OM decomposition and CO2-C emission.
In general, the CO2-C emission peaks were concentrated within the first two weeks after tillage, but varied in magnitude according to CC quality within each tillage system (Figure 1). Only three days after tillage in CT, the CO2-C peak in vetch, oat + vetch and oat averaged 118, 109 and 66 kg ha−1, respectively, and decreased until the seventh day after tillage (Figure 1). Compared to CT, the CO2-C peak for vetch, oat + vetch and oat were 14%, 21% and 33% lower in MT and 58%, 70% and 33% lower in NT, respectively, within the same two-week period. These results highlight the potential of NT to mitigate CO2-C emission caused by tillage, mainly for high-quality CC residues like vetch, either cultivated alone or combined with grass (oat + vetch). According to Aita and Giacomini [76], although vetch has greater lignin content compared to oat, its lignin/N ratio is less, and its C/N is lower compared to oat, favoring vetch biological decomposition, especially under CT [75].
During the two-week period after tillage, a second CO2-C peak was associated with two rainfall events totaling 20.4 mm (Figure 1). Similarly, a third CO2-C peak occurred close to the 35th day after tillage in all treatments after a 70 mm rainfall event and an increase in air temperature (Figure 1). The CO2-C emissions response to rainfall was greater in MT compared to CT and NT, which was probably associated with greater water infiltration in MT soil. Furthermore, mulch in NT may hinder CO2-C diffusion from soil to atmosphere [77].
In our study, the greatest CO2-C peak in CT, MT and NT persisted to the 28th, 23rd and 10th day after seeding, respectively (Figure 1b,d,f). This is aligned with studies reporting that CO2-C peaks in NT are lower in magnitude and shorter in duration compared to CT (Figure 1) [3,78,79,80,81,82,83,84].

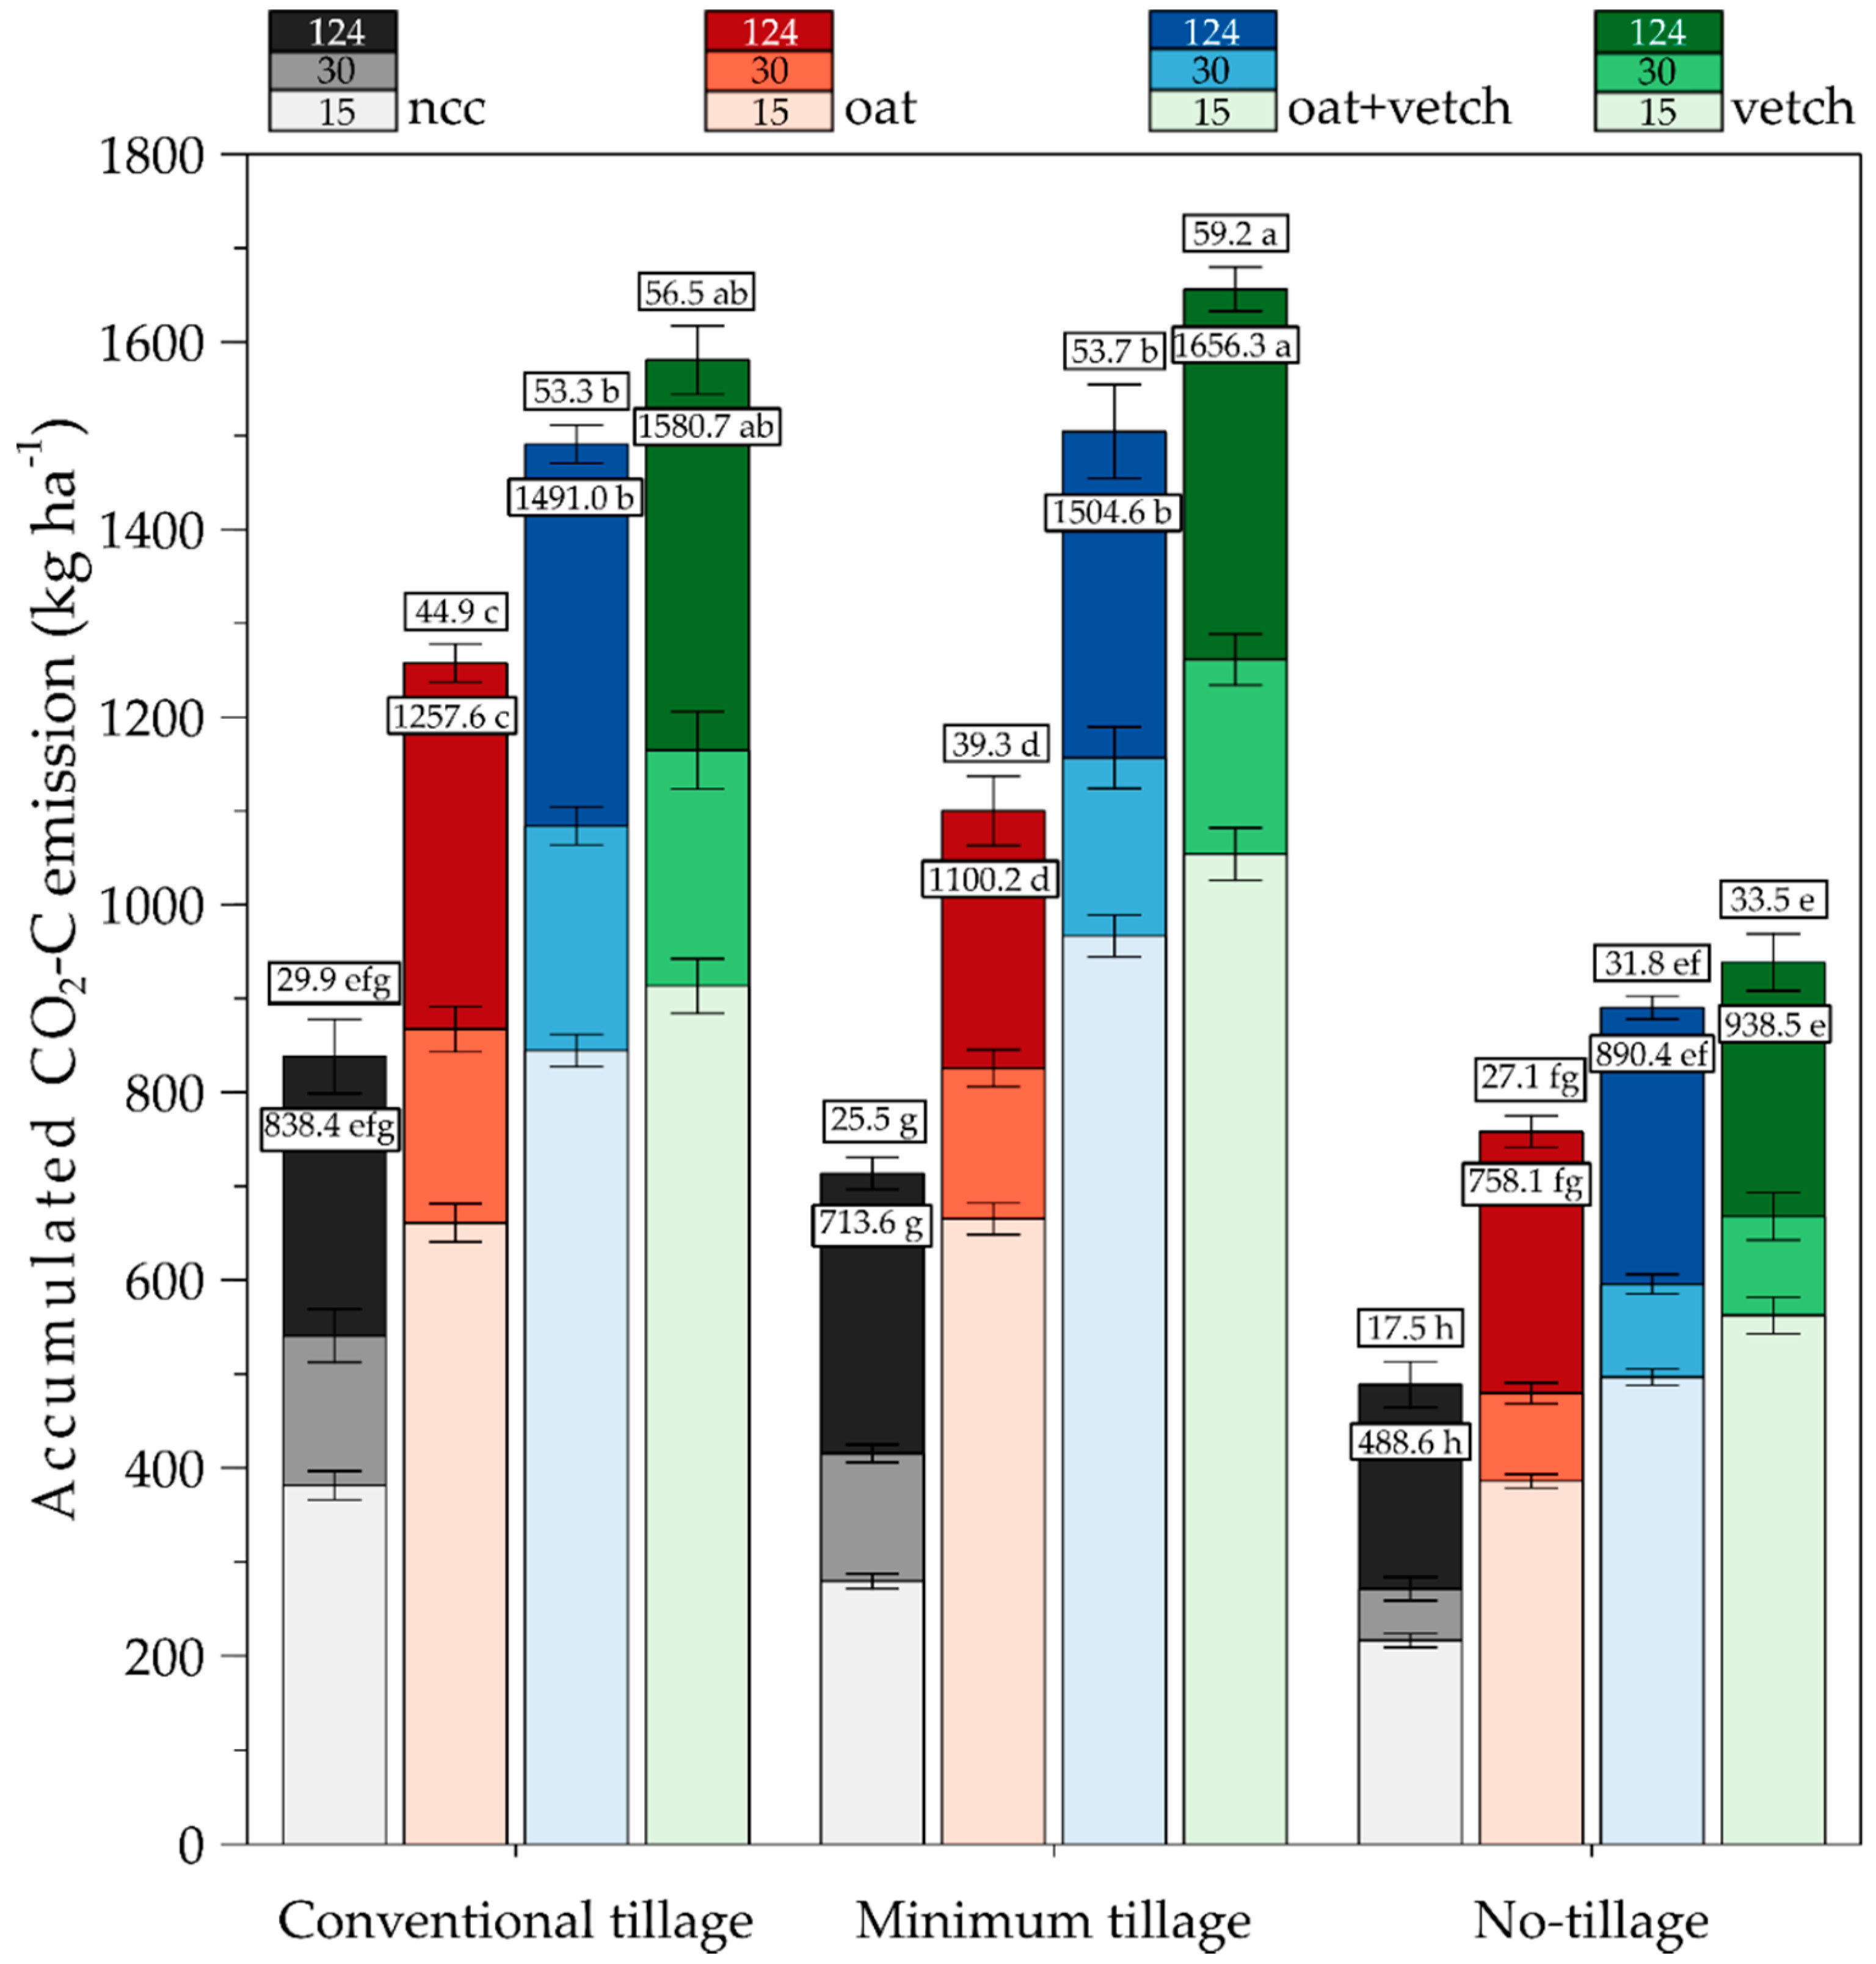
3.3. Daily Average and Accumulated CO2-C Emission in Different Tillage and Cover Crop Combinations

Daily average (p < 0.0001) and accumulated CO2-C (p = 0.0041) emissions were significantly affected by the interaction between tillage system and CC type (Table S2). Daily average CO2-C emissions within tillage systems increased (raw values) with greater CC quality, as follows: ncc < oat < oat + vetch < vetch (Figure 2). This is in line with Rigon et al. [73] where CO2-C emissions were significantly affected by crop residues differing in C/N ratio. In Southern Brazil, Costa et al. [85] reported lower CO2-C efflux in the presence of black oat residues (C/N ratio = 36.3) compared to common vetch (C/N ratio = 15.4) in NT, with daily average CO2-C emission values similar to that of our study (Figure 2).
The range of daily average CO2-C emissions in CT, from 29.9 (ncc) to 56.5 kg ha−1 (vetch), was similar to the range in MT, from 25.5 (ncc) to 59.2 kg ha−1 (vetch) (Figure 2). In NT, these values ranged from 17.5 (ncc) to 33.5 kg ha−1 (vetch) (Figure 2). In NT, the daily average CO2-C emission in ncc, oat, oat + vetch and vetch was 41%, 39%, 40% and 41% lower than that in CT, respectively, and 31%, 21%, 41% and 43% lower than that in MT, respectively. Our data is in agreement with Pes et al. [46] who observed in our experimental area daily average CO2-C emission in NT (28.8 kg ha−1) 40% lower compared to CT (48.1 kg ha−1) under crop rotation R2 (Table S1). Similar CO2-C emission in NT R2 (24.4 kg ha−1) was previously reported by Bortolotto et al. [61] at this experimental site.
Regarding ncc treatments, the total accumulated CO2-C emissions in CT and MT was 72% (350 kg ha−1) and 46% (225 kg ha−1) greater compared to NT, respectively (Figure 2). The total accumulated CO2-C emission in ncc followed the order of intensity of soil disturbance CT > MT > NT. The soil derived CO2 emission under CT was 66%, 56% and 53% of the total accumulated CO2-C emission of oat, oat + vetch and vetch treatments, respectively. These values were 65%, 47% and 43% in MT and 64%, 54% and 52% in NT. In general, the residues accounted for 34–57% of the total accumulated CO2-C emission. With respect to oat residues, which have lower quality (greater C/N ratio) in relation to oat + vetch and vetch, the total accumulated CO2-C emissions across tillage systems followed the same order observed for ncc (CT > MT > NT). For vetch and oat + vetch, the total accumulated CO2-C followed a different order, CT = MT > NT. Under CT, about 59%, 74% and 87% of the C input to the soil by oat, oat + vetch and vetch was lost as CO2-C. Together these results evidence that to more easily degradable residues, as vetch, even the minimal soil disturbance (MT) increased sharply the accumulated CO2-C emission (Figure 2). Overall, NT was more C conservative, where about 41%, 51%, and 43% of the C input by oat, oat + vetch and vetch, respectively, was lost as CO2-C. Particularly, for vetch, this loss was half of that in CT, reinforcing that understanding interactions between CC type and soil tillage system is crucial to mitigate CO2 emissions and to increase SOC sequestration in intensive cropping systems [72,86,87].
In MT, the total accumulated CO2-C emission in vetch was 51 and 10% greater than that in oat and oat + vetch, respectively (Figure 2). In CT, the total accumulated CO2-C emission decreased as vetch = oat + vetch > oat (Figure 2), and the CO2-C emission in vetch was 26% greater compared to oat. In NT this value was 24%. Comparing the greatest to the lowest total accumulated CO2-C emissions across all treatments, the emission in vetch under MT was 118% greater compared to oat under NT. The total accumulated CO2-C emissions in oat + vetch and vetch under MT did not differ from that in CT, but both were much greater than in NT (Figure 2). In CT and MT, the accumulated CO2-C emission in vetch was 68 and 77% greater than in NT, respectively (Figure 2). These findings indicate that high-quality CC as oat + vetch, and especially vetch, should be preferentially combined with NT, which also applies to legume cash crops as soybean. This is critical as MT is often adopted by farmers to alleviate soil compaction in NT areas after soybean harvest, for example in Southern Brazil, while it could be used after corn instead, if not avoided.

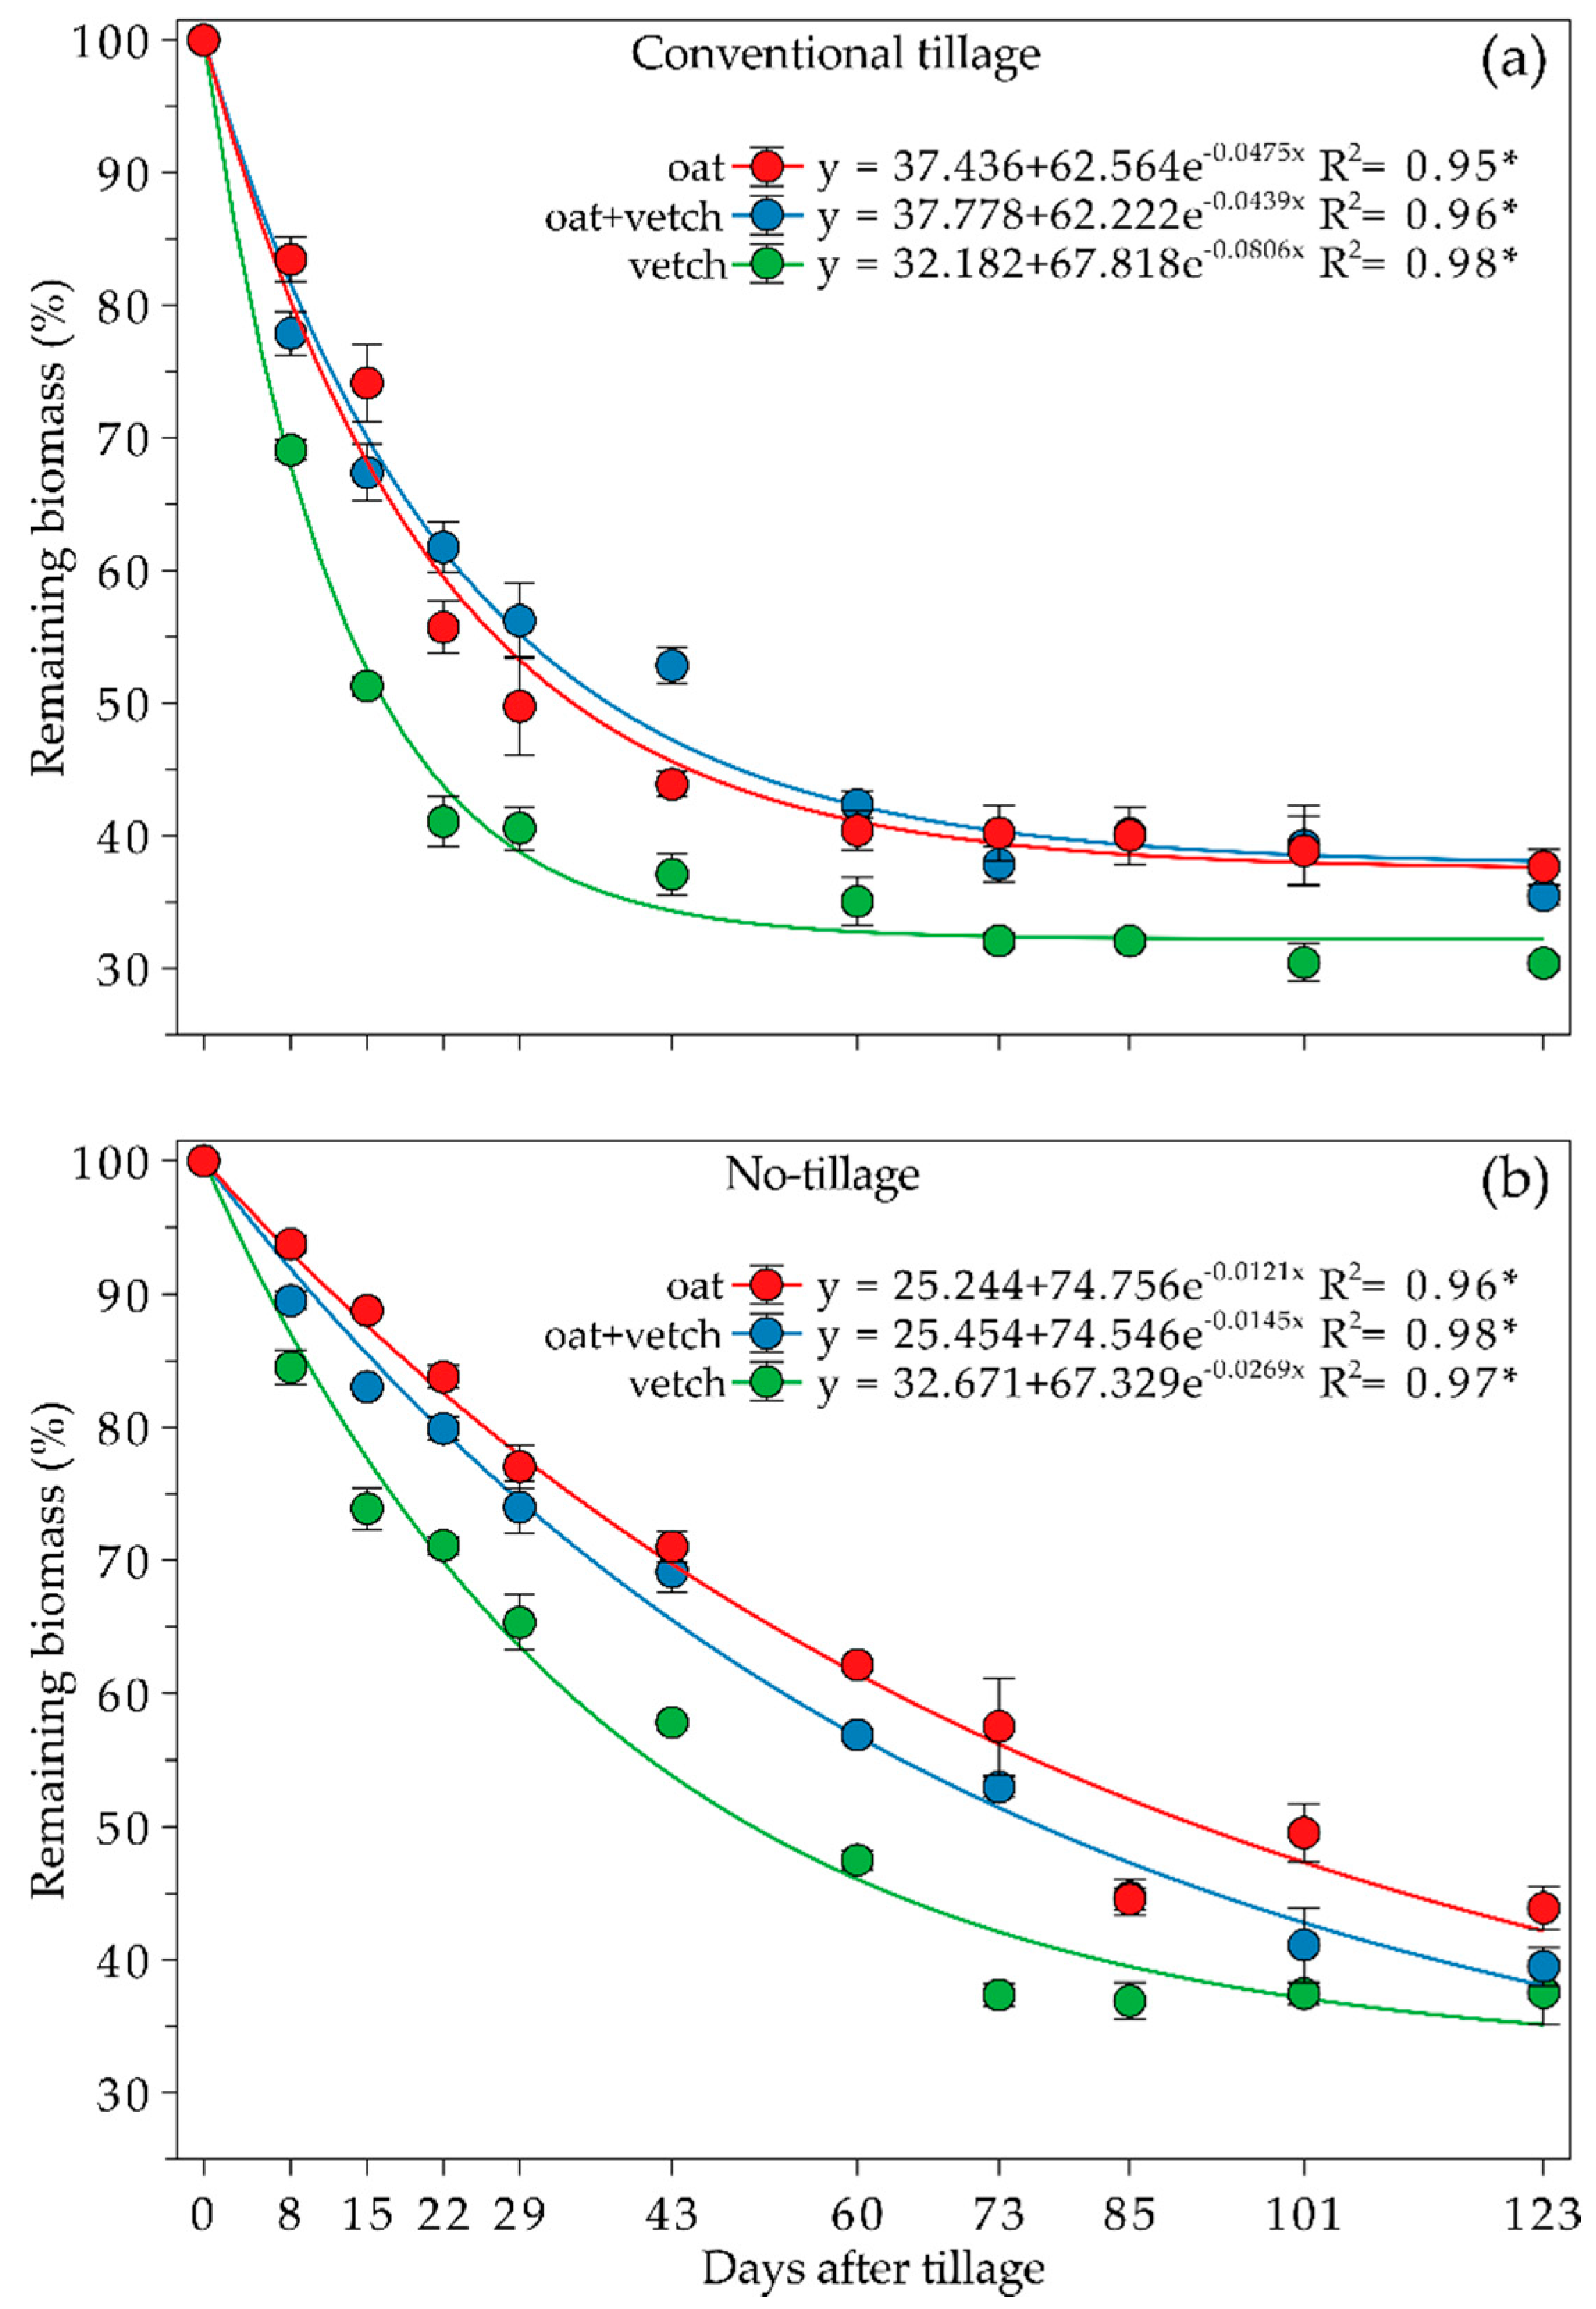
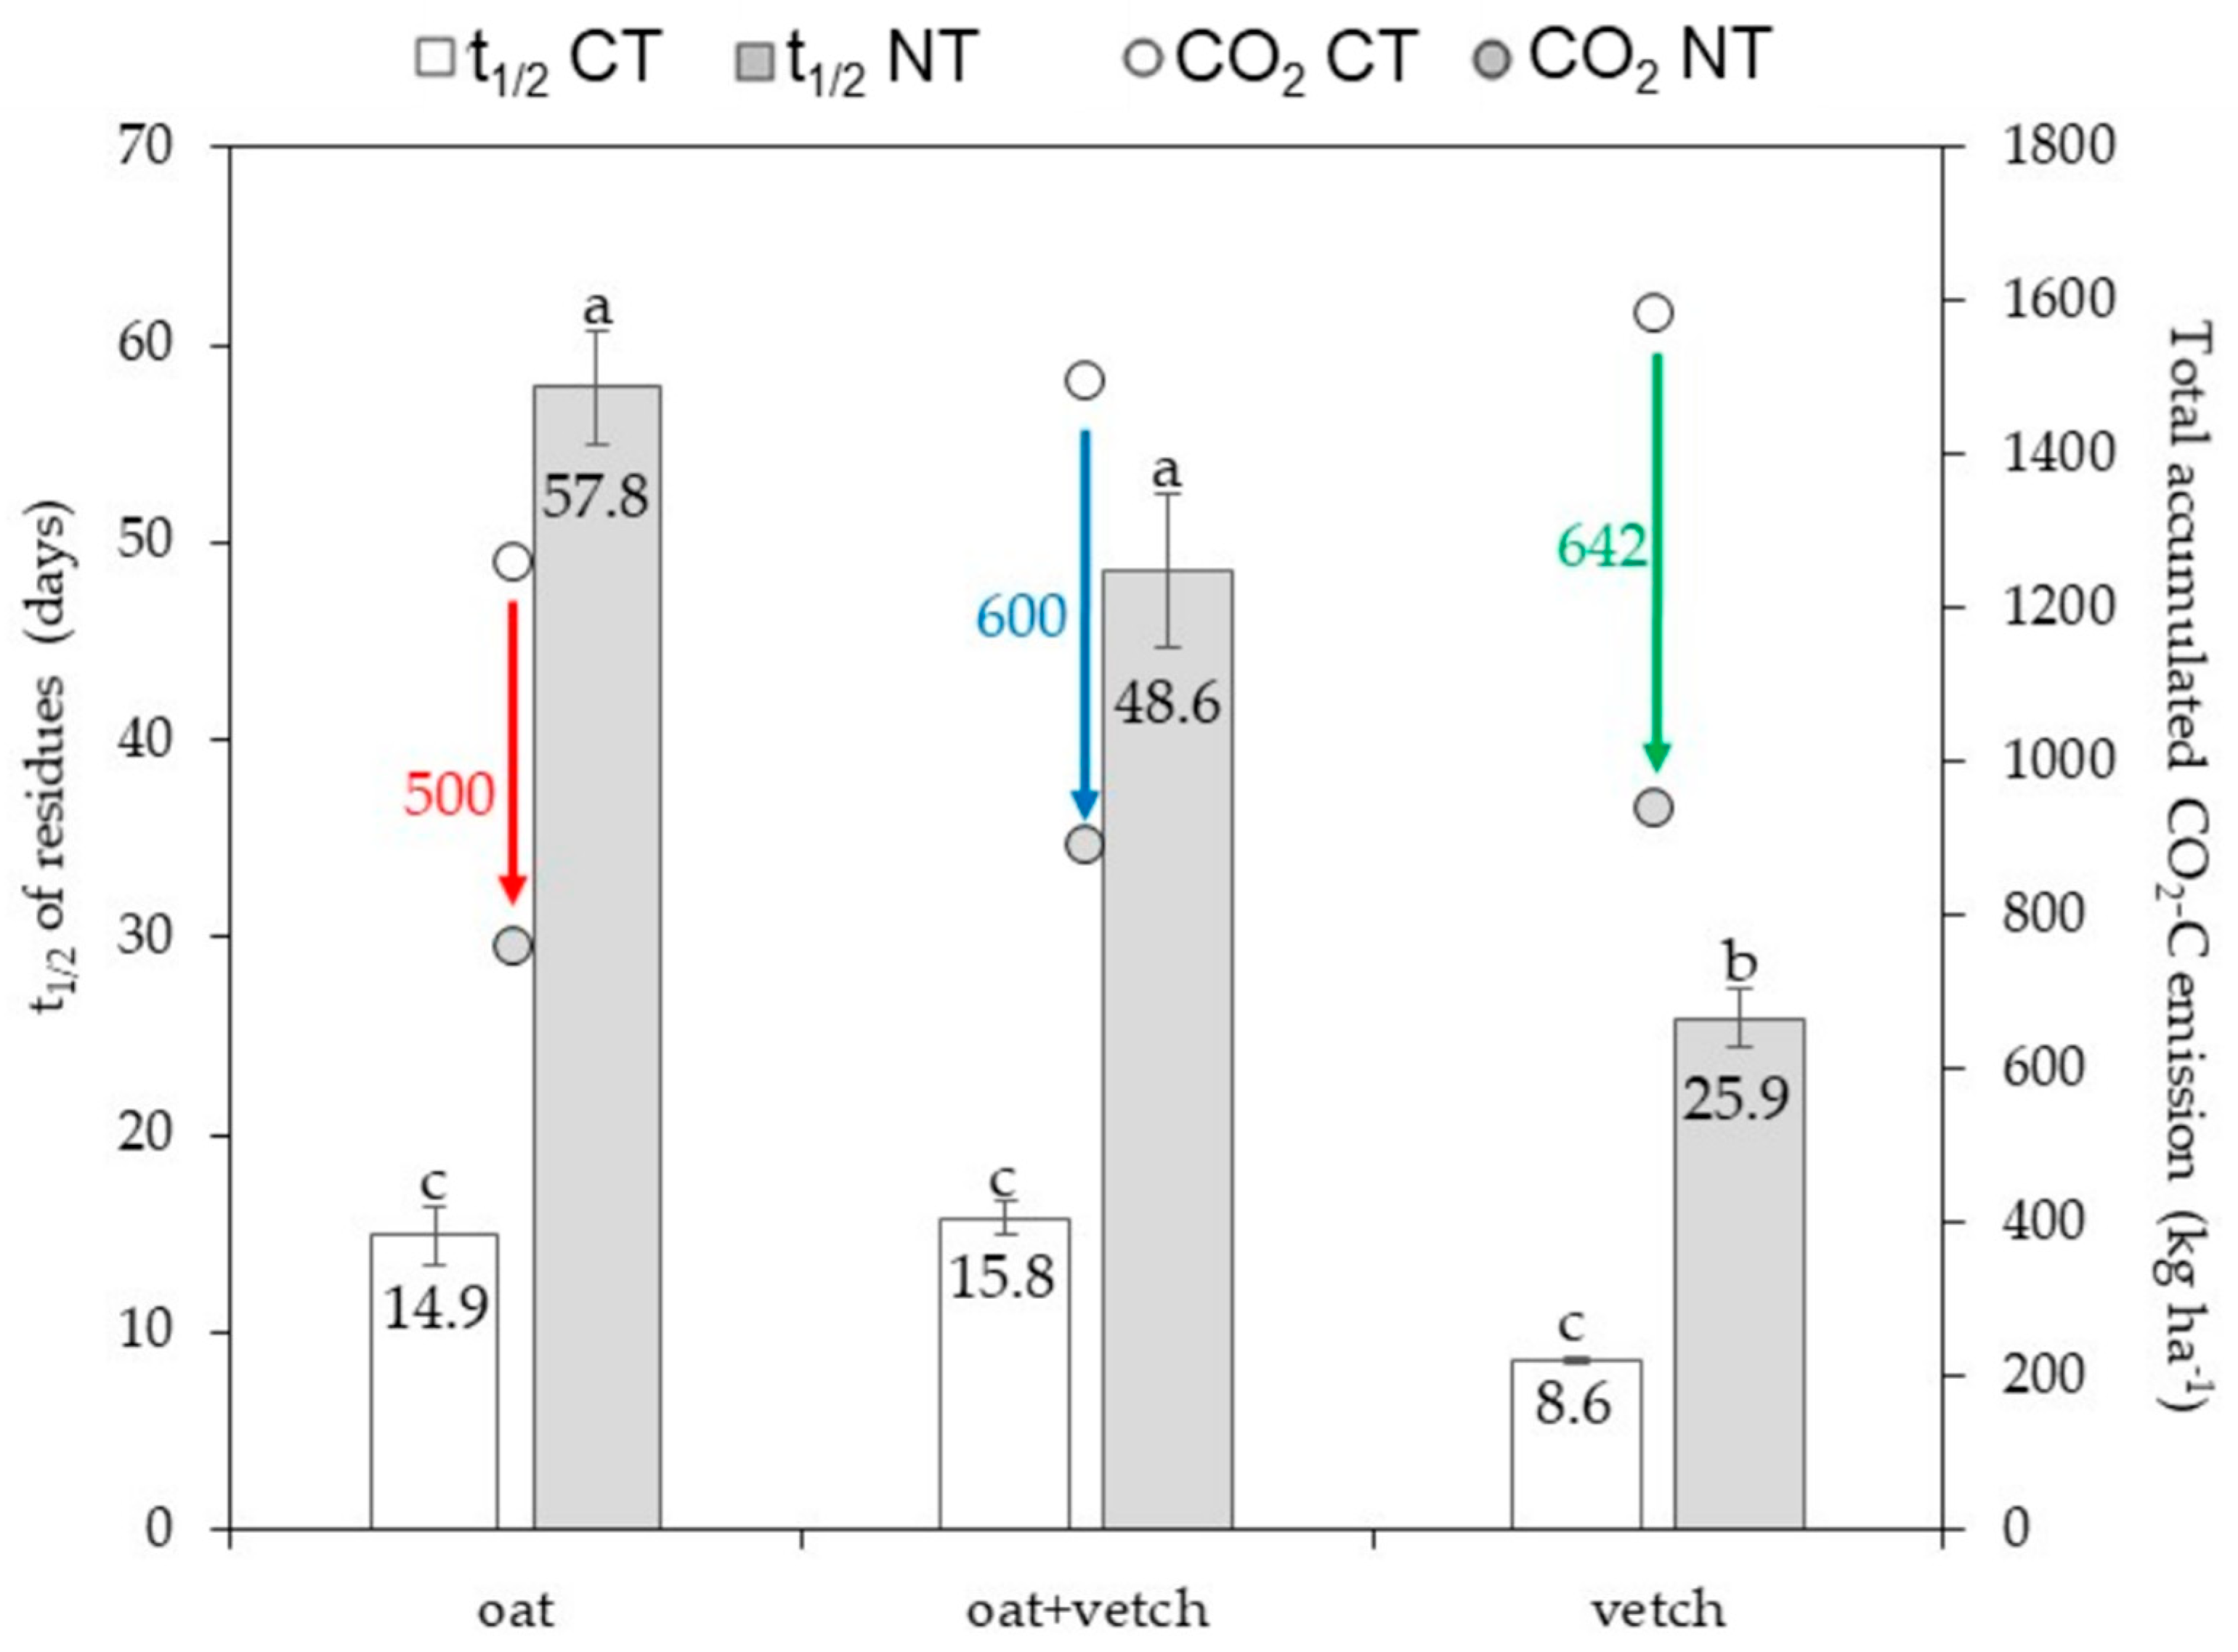
3.4. Cover Crops Biomass Input to Soil, Residue Decomposition in Litter Bags and Half-Life Time

Means of CC dry biomass, C and N content were statistically compared between NT and CT only, since MT was not included in the decomposition experiment (see Section 2.3), and were significantly affected by CC type only, p = 0.0307, p < 0.0001, and p < 0.0001, respectively (Table S2). On average of CT and NT, the biomass of oat + vetch (6819 kg ha−1) was significantly greater than that of vetch (6450 kg ha−1), while oat biomass did not differ from the others (Table 1). The C input to the soil by oat + vetch (2751 kg ha−1) was significantly greater compared to oat and vetch, which did not differ from each other (Table 1). The N input to the soil significantly increased as follows: oat < oat + vetch < vetch (Table 1). Since the C/N ratio of the CC biomass decreased as oat > oat + vetch > vetch, regardless of tillage system (Table 1), we assumed that the quality of the CC biomass increased as oat < oat + vetch < vetch.
The CC residue decomposition over time of experiment was described by highly significant exponential decay functions (Figure 3). In CT, the CC constant decomposition rate (k) ranged from 0.0275 (oat) to 0.0806 day−1 (vetch) (Figure 3a). In NT, k ranged from 0.0121 (oat) to 0.0269 day−1 (vetch) (Figure 3b). The faster decomposition of CC residues in CT is attributed to greater soil aeration, residues fragmentation and increase in residue-soil contact due to tillage compared with NT, where residues remain on soil surface without physical fragmentation [35,46,72].
Regardless of CC quality, remarkable decomposition of residues occurred within the first 30 days of study, especially for CT (Figure 3), corroborating the main CO2-C emission peaks occurred within this period (Figure 2). At 30 days of decomposition, the remaining biomass of oat, oat + vetch and vetch in CT was 53%, 55%, and 45% of the initial biomass, respectively, whereas in NT these values were 79%, 75%, and 66%. After 123 days, the remaining biomass of oat, oat + vetch and vetch in NT was 9%, 1%, and 11% greater than in CT, respectively. These results indicate that NT slowed residues decomposition more relevantly within the first 30 days of experiment (particularly for vetch), where oat, oat + vetch and vetch biomass loss was 44%, 37%, and 67% lower, respectively, compared to CT. These data are aligned with Li et al. [88] and Sievers and Cook [89] who reported more intense residue decomposition of legumes compared to grasses, especially in tilled systems. The rapid initial decomposition of CC, mainly of legumes, is particularly relevant with respect to N flush into the soil. In NT, Aita and Giacomini [76] reported that 46%, 38% and 15% of the total N released to the soil by vetch, oat + vetch and oat residues, respectively, during 182 days occurred within the first 15 days. Additionally, the authors concluded that early N released amount exceeded the N accumulated by subsequent commercial crops. Accordingly, Acosta et al. [90] observed that 90% of the N from vetch residues was released to the soil within 30 days of decomposition in NT in Southern Brazil. In CT, N flush into the soil derived from CC decomposition is even more intense [76,90].
The t1/2 of CC residues was significantly affected by the interaction between tillage system and CC type (p < 0.0001, Table S2). The short t1/2 of vetch in CT compared to NT verified in our study (Figure 4) possibly caused a sharp N flush into CT soil, reducing N recovery by subsequent cash crops and increasing risks of N leaching and gaseous loss, which may constrain SOC sequestration mechanisms [27,91,92,93]. In this way, the greater t1/2 of CC residues in NT (Figure 4) may partially explain the 7% greater soil N stock in NT (0–0.3 m depth) compared to CT observed by Campos [60] in our experimental site for R2 rotation (Table S1). This crop rotation has vetch and oilseed radish though to increase soil N, and N retention in the soil and recovery by plants may be greater in NT than in CT [94].
The t1/2 of oat, oat + vetch and vetch residues in NT was 3.9, 3.1 and 3.0 times greater than in CT, respectively, and the total accumulated CO2-C reduction by NT over CT was greater as lower was the C/N ratio of CC residue: oat (500 kg ha−1), oat + vetch (600 kg ha−1) and vetch (642 kg ha−1) (Figure 4). These results allow to confirm hypothesis “i”. Similarly, Campos et al. [40] reported that the t1/2 of wheat and black oat + vetch residues was 2.3- and 2.2-fold greater in NT than in CT at our experimental area (Table S1). The greater t1/2 of CC residues in NT systems prolongs soil surface protection, temperature control, and conserves soil moisture, thus improving soil health [73,95]. Pires et al. [44] reported that NT promoted greater diversity of soil microorganisms and fungal biomass than CT in our experimental site (Table S1). In comparison to fungi, bacteria demand more energy and are less efficient in converting C from substrates to microbial compounds, and therefore could increase residue decomposition and CO2-C emissions [96,97,98]. Veloso et al. [22] reported that in NT, legumes promoted soil aggregation and created a favorable environment for the accumulation of fungal products, stimulating intra-aggregate C accumulation. Furthermore, the authors found preferential accumulation of fungal-derived glucosamine in OMAM fraction at subsurface soil depths (up to 1 m), indicating that fungal activity was a key driver of SOC stabilization, corroborating Mikha and Rice [99]. Accordingly, Campos et al. [37] reported that the average geometric diameter of soil aggregates in NT was 61% greater than in CT in our experimental site (Table S1). These interpretations are supported by the greater SOC sequestration rate, C content in aggregate classes, and OMAM and SOC stocks in NT compared to CT previously reported for our soil [38] (Table S1).
Legume-based NT can increase stable SOC stock (Table S1), as discussed in our study. Soil OM stabilization in microaggregates due to close interactions of mineral particles with N-rich microbial compounds is thought among the main drivers of this process [93,100,101]. In this way, recent studies from long-term NT sites in Southern Brazil support that the increase in macroaggregates and SOC stabilization rely on the continuous and diversified input of crop residues and continuous NT adoption [11,12,35,42,47,93,102]. Furthermore, the research highlights legumes as a key strategy to stimulate soil aggregation and stabilization (via mycorrhizas stimulation). Conversely, short t1/2 of legumes leading to short-term CO2-C emission and sharp N flush into the soil in CT may hinder formation of N-depending stable organo-mineral interactions, likely restricting SOC and N sequestration [28,76]. In our experimental area, Pires et al. [44] found greater arbuscular mycorrhizal fungal biomass as well as N-acetyl-glucosaminidase and Β-glucosidase activity (0–0.3 m depth) in NT compared to CT (Table S1), supporting that increasing t1/2 of legumes benefits fungal communities, consequently increasing SOC and N stocks. Accordingly, previous studies in our experimental site concluded that compared to CT, NT enhanced stabilization of easily degradable organic C by either physical occlusion or by intimate association with soil minerals, probably mediated by microbial compounds [27]. Lower hydrophilic C/hydrophobic C ratio of humic acids extracted from microaggregates in NT compared to CT was already reported for our soil (Table S1), suggesting lesser maturity of stabilized OM in NT.

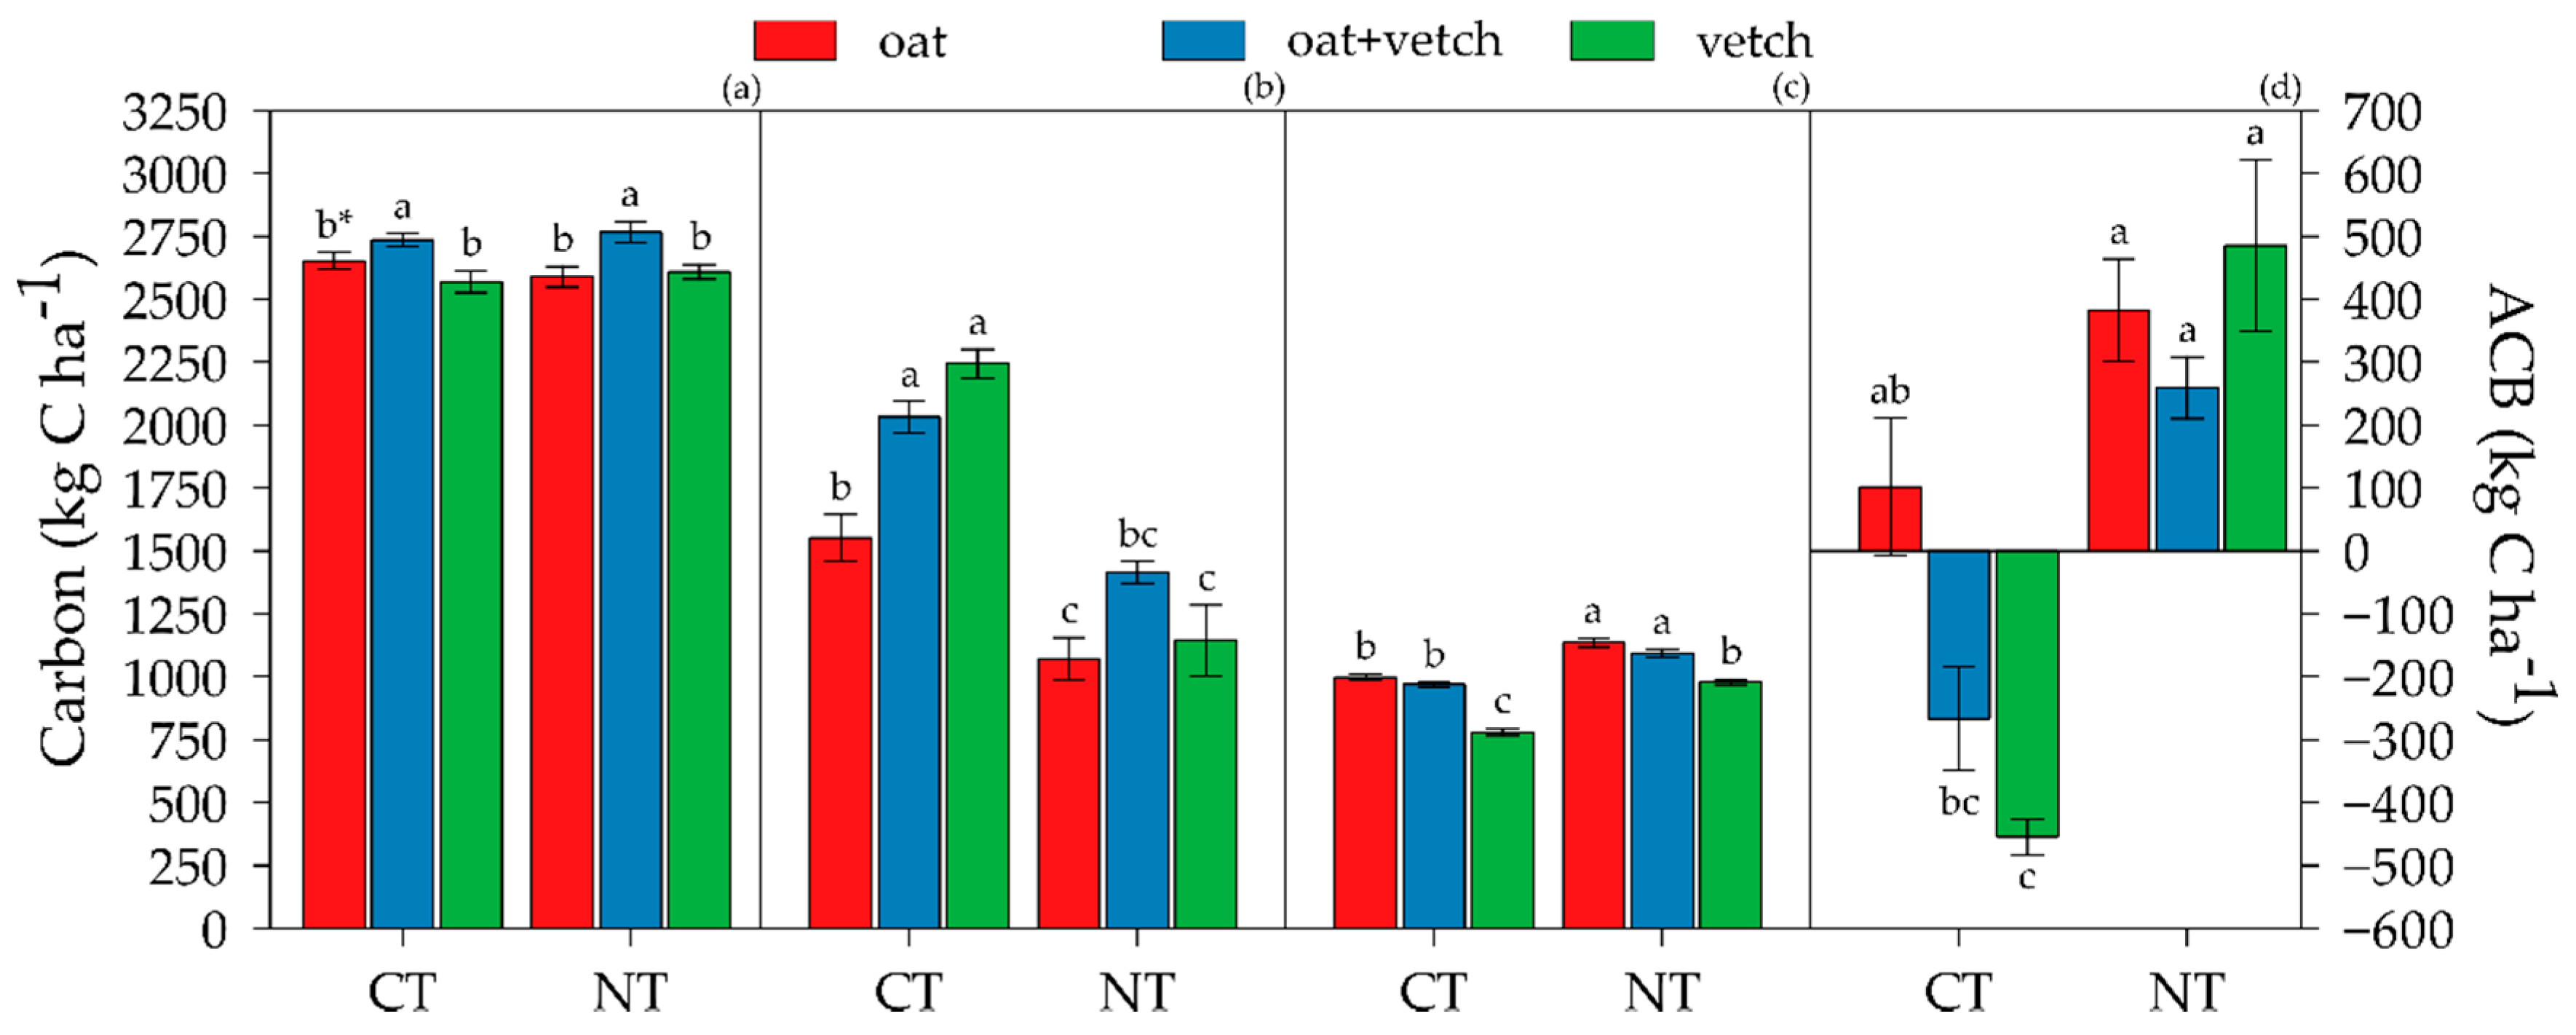
3.5. Apparent C Balance

The ACB dynamics indicated that NT acted as C sink about 1.6, 1.6, and 2.0 times longer compared to CT, for oat, oat + vetch and vetch, respectively (Figure 5).
In CT, as greater was the quality of the CC residue as shorter was the period that the system acted as C sink: vetch = 37 days (Figure 5c); oat + vetch = 43 days (Figure 5b); oat = 45 days (Figure 5a). In NT, this period was similar for the CC: vetch = 72 days (Figure 5f); oat + vetch = 69 days (Figure 5e); oat = 68 days (Figure 5d). The flush of available N to soil microorganisms due to the fast decomposition of vetch in CT may promote a fast growth of soil microbial biomass [90], which, in turn, can accelerate the decomposition of CC residues and of other soil C sources, as OM occluded into aggregates and made freshly available after aggregates disruption through tillage [46,69]. In NT, aggregates disruption was minimal, and vetch decomposition (Figure 4) and therefore N release to soil was slower, allowing N assimilation by microorganisms and favoring soil OM protection mechanisms [27,35,103,104].
The C input to the soil by CC ranged from 2589 to 2766 kg C ha−1 and was significantly greater in oat + vetch compared with oat and vetch, regardless of tillage system (Figure 6a). These values are coherent to the average annual (1985–2007) C input to the soil by CC ranging from 2120 (oat) to 2940 kg C ha−1 year−1 (oat + vetch) estimated by Nicoloso [38] in our experiment (Table S1). Besides adding more C to the soil compared with oat or vetch, the mix oat + vetch allows for balancing C and N inputs, thus synchronizing residues decomposition and recovery of released nutrients, mainly N, by crops and soil microorganisms [7,91,105]. Nevins et al. [106] found significantly greater species evenness among taxa in NT compared to CT, mainly when rye+hairy vetch was used instead of single rye or hairy vetch. This is in agreement with recent soil microbial biomass studies performed in our experimental area [44], as disposed in Table S1.
Compared to CT, NT significantly reduced the CO2-C emissions derived from oat, oat + vetch and vetch biomass by 31%, 30% and 49%, respectively (Figure 6b). In a meta-analysis study, Abdalla et al. [107] reported that CO2-C emissions were 23% lower in long-term NT (>10 years) than in CT. In NT, the mulch physical barrier to gas diffusion may be especially important when the crop biomass production is high [108], as that observed in our study (>6.3 Mg ha−1). Furthermore, in NT only the first layer of residues is in direct contact with soil, slowing residue decomposition, particularly relevant to vetch [73,109]. In CT, the C content in the remaining biomass of vetch at the end of the experiment was 17% and 21% lower compared to oat and oat + vetch, respectively (Figure 6c). In NT, these values were 16% and 13%. The C content in the remaining biomass of oat, oat + vetch and vetch in NT was 14%, 13%, and 25% greater than in CT, respectively.
In CT, positive ACB (influx) was observed only for oat (+101.6 kg C ha−1), while oat + vetch and vetch presented negative ACB (efflux) values of −267 and −454.8 kg C ha−1, respectively (Figure 6d). However, only vetch ACB significantly differed from oat (Figure 6d). In NT, ACB was positive for all CC, and treatments differed neither from each other nor from oat in CT (Figure 6d). Nevertheless, the rates of biomass C conversion to SOC for NT with vetch, oat and oat + vetch were 18.6%, 14.8% and 9.4%, respectively, suggesting that conversion was more efficient in vetch. Together these data confirm hypothesis “ii”. Greater C conversion rates (between 20% and 30%) reported by other authors usually take into account root C inputs [110], not evaluated in our study. Our values are close to that of a review reporting conversion of C of high- and low-quality biomass to SOC [111], and are compatible to findings of Gale and Cambardella [112], who found that 16% of the aboveground oat biomass C was converted to SOC after 360 days of decomposition in NT. Santos et al. [29] reported greater relative biomass C to SOC conversion factor in vetch legume-based (0.147) compared with grass-based rotation (0.057) in a 17-year old NT experiment in Southern Brazil. Our findings support Nicoloso et al. [42] who reported for our experimental site that SOC stock (0–0.3 m depth) in NT was 8.3 Mg C ha−1 (equivalent to 0.27 Mg C ha−1 year−1) greater than in CT after 22 years of experiment, under the crop rotation including oat + vetch (R2). This is also in agreement with a 18-year old experiment in Southern Brazil [113], where SOC accumulation rates (0–0.2 m depth) for oat/maize, vetch/maize, and oat + vetch/maize+cowpea in CT ranged from 0.09 (oat/maize) to 0.34 Mg ha−1 year−1 (oat + vetch/maize+cowpea) and were nearly half of that in NT, 0.19 (oat/maize) to 0.64 Mg ha−1 year−1 (oat + vetch/maize+cowpea). The authors concluded that SOC accumulation rates due to CC increased as oat < vetch < oat + vetch/cowpea. These results may be associated with an increase of microbial N (proteinaceous) compounds, which are preferentially adsorbed by mineral surfaces, increasing biomass C to SOC conversion rates, especially in soils with high clay and Fe oxides content [29,114]. Furthermore, Sisti et al. [13] argued that N2 fixation by legumes was more efficient in NT than in CT, and that it was associated with increase of SOC stock (0–0.3 m depth). According to the authors, the stimulation of soil OM turnover provoked by tillage partially inhibited N2 fixation in CT compared to NT [115]. These findings are in agreement with other works reporting increase in SOC accumulation rates in NT in response to N2-fixing legume CC [116,117,118,119].

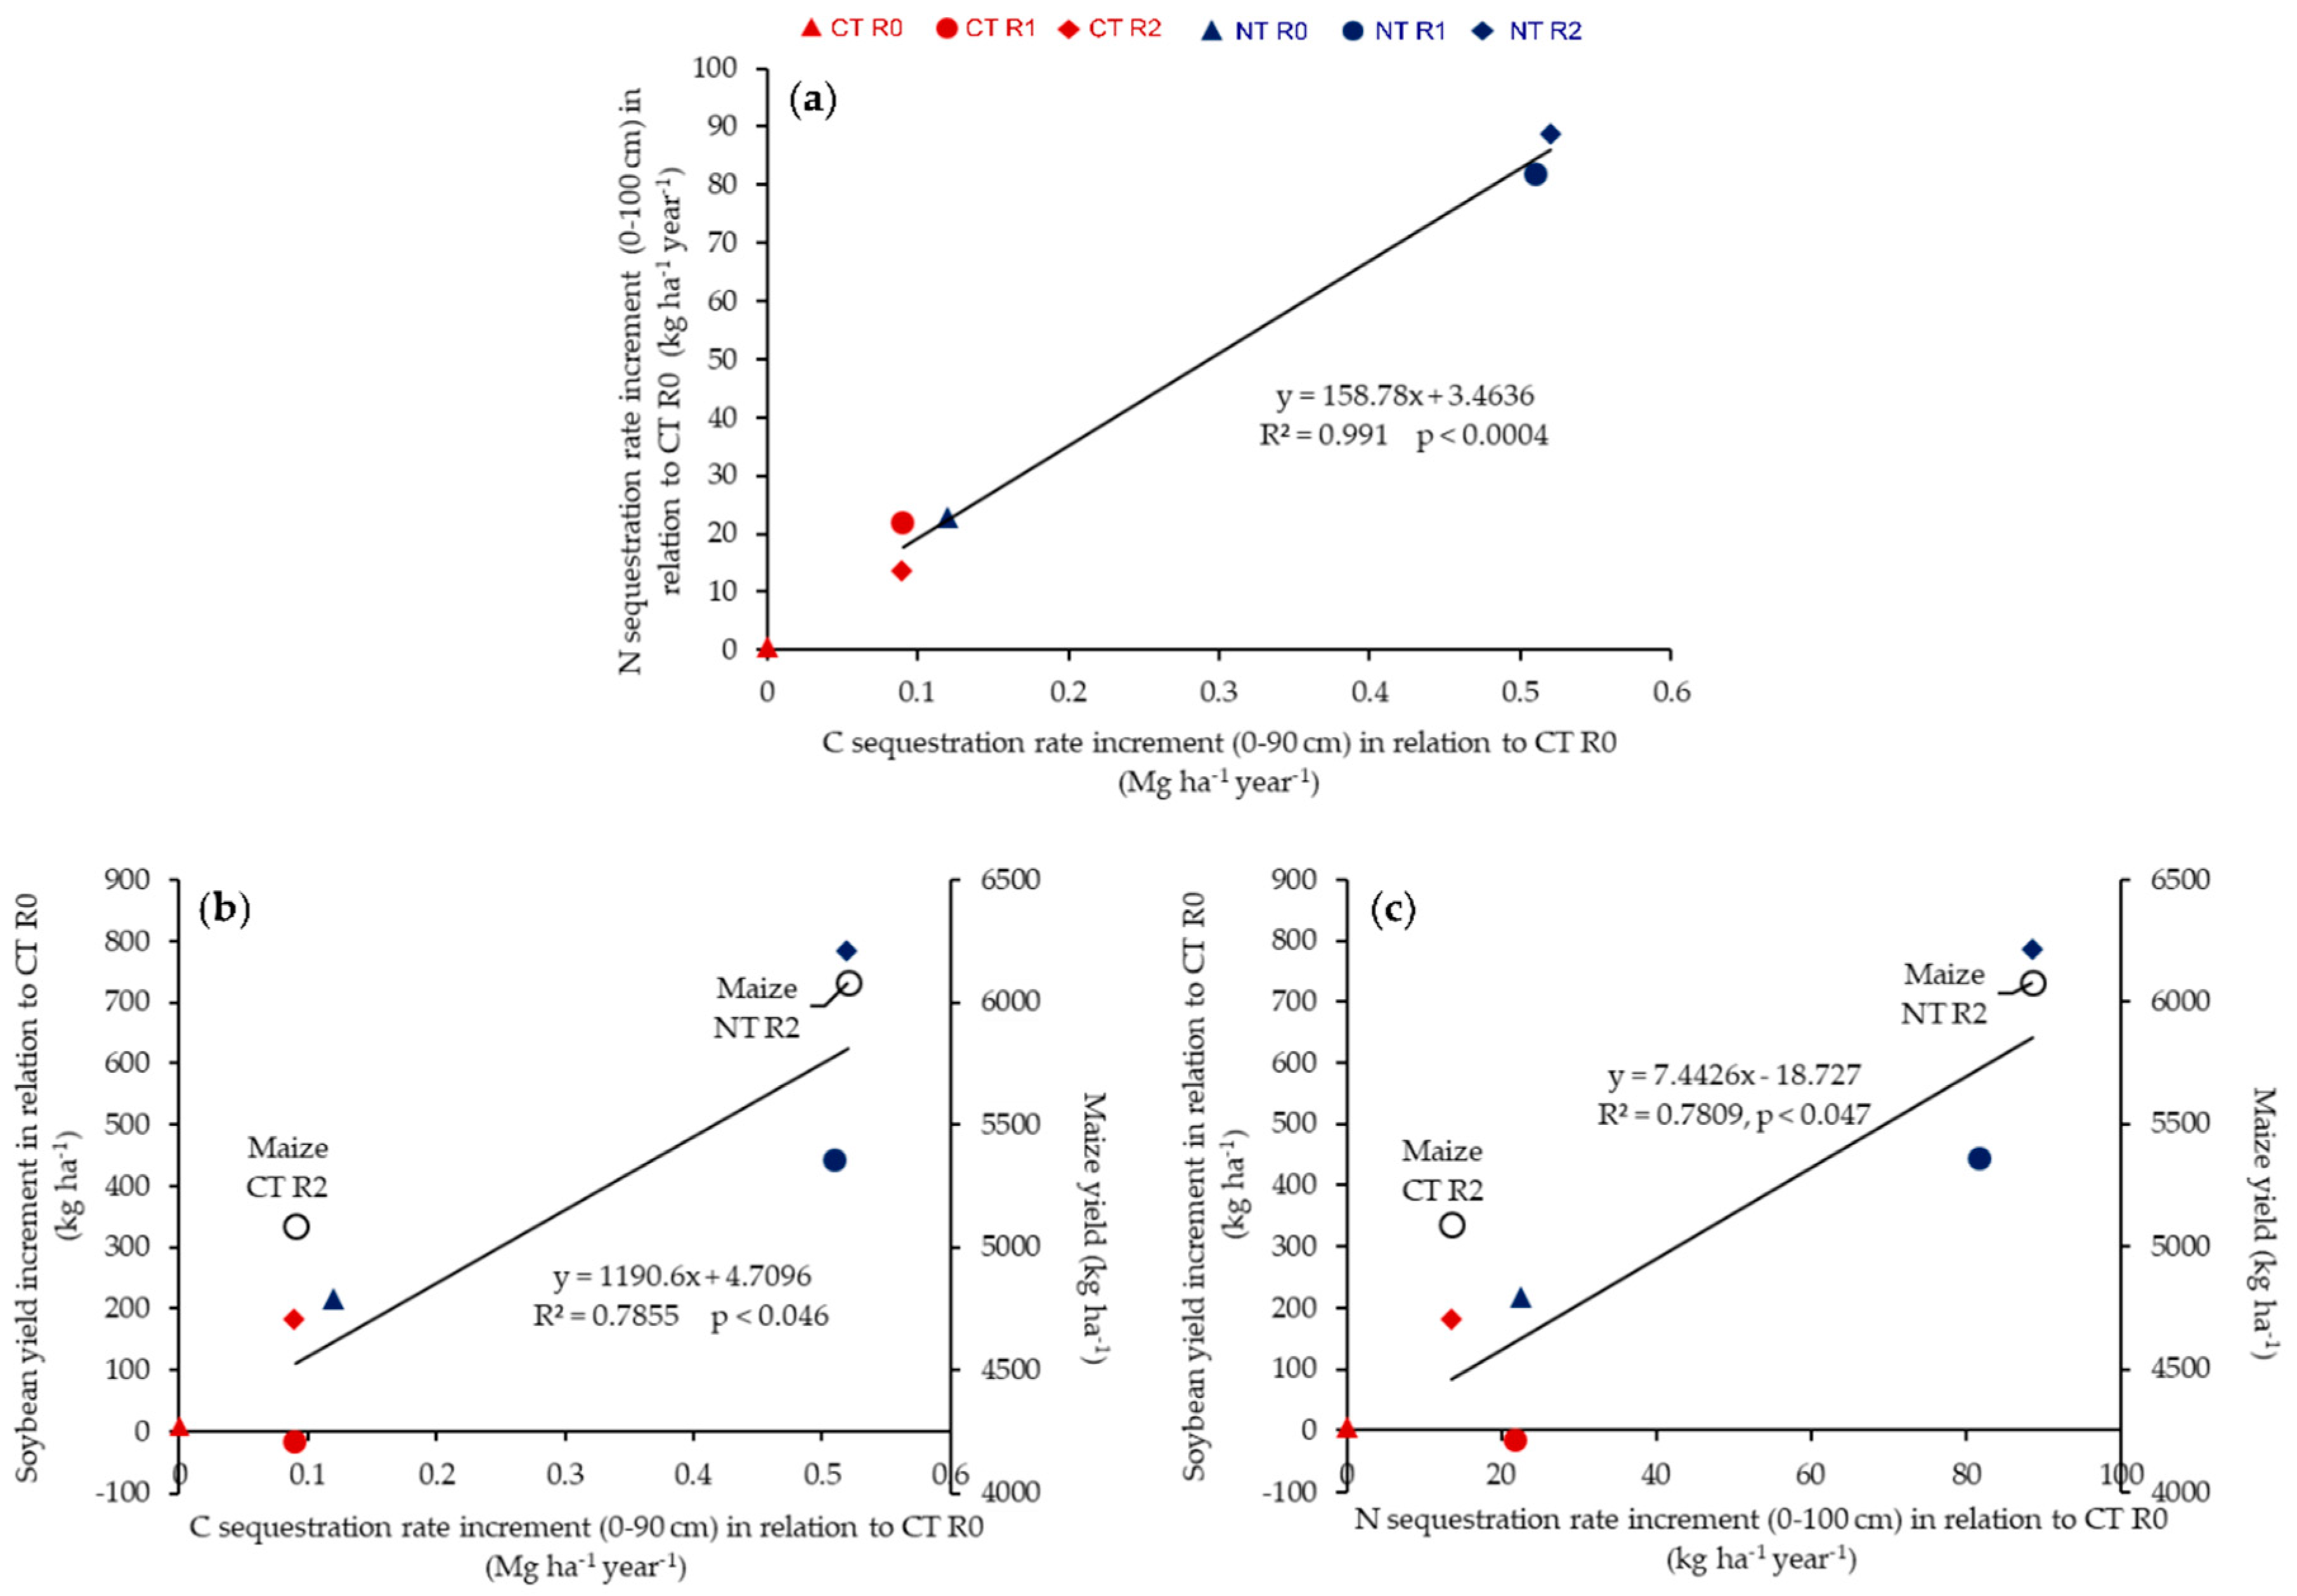
3.6. Linking CO2-C Emission and ACB to Long-Term Soil C and N Sequestration and Crop Yield

In this section, we linked our CO2-C and ACB findings to soil C and N sequestration (adapted from Nicoloso [38] and Nicoloso et al. [41]) and crop yield data (22 years) of our long-term experiment. Please, see details of long-term experiment design in Section 2.1.
The total accumulated CO2-C emissions (Figure 2) and ACB efflux (Figure 6d) of oat + vetch in NT were lower than in CT. Yet, the total accumulated CO2-C emission of oat + vetch in NT was 29% lower than that of oat in CT (Figure 2). These results partially explain the greater SOC accumulation rate in NT with oat + vetch as CC (R2) compared with CT with oat alone as CC (R1), as previously found by Nicoloso [38]. Average annual (1985–2007) SOC sequestration rate increments (0–90 cm depth) in CT R1, CT R2, NT R0, NT R1 and NT R2 in relation to the baseline CT R0 (6.00 Mg C ha−1 year−1) were 0.09, 0.09, 0.12, 0.51 and 0.52 Mg ha−1 year−1, respectively (Figure 7a). The higher ACB values observed in NT compared to CT (Figure 6d) contribute to explain such increments. In the same way, the similar ACB found for oat (allocated in R1 plots) and oat + vetch (allocated in R2 plots) in CT (Figure 6d) can partially justify the similar SOC sequestration rate increments observed for CT R1 and CT R2 (Figure 7a). In NT, the ACB for oat + vetch did not differ from that of oat (Figure 6d), while SOC sequestration rate increment in NT R2 was slightly greater than in NT R1 (Figure 7a). The greater N input to soil by oat + vetch compared to oat may have stimulated greater soil C and N sequestration rates in NT R2, probably by stimulating the association of N rich-organic compounds to soil minerals. In fact, the greatest average annual (1985–2007) N sequestration rate increment (0–100 cm) in relation to the baseline CT R0 (0.54 Mg ha−1 year−1) occurred in NT R2 (88.6 kg ha−1 year−1) (Figure 7b). The positive relation between soil N and SOC sequestration rate increments in the different treatments in relation to CT R0 corroborate this interpretation (Figure 7a).
Combining NT with the crop rotation that included oat + vetch (R2) promoted the greatest soil N and SOC sequestration rate increments (Figure 7a). The mitigation of CO2-C emissions by NT and the attenuation of N flush into soil, mainly from vetch decomposition, probably favored mechanisms of soil N and SOC accumulation in NT R2 according to the literature [21,22,28].
The soil N sequestration rate increment in NT R2 was 6.5 times greater than in CT R2, despite the fact that N balance (22 years) in NT R2 was 24% (622 kg ha−1) lower compared to CT R2 (Table S1). This difference is mainly assigned to greater N grain export due to crop yield increments in NT (Table S1). Thus, the greatest N sequestration rate in NT R2 may result from: (i) greater CC biomass input to soil; (ii) greater N2 fixation, mainly by vetch, and in lesser magnitude by soybean; and (iii) reduced soil N leaching and gaseous loss, enhancing N use and cycling, as suggested by greater N-acetyl-glucosaminidase activity in NT soil (Table S1). These results are corroborated by Bayer et al. [116], who found that soil N sequestration rate (0–0.3 m depth) under oat + vetch/corn+cowpea rotation was 45 kg ha−1 year−1 greater in NT than in CT.
From an economic and environmental perspective, we highlight that NT R2 delivered the greatest soil N and SOC sequestration rate increments in relation to the baseline treatment (CT R0), and that these increments were positively related to soybean and maize yield increments (Figure 7b,c), confirming hypothesis “iii”. Average annual yield increment of NT R2 over CT R2 was 603 kg ha−1 (33%) for soybean and 993 kg ha−1 (20%) for maize (Figure 7b,c). According to equations in Figure 7b,c, soil C (0–90 cm depth) and N (0–100 cm depth) sequestration increments of 1 kg ha−1 corresponded to soybean yield increments of 1.2 and 7.4 kg ha−1, respectively. These findings reinforce, and moreover quantify the benefit of legume-based NT systems to enhance soil C and N sequestration rates and soybean and maize yields, as similarly reported by Calzarano et al. [120] to wheat in rotation with faba beans. Our data is thought to encourage NT farmers to adopt grass+legume CC instead of single grass CC, which is business as usual.

4. Conclusions

No-tillage increased the t1/2 of all CC residue types in relation to CT, especially of low-quality residue (oat). Nevertheless, mitigation of accumulated CO2-C emission by NT compared to CT increased as greater was the quality of the CC residue, oat (500 kg ha−1), oat + vetch (600 kg ha−1) and vetch (642 kg ha−1).
Compared to CT, NT reduced oat, oat + vetch and vetch residues decomposition by 44%, 37% and 67%, respectively, within the first 30 days decomposition. Within this period, NT reduced the total accumulated CO2-C emission in oat, oat + vetch and vetch by 78%, 81% and 77%, respectively, compared to CT. For vetch, the CO2-C emission in CT and MT was 68% and 77% greater compared to NT, respectively. Therefore, we suggest that vetch should be preferentially combined with NT, and that MT should be rethought as compaction alleviation method, especially when performed just after legume cultivation.
In relation to CT, NT increased the ACB in oat + vetch and vetch by 195% and 207%, respectively, and although these treatments did not differ from oat ACB (either under CT or NT), they may trigger off greater long-term SOC sequestration due to their lower C/N ratio. This was supported by greater long-term soil C and N sequestration rate increments (1985–2007) in NT R2 compared to all other treatments (assuming CT R0 as baseline). Soil C and N stock increments were positively related to long-term soybean and maize average yield increments. Soil C (0–90 cm depth) and N (0–100 cm depth) sequestration increments of 1 kg ha−1 delivered soybean yield increments of 1.2 and 7.4 kg ha−1, respectively.
Our findings indicate that intercropping of oat + vetch instead of oat alone as winter CC should be encouraged in NT systems since the combination of minimum soil disturbance with high-quality residue delivered greater soil C and N sequestration rates and soybean and maize yields, without promoting further CC-derived CO2-C emissions. These results may be complemented by studies dedicated to assess CO2-C emissions and N leaching within the complete crop rotation season.

Supplementary Materials

The following are available online at https://www.mdpi.com/2073-4395/10/12/1848/s1, Table S1: Compilation of data from our long-term experiment comparing no-tillage (NT) and conventional tillage (CT) under crop rotation R2 (black oat/soybean/black oat + common vetch/maize/oilseed radish/wheat/soybean). Table S2: F-statistics (F), degrees of freedom (df) and probability values (p) for effects of tillage system (TS), cover crops (CC) and their interaction (TS × CC) on dry biomass (a), carbon (C) input by CC (b), nitrogen input by CC (c), daily average CO2-C emission from the 28 measuring days (d), total accumulated CO2-C emission during the 124 days (e), C in the CC biomass remaining in the litter-bags after 124 days (f), CC residues half-life time (g), and apparent C balance (h). Table S3: Average soil temperature, moisture and water-filled space porosity (WFSP) as affected by soil tillage: conventional tillage (CT), minimum tillage (MT) and no-tillage (NT) and cover crops: no cover crop (ncc), oat, oat + vetch and vetch. Values are means of 28 measuring days performed within the whole experimental period (124 days). Table S4: Relationship between CO2 emission and soil temperature and moisture.

Author Contributions

Conceptualization, T.J.C.A., C.K. and O.A.L.; methodology, T.J.C.A., C.K., G.B.R., R.P.B. and R.S.N.; formal analysis, C.K., G.B.R., R.S., R.P.B. and O.A.L.; investigation, O.A.L., C.K., T.J.C.A., J.E.F., C.W.R., G.B.R., R.S. and R.S.N.; resources, T.J.C.A., J.E.F., C.K. and O.A.L.; writing—original draft preparation, O.A.L., T.J.C.A., C.K., G.B.R., R.S. and C.W.R.; writing—review and editing, O.A.L., T.J.C.A., R.S.N. and C.W.R.; visualization, O.A.L., C.K., G.B.R., R.S.; supervision, T.J.C.A., O.A.L. and J.E.F.; project administration, C.K., T.J.C.A. and J.E.F. All authors have read and agreed to the published version of the manuscript.

Funding

This research received no external funding.

Acknowledgments

We thanks CNPq (Conselho Nacional de Desenvolvimento Científico e Tecnológico—process n° 23081.010820/2013-85) for financial support and for the scholarships of T.J.C.A., O.A.L and C.K.; CAPES (Coordenação de Aperfeiçoamento de Pessoal de Nível Superior) for the scholarship of G.B.R; Alexander von Humboldt Foundation for the Return Fellowship and Renewed Research Stay of O.A.L.; and Cooperativa Central Gaúcha Ltd.a for the use of the study site.

Conflicts of Interest

The authors declare no conflict of interest.

References

  1. Wingeyer, A.B.; Amado, T.J.C.; Pérez-Bidegain, M.; Studdert, G.A.; Varela, C.H.P.; Garcia, F.O.; Karlen, D.L. Soil quality impacts of current South American agricultural practices. Sustainability 2015, 7, 2213–2242. [Google Scholar] [CrossRef] [Green Version]
  2. FAO. The State of the World’s Land and Water Resources for Food and Agriculture (SOLAW)—Managing Systems at Risks. Food and Agriculture Organization of the United Nations. 2011. Available online: http://www.fao.org/3/a-i1688e.pdf (accessed on 21 June 2018).
  3. De Figueiredo, E.B.; Panosso, A.R.; Reicosky, D.C.; La Scala, N. Short-term CO2-C emissions from soil prior to sugarcane (Saccharum spp.) replanting in southern Brazil. GCB Bioenergy 2015, 7, 316–327. [Google Scholar] [CrossRef] [Green Version]
  4. FAO; ITPS. Status of the World’s Soil Resources (SWSR)—Main Report. Food and Agriculture Organization of the United Nations and Intergovernmental Technical Panel on Soils. 2015. Available online: http://www.fao.org/3/i5199e/i5199e.pdf (accessed on 22 June 2018).
  5. Sanderman, J.; Hengl, T.; Fiske, G.J. Soil carbon debt of 12,000 years of human land use. Proc. Natl. Acad. Sci. USA 2017, 114, 9575–9580. [Google Scholar] [CrossRef] [PubMed] [Green Version]
  6. Paustian, K.; Lehmann, J.; Ogle, S.; Reay, D.; Robertson, G.P.; Smith, P. Climate-smart soils. Nature 2016, 532, 49–57. [Google Scholar] [CrossRef] [PubMed] [Green Version]
  7. Hungria, M.; Franchini, J.C.; Brandão-Junior, O.; Kaschuk, G.; Souza, R.A. Soil microbial activity and crop sustainability in a long-term experiment with three soil-tillage and two crop-rotation systems. Appl. Soil Ecol. 2009, 42, 288–296. [Google Scholar] [CrossRef]
  8. Kassam, A.; Friedrich, T.; Derpsch, R. Global spread of Conservation Agriculture. Int. J. Environ. Stud. 2018, 76, 29–51. [Google Scholar] [CrossRef]
  9. Pittelkow, C.M.; Linquist, B.A.; Lundy, M.E.; Liang, X.; van Groenigen, K.J.; Lee, J.; van Gestel, N.; Six, J.; Venterea, R.T.; van Kessel, C. When does no-till yield more? A global meta-analysis. Field Crop. Res. 2015, 183, 156–168. [Google Scholar] [CrossRef] [Green Version]
  10. Amado, T.J.C.; Crusciol, C.A.C.; Costa, C.H.M.; Leal, O.A.; Pott, L.P. Rehabilitating degraded and abandoned agricultural lands with Conservation Agriculture systems. In Advances in Conservation Agriculture. Benefits and Practices, 1st ed.; Kassam, A., Farooq, M., Eds.; Burleigh Dodds Science Publishing Limited: Cambridge, UK, 2020; Volume 2, pp. 419–464. [Google Scholar]
  11. Ferreira, A.O.; Amado, T.J.C.; Nicoloso, R.S.; Sá, J.C.M.; Fiorin, J.E.; Hansel, D.S.S.; Menefee, D. Soil carbon stratification affected by long-term tillage and cropping systems in southern Brazil. Soil Tillage Res. 2013, 133, 65–74. [Google Scholar] [CrossRef]
  12. Ferreira, A.O.; Amado, T.J.C.; Rice, C.W.; Diaz, D.A.R.; Briedis, C.; Inagaki, T.M.; Gonçalves, D.R.P. Driving factors of soil carbon accumulation in Oxisols in long-termno-till systems of South Brazil. Sci. Total Environ. 2018, 622–623, 735–742. [Google Scholar] [CrossRef]
  13. Sisti, C.P.J.; Dos Santos, H.P.; Kohhann, R.; Alves, B.J.R.; Urquiaga, S.; Boddey, R.M. Change in carbon and nitrogen stocks in soil under 13 years of conventional or zero tillage in southern Brazil. Soil Tillage Res. 2004, 76, 39–58. [Google Scholar] [CrossRef]
  14. Brazil Ministry of Environment. Intended Nationally Determined Contributions, iNDC BRASIL. 2015. Available online: http://www.mma.gov.br/images/arquivo/80108/BRAZIL%20iNDC%20english%20FINAL.pdf (accessed on 12 May 2020).
  15. Zech, W.; Senesi, N.; Guggenberger, G.; Kaiser, K.; Lehmann, J.; Miano, T.M.; Miltner, A.; Schroth, G. Factors controlling humification and mineralization of soil organic matter in the tropics. Geoderma 1997, 79, 117–161. [Google Scholar] [CrossRef]
  16. Schlesinger, W.; Andrews, J. Soil respiration and the global carbon cycle. Biogeochemistry 2000, 48, 7–20. [Google Scholar] [CrossRef]
  17. Johnson, J.M.F.; Barbour, N.W.; Weyers, S.L. Chemical composition of crop biomass impacts its decomposition. Soil Sci. Soc. Am. J. 2007, 71, 155–162. [Google Scholar] [CrossRef] [Green Version]
  18. West, T.O.; Post, W.M. Soil organic carbon sequestration rates by tillage and crop rotation. Soil Sci. Soc. Am. J. 2002, 66, 1930–1946. [Google Scholar] [CrossRef] [Green Version]
  19. Lal, R. Farming carbon. Soil Tillage Res. 2007, 96, 1–5. [Google Scholar] [CrossRef]
  20. Schmidt, M.W.I.; Torn, M.S.; Abiven, S.; Dittmar, T.; Guggenberger, G.; Janssens, I.A.; Kleber, M.; Kögel-Knabner, I.; Lehmann, J.; Manning, D.A.C.; et al. Persistence of soil organic matter as an ecosystem property. Nature 2011, 478, 49–56. [Google Scholar] [CrossRef] [PubMed] [Green Version]
  21. Cotrufo, M.F.; Ranalli, M.G.; Haddix, M.L.; Six, J.; Lugato, E. Soil carbon storage informed by particulate and mineral-associated organic matter. Nat. Geosci. 2019, 12, 989–994. [Google Scholar] [CrossRef]
  22. Veloso, M.G.; Angers, D.A.; Chantigny, M.H.; Bayer, C. Carbon accumulation and aggregation are mediated by fungi in a subtropical soil under conservation agriculture. Geoderma 2020, 363, 114159. [Google Scholar] [CrossRef]
  23. White, P.M.; Rice, C.W. Tillage effects on microbial and carbon dynamics during plant residue decomposition. Soil Sci. Soc. Am. J. 2009, 73, 138–145. [Google Scholar] [CrossRef]
  24. Wilson, G.W.T.; Rice, C.W.; Rillig, M.C.; Springer, A.; Hartnett, D.C. Soil aggregation and carbon sequestration are tightly correlated with the abundance of arbuscular mycorrhizal fungi: Results from long-term field experiments. Ecol. Lett. 2009, 12, 452–461. [Google Scholar] [CrossRef]
  25. Cotrufo, M.F.; Soong, J.L.; Horton, A.J.; Campbell, E.E.; Haddix, M.L.; Wall, D.H.; Parton, W.J. Formation of soil organic matter via biochemical and physical pathways of litter mass loss. Nat. Geosci. 2015, 8, 776–779. [Google Scholar] [CrossRef]
  26. Kopttike, P.M.; Hernandez-Soriano, M.C.; Dalal, R.C.; Finn, D.; Menzies, N.W.; Hoeschen, C.; Mueller, C.W. Nitrogen-rich microbial products provide new organo-mineral associations for the stabilization of soil organic matter. Glob. Chang. Biol. 2018, 24, 1762–1770. [Google Scholar] [CrossRef] [PubMed]
  27. Arachchige, P.S.P.; Hettiarachchi, G.M.; Rice, C.W.; Dynes, J.J.; Maumann, L.; Wang, J.; Karunakaran, C.; Kilcoyne, A.L.D.; Attanayake, C.P.; Amado, T.J.C.; et al. Sub-micron level investigation reveals the inaccessibility of stabilized carbon in soil microaggregates. Sci. Rep. 2018, 8, 16810. [Google Scholar] [CrossRef] [PubMed]
  28. Veloso, M.G.; Angers, D.A.; Tiecher, T.; Giacomini, S.; Dieckow, J.; Bayer, C. High carbon storage in a previously degraded subtropical soil under no-tillage with legume cover crops. Agric. Ecosyst. Environ. 2018, 268, 15–23. [Google Scholar] [CrossRef]
  29. Santos, N.Z.D.; Dieckow, J.; Bayer, C.; Molin, R.; Favaretto, N.; Pauletti, V.; Piva, J.T. Forages, cover crops and related shoot and root additions in no-till rotations to C sequestration in a subtropical Ferralsol. Soil Tillage Res. 2011, 111, 208–218. [Google Scholar] [CrossRef]
  30. Boddey, R.M.; Jantalia, C.P.; Conceição, P.C.; Zanatta, J.A.; Bayer, C.; Mielniczuk, J.; Dieckow, J.; Dos Santos, H.P.; Denardin, J.; Aita, C.; et al. Carbon accumulation at depth in Ferralsols under zero-till subtropical agriculture. Glob. Chang. Biol. 2010, 16, 784–795. [Google Scholar] [CrossRef]
  31. Ebelhar, S.A.; Frye, W.W.; Blevins, R.L. Nitrogen from legume cover crops for no-tillage corn. Agron. J. 1984, 76, 51–55. [Google Scholar] [CrossRef]
  32. Holderbaum, J.F.; Decker, A.M.; Meisinger, J.J.; Mulford, F.R.; Vough, L.R. Fall-seeded legume cover crops for no-tillage corn in the humid east. Agron. J. 1990, 82, 117–124. [Google Scholar] [CrossRef]
  33. Seo, J.; Meisinger, J.J.; Lee, H. Recovery of nitrogen-15–labeled hairy vetch and fertilizer applied to corn. Agron. J. 2006, 98, 245–254. [Google Scholar] [CrossRef]
  34. Bayer, C.; Dieckow, J.; Amado, T.J.C.; Eltz, F.L.F.; Vieira, F.C.B. Cover crop effects increasing carbon storage in a subtropical no-till sandy Acrisol. Comm. Soil Sci. Plant Anal. 2009, 40, 1499–1511. [Google Scholar] [CrossRef]
  35. Conceição, P.C.; Dieckow, J.; Bayer, C. Combined role of no-tillage and cropping systems in soil carbon stocks and stabilization. Soil Tillage Res. 2013, 129, 40–47. [Google Scholar] [CrossRef]
  36. Chenu, C.; Angers, D.A.; Barré, P.; Derrien, D.; Arrouays, D.; Balesdent, J. Increasing organic stocks in agricultural soils: Knowledge gaps and potential innovations. Soil Tillage Res. 2018, 188, 41–52. [Google Scholar] [CrossRef]
  37. Campos, B.C.; Reinert, D.J.; Nicolidi, R.; Ruedell, J.; Petrere, C. Soil structural stability of a Dar-Red Latosol after seven years under crop rotation and management systems. Rev. Bras. Ciênc. Solo 1995, 19, 121–126. [Google Scholar]
  38. Nicoloso, R.S. Soil Organic Carbon Stocks and Stabilization Mechanisms on Temperate and Sub-Tropical Climate Agroecosystems. Ph.D. Thesis, Universidade Federal de Santa Maria, Rio Grande do Sul, Brazil, 21 July 2009. [Google Scholar]
  39. Campos, B.C.; Carneiro, T.J.C.; Bayer, C.; Nicoloso, R.D.S.; Fiorin, J.E. Carbon stock and its compartments in a subtropical Oxisol under long-term tillage and crop rotation systems. Rev. Bras. Cienc. Solo 2011, 35, 805–817. [Google Scholar] [CrossRef]
  40. Campos, B.C.; Amado, T.J.C.; Tornquist, C.G.; Nicoloso, R.S.; Fiorin, J.E. Long-term C-CO2 emissions and carbon crop residue mineralization in an Oxisol under different tillage and crop rotation systems. Rev. Bras. Ciênc. Solo 2011, 35, 819–832. [Google Scholar] [CrossRef]
  41. Nicoloso, R.S.; Amado, T.J.C.; Rice, C.W.; Pires, C.A.B.; Fiorin, J.E. A rotação de culturas aumenta os estoques de carbono e nitrogênio no solo sob sistema plantio direto. In Resultados Comparativos de 32 Anos dos Sistemas Plantio Direto e Convencional, 1st ed.; Fiorin, J.E., Ruedell, J., Fernandes, A.M.F., Eds.; Sescoop/RS: Rio Grande do Sul, Brazil, 2019; Volume 1, pp. 143–155. ISBN 978-85-63500-43-4. [Google Scholar]
  42. Nicoloso, R.S.; Amado, T.J.C.; Rice, C.W. Assessing strategies to enhance soil carbon sequestration with the DSSAT-CENTURY model. Eur. J. Soil Sci. 2020, 71, 1034–1049. [Google Scholar] [CrossRef]
  43. Fabrizzi, K.P.; Rice, C.W.; Amado, T.J.C.; Fiorin, J.E.; Barbagelata, P.; Melchiori, M. Protection of soil organic C and N in temperate and tropical soils: Effect of native and agroecosystems. Biogeochemistry 2009, 92, 129–143. [Google Scholar] [CrossRef]
  44. Pires, C.A.B.; Amado, T.J.C.; Reimche, G.; Schwalbert, R.; Sarto, M.V.M.; Nicoloso, R.S.; Fiorin, J.E.; Rice, C.W. Diversified crop rotation with no-till changes microbial distribution with depth and enhances activity in a subtropical Oxisol. Eur. J. Soil Sci. 2020, 71, 1173–1187. [Google Scholar] [CrossRef]
  45. Fiorin, J.E.; Ruedell, J.; Fernandes, A.M.F. Efeito dos sistemas de manejo de solo e da rotação de culturas sobre o rendimento de grãos de milho, soja e trigo. In Resultados Comparativos de 32 Anos dos Sistemas Plantio Direto e Convencional, 1st ed.; Fiorin, J.E., Ruedell, J., Fernandes, A.M.F., Eds.; Sescoop/RS: Rio Grande do Sul, Brazil, 2019; Volume 1, pp. 65–82. ISBN 978-85-63500-43-4. [Google Scholar]
  46. Pes, L.Z.; Amado, T.J.C.; La Scala, N.; Bayer, C.; Fiorin, J.E. The primary sources of carbon loss during the crop-establishment period in a subtropical Oxisol under contrasting tillage systems. Soil Tillage Res. 2011, 117, 163–171. [Google Scholar] [CrossRef]
  47. Ferreira, A.O.; Amado, T.J.C.; Rice, C.W.; Diaz, D.A.R.; Keller, C.; Inagaki, T.M. Can no-till grain production restore soil organic carbon to levels natural grass in a subtropical Oxisol? Agric. Ecosyst. Environ. 2016, 229, 13–20. [Google Scholar] [CrossRef]
  48. Soil Survey Staff. Keys to Soil Taxonomy, 12th ed.; United States Department of Agriculture Natural Resources Conservation Service: Washington, DC, USA, 2014; pp. 257–271.
  49. Inda, A.V., Jr.; Klamt, E.; Nascimento, P.C. Composição da fase sólida mineral do solo. In Fundamentos de Química Do Solo, 2nd ed.; Meurer, E.J., Ed.; Gênesis: Rio Grande do Sul, Brazil, 2004; pp. 35–71. [Google Scholar]
  50. Albuquerque, J.A.; Reinert, D.J.; Fiorin, J.E.; Ruedell, J.; Petrere, C.; Fontinelli, F. Crop rotation and soil management systems: Effects on soil structure form after seven years. Rev. Bras. Ciênc. Solo 1995, 19, 115–119. [Google Scholar]
  51. Ruedell, J.; Fiorin, J.E.; Wyzykowski, T.; Fernandes, A.M.F.; Campos, B.C. Descrição do experimento de longa duração: 32 anos. In Resultados Comparativos de 32 Anos Dos Sistemas Plantio Direto e Convencional, 1st ed.; Fiorin, J.E., Ruedell, J., Fernandes, A.M.F., Eds.; Sescoop/RS: Rio Grande do Sul, Brazil, 2019; Volume 1, pp. 51–64. ISBN 978-85-63500-43-4. [Google Scholar]
  52. La Scala, N.; Lopes, A.; Marques, J.; Pereira, G.T. Carbon dioxide emissions after application of tillage systems for a dark red latosol in southern Brazil. Soil Tillage Res. 2001, 62, 163–166. [Google Scholar] [CrossRef]
  53. Walkley, A.; Black, A. An examination of the Degtjareff method for determining soil organic matter, and a proposed modification of the chromic acid titration method. Soil Sci. 1934, 37, 29–38. [Google Scholar] [CrossRef]
  54. Yeomans, J.C.; Bremner, J.M. A rapid and precise method for routine determination of organic carbon in soil. Commun. Soil Sci. Plan. 1998, 19, 1467–1476. [Google Scholar] [CrossRef]
  55. Bremner, J.M.; Mulvaney, C.S. Nitrogen-total. In Methods of Soil Analysis. Chemical and Microbiological Properties, 2nd ed.; Klute, A., Page, A.L., Miller, R.H., Keeney, D.R., Eds.; American Society of Agronomy: Madison, WI, USA, 1982; Volume 9, pp. 595–624. [Google Scholar]
  56. Wieder, R.K.; Lang, G.E. A critique of the analytical methods used in examining decomposition data obtained from litter bags. Ecology 1982, 63, 1636–1642. [Google Scholar] [CrossRef] [Green Version]
  57. Plant, A.F.; Parton, W.J. The dynamics of soil organic matter and nutrient cycling. In Soil Microbiology, Ecology and Biochemistry, 3rd ed.; Paul, E.A., Ed.; Academic Press: San Diego, CA, USA, 2007; pp. 433–467. [Google Scholar]
  58. Pinheiro, J.; Bates, D.; DebRoy, S.; Sarkar, D.; R Core Team. nlme: Linear and Nonlinear Mixed Effects Models; R Package Version 3.1-145. 2020. Available online: https://cran.r-project.org/web/packages/nlme/index.html (accessed on 18 November 2020).
  59. R Core Team. R: A Language and Environment for Statistical Computing; R Foundation for Statistical Computing: Vienna, Austria, 2020; Available online: https://www.R-project.org/ (accessed on 20 November 2019).
  60. Campos, B.C. Carbon Dynamics on a Rhodic Hapludox on Soil Tillage and Crop Systems. Ph.D. Thesis, Universidade Federal de Santa Maria, Rio Grande do Sul, Brazil, 27 April 2006. [Google Scholar]
  61. Bortolotto, R.P.; Amado, T.J.C.; Nora, D.D.; Keller, C.; Roberti, D.; Fiorin, J.E.; Reichardt, K.; Zamberlan, J.F.; Pasini, M.P.B.; Nicoloso, R.S. Soil carbon dioxide flux in a no-tillage winter system. Afri. J. Agr. Res. 2015, 10, 450–457. [Google Scholar] [CrossRef]
  62. O’Connell, A.M. Microbial decomposition (respiration) of litter in eucalypt forests of South-Western Australia: An empirical model based on laboratory incubations. Soil Biol. Biochem. 1990, 22, 153–160. [Google Scholar] [CrossRef]
  63. Paustian, K.; Andrén, O.; Janzen, H.H.; Lal, R.; Smith, P.; Tian, G.; Tiessen, H.; Noordwijk, M.; Woomer, P.L. Agricultural soils as a sink to mitigate CO2 emissions. Soil Use Manag. 1997, 13, 230–244. [Google Scholar] [CrossRef]
  64. Linn, D.M.; Doran, J.W. Effect of water-filled pore space on carbon dioxide and nitrous oxide production in tilled and nontilled soils. Soil Sci. Soc. Am. J. 1984, 48, 1267–1272. [Google Scholar] [CrossRef] [Green Version]
  65. Quincke, J.A.; Wortmann, C.S.; Mamo, M.; Franti, T.; Drijber, R.A. Occasional tillage of no-till systems: Carbon dioxide flux and changes in total and labile soil organic carbon. Agron. J. 2007, 99, 1158–1168. [Google Scholar] [CrossRef]
  66. Aita, C.; Chiapinotto, I.C.; Giacomini, S.J.; Hübner, A.P.; Marques, M.G. Decomposition of black oat straw and pig slurry in a soil under no-tillage. Rev. Bras. Ciênc. Solo 2006, 30, 149–161. (In Portuguese) [Google Scholar] [CrossRef] [Green Version]
  67. Hendry, M.J.; Wassenaar, L.I.; Birkham, T.K. Microbial respiration and diffusive transport of O2, 16O2, and 18O16O in unsaturated soils: A mesocosm experiment. Geochim. Cosmochim. Acta 2002, 66, 3367–3374. [Google Scholar] [CrossRef]
  68. Risk, D.; Kellman, L.; Beltrami, H. Carbon dioxide in soil profiles: Production and temperature dependence. Geophys. Res. Lett. 2002, 29, 11–14. [Google Scholar] [CrossRef] [Green Version]
  69. La Scala, N.; Lopes, A.; Spokas, K.; Archer, D.W.; Reicoscky, D.C. Short-term temporal changes of bare soil CO2 fluxes after tillage described by first-order decay models. Eur. J. Soil Sci. 2009, 60, 258–264. [Google Scholar] [CrossRef]
  70. Reicosky, D.C.; Lindstrom, M.J. Fall tillage method: Effect on short-term carbon dioxide flux from soil. Agron. J. 1993, 85, 1237–1243. [Google Scholar] [CrossRef]
  71. La Scala, N.; Lopes, A.; Panosso, A.R.; Camara, F.T.; Pereira, G.T. Soil CO2 efflux following rotary tillage of a tropical soil. Soil Tillage Res. 2005, 84, 222–225. [Google Scholar] [CrossRef]
  72. Teixeira, L.G.; Corradi, M.M.; Fukuda, A.; Panosso, A.R.; Reicoscky, D.; Lopes, A.; La Scala, N. Soil and crop residue CO2-C emission under tillage systems in sugarcane-producing areas of southern Brazil. Sci. Agric. 2013, 70, 327–335. [Google Scholar] [CrossRef] [Green Version]
  73. Rigon, J.P.G.; Calonego, J.C.; Rosolem, C.A.; La Scala, N. Cover crop rotations in no-till system: Short-term CO2 emissions and soybean yield. Sci. Agric. 2018, 75, 18–26. [Google Scholar] [CrossRef]
  74. Reicosky, D.C.; Archer, D.W. Moldboard plow tillage depth and short-term carbon dioxide release. Soil Tillage Res. 2007, 94, 109–121. [Google Scholar] [CrossRef]
  75. Reicosky, D.C.; Dugas, W.A.; Torbert, H.A. Tillage-induced soil carbon dioxide loss from different cropping systems. Soil Tillage Res. 1997, 41, 105–118. [Google Scholar] [CrossRef]
  76. Aita, C.; Giacomini, S.J. Crop residue decomposition and nitrogen release in single and mixed cover crops. Rev. Bras. Ciênc. Solo 2003, 27, 601–612. (In Portuguese) [Google Scholar] [CrossRef]
  77. Abdalla, M.; Hastings, A.; Helmy, M.; Prescher, A.; Osborne, B.; Lanigan, G.; Forristal, D.; Killi, D.; Maratha, P.; Williams, M.; et al. Assessing the combined use of reduced tillage and cover crops for mitigating greenhouse gas emissions from arable ecosystem. Geoderma 2014, 223–225, 9–20. [Google Scholar] [CrossRef]
  78. Rochette, P.; Angers, D.A. Soil surface carbon dioxide fluxes induced by spring, summer, and fall moldboard plowing in a sandy loam. Soil Sci. Soc. Am. J. 1999, 63, 621–628. [Google Scholar] [CrossRef]
  79. La Scala, N.; Lopes, A.; Spokas, K.; Bolonhezi, D.; Archer, D.W.; Reicosky, D.C. Short-term temporal changes of soil carbon losses after tillage described by a first-order decay model. Soil Tillage Res. 2008, 99, 108–118. [Google Scholar] [CrossRef]
  80. Alvarez, R.; Alvarez, C.R.; Lorenzo, G. Carbon dioxide fluxes following tillage from a mollisol in the Argentine Rolling Pampa. Eur. J. Soil Biol. 2001, 37, 161–166. [Google Scholar] [CrossRef]
  81. Prior, S.A.; Rogers, H.H.; Runion, G.B.; Torbert, H.A.; Reicosky, D.C. Carbon dioxide-enriched agroecosystems: Influence of tillage on short-term soil carbon dioxide efflux. J. Environ. Qual. 1997, 26, 244–252. [Google Scholar] [CrossRef]
  82. Prior, S.A.; Reicosky, D.C.; Reeves, D.W.; Runion, G.B.; Raper, R.L. Residue and tillage effects on planting implement-induced short-term CO2 and water loss from a loamy sand soil in Alabama. Soil Tillage Res. 2000, 54, 197–199. [Google Scholar] [CrossRef]
  83. Reicosky, D.C.; Lindstrom, M.J.; Schumacher, T.E.; Lobb, D.E.; Malo, D.D. Tillage-induced CO2 loss across an eroded landscape. Soil Tillage Res. 2005, 81, 183–194. [Google Scholar] [CrossRef]
  84. La Scala, N.; Bolonhezi, D.; Pereira, G.T. Short-term soil CO2 emission after conventional and reduced tillage of a no-till sugar cane area in southern Brazil. Soil Tillage Res. 2006, 91, 244–248. [Google Scholar] [CrossRef]
  85. Costa, F.S.; Bayer, C.; Zanatta, J.A.; Mielniczuk, J. Carbon stock and carbon dioxide emissions as affected by soil management systems in southern Brazil. Rev. Bras. Ciênc. Solo 2008, 32, 323–332. (In Portuguese) [Google Scholar] [CrossRef]
  86. Sainju, U.M.; Singh, B.P.; Whitehead, W.F. Long-term effects of tillage, cover crops, and nitrogen fertilization on organic carbon and nitrogen concentrations in sandy loam soils in Georgia, USA. Soil Tillage Res. 2002, 63, 167–179. [Google Scholar] [CrossRef]
  87. Al-Kaisi, M.M.; Yin, X. Tillage and crop residue effects on soil carbon and carbon dioxide emission in corn–soybean rotations. J. Environ. Qual. 2005, 34, 437–445. [Google Scholar] [CrossRef] [PubMed]
  88. Li, L.J.; Han, X.Z.; You, M.Y.; Yuan, Y.R.; Ding, X.L.; Qiao, Y.F. Carbon and nitrogen mineralization patterns of two contrasting crop residues in a Mollisol: Effects of residue type and placement in soils. Eur. J. Soil Biol. 2013, 54, 1–6. [Google Scholar] [CrossRef]
  89. Sievers, T.; Cook, R.L. Aboveground and root decomposition of cereal rye and hairy vetch cover crops. Soil Sci. Soc. Am. J. 2018, 82, 147–155. [Google Scholar] [CrossRef]
  90. Acosta, J.A.A.; Amado, T.J.C.; Neergaard, A.; Vinther, M.; Silva, L.S.; Nicoloso, R.S. Effect of 15N-labeled hairy vetch and nitrogen fertilization on maize nutrition and yield under no-tillage. Rev. Bras. Ciênc. Solo 2011, 35, 1337–1345. [Google Scholar] [CrossRef] [Green Version]
  91. Jackson, L.E.; Calderon, F.J.; Steenwerth, K.L.; Scow, K.M.; Rolston, D.E. Responses of soil microbial processes and community structure to tillage events and implications for soil quality. Geoderma 2003, 114, 305–317. [Google Scholar] [CrossRef]
  92. Kramberger, B.; Gselman, A.; Janzekovic, M.; Kaligaric, M.; Bracko, B. Effects of cover crops on soil mineral nitrogen and on the yield and nitrogen content of maize. Eur. J. Agron. 2009, 31, 103–109. [Google Scholar] [CrossRef]
  93. Veloso, M.G.; Dick, D.P.; Costa, J.B.; Bayer, C. Cropping systems including legume cover crops favour mineral–organic associations enriched with microbial metabolites in no-till soil. Soil Res. 2019, 57, 851–858. [Google Scholar] [CrossRef]
  94. Poffenbarger, H.J.; Mirsky, S.B.; Weil, R.R.; Kramer, M.; Spargo, J.T.; Cavigelli, M.A. Legume proportion, poultry litter, and tillage effects on cover crop decomposition. Agron. J. 2015, 107, 2083–2096. [Google Scholar] [CrossRef]
  95. Teasdale, J.R.; Mohler, C.L. Light transmittance, soil temperature, and soil moisture under residue of hairy vetch and rye. Agron. J. 1993, 85, 673–680. [Google Scholar] [CrossRef]
  96. Manzoni, S.; Jackson, R.B.; Trofymow, J.A.; Porporato, A. The global stoichiometry of litter nitrogen mineralization. Science 2008, 321, 684–686. [Google Scholar] [CrossRef]
  97. Kallenbach, C.M.; Frey, S.D.; Grandy, A.S. Direct evidence for microbial-derived soil organic matter formation and its ecophysiological controls. Nat. Commun. 2016, 7, 13630. [Google Scholar] [CrossRef]
  98. Maron, P.A.; Sarr, A.; Kaisermann, A.; Lévêque, J.; Mathieu, O.; Guigue, J.; Karimi, B.; Bernard, L.; Dequiedt, S.; Terrat, S.; et al. High microbial diversity promotes soil ecosystem functioning. Appl. Environ. Microbiol. 2018, 84, 1–13. [Google Scholar] [CrossRef] [Green Version]
  99. Mikha, M.M.; Rice, C.W. Tillage and manure effects on soil and aggregate- associated carbon and nitrogen. Soil Sci. Soc. Am. J. 2004, 68, 809–816. [Google Scholar] [CrossRef]
  100. Dieckow, J.; Mielniczuk, J.; Knicer, H.; Bayer, H.; Dick, D.P.; Kögel-Knaber, I. Soil C and N stocks as affected by cropping systems and nitrogen fertilisation in a southern Brazil Acrisol managed under no-tillage for 17 years. Soil Tillage Res. 2005, 81, 87–95. [Google Scholar] [CrossRef]
  101. Totsche, K.U.; Amelung, W.; Gerbazek, M.; Guggenberger, G.; Klumpp, E.; Knief, C.; Lehndorff, E.; Mikutta, R.; Peth, S.; Pretchel, A.; et al. Microaggregates in soils. J. Plant Nutr. Soil Sci. 2017, 181, 104–136. [Google Scholar] [CrossRef] [Green Version]
  102. Ferreira, A.O.; Sá, J.C.M.; Lal, R.; Tivet, F.; Briedis, C.; Inagaki, T.M.; Gonçalves, D.R.P.; Romaniw, J. Macroaggregation and soil organic carbon restoration in a highly weathered Brazilian Oxisol after two decades under no-till. Sci. Total Environ. 2018, 621, 1559–1567. [Google Scholar] [CrossRef]
  103. Dieckow, J.; Bayer, C.; Conceição, P.C.; Zanatta, J.A.; Martin-Neto, L.; Milori, D.M.M.; Salton, J.C.; Macedo, M.M.; Mielniczuk, J.; Hernani, L.C. Land use, tillage, texture and organic matter stock and composition in tropical and subtropical Brazilian soils. Eur. J. Soil Sci. 2009, 60, 249. [Google Scholar] [CrossRef]
  104. Reis, C.E.S.; Dick, D.P.; Caldas, J.S.; Bayer, C. Carbon sequestration in clay and silt fractions of Brazilian soils under conventional and no-till systems. Sci. Agric. 2014, 71, 292–301. [Google Scholar] [CrossRef] [Green Version]
  105. Giacomini, S.J.; Recous, S.; Mary, B.; Aita, C. Simulating the effects of N availability, straw particle size and location in soil on C and N mineralization. Plant Soil 2007, 301, 289–301. [Google Scholar] [CrossRef]
  106. Nevins, C.J.; Nakatsu, C.; Armstrong, S. Characterization of microbial community response to cover crop residue decomposition. Soil Biol. Biochem. 2018, 127, 39–49. [Google Scholar] [CrossRef]
  107. Abdalla, K.; Chivenge, P.; Ciais, P.; Chaplot, V. No-tillage lessens soil CO2 emissions the most under arid and sandy soil conditions: Results from a meta-analysis. Biogeosciences 2016, 13, 3619–3633. [Google Scholar] [CrossRef] [Green Version]
  108. Schwen, A.; Jeitler, E.; Böttcher, J. Spatial and temporal variability of soil gas diffusivity, its scaling and relevance for soil respiration under different tillage. Geoderma 2015, 259–260, 323–336. [Google Scholar] [CrossRef]
  109. Schmatz, R.; Recous, S.; Aita, C.; Tahir, M.M.; Schu, A.L.; Chaves, B.; Giacomini, S.J. Crop residue quality and soil type influence the priming effect but not the fate of crop residue C. Plant Soil 2017, 414, 229–245. [Google Scholar] [CrossRef]
  110. Kuzyakov, Y.; Domanski, G. Carbon input by plants into the soil. Rev. J. Plant Nutr. Soil Sci. 2000, 163, 421–431. [Google Scholar] [CrossRef]
  111. Castellano, M.J.; Mueller, K.E.; Olk, D.C.; Sawyer, J.E.; Six, J. Integrating plant litter quality, soil organic matter stabilization, and the carbon saturation concept. Glob. Chang. Biol. 2015, 21, 3200–3209. [Google Scholar] [CrossRef]
  112. Gale, W.; Cambardella, C.A. Carbon dynamics of surface residue- and root-derived organic matter under simulated no-till. Soil Sci. Soc. Am. J. 2000, 64, 190–195. [Google Scholar] [CrossRef]
  113. Zanatta, J.A.; Bayer, C.; Dieckow, J.; Vieira, F.C.B.; Mielniczuk, J. Soil organic carbon accumulation and carbon costs related to tillage, cropping systems and nitrogen fertilization in a subtropical Acrisol. Soil Tillage Res. 2007, 94, 510–519. [Google Scholar] [CrossRef]
  114. Kleber, M.; Sollins, P.; Sutton, R. A conceptual model of organo-mineral interactions in soils: Self-assembly of organic molecular fragments into zonal structures on mineral surfaces. Biogeochemistry 2007, 85, 9–24. [Google Scholar] [CrossRef]
  115. Torabian, S.; Farhangi-Abriz, S.; Denton, M.D. Do tillage systems influence nitrogen fixation in legumes? A review. Soil Tillage Res. 2019, 185, 113–121. [Google Scholar] [CrossRef]
  116. Bayer, C.; Mielniczuk, J.; Amado, T.J.C.; Martin-Neto, L.; Fernandes, S.V. Organic matter storage in a sandy clay loam acrisol affected by tillage and cropping systems in southern Brazil. Soil Tillage Res. 2000, 54, 101–109. [Google Scholar] [CrossRef]
  117. Bayer, C.; Lovato, T.; Dieckow, J.; Zanatta, J.A.; Mielniczuk, J. A method for estimating coefficients of soil organic matter dynamics based on long-term experiments. Soil Tillage Res. 2006, 91, 217–226. [Google Scholar] [CrossRef]
  118. Amado, T.J.C.; Bayer, C.; Conceição, P.C.; Spagnollo, E.; Campos, B.H.C.; Veiga, M. Potential of carbon accumulation in no-till soils with intensive use and cover crops in southern Brazil. J. Environ. Qual. 2006, 35, 1599–1607. [Google Scholar] [CrossRef] [PubMed]
  119. Gonzalez-Sanchez, E.J.; Veroz-Gonzalez, O.; Conway, G.; Moreno-Garcia, M.; Kassam, A.; Mkomwa, S.; Ordoñez-Fernandez, R.; Triviño-Tarradas, P.; Carbonell-Bojollo, R. Meta-analysis on carbon sequestration through conservation agriculture in Africa. Soil Tillage Res. 2019, 190, 22–30. [Google Scholar] [CrossRef]
  120. Calzarano, F.; Stagnari, F.; D’Egidio, S.; Pagnani, G.; Galieni, A.; Di Marco, S.; Metruccio, E.G.; Pisante, M. Durum wheat quality, yield and sanitary status under conservation agriculture. Agriculture 2018, 8, 140. [Google Scholar] [CrossRef] [Green Version]
Figure 1. Temporal CO2-C emission for the total experimental period (124 days) and first 30 days after tillage (critical period) for cover crop types (ncc—no cover crop, oat, oat + vetch and vetch) within tillage systems: conventional tillage (a,b); minimum tillage (c,d); no-tillage (e,f). Negative values of days after tillage refer to days before tillage. Air temperature and rainfall along the experimental period are shown in all figures. Error bars are standard error of the mean (n = 4).
Agronomy 10 01848 g001
Figure 2. Accumulated CO2-C emission as affected by soil tillage system (conventional, minimum and no-tillage) and cover crop (ncc—no cover crop, oat, oat + vetch and vetch). Light, medium and strong colored bars correspond to the CO2-C accumulated in 15, 30 and 124 days of experiment, respectively. Value inside dark colored bar is the total accumulated CO2-C (124 days), and value outside the bar is the daily average CO2-C emission. Error bars are standard error of the mean (n = 4). Means of daily average or total accumulated CO2-C with the same letter across all treatments are not significantly different by the post-hoc comparison using the Tukey correction method (p ≤ 0.05).
Agronomy 10 01848 g002
Figure 3. Remaining biomass (% of the initial biomass) of oat, oat + vetch and vetch in the litter bags along 123 days as affected by conventional tillage (a) or no-tillage (b). Error bars are standard error of the mean (n = 4). * p < 0.01.
Agronomy 10 01848 g003
Figure 4. Half-life time (t1/2) of oat, oat + vetch and vetch residues as affected by conventional tillage (CT) or no-tillage (NT), and associated CO2-C emission reduction by NT in relation to CT. Error bars are standard error of the mean (n = 4). Means of t1/2 with the same letter across all treatments are not significantly different by the post-hoc comparison using the Tukey correction method (p ≤ 0.05).
Agronomy 10 01848 g004
Figure 5. Temporal evolution of cover crop residue decomposition and CO2-C emission, and net treatment CO2-C emission (red) or sequestration (blue) over 124 days after tillage as affected by: oat (a), oat + vetch (b), and vetch (c) in conventional tillage; and oat (d), oat + vetch (e), and vetch (f) in no-tillage.
Agronomy 10 01848 g005
Figure 6. Carbon input to the soil by cover crops (a), accumulated carbon emission derived from cover crops (b), carbon in the cover crop biomass remaining in the litter bags after 123 days of experiment (c), and apparent carbon balance (ACB) (d) as affected by tillage system: conventional tillage (CT) and no-tillage (NT) and cover crop type: oat, oat + vetch and vetch. Positive (+) and negative (-) ACB values refer to influx and efflux of carbon, respectively, according to Equation (3) (see Section 2.4). Error bars are standard error of the mean (n = 4). Means with the same letter across all treatments are not significantly different by the post-hoc comparison using the Tukey correction method (p ≤ 0.05). (ac) are read in left “Y” axis, and figure (d) is read in right “Y” axis. * (a): significant effect of CC type (p < 0.0001); (bd): significant effect of the interaction between tillage system and CC type, where p < 0.0050, p = 0.0323, and p < 0.0057, respectively.
Agronomy 10 01848 g006
Figure 7. Relationships between: soil carbon (C)1 and nitrogen (N)2 sequestration rate increments (a); soil C sequestration rate and soybean yield increments (b); and soil N sequestration rate and soybean yield increments (c), as affected by soil tillage system (conventional tillage—CT, no-tillage—NT) and crop rotations (R0, R1, R2). Maize yield in CT R2 and NT R2 as affected by soil C and N sequestration rates are shown in Figure 7b,c (right “Y” axis), respectively. Values of soil C (0–90 cm depth) and N (0–100 cm depth) sequestration rates and soybean and maize yield are averages of the period 1985–2007. Increments are calculated in relation to CT R0 (C sequestration rate = 6.00 Mg ha−1 year−1, N sequestration rate = 0.54 Mg ha−1 year−1, soybean yield = 2280 kg ha−1). R0—wheat/soybean; R1—wheat/soybean/black oat/soybean; and R2—black oat/soybean/black oat + common vetch/maize/oilseed radish/wheat/soybean. 1 Adapted from Nicoloso [38], 2 Adapted from Nicoloso et al. [41].
Agronomy 10 01848 g007
Table 1. Cover crops aboveground dry biomass, carbon and nitrogen content and C/N ratio as affected by conventional tillage (CT), minimum tillage (MT) and no-tillage (NT).
Tillage SystemCover CropDry BiomassCarbonNitrogenC/N
-------------------------kg ha−1------------------------
CT 1oat6598 ± 75.62651 ± 30.478 ± 4.534.0
oat + vetch6780 ± 67.42735 ± 33.0116 ± 6.323.6
vetch6401 ± 60.52569 ± 21.6190 ± 6.613.5
MT 1oat6398 ± 52.42571 ± 35.775 ± 5.834.3
oat + vetch6903 ± 72.12784 ± 28.9118 ± 7.723.6
vetch6525 ± 83.62619 ± 42.0194 ± 9.413.5
NT 1oat6442 ± 69.72589 ± 26.976 ± 3.734.1
oat + vetch6858 ± 81.12766 ± 19.4117 ± 7.123.4
vetch6498 ± 87.82608 ± 72.0193 ± 8.613.5
Mean
(CT and NT) 2
oat6521 ± 47.7 ab2620 ± 19,1 b77.0 ± 0.60 c-
oat + vetch6819 ± 73.6 a2751 ± 29.7 a117.0 ± 1.27 b-
vetch6450 ± 11.4 b2589 ± 47.1 b192.0 ± 3.49 a-
1 Values are mean ± standard error of the mean (n = 4). 2 Values are mean ± standard error of the mean of CT and NT (n = 8). Cover crop dry biomass, carbon and nitrogen content were affected by cover crop type factor only (not by tillage system or by the interaction between tillage system and cover crop type). Means of MT system were not included in the statistical analysis. Means of dry biomass, carbon and nitrogen content with the same letter are not significantly different by the post-hoc comparison using the Tukey correction method (p ≤ 0.05).
Publisher’s Note: MDPI stays neutral with regard to jurisdictional claims in published maps and institutional affiliations.

