Article

Changes in Phosphorus Fractions and Its Availability Status in Relation to Long Term P Fertilization in Loess Plateau of China

1
State Key Laboratory of Crop Stress Biology in Arid Areas, Northwest A&F University, Yangling 712100, China
2
Key Laboratory of Plant Nutrition and Agri-Environment in Northwest China, Ministry of Agriculture, College of Natural Resources and Environment, Northwest A&F University, Yangling 712100, China
3
Key Guangdong Provincial Key Laboratory for Radionuclides, Pollution Control and Resources, School of Environmental Science and Engineering, Guangzhou University, Guangzhou 510006, China
*
Author to whom correspondence should be addressed.
Agronomy 2020, 10(11), 1818; https://doi.org/10.3390/agronomy10111818
Submission received: 2 November 2020 / Revised: 5 November 2020 / Accepted: 13 November 2020 / Published: 19 November 2020

Abstract

:
Excessive phosphorus (P) application can alter soil P availability and limit plant growth by compacting soil and fixation of P into different organic and inorganic forms. However, it remains uncertain whether these changes happen after limited fertilization or an excessive rate applied under the winter wheat cropping system. The current study aimed to identify the transformation of P into different organic (Po) and inorganic (Pi) fractions, and their role in the plant P uptake and winter wheat (Triticum aestivum L.) production. A long-term study (12 years) was conducted to assess the changes in soil Pi and Po fractions in response to different P rates (0, 50, 100, 150, and 200 kg P2O5 ha−1) applied to winter wheat. Phosphorus fractions were determined using the Hedley modified Tiessen and Moir fractionation scheme. Our findings demonstrated that different P rates significantly increased the available P, particularly NaHCO3-Pi, in the inorganic P fractions compared to P0 treatment. NaHCO3-Pi showed a strong relationship with grain yield (R2 = 0.91) and P uptake (R2 = 0.80). Grain yield was significantly higher in the P100 treatment, but no significant difference was observed between P100 and P200 treatments. The P200 treatment had a maximum grain P content and plant P uptake. Compared with the P0 treatment, all organic fractions yielded the highest Po with the P rate increase, ranging from 27.3 to 75.6 mg kg−1, 27.2 to 35.6 mg kg−1, and 58.8 to 124 mg kg−1 for NaHCO3-Po, NaOH-Po, and HCl-Po, respectively. Among all Pi fractions, the maximum fraction, known as apatite (HClD-Pi), was found in the P200 treatment with the range of 165 to 245.9 mg kg−1. HClD-Pi accounted for 32% of total P, which can be transformed into the available P form with the passage of time. An increase of 78% in residual P was found under the treatment of P200. The residual P fraction was positively correlated with grain yield, P uptake, and other inorganic fractions. It can be concluded that application of P increases P availability and grain yield with an increase in its application rate, but too much use of P can cause soil pollution and higher fixation of P. Consequently, a balanced application of fertilizer is recommended to reduce its fixation and increase its availability for higher crop yield.

1. Introduction

Phosphorus (P) is one of the most important nutrients that limits the production of crops in the agricultural system [1]. Global P fertilizer use in agriculture has increased rapidly during the past five decades to feed large populations. Global inorganic P fertilizer use increased from 11.0 Tg (1012 g) P2O5 year−1 to 47 Tg P2O5 year−1 during 1961–2017 [1]. Applications of P fertilizers increase the available levels of P and crop production [2]. The application of P to soil yields only 10–20% output as compared with its input to soil for crop utilization [3,4]. Furthermore, a 50% increase in representative P nutrient used in agriculture from 2010 levels is projected in 2050 to meet rising food demand due to global population growth [5]. This increase in the use of P fertilizer may also lead to losses of P to the environment. Augmenting P losses in surface waters adversely impacts ecosystems and biodiversity [6]. Most soils in North-West China are generally deficient in P. Thus, P fertilization is a common practice to ensure sufficient P supply, leading to extreme soil environmental problems, e.g., P leaching, soil hardening and acidification, and reduction of soil fertility [7].
In an agricultural ecosystem, increasing the local application of P fertilizer can help to increase the available P for crops temporarily, whereas higher application rates change the bioavailability in the soil medium [8].
As an element, phosphorus is highly reactive. Large quantities applied to soils influence deposition and affect P cycling [9]. The response to different soil conditions and P fertilization input is a common study topic. Research has investigated whether P applied to the soil influences P limitations at a large scale. However, significant uncertainty remains regarding the P found in different forms adsorbed on the soil surface with different elements (i.e., iron (Fe), aluminum (Al), and calcium (Ca)), which differ in their bioavailability, mobility, and behavior in the soil, depending on the pH, parent material, and fertilization background [10,11]. Consequently, it is important to assess the effects of P application on P limitation with different fertilizer rates and different mechanisms. It is also essential to study the effects of different rates of P inputs on P fractions and their relationship with crop yield and availability.
P availability in soil is highly dependent on P fractions, which affect its primary production [12]. High rates of P fertilization result in the rapid formation of non-labile P forms [13]. The application of P fertilizer exceeds the P output of crops; thus, P accumulates in the soil over time. Widely used P fractionation schemes allow evaluation of the fate of P applied to soils and its relationship with plants’ P nutrition, forms of P, and uptake [14,15,16]. To strategically maximize the long-term use of P, the various P forms and their characteristics must be measured after a long-term fertilization background.
Soil inorganic P (Pi) refers to different fractions, such as labile (NaHCO3-Pi), moderately labile (NaOH-Pi, NaOH-Pi, HClD-Pi), and non-labile (HClC-Pi) P; Fe- and Al–P (non-occluded Fe- and Al-bound P); and residual Pi (P occluded within Fe oxides) [17]. Sequential Pi fractionation and more stable forms, such as those absorbed on the surface of Fe, Al, and Ca (Ca–P, Al–P, Fe–P, and Residual–P) of Pi, have been established [10]. HCl-Pi fractions are generally not fractionated further because, in non-calcareous soils, these sub-fractions are relatively small, whereas in loess soil they make a greater contribution [18].
P application to soil may influence soil P forms by different biogeochemical processes. For example, P input can change the microbial activities of soil, which leads to mineralization of organic P fractions into inorganic Pi [19]. Combining P with N application can alter the soil pH by nitrification, decreasing the soil pH and organic P formation, which accelerates the primary crop production and P demand of plants [20]. Application of N, which mobilizes Al and Fe in the soil and leads to P sorption on the surface of the soil, can transform labile Pi and Po into moderately available P or recalcitrant P [21].
Low plant uptake efficiency is a significant problem due to the high rate of P application. When P fertilizer input increases relative to the P output of the crop, P fixation in the soil increases with time due to the lower mobility of P nutrient [16]. Moreover, the application of P in combination with N can also induce fixation, creating acidic conditions in the soil [22]. Thus, to address long-term P fertilization, it is vital to reveal the forms and behavior of P in the soil after continuous fertilization in a winter wheat cropping system.
To investigate the P forms in the soil, the fractionation scheme of Hedley modified by Tiessen and Moir has been widely used [23]. This scheme differentiates different P forms, either organic and inorganic fractions fixed by the effects of different soil properties, such as pH, soil moisture, and fertilization [24]. However, few studies have revealed the specific causes of P fertilization effects on crop production and P fixation in loess soils due to long-term fertilizer application. Therefore, this study aims to (I) clarify the variations in soil P fractions affected by long-term P application, and (II) illuminate the influence of P fractions on the crop yield and P uptake in loess soils of North-West China. This study will improve the understanding of the processes of soil P cycling driven by changes in various organic and inorganic P fractions resulting from long-term fertilization.

2. Materials and Methods

2.1. Study Site

The long-term field experiment began in October 2004 at a site situated at Northwest A&F University’s research field area (34°18′ N, 108°05′ E) in Yangling, Shaanxi, China, in a typical semi-humid climate. The weather and climate of the research station is considered humid with a high probability of drought, a mean annual temperature of 12.9 °C, and average rainfall of 581 mm (about 60 to 70% of rainfall occurs during July to September, and has an evaporation potential of 1400 mm). The site is rain fed, with annual average precipitation received during the wheat growing season of about 541 mm, of which the wheat crop received 58% during June–Sept. 2015 to 2017. The mean temperature measured throughout the study duration was 15 °C (Figure 1). The study site’s soil was calcareous Udic Haplustalf (USDA system). The basic properties of the study from 2004 to 2015 for a soil depth of 0–20 cm were pH 8.24, bulk density 1.24 g cm−3, available P 15.0 mg kg−1, total N 1.07 g kg−1, and organic matter 13.8 g kg−1.

2.2. Experimental Design and Treatments

The field study with randomized complete design had five P2O5 application rate treatments with four replicates. The area of each treatment plot was 40 m2, with a distance of 1 m between the treatment plots and 2 m between the blocks. P rates applied to blocks in the study area were 0, 50, 100, 150, and 200 kg P2O5 ha−1, combined with 160 kg N ha−1. The N fertilizer was applied in the form of urea (N 46%) and the P fertilizer was triple superphosphate (P2O5 46%). The same rates have been continuously applied to the same blocks from 2004 to the present. The major local winter wheat cultivar, Xiaoyan, was used as the experimental test crop. Fertilizers were applied manually on the soil top layer in each treatment plot at the time of sowing and then plowed using a rotavator. Furthermore, the other crop management methods used were compatible with those used by local farmers. To avoid weeds and pests, herbicides and insecticides were employed.

2.3. Sample Collection and Analysis

2.3.1. Sampling and Analysis of Plants

Winter wheat plant sampling for the years 2016 and 2017 was carried out by taking 100 plants per plot for the analysis. The plants were gently taken from each plot by hand, and the roots were instantly cut off at the joining point of the root and stem. The aboveground parts of the plant from each plot were incorporated into composite plant samples, and the stems were then taken from the samples, including grains and glumes, for the determination of crop P uptake. After air drying, the plant samples were oven dried for 30 min at 90 °C, and then for 48 h at 65 °C, to determine water content and dry weight. The samples were crushed using stainless steel grinder and stored individually in plastic bags.
Winter wheat was harvested by combine harvester, and the fresh weight of grain in every treatment plot was measured. To estimate the dry weight of the grain yield, a grain sample of approximately 500 g was collected from each plot. Four areas (4 × 1 m2) were picked at random from each parcel to assess crop biomass.

2.3.2. Soil P Fractions Analysis

Phosphorus fractions were determined using the Hedley modified Tiessen and Moir fractionation scheme. A soil sample of 1.0 g (1 mm sieved) was taken for the fractionation analysis and extracted with 30 mL of 0.5 M NaHCO3, adjusting its pH to 8.5 and shaking the sample for 16 h continuously (NaHCO3-Pi, Pt, and P). The remaining soil from the previous extract was washed with distilled water and again shaken with 0.1 M NaOH for 16 h (NaOH-Pi, Pt), and then shaken with 1 M HCl for 16 h continuously (HClD-Pi). After obtaining the above extracts, the remaining soil was heated at 80 °C for 10 min with 10 mL of concentrated HCl in a water bath and, then 5 mL HCl of 12 M, and distilled water was added to bring the volume of the solution to 50 mL (HClC-Pi). Finally, the residual soil samples were mineralized by the addition of concentrated H2SO4, and the samples were heated at 350 °C for 4 h (residual P). Between these sequential steps, the tubes were centrifuged for 10 min at 4000 rpm with 0.45 μm cellulose nitrate channels using a membrane filtrating apparatus. Organic and inorganic fractions of P were determined using the 0.5 M NaHCO3, 0.1 M NaOH, and 12 M HCl extracts individually. Organic P fractions were measured by the difference of total P and the inorganic P that was assessed after digestion with ammonium per sulfate. All P fractions were determined using a UV spectrophotometer.

2.4. Data Analysis

Significant differences were measured at p = 0.05 using the least significant differences (LSD) test, and one-way analysis of variance (ANOVA) was conducted using SPSS 20.0. Regression analysis was used to calculate the changes in the biomass, grain yield, and different P fractions due to various P application rates. Correlation analysis was conducted to determine the relationships between different P fractions, grain yield, and total plant P uptake.

3. Results

3.1. Grain Yield and Total Biomass

The grain yield showed a significant increasing trend with the increase in P fertilization rate (Figure 2A). The grain yield in the P0 treatment fertilizer was less than that of other treatments where different P rates were applied. Grain yield was significantly higher in the P200 treatment and was 5850 kg ha−1 (R2 = 0.93). Similarly, the biomass compared with the P0 treatment was higher in the P200 treatment (R2 = 0.91), which was 12,866 kg ha−1, but no significant differences were observed between P100 and P200 treatments (Figure 2B).
Compared with the P0 treatment, the grain yield increased by 97.4% in the P200 treatment. Similarly, total biomass increased 81.0% and 79.5% in P100 and P200 treatments, respectively, compared with the P0 treatment (Table 1).

3.2. Grain P and Total P Uptake

The mean values of total plant P uptake and grain P uptake for two wheat growing seasons were higher with the increase in P fertilizer addition (Figure 2A,B). The grain P uptake ranged from 5.7 to 17.0 kg ha−1, and the total plant P uptake ranged from 6.4 to 19.6 kg ha−1. In all P treatments, increasing the P fertilizer rate raised the P content in plants. Among all of the P treatments, the P200 treatment had a maximum grain P content and plant P uptake, and showed a significant increase compared to the P0 treatment (R2 = 0.98, 0.98) (Figure 2A,B). Compared with the P0 treatment, P uptake was increased by 208.3% in the P200 treatment (Table 1).

3.3. Total P (P), Organic P (Po) and Inorganic P (Pi) Concentrations in the Soil

The soil concentrations of P, Pi, and Po showed a significant increasing effect in response to P addition compared to the P0 treatment, ranging from 424 to 755 mg kg−1, 311 to 529 mg kg−1, and 113 to 226 mg kg−1, respectively. Total Pi, Po, and P fractions showed a significant increase with treatment with a higher P application rate (200 kg P2O5 ha−1) (Figure 3A).
Compared with P0 treatment fertilizer, P, Pi, and Po, increased by 78%, 100%, and 70% under the P200 treatment (Table 1). The regression analysis showed that increasing the P fertilization rate significantly increased total Pi (R2 = 0.93), Po (R2 = 0.93), and total P (R2 = 0.98) (Figure 3B).

3.4. Organic P (Po) Fractions

The variation in Po fractions in response to different P rates is shown in Figure 4A. The changing trend of Po followed the order of HClC-Po > NaHCO3-Po > NaOH-Po. Compared with the P0 treatment, all organic fractions had the highest Po with the increase in the P rate, ranging from 27.3 to 75.6 mg kg−1, 27.2 to 35.6 mg kg−1, and 58.8 to 124 mg kg−1 for NaHCO3-Po, NaOH-Po, and HClC-Po, respectively. The regression showed a significant increase in all organic fractions NaHCO3-Po, NaOH-Po, and HClC-Po (R2 = 0.88, 0.067, and 0.79, respectively) (Figure 5B).
Compared with the P0 treatment, the NaHCO3-Po and HCl-Po fractions of P fertilization application increased by 177% and 111% in the P200 treatment, whereas NaOH-Po increased by 1 time compared to the P0 treatment (Table 1).

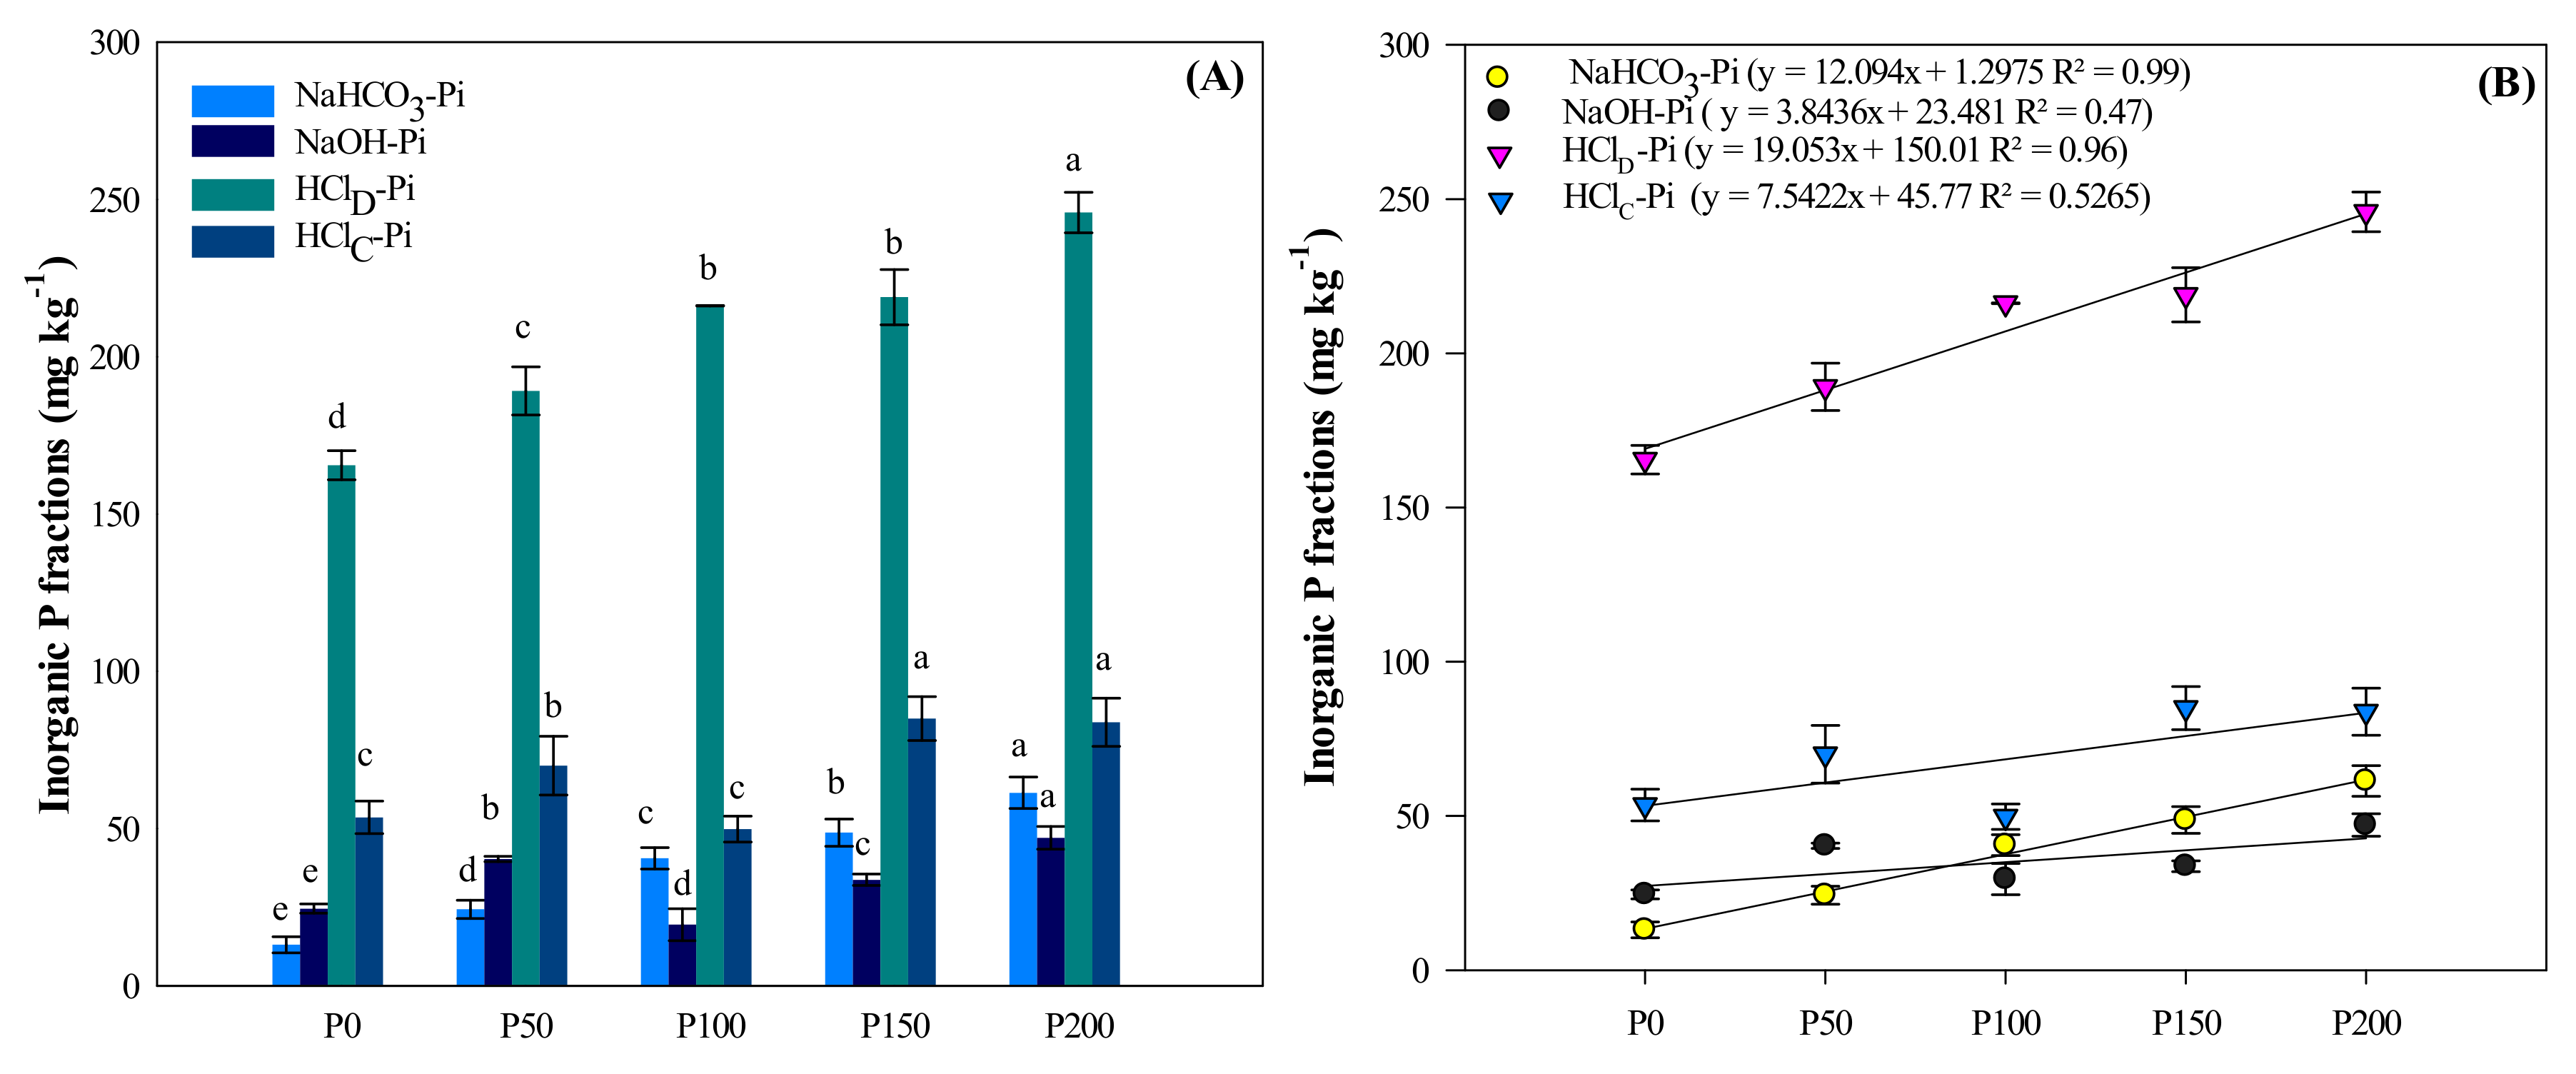
3.5. Inorganic P (Pi) Fractions

The long-term P fertilizer application practices had a significant effect on the proportions of the different P fractions (Figure 6A). P fertilization significantly enhanced the proportion of different Pi fractions, including the available NaHCO3-Pi, which varied from 13.1 to 61.3 mg kg−1 compared to the P0 treatment, with the highest value observed in the P200 treatment. In contrast with the P0 treatment, the available P (NaHCO3-Pi) increased by 4 times in the P150 and P200 treatments. Similarly, compared to P0, the P200 treatment showed a significant rise in the Pi fractions (NaHCO3-Pi NaOH-Pi, HClD-Pi, and HClC-Pi). The average values for the 2-year inorganic fractions showed an increase in NaHCO3-Pi (61.3 mg kg−1); most of the inorganic fractions were maximized in the P200 treatment, such as NaOH-Pi (47.0 mg kg−1) and HClC-Pi (83.8 mg kg−1). Among all inorganic fractions, the maximum HClD-Pi, which is known as apatite, was found to be the highest in concentration (165 to 245.9 mg kg−1) under the P200 treatment. Compared to the P0 treatment, HClD-Pi increased by 48.5% in the P200 treatment (Figure 6A). The pattern of increase in the above inorganic fractions in response to the different P rate treatments showed an increasing trend compared to the P0 treatment in the order of HClD-Pi > HClC-Pi > NaOH-Pi > NaHCO3-Pi (R2 = 0.96, 0.52, 0.47, and 0.99, respectively) (Figure 6B).

3.6. Residual P Fractions

Residual P is termed as the recalcitrant P fraction, which is highly bonded with the soil particles. Residual P in this study showed an increasing trend that ranged from 54.4 to 91.1 mg kg−1 in P0 and P200 treatments, respectively (R2 = 0.73) (Figure 7A,B). Comparing the changes in residual P in different P rate fertilizer treatments with respect to P0, an increase of 78% was found in the P200 treatment (Table 1).

3.7. Relations of Different Fractions to Yield and P Uptake

A Pearson correlation coefficient was computed to assess the relationship between different P fractions, grain yield, and the total P uptake (Table 2). The available Pi fraction (NaHCO3-Pi and NaHCO3-Po) was significant positively correlated (R2 = 0.92, 0.91, and 0.72) respectively with the P uptake and grain yield. Moderate available Pi fractions, NaOH-Pi and HClD-Pi, showed significant (R2 = 0.63, 0.95) positive correlations with the grain yield and total P uptake. Recalcitrant Pi fractions HClC-Pi and residual Pi were significantly and positively correlated with grain yield and total P uptake.

4. Discussion

4.1. Effect of Different P Rates on P Fractions

Continuous P fertilization significantly increases P accumulation in soils [25,26]. Long-term P fertilization causes a prominent increase in different Pi forms, including labile Pi (NaHCO3-Pi, which is a bioavailable inorganic fraction [27]), moderately labile Pi (NaOH-Pi and HClD-Pi), and recalcitrant Pi (HClC-Pi and residual Pi). The results of the present study revealed that long-term P fertilizer application affects the soil P directly in loess soils. Compared with the P0 treatment, other P application treatments significantly increased the accumulation of total P in the soil (Figure 4). The labile Pi (NaHCO3-Pi) fraction accounted for 3.1% and 6.4% of the total P, and in the P0 and P200 treatments, respectively (Table 1). Moderate labile Pi fractions (NaOH-Pi and HClD-Pi) were the highest contributors to total Pi and P. This was possibly due to different Pi rates, which can have different effects on P forms, and their accumulation and movement in the 0–20 cm layer of soils [28,29]. The shift in the content of the recalcitrant P fraction HClD-Pi indicated that such fractions may be involved in long-term P cycling (Table 1). The HClD-Pi fraction, consisting mainly of stable and insoluble forms of P, including Al, Fe, and Ca-bound P [30,31], indicates the non-labile forms of P fractions in the soil. Our findings demonstrated that the HClC-Pi concentrations showed an opposite trend compared with the available P fractions (Figure 5A). The average NaHCO3-Pi and NaHCO3-Po concentrations were maximized in the highest P fertilizer application treatments. This might be due to (I) continuous fertilization in the soil, which can influence P binding in soil by increasing the available Pi at Al and Fe to stop the added P from adsorption, and (II) changing the charges and pH on the mineral soil surface, which reduces the absorbance and ultimately increasing the soil P [27]. Similar results were reported by [32], who revealed that P fertilization affects the residual and organic P fractions but generally increased soluble Pi. This demonstrated that the available P supply was better able to be verified by the application of Pi fertilizer [33]. Zhao [34] reported that P adherence with Ca-phosphate reduces the available P for crops.
Sources of P that contain higher concentrations of P can induce significant responses for maximizing the Po content in soils, and this Po retention could be caused by the adsorption of P in organic materials, which are generally converted into available Pi [35]. NaHCO3-Po is considered to be an easily mineralizable organic P, and NaOH-Po is a source of P [30,35]. NaHCO3-Po accounted for 75.6 and 26.9 mg kg-1 in response to the highest rate of P (200 kg P2O5 ha−1). Among all Po fractions, that of the moderately labile HClC-Po was the highest, and its deposition in the soil contributed significantly to total Po. Similarly to the moderately labile P fraction, the HClC-Po extractable P fraction also increased in the high P treatment (Figure 6). Previous studies have also shown that NaHCO3-Po and HClC-Po increase significantly with the application of various forms of organic fertilizers, with limited increases in the NaOH-Po fractions. This increase was due to the Pi fertilizer addition; an annual long-term application, from a normal to a high rate, enhanced the formation of NaOH-Po, and an increase in the fertilizer addition linearly increased NaHCO3-Po and HClC-Po fractions [36,37,38]. Similar results were reported by previous studies [13,35], which confirmed that continuous P fertilization increased the P fixation and resulted in an increase in non-available P pools. This may also by due to high P rate application leading to the formation of organic acids, which results in the formation of P Fe and Al complexes by decreasing the P availability in the soil. Our results are also consistent with previous studies [39,40] that reported that the soil content of labile Pi and Po decreased under long-term crop cultivation without application of fertilizers, whereas the application of inorganic fertilizer significantly elevated the soil content of labile Pi and Po.
Residual P, which is mainly composed of insoluble and stable forms of P, and Fe- and Al-bounded P [30,31], is considered a recalcitrant form of P that is highly fixed and not available for plants. Our findings showed that residual P results in a slightly increasing trend with the addition of P, which increased by 12% (Figure 7) compared with the P0 treatment. These results are consistent with the findings of Dobermann [32], who reported that the application of P fertilizers had low effects on residual P fractions, but increased soluble Pi. The variance in residual P fraction concentrations observed in our study indicates that the residual fraction may involve long-term P cycling (Figure 7), which could be the result of numerous processes occurring in the soil system. Applied P fertilizers adsorbed on to the primary mineral’s surface can play a vital role in increasing residual P [27]. The residual P concentration was higher in the high P rate compared to the P0 treatment, possibly because of excessive fertilization effects that caused P saturation in the form of residuals that may be converted to the moderately labile (NaOH, HCD-P fractions) or labile P (NaHCO3-P fractions) with the passage of time.

4.2. Relationship of Available P with Different P Fractions

In comparison to the initial concentrations of total and available Pi fraction, the application of Pi fertilizers showed significant differences in the total and available Pi fraction concentrations. Our findings indicated the positive relationship between available P and different inorganic and organic P fractions (Table 2). This could be due to a long-standing addition of P to land and previous plowing residues before winter wheat, which increased the total and available soil content of P. Previous studies have examined the possibility of increasing the available P, total P, and P fixation after long-term P fertilization [41]. In our study, the total and available Pi (NaHCO3-Pi) content was maximized in the P200 treatment compared to the P0 treatment, and showed a high positive correlation with HClD-Pi (Table 1). Zhang [42] found that the soil content of available Pi that ranged between 5 and 10 mg kg−1 would be enough for plants, whereas a concentration <5 mg kg−1 would cause P-deficiency. In another study, Bravo [43] reported that the available concentration of P should be above the critical 6 or 7 mg kg−1 level for optimal cultivation growth. In our findings, P application treatments showed a significant increase in total P and available P content compared to the treatment of P0, thus demonstrating interactive effects on the soil concentrations of available Pi under the application of Pi fertilizers. The long-term effects of the P application could be associated with the continuous addition of different rates of inorganic P in a balanced quantity, which induced the available Pi and avoided high fixation of different P forms [44,45].
Some studies have reported that P fractions in the soil are generally influenced by the soils’ biogeochemical properties, various microbial activity management practices, and fertilization [46,47]. In our study, the concentration of P fractions was significantly greater in the highest Pi treatment, however, considering the balance was a positive approach of fertilizer application. Regarding the increase in HClD-Pi fractions, P fertilizer application resulted in a high fixation of HCl-P fractions and decreased the other fractions. These results are in line with those of previous studies [48].
Different findings indicated that excessive application of P leads to P fixation in soil, which results in further soil environment problems. Therefore, suitable management of rates of P fertilizer application is necessary under long-term fertilization for better crop production and to reduce the different environmental impacts on soil [49,50]. Compared with the P0 treatment, the long-term addition of P fertilizers significantly increased the yield of grains (Figure 3). This could be because of the long-term addition, which yields positive effects to improve the P availability in the soil by changing the substrate that plants need during the grain filling period [51].

4.3. Grain Yield, P Uptake and P Fractions

P status in the soil in terms of available and fixed forms can significantly affect grain quality, yield, and crop production. In the findings of the current study, grain yield increased with an increase in the rate of P fertilizer application (Figure 3).
Long-term application of P significantly increased grain yield and P uptake compared with P0 and P200 treatments (Table 1). This increase could be due to the availability of the soil NaHCO3-Pi and NaHCO3-Po resulting from long-term P application. These results are in line with the study findings of Dobermann [32], who found that the application of P fertilizer increases Pi soluble fractions. Higher P application with long-term fertilization can also contribute to high crop production, which eventually helps to achieve higher P absorption and yields [52,53]. These findings indicate that long-term P application leads to the highest P uptake. Decreased availability of P can reduce grain yield. Xin et al [54] reported that P applications have an immense impact on P uptake and grain yield.
In previous research, the average yield was 4.9 Mg (106) ha−1 for wheat in Henan province, where the experiment was conducted between 1995 and 2018 [55]. A similar but higher yield of 5.85 Mg ha−1 (Figure 2) was obtained using the current optimum rate of application (200 kg P2O5 ha−1). The results show that this rate of application is acceptable for high crop production in North-West China. From our results, and in contrast to the results of many other studies, P applied in a balanced amount no greater than 100 kg ha−1 could improve the grain yield of wheat. Diacono and Montemurro (2010) [56] summarized the results of over 20 years of long-term experiments, and P application was found to increase crop yield. Other studies also reported that the long-term use of inorganic fertilizer can improve crop yields in a wheat–corn system [57,58,59]. The primary reason for this difference is that fixation is a natural problem of P, and a planned application of a given amount can reduce this problem and increase yield [60,61].
P fertilizer application affected the P uptake content, which increased by 3 to 4 times compared to the P0 treatment. Different P fertilizer application rates enhanced the P uptake in winter wheat because they increased the labile Pi and Po fractions (NaHCO3-Pi and NaHCO3-Po), NaOH-P, and HClD-Pi (Table 1). Similar results were reported by Yonathan et al [47], who showed that P fertilizer increased P uptake while enhancing the plant biomass. Our results showed the same pattern of increase in P uptake, which is consistent with an increase in P and has a positive correlation with different fractions (Table 2).
The study results enhanced the understanding of winter wheat behavior and the transformation of P under long-term P fertilization. A balanced rate of P application enhanced the uptake and yield, and P100 and P200 had similar effects on the P uptake and grain yield. Long-term P fertilization of a balanced amount of fertilizer, with an application of around 100 kg ha−1, was found to be the best strategy to optimize the availability of soil P for plants.

5. Conclusions

In this study, we compared the responses of soil P fractions and wheat grain yields to different rates of P fertilizer added to a winter wheat crop in a long-term field experiment. The available P increased significantly due to the application of different rates of P compared with the control treatment. HCl diluted P fractions significantly increased, and were the largest P contributors to total P. The increased HCl-Pi fractions may have been transformed from labile P due to the induced acidification of weather and precipitation in the soil. This finding has useful implications for winter wheat fertilizer application management to reduce fixation. A well-balanced fertilizer application of 100 kg ha−1 is recommended to attain maximum grain yield and P uptake in these cropping systems, thus aiding local farmers by reducing the environmental effects of fertilizers.

Author Contributions

Conceptualization, M.M.; methodology, M.M. and Z.W.; validation, M.M. and Z.W.; formal analysis, M.M.; investigation, Y.T. and Q.M.; resources, Z.W. and X.H.; data curation, M.M., W.A. and S.M.; writing—original draft preparation, M.M. and Z.W. All authors have read and agreed to the published version of the manuscript.

Funding

This research was economically supported by the China Agricultural Research System (CARS-3), the National Key Research and Development Program of China (2018YFD0200401), the National Natural Science Foundation of China (41501308), and the Agricultural Scientific Research Talent and Team Program.

Conflicts of Interest

The authors declare no conflict of interest.

References

  1. Elrys, A.S.; Desoky, E.M.; Ali, A.; Zhang, J.; Cai, Z.; Cheng, Y. Sub-Saharan Africa’s food nitrogen and phosphorus footprints: A scenario analysis for 2050. Sci. Total Environ. 2020, 752, 141964. [Google Scholar]
  2. Jiang, M.; Shen, M.X.; Shen, X.P.; Dai, Q.G. Effect of long-term fertilization pattern on weed community diversity in wheat field. Sci. Rep. 2018, 8, 1–7. [Google Scholar]
  3. Syers, J.K.; Johnston, A.E.; Curtin, D. Efficiency of soil and fertilizer phosphorus use: Reconciling changing concepts of soil phosphorus behaviour with agronomic information. FAO Fertil. Plant Nutr. Bull. 2008, 18, 108. [Google Scholar]
  4. Sattari, S.Z.; Bouwman, A.F.; Giller, K.E.; van Ittersum, M.K. Residual soil phosphorus as the missing piece in the global phosphorus crisis puzzle. Proc. Natl. Acad. Sci. USA 2012, 16, 6348–6353. [Google Scholar] [CrossRef] [Green Version]
  5. Springmann, M.; Clark, M.; Mason-D’Croz, D.; Wiebe, K.; Bodirsky, B.L.; Lassaletta, L.; de Vries, W.; Vermeulen, S.J.; Herrero, M.; Carlson, K.M.; et al. Options for keeping the food system within environmental limits. Nature 2018, 562, 519–525. [Google Scholar] [CrossRef]
  6. Oita, A.; Wirasenjaya, F.; Liu, J.; Webeck, E.; Matsubae, K. Trends in the food nitrogen and phosphorus footprints for Asia’s giants: China, India, and Japan. Resour. Conserv. Recycl. 2020, 157, 104752. [Google Scholar] [CrossRef]
  7. Yan, X.; Wei, Z.; Hong, Q.; Lu, Z.; Wu, J. Phosphorus fractions and sorption characteristics in a subtropical paddy soil as influenced by fertilizer sources. Geoderma 2017, 295, 80–85. [Google Scholar] [CrossRef]
  8. Vincent, A.G.; Turner, B.L.; Tanner, E.V.J. Soil organic phosphorus dynamics following perturbation of litter cycling in a tropical moist forest. Eur. J. Soil Sci. 2010, 61, 48–57. [Google Scholar] [CrossRef]
  9. Elser, J.J. Phosphorus: A limiting nutrient for humanity? Curr. Opin. Biotechnol. 2012, 23, 833–838. [Google Scholar] [CrossRef]
  10. Hedley, M.J.; Stewart, J.W.B.; Chauhan, B.S. Changes in Inorganic and Organic Soil Phosphorus Fractions Induced by Cultivation Practices and by Laboratory Incubations. Soil Sci. Soc. Am. J. 1982, 46, 970–976. [Google Scholar] [CrossRef]
  11. Mehmood, A.; Akhtar, M.; Khan, K.; Khalid, A.; Imran, M.; Rukh, S. Relationship of Phosphorus Uptake with Its Fractions in Different Soil Parent Materials. Int. J. Plant Soil Sci. 2015, 4, 45–53. [Google Scholar] [CrossRef] [PubMed]
  12. Williams, A.; Börjesson, G.; Hedlund, K. The effects of 55 years of different inorganic fertiliser regimes on soil properties and microbial community composition. Soil Biol. Biochem. 2013, 67, 41–46. [Google Scholar] [CrossRef]
  13. Malik, M.A.; Marschner, P.; Khan, K.S. Addition of organic and inorganic P sources to soil-Effects on P pools and microorganisms. Soil Biol. Biochem. 2012, 49, 106–113. [Google Scholar] [CrossRef]
  14. Aulakh, M.S.; Malhi, S.S. Interactions of Nitrogen with Other Nutrients and Water: Effect on Crop Yield and Quality, Nutrient Use Efficiency, Carbon Sequestration, and Environmental Pollution. Adv. Agron. 2005, 86, 341–409. [Google Scholar]
  15. Cox, A.E.; Camberato, J.J.; Smith, B.R. Phosphate Availability and Inorganic Transformation in an Alum Sludge-Affected Soil. J. Environ. Qual. 1997, 26, 1393–1398. [Google Scholar] [CrossRef]
  16. Kuo, S.; Huang, B.; Bembenek, R. Effects of long-term phosphorus fertilization and winter cover cropping on soil phosphorus transformations in less weathered soil. Biol. Fertil. Soils 2005, 41, 116–123. [Google Scholar] [CrossRef]
  17. Solis, P.; Torrent, J. Phosphate Fractions in Calcareous Vertisols and Inceptisols of Spain. Soil Sci. Soc. Am. J. 1989, 53, 462–466. [Google Scholar] [CrossRef]
  18. Buehler, S.; Oberson, A.; Rao, I.M.; Friesen, D.K.; Frossard, E. Sequential Phosphorus Extraction of a P-Labeled Oxisol under Contrasting Agricultural Systems. Soil Sci. Soc. Am. J. 2014, 66, 868. [Google Scholar] [CrossRef]
  19. Kritzler, U.H.; Johnson, D. Mineralisation of carbon and plant uptake of phosphorus from microbially-derived organic matter in response to 19 years simulated nitrogen deposition. Plant Soil 2010, 326, 311–319. [Google Scholar] [CrossRef]
  20. Vitousek, P.M.; Porder, S.; Houlton, B.Z.; Chadwick, O.A. Terrestrial phosphorus limitation: Mechanisms, implications, and nitrogen-phosphorus interactions. Ecol. Appl. 2010, 20, 5–15. [Google Scholar] [CrossRef] [Green Version]
  21. Carreira, J.A.; García-Ruiz, R.; Liétor, J.; Harrison, A.F. Changes in soil phosphatase activity and P transformation rates induced by application of N- and S-containing acid-mist to a forest canopy. Soil Biol. Biochem. 2000, 32, 1357–1865. [Google Scholar] [CrossRef]
  22. Khan, K.S.; Joergensen, R.G. Changes in microbial biomass and P fractions in biogenic household waste compost amended with inorganic P fertilizers. Bioresour. Technol. 2009, 100, 303–309. [Google Scholar] [CrossRef] [PubMed]
  23. Moir, J.; Tiessen, H. Characterization of Available P by Sequential Extraction. In Soil Sampling and Methods of Analysis, 2nd ed.; CRC Press: Boca Raton, FL, USA, 2007. [Google Scholar]
  24. Khan, K.S.; Joergensen, R.G. Relationships between P fractions and the microbial biomass in soils under different land use management. Geoderma 2012, 173–174, 274–281. [Google Scholar] [CrossRef]
  25. Ahmed, W.; Jing, H.; Kaillou, L.; Qaswar, M.; Khan, M.N.; Jin, C.; Geng, S.; Qinghai, H.; Yiren, L.; Guangrong, L.; et al. Changes in phosphorus fractions associated with soil chemical properties under long-term organic and inorganic fertilization in paddy soils of southern China. PLoS ONE 2019, 14. [Google Scholar] [CrossRef]
  26. Ahmed, W.; Qaswar, M.; Jing, H.; Wenjun, D.; Geng, S.; Kailou, L.; Ying, M.; Ao, T.; Mei, S.; Chao, L.; et al. Tillage practices improve rice yield and soil phosphorus fractions in two typical paddy soils. J. Soils Sediments 2020, 20, 850–861. [Google Scholar] [CrossRef]
  27. Meason, D.F.; Idol, T.W.; Friday, J.B.; Scowcroft, P.G. Effects of fertilisation on phosphorus pools in the volcanic soil of a managed tropical forest. For. Ecol. Manag. 2009, 258, 2199–2206. [Google Scholar] [CrossRef]
  28. Pizzeghello, D.; Berti, A.; Nardi, S.; Morari, F. Phosphorus forms and P-sorption properties in three alkaline soils after long-term mineral and manure applications in north-eastern Italy. Agric. Ecosyst. Environ. 2011, 141, 58–66. [Google Scholar] [CrossRef]
  29. Pizzeghello, D.; Berti, A.; Nardi, S.; Morari, F. Relationship between soil test phosphorus and phosphorus release to solution in three soils after long-term mineral and manure application. Agric. Ecosyst. Environ. 2016, 233, 214–223. [Google Scholar] [CrossRef]
  30. Aulakh, M.S.; Kabba, B.S.; Baddesha, H.S.; Bahl, G.S.; Gill, M.P.S. Crop yields and phosphorus fertilizer transformations after 25 years of applications to a subtropical soil under groundnut-based cropping systems. Field Crop. Res. 2003, 83, 283–296. [Google Scholar] [CrossRef]
  31. Zicker, T.; von Tucher, S.; Kavka, M.; Eichler-Löbermann, B. Soil test phosphorus as affected by phosphorus budgets in two long-term field experiments in Germany. Field Crop. Res. 2018, 218, 158–170. [Google Scholar] [CrossRef]
  32. Dobermann, A.; George, T.; Thevs, N. Phosphorus Fertilizer Effects on Soil Phosphorus Pools in Acid Upland Soils. Soil Sci. Soc. Am. J. 2002, 66, 652–660. [Google Scholar] [CrossRef]
  33. Delgado, A.; Madrid, A.; Kassem, S.; Andreu, L.; del Campillo, M.D.C. Phosphorus fertilizer recovery from calcareous soils amended with humic and fulvic acids. Plant Soil 2002, 245, 277–286. [Google Scholar] [CrossRef]
  34. Zhao, Y.; Wang, P.; Li, J.; Chen, Y.; Ying, X.; Liu, S. The effects of two organic manures on soil properties and crop yields on a temperate calcareous soil under a wheat-maize cropping system. Eur. J. Agron. 2009, 31, 36–42. [Google Scholar] [CrossRef]
  35. Zhang, T.Q.; Zheng, Z.M.; Drury, C.F.; Hu, Q.C.; Tan, C.S. Legacy Phosphorus After 45 Years With Consistent Cropping Systems and Fertilization Compared to Native Soils. Front. Earth Sci. 2020, 8, 183. [Google Scholar] [CrossRef]
  36. Bowman, R.A.; Cole, C.V. Transformations of organic phosphorus substrates in soils as evaluated by NaHCO3 extraction. Soil Sci. 1978, 125, 49–54. [Google Scholar] [CrossRef]
  37. Damodar Reddy, D.; Subba Rao, A.; Rupa, T.R. Effects of continuous use of cattle manure and fertilizer phosphorus on crop yields and soil organic phosphorus in a Vertisol. Bioresour. Technol. 2000, 75, 113–118. [Google Scholar] [CrossRef]
  38. Gupta, R.K.; Yadvinder-Singh; Ladha, J.K.; Bijay-Singh; Singh, J.; Singh, G.; Pathak, H. Yield and Phosphorus Transformations in a Rice-Wheat System with Crop Residue and Phosphorus Management. Soil Sci. Soc. Am. J. 2007, 71, 1500–1507. [Google Scholar] [CrossRef]
  39. Siddique, M.T.; Robinson, J.S. Phosphorus Sorption and Availability in Soils Amended with Animal Manures and Sewage Sludge. J. Environ. Qual. 2003, 32, 1114–1121. [Google Scholar] [CrossRef]
  40. Scherer, H.W.; Sharma, S.P. Phosphorus fractions and phosphorus delivery potential of a luvisol derived from loess amended with organic materials. Biol. Fertil. Soils 2002, 35, 414–419. [Google Scholar]
  41. Mao, X.; Xu, X.; Lu, K.; Gielen, G.; Luo, J.; He, L.; Donnison, A.; Xu, Z.; Xu, J.; Yang, W.; et al. Effect of 17 years of organic and inorganic fertilizer applications on soil phosphorus dynamics in a rice-wheat rotation cropping system in eastern China. J. Soils Sediments 2015, 15, 1889–1899. [Google Scholar] [CrossRef]
  42. Zhang, M.K.; He, Z.L.; Calvert, D.V.; Stoffella, P.J.; Yang, X.E.; Li, Y.C. Phosphorus and Heavy Metal Attachment and Release in Sandy Soil Aggregate Fractions. Soil Sci. Soc. Am. J. 2003, 67, 1158–1167. [Google Scholar] [CrossRef]
  43. Bravo, C.; Torrent, J.; Giráldez, J.V.; González, P.; Ordóñez, R. Long-term effect of tillage on phosphorus forms and sorption in a Vertisol of southern Spain. Eur. J. Agron. 2006, 25, 264–269. [Google Scholar] [CrossRef]
  44. Laboski, C.A.M.; Lamb, J.A. Impact of manure application on soil phosphorus sorption characteristics and subsequent water quality implications. Soil Sci. 2004, 169, 440–448. [Google Scholar] [CrossRef]
  45. Hinsinger, P. Bioavailability of soil inorganic P in the rhizosphere as affected by root-induced chemical changes: A review. Plant Soil 2001, 237, 173–195. [Google Scholar] [CrossRef]
  46. Blake, L.; Mercik, S.; Koerschens, M.; Moskal, S.; Poulton, P.R.; Goulding, K.W.T.; Weigel, A.; Powlson, D.S. Phosphorus content in soil, uptake by plants and balance in three European long-term field experiments. Nutr. Cycl. Agroecosyst. 2000, 56, 263–275. [Google Scholar] [CrossRef]
  47. Redel, Y.; Staunton, S.; Durán, P.; Gianfreda, L.; Rumpel, C.; de la Luz Mora, M. Fertilizer P Uptake Determined by Soil P Fractionation and Phosphatase Activity. J. Soil Sci. Plant Nutr. 2019, 19, 166–174. [Google Scholar] [CrossRef]
  48. Wang, M.; Ma, L.; Strokal, M.; Ma, W.; Liu, X.; Kroeze, C. Hotspots for Nitrogen and Phosphorus Losses from Food Production in China: A County-Scale Analysis. Environ. Sci. Technol. 2018, 52, 5782–5791. [Google Scholar] [CrossRef] [Green Version]
  49. Ma, L.; Wang, F.; Zhang, W.; Ma, W.; Velthof, G.; Qin, W.; Oenema, O.; Zhang, F. Environmental assessment of management options for nutrient flows in the food chain in China. Environ. Sci. Technol. 2013, 52, 5782–5791. [Google Scholar] [CrossRef]
  50. Díez, J.A.; Hernaiz, P.; Muñoz, M.J.; de la Torre, A.; Vallejo, A. Impact of pig slurry on soil properties, water salinization, nitrate leaching and crop yield in a four-year experiment in Central Spain. Soil Use Manag. 2006, 20, 444–450. [Google Scholar] [CrossRef]
  51. Si, L.; Xie, Y.; Ma, Q.; Wu, L. The short-term effects of rice straw biochar, nitrogen and phosphorus fertilizer on rice yield and soil properties in a cold waterlogged paddy field. Sustainability 2018, 10, 537. [Google Scholar] [CrossRef] [Green Version]
  52. Cassman, K.G.; Dobermann, A.; Walters, D.T. Agroecosystems, nitrogen-use efficiency, and nitrogen management. AMBIO 2002, 31, 132–140. [Google Scholar] [CrossRef] [PubMed]
  53. Chen, X.; Zhang, F.; Römheld, V.; Horlacher, D.; Schulz, R.; Böning-Zilkens, M.; Wang, P.; Claupein, W. Synchronizing N supply from soil and fertilizer and N demand of winter wheat by an improved Nmin method. Nutr. Cycl. Agroecosyst. 2006, 74, 91–98. [Google Scholar] [CrossRef]
  54. Xin, X.; Zhang, X.; Chu, W.; Mao, J.; Yang, W.; Zhu, A.; Zhang, J.; Zhong, X. Characterization of fluvo-aquic soil phosphorus affected by long-term fertilization using solution 31P NMR spectroscopy. Sci. Total Environ. 2019, 692, 89–97. [Google Scholar] [CrossRef] [PubMed]
  55. National Bureau of Statistics of China. China Statistical Yearbook; National Bureau of Statistics of China: Beijing, China, 2018.
  56. Diacono, M.; Montemurro, F. Long-term effects of organic amendments on soil fertility. A review. Agron. Sustain. Dev. 2010, 30, 401–422. [Google Scholar] [CrossRef] [Green Version]
  57. Hui, X.; Luo, L.; Wang, S.; Cao, H.; Huang, M.; Shi, M.; Malhi, S.S.; Wang, Z. Critical concentration of available soil phosphorus for grain yield and zinc nutrition of winter wheat in a zinc-deficient calcareous soil. Plant Soil 2019, 444, 315–330. [Google Scholar] [CrossRef]
  58. Bouain, N.; Shahzad, Z.; Rouached, A.; Khan, G.A.; Berthomieu, P.; Abdelly, C.; Poirier, Y.; Rouached, H. Phosphate and zinc transport and signalling in plants: Toward a better understanding of their homeostasis interaction. J. Exp. Bot. 2014, 65, 5725–5741. [Google Scholar] [CrossRef] [PubMed] [Green Version]
  59. Xin, X.; Qin, S.; Zhang, J.; Zhu, A.; Yang, W.; Zhang, X. Yield, phosphorus use efficiency and balance response to substituting long-term chemical fertilizer use with organic manure in a wheat-maize system. Field Crop. Res. 2017, 208, 27–33. [Google Scholar] [CrossRef]
  60. Schröder, J. Revisiting the agronomic benefits of manure: A correct assessment and exploitation of its fertilizer value spares the environment. Bioresour. Technol. 2005, 96, 253–261. [Google Scholar] [CrossRef]
  61. Zhao, B.Q.; Li, X.Y.; Li, X.P.; Shi, X.J.; Huang, S.M.; Wang, B.R.; Zhu, P.; Yang, X.Y.; Liu, H.; Chen, Y.; et al. Long-term fertilizer experiment network in china: Crop yields and soil nutrient trends. Agron. J. 2010, 102, 216–230. [Google Scholar] [CrossRef]
Figure 1. Monthly average temperature (°C) and distribution of precipitation (mm) during 2016–2017.
Agronomy 10 01818 g001
Figure 2. (A) Changes in grain yield and biomass in response to different P levels. (B) Relationship between grain yield and total biomass in response to different P levels (0, 50, 100,150, and 200 kg P2O5 ha−1); bars over the markers show standard error (n = 4).
Agronomy 10 01818 g002
Figure 3. (A) Changes in grain P uptake and total P uptake in response to different P levels. (B) Relationship between grain P uptake and total P uptake in response to different P levels; bars over the markers show standard error (n = 4).
Agronomy 10 01818 g003
Figure 4. Changes in total Pi and total Po in soil in response to different P rates (A). Regression analysis shows the significant changes in response to P fertilization (B). (Total P includes all organic, inorganic, and residual P fractions).
Agronomy 10 01818 g004
Figure 5. Changes in organic P fractions in response to different P fertilization (A). Regression analysis shows the significant changes in response to P fertilization (B).
Agronomy 10 01818 g005
Figure 6. Changes in inorganic P fractions in response to different P rates (A). Regression analysis showing the significant changes in response to P fertilization; error bars shows the standard deviation (B).
Agronomy 10 01818 g006
Figure 7. Changes in residual P in response to different P fertilizer rates (A). Regression showing the significant increase in residual P in response to P fertilizer rates (B).
Agronomy 10 01818 g007
Table 1. The concentration of different P fractions (mg kg−1), grain yield, and P uptake (kg ha−1) in each fertilization treatment. ANOVA significance levels of the effects of fertilization treatment.
TreatmentNaHCO3-PiNaHCO3-PoNaOH-PiNaOH-PoHClD-PiHClC-PiHClC-PoResidual PTotal PGrain YieldP Uptake
P013.1 e27 c24.5 e27 a,b165.5 d53.5 c59 b54.4 b,c424 e2964 c6.4 d
P5024.3 d44 b40.3 b22 b189.2 c70.0 b59 b61.5 a,b,c510 d5156 b11.9 c
P10040.5 c68 a29.5 d36 a216.3 b49.8 c72 b48.7 c551 c5845 a17.5 b
P15048.7 b67 a33.7 c31 a,b219.0 b84.9 a79 b82.5 a,b646 b5582 a,b17.8 a,b
P20061.3 a76 a47.0 a27 b245.9 b83.8 a124 a91.1 a756 a5851 a19.6 a
Mean values followed by the lower case letters indicate significant differences among different P levels by the LSD test at P < 0.05. NaHCO3-Pi, NaOH-Pi, HClD-Pi and Residual P refers to the inorganic P fractions while NaHCO3-Po, NaOH-Po, HClC-Po to the oganic P fractions. ANOVA: one-way analysis of variance.
Table 2. Pearson’s correlation among different P fractions, grain yield, grain P, biomass, and total uptake.
NaHCO3-PiNaHCO3-PoNaOH-PiNaOH-PoHClD-PiHClC-PiHClC-PoResidual-PGrain YieldTotal BiomassGrain P UptakeTotal P Uptake
NaHCO3-Pi1
NaHCO3-Po0.92 **1
NaOH-Pi0.63 **0.51 *1
NaOH-Po0.190.33−0.381
HClD-Pi0.95 **0.91 **0.65 **0.281
HClC-Pi0.60 **0.420.66 **−0.350.54 *1
HClC-Po0.75 **0.64 **0.60 **0.170.76 **0.381
Residual-P0.72 **0.52 *0.66 **−0.120.64 **0.85 **0.69 **1
Grain yield0.79 **0.87 **0.59 **0.180.80 **0.440.420.401
Total Biomass0.75 **0.84 **0.58 **0.170.76 **0.380.390.360.99 **1
Grain P uptake0.91 **0.93 **0.56 *0.260.91 **0.49 *0.59 **0.52 *0.93 **0.91 **1
Total P uptake0.91 **0.93 **0.56 **0.250.91 **0.49 *0.59 **0.53 *0.92 **0.90 **0.99 **1
**: Correlation is significant at the 0.01 level (2-tailed); *: Correlation is significant at the 0.05 level (2-tailed).
Publisher’s Note: MDPI stays neutral with regard to jurisdictional claims in published maps and institutional affiliations.

