Article

Morphology, Phenology, Yield, and Quality of Durum Wheat Cultivated within Organic Olive Orchards of the Mediterranean Area

1
Department of Agronomy, Food, Natural Resources, Animals and the Environment, University of Padova, Viale dell’Università 16, 35020 Padova, Italy
2
INRAE, DiaScope Unit, UE0398, INRA, Domaine de Melgueil, 34130 Montpellier, France
3
IATE, Univ Montpellier, CIRAD, INRAE, Institut Agro, 75338 Paris, CEDEX 07, France
*
Author to whom correspondence should be addressed.
Agronomy 2020, 10(11), 1789; https://doi.org/10.3390/agronomy10111789
Submission received: 16 October 2020 / Revised: 11 November 2020 / Accepted: 11 November 2020 / Published: 15 November 2020
(This article belongs to the Special Issue Mediterranean Olive Trees and Olive Oil under Climate Change)

Abstract

:
In the current context of climate change, tree–crop combinations in agroforestry systems are suggested to mitigate water and heat stresses, particularly in semi-arid environments of the Mediterranean area. In this framework, a 3-year trial was conducted at the French National Research Institute for Agriculture, Food and the Environment (INRAE) in Mauguio (Southern France) in order to investigate the response of twenty-five durum wheat genotypes under a yearly pruned (AF) and a never-pruned alley olive orchard (AF+), in comparison with an open field without trees (control, C). The grain yield of wheat was markedly reduced in both the agroforestry systems AF (average −43%) and AF+ (−83%), according to the shading level. Among the yield components, the plant density at harvest was enhanced in AF (+22%) and AF+ (+3%), although with a significant reduction in the number of grains per spike (−37% in AF and −62% in AF+), and the number of spikes per plant (−32% in AF and −52% in AF+). The thousand-grain weight (TGW) and harvest index (HI) were slightly higher under moderate shade (AF; +12% vs. C) and severe shading (AF+; +6%). Plant biomass and spike size were significantly reduced in both agroforestry systems, while the flag leaf–spike distance (last internode) increased in AF. It was concluded that the moderate shading conditions of AF may create a sustainable agricultural system, and the wide intraspecific variability suggested a large scope for screening suitable genotypes, helping to produce ideotypes to implement agroforestry-oriented breeding programs.

1. Introduction

In the Mediterranean region, durum wheat yields and quality are increasingly affected by several abiotic constraints, notably spring/summer heat stress and drought, which are expected to intensify in the near future according to the International Food Policy Research Institute (IFPRI) prevision [1]. The available climate models have predicted a probabilistic negative impact of climate change on wheat phenology and yield [2,3,4]. Agroforestry, which is defined as “an integrated land use management that combines a woody component with a lower storey agricultural production” [5], is receiving increasing attention for improving resilience to climate change in temperate regions. By providing shade with their canopy and shelter through the windbreak effect, trees play a crucial role in microclimate buffering and the regulation of water flow. Agroforestry with olive trees is among the most relevant traditional agroforestry systems in the Mediterranean area. Grown in rows or as scattered trees, the olive trees have been intercropped with cereals, legumes, vegetables, and fodder crops for centuries, providing multiple products, such as grains, fruits, and fuel, for the maintenance of local communities. These ancient low-density orchards account for 70% of the current Mediterranean olive groves and are mainly located in the hilly, marginal, and rural areas [6,7]. These olive orchards play a key role in preventing soil erosion and degradation and the abandonment of marginal areas, while improving resilience, especially of small-scale farms and through preserving green landscapes. A gradual abandonment of these olive groves has been documented in the last few decades due to their low productivity [8], although the introduction of cereals and legumes intercropping and the implementation of suitable agroforestry practices might improve their productivity and sustainability.
Crop performances remain one of the most critical issues when implementing sustainable agroforestry systems, as significant yield losses for the crop growing in the tree–crop competition zone is commonly observed [9,10]. In this way, the dynamics of crop phenology is crucial in determining the final yield result. The effect of a warming climate on crop phenology was indicated as a key point for assessing the impact of climate change on agricultural crops [1,11,12]. Plant phenology is mainly driven by air temperature and, under heat stress, the growing cycle of wheat is generally shortened, the onset of the senescence process is anticipated, and the duration of the grain-filling period is reduced. This decreases the efficiency of grain filling and dry matter accumulation, thus causing a reduced yield and quality [2,13,14]. The agroforestry models are expected to modify the environmental conditions for the understorey crop that might positively affect wheat phenology and yield components and grain quality.
While growing durum wheat under trees, the competition for solar radiation represents the main limiting factor in yield reduction [15]. Recent studies investigating the impact of different light regimes on durum wheat under temperate agroforestry systems ascertained that yield reduction can range from −20% to −50% compared with open field conditions [15,16,17]. In particular, Artru et al. [16] observed yield losses varying from 45% to 25% in wheat, with a global radiation reduction of −61% and −43%, respectively.
The analysis of yield components is useful to understand wheat’s response to different levels and duration of shading conditions. While in some studies, the number of spikes per square meter was found to be unaffected under agroforestry conditions [15,18], the spike biomass was significantly reduced [16]. According to Dufour et al. [15], the main effect of shading was the reduction in the number of grains per spike (up to −35%), although other studies documented a lower effect, i.e., −25% on average [16]. According to these findings, the kernel weight seems the yield component with the higher variability in response to agroforestry conditions, from a moderate reduction of −10%, up to −32%, compared with the open field. Concerning grain protein content, an increased value was found in agroforestry systems, which was negatively correlated with the yield level [15,16].
As the wheat varieties that are currently grown were selected under full-light conditions, they probably do not have shade-tolerant traits. According to critical solar radiation availability in the tree–crop interaction, many authors agree with the cruciality of developing specific breeding programs in order to select shade-tolerant cultivars [19,20,21]. In addition, there is an urgent need to identify desirable crop traits of adaptation to agroforestry farming systems.
Agroforestry is mainly seen as a land-use system that incorporates trees into existing herbaceous farming systems [22], such that the contrary, i.e., the introduction of crops into intensified tree systems, is poorly studied. In this study, durum wheat was intercropped for three years in alley olive orchards comprising different levels of pruning in the south of France. The aim was to assess the effects of the presence of trees and therefore the effects of the modified microclimate environment they exerted on the wheat phenology and morphology, grain yield, and quality. A large set of 25 durum wheat genotypes were selected with the aim of gaining deeper insight into (i) the effect of the specific durum wheat–olive tree agroforestry system on the understory durum wheat and (ii) to identify a possible durum wheat ideotype adapted to agroforestry systems.

2. Materials and Methods

2.1. Experimental Site

The trials were conducted at the French National Research Institute for Agriculture, Food and the Environment (INRAE) experimental DiaScope unit in the south of France (at Mauguio–Montpellier; 43°35′ N, 3°45′ E; 12 m a.s.l.; flatland) for 3 years (2015–2017). The local climate is a sub-humid Mediterranean climate with a yearly average temperature between 14.5 and 15 °C, and a maximum daily temperature that increased from 34 °C at the end of the last century up to 38 °C in 2017 (Figure S1). The amount of sunlight at the site is one of the highest in France, with an annual average of 7 h 22 min per day vs. a french mean of 4 h 46 min. The annual precipitation is about 750 mm with high heterogeneity in the rainfall pattern. The number of rainy days is relatively low, i.e., <60 per year.

2.2. Experimental Design

Durum wheat (Triticum durum Desf.) was sown in mid-November each year from 2014 till 2016 as an intercrop of an organic alley olive orchard just after olive harvesting. Wheat was sown at a density of 350 seeds m−2 under three experimental conditions (= treatments): two olive orchards, namely, one that was never pruned (named “AF+”) and one that was yearly pruned (named “AF”), which were compared with the open-field control (only wheat without trees, named “C”). Twenty-five durum wheat genotypes were cultivated, including new and old varieties and populations.
The trial was arranged as a randomized block design with 2 replicates per treatment; each treatment then hosted 50 wheat plots each year. Each replicate consisted of a 1.55 m wide and 10 m long plot. Durum wheat was in an annual rotation with legume crops, such as chickpea, fababean, or forage mixture, according to the year. Sowing was carried out after harrowing the top 10 cm of soil, without plowing.
No treatments were applied during the three-year period of the study, neither protection nor fertilization, thus defining a zero-input organic system.
In the AF treatment, the olive trees were regularly pruned from 2012 onward, thus allowing for a reduction of the crown and the inter-row shading. The olive orchard was planted in 2002 and consisted of eight rows (6 × 6 m design) in a 0.5 ha field. The olive trees were clones of Picholine, Verdale-de-l’Hérault, and their crossing, with rows oriented along the main axis running NW–SE. The 6 m inter-row hosted the durum wheat plots, as shown in Figure S2.
The AF+ treatment was implemented within an olive orchard that was also planted in 2002, with the same planting design and row orientation as in AF, located close (20 m to the west) to the AF treatment (Figure S2). In this orchard, the olive trees were clones of the Arbequine × Oliviere crossing and had never been pruned. As a consequence, the crown size was larger than in the AF, and only one plot line width was sown in each tree inter-row.
In each year, the control treatment without trees was set up close to AF and AF+.

2.3. Microclimatic Characteristics of Treatments

A Meteo-France weather station situated at the INRAE station, 100 m from the experimental field, provided hourly air temperature and humidity, rainfall, global radiation, and wind speed data from the beginning of the trial in 2014. Other sensors were placed in the areas hosting the three treatments (control, AF, and AF+) during the second and third growing seasons. Four soil moisture sensors were placed in each treatment at four soil depths, i.e., 30, 60, 90, and 110 cm. To avoid any possible interaction by genotype choice, the sensors were placed in each treatment at the center and the edge of the genotype “1” plot of block 1.

2.4. Wheat Phenology

The BBCH (Badische Anilin- und Soda Fabrik (BASF), Bayer, Ciba-Geigy, and Hoechst) scale was used to describe the wheat’s phenological development [23,24]. The wheat phenology was recorded weekly from the beginning of BBCH stage 20, i.e., tillering (about the end of February), to the beginning of BBCH stage 70, i.e., development of kernels (about mid-May), in 2016 and 2017. As wheat populations showed a certain heterogeneity in the growth between plants within the same plot, at each observation date, the most advanced stage was recorded. The period needed to reach two main phenological stages, i.e., BBCH 47 (flag leaf sheath opening) and BBCH 69 (end of anthesis), was recorded as days after sowing (DAS) for each variety in the three treatments.

2.5. Leaf Characteristics of Wheat

The leaf chlorophyll content was measured weekly on the last fully expanded leaf of six tagged plants randomly chosen in each plot, starting from the end of March to the end of May, using a Soil Plant Analysis Development (SPAD)-502 chlorophyll meter (Konica-Minolta, Hong Kong) [25,26]. Two measures were taken on each plant, one at one-third and one at two-thirds of the leaf length. Leaf growth habitus was determined at BBCH 30 (end of tillering–beginning of stem elongation on 27 March) and BBCH 41 (flag leaf sheath extending on 7 April) only in 2017 using a 1–9 visual scale evaluation, where 1 corresponded to erectophile and 9 to planophile behavior. Observations were carried out within each replicate/genotype/treatment, which involved noting the average growth habit observed by the plants in the plot.
The leaf area index (LAI) was measured with a plant canopy analyzer LAI-2200C (Li-COR, Lincoln, NE, USA) at weekly intervals from the end of March to the end of May (eight observation dates). Measures were made between two durum wheat rows in the central part of the plot: two recordings over the canopy and five below the canopy at soil level (three close to wheat stems, two in the middle of the inter-row) with a 90°-view-restricting cap. The time of the day of LAI recording was noted, and the optical sensor was pointed north for the AF and AF+ plots (as the wheat rows were in the NW–SE direction) and pointed east for the controls (as the wheat rows were in the W–E direction). The LAI-2200 also provided the MTA (mean tip angle), which indicates the foliage orientation, where 0° indicates when all leaves are horizontal and 90° when they are all vertical.

2.6. Plant Phenotyping at Maturity

Three days before harvesting, plants of a sampling area (two wheat rows × 40 cm of length) were sampled for each plot and submitted to on-field counts regarding the number of plants, number of tillers, and spikes per plant. After oven-drying (80 °C for 48 h), the grain and straw dry weights, the number of kernels per spike, and the harvest index (HI) were determined. In addition, on six randomly chosen plants of each plot, the following measures were collected: the plant height (from coleoptile to the end of awns), the spike length (without awns), and the distance between the flag leaf and the spike (bottom of the spike), i.e., the last internode length. Yield components were then calculated on a square meter base.
The harvest took place from 30 June to 3 July according to the year, using a mini combine harvester. The grains of each plot were weighed to measure the weight and humidity. For each replicate/variety/treatment, three samples of 500 grains were weighed for calculating the 1000-grain weight (TGW).

2.7. Grain Quality Analysis

Protein extraction, fractionation, and quantification were carried out at the Join Research Unit Agropolymer Engineering and Emerging Technologies (JRU IATE) (Univ Montpellier, CIRAD, INRAE, Institut Agro, Montpellier, France), according to a modified version of Dachkevitch and Autran’s [27] method. Wholemeal flour samples of 160 mg were mixed with 20 mL of 0.1 M sodium phosphate buffer (pH 6.9) containing 1% (w/v) sodium dodecyl sulfate (SDS). SDS-soluble proteins were extracted at 60 °C for 90 min using a rotary shaker. After centrifugation (39,000× g, 30 min, 20 °C) the recovered pellet was re-suspended in 5 mL phosphate buffer containing SDS and sonicated for 3 min at 7.5 W [28]. After centrifugation, the supernatant containing the SDS-unextractable protein fractions was collected. Proteins in the SDS-soluble and SDS-unextractable fractions were separated via size-exclusion high-performance liquid chromatography (SE-HPLC) using a TSKgel G4000 SWXL column (7.8 mm i.d. × 30 cm, TOSOBIOSCIENCE, Sigma Aldrich, Saint Quentin Fallavier, France), according to Dachkevitch and Autran [27]. The first chromatogram, corresponding to SDS-soluble proteins, was divided into five fractions, from F1 to F5, according to Morel et al. [28]. Fractions F1 and F2 included the largest and smallest glutenin subunits (i.e., HMW-GS and LMW-GS) respectively; F3 contained sulfur-poor ω-gliadin and β-amylase as high-molecular-weight albumins [29]; F4 contained sulfur-rich γ-, β-, and α-gliadins; and F5 contained water- (albumins) and salt- (globulins) soluble proteins, together with traces of α-gliadins. The gliadin-to-glutenin ratio was estimated as the ratio of F4 to (F1 + F2). The total area under the second chromatogram was calculated as corresponding to the SDS-unextractable polymeric proteins (Fi). The percentage of unextractable polymeric proteins (UPP%) was calculated as the Fi/(F1 + F2 + Fi) ratio (%). The total protein content of the grain samples (dry weight) was estimated from the sum of total SE-HPLC areas of both chromatograms, as indicated by Morel and Bar-L’Helgouac’h [30].

2.8. Statistical Analysis

The data of the yield and its components, morphological parameters, and grain quality parameters of the 25 genotypes cultivated in the three treatments were subjected to ANOVA using R studio software ver. 2.7 (RStudio Public Benefit Corporation (PBC), Boston, MA, USA). Separation of the means was set at p ≤ 0.05 using the Newman–Keuls test.

3. Results

3.1. Microclimatic Dynamics within Treatments

Olive trees modified all the microclimate parameters recorded during the 2016 and 2017 wheat-growing seasons in the two agroforestry treatments compared with the open field. In the understorey wheat, PAR was reduced by 30% in AF and 51% in AF+ compared with the controls (two-year average of daily mean PAR). Olive trees also modified the diurnal dynamics of the air temperature and relative humidity, as well as the water retention in the inter-row ground soil. A buffer effect was observed in the air temperature as the agroforestry increased the temperature during night hours (up to +2 °C) and decreased it during a part of the day hours (−2 °C on average, max −4 °C at 9 a.m.). Air relative humidity in the AF treatment was also modified, with higher values during the day and lower values during the night, while the wind speed was significantly reduced in both agroforestry treatments due to the wind-break effect of the olive canopy. Water conservation increased with shade level, with agroforestry treatments showing a significantly higher soil moisture content than the open field, especially during spring/summer periods (from heading to harvesting). A complete description of microclimate parameters and the edaphic environment is available in Panozzo et al. [31].

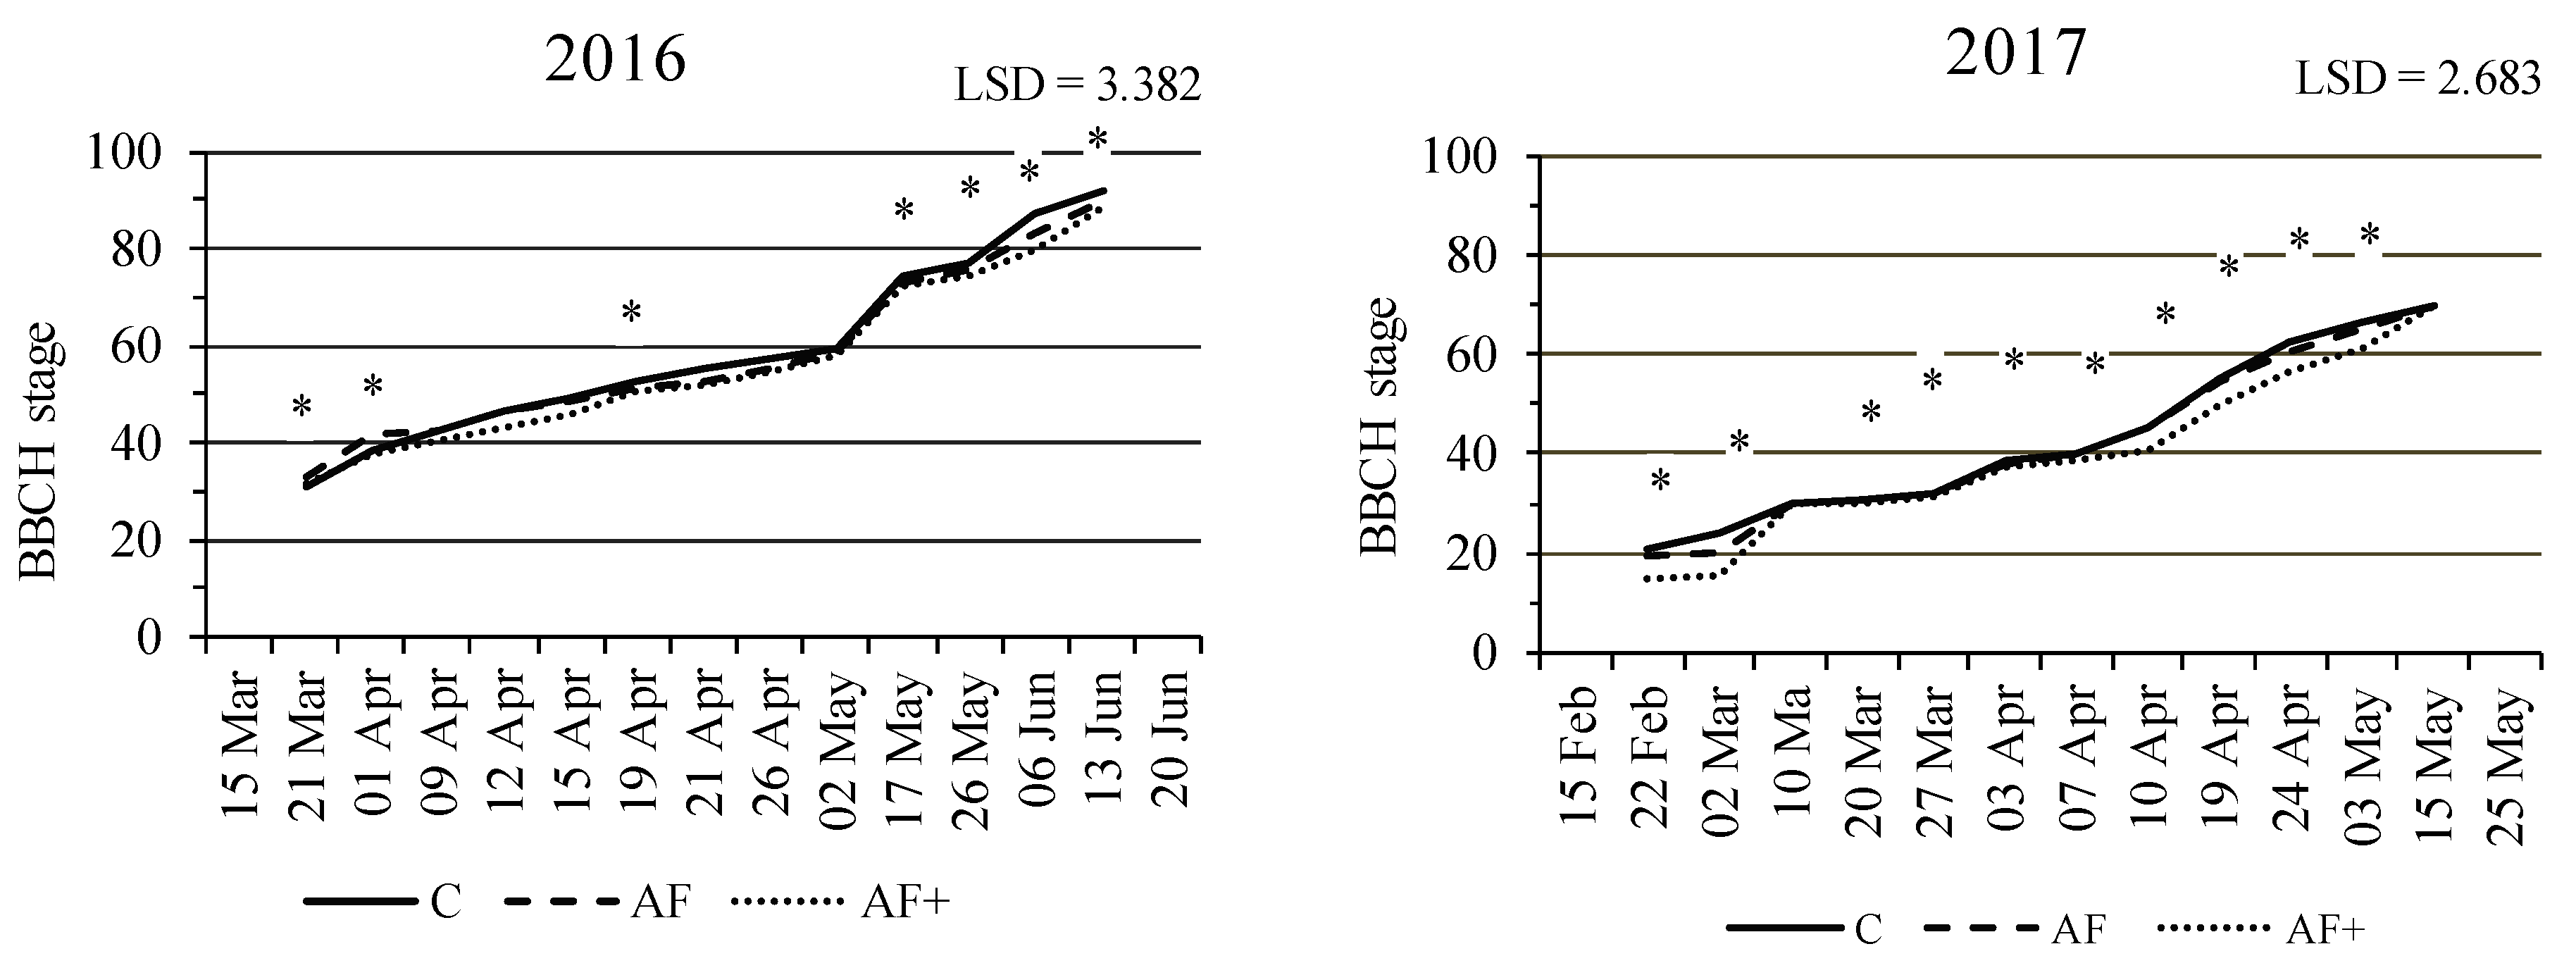
3.2. Durum Wheat Phenology
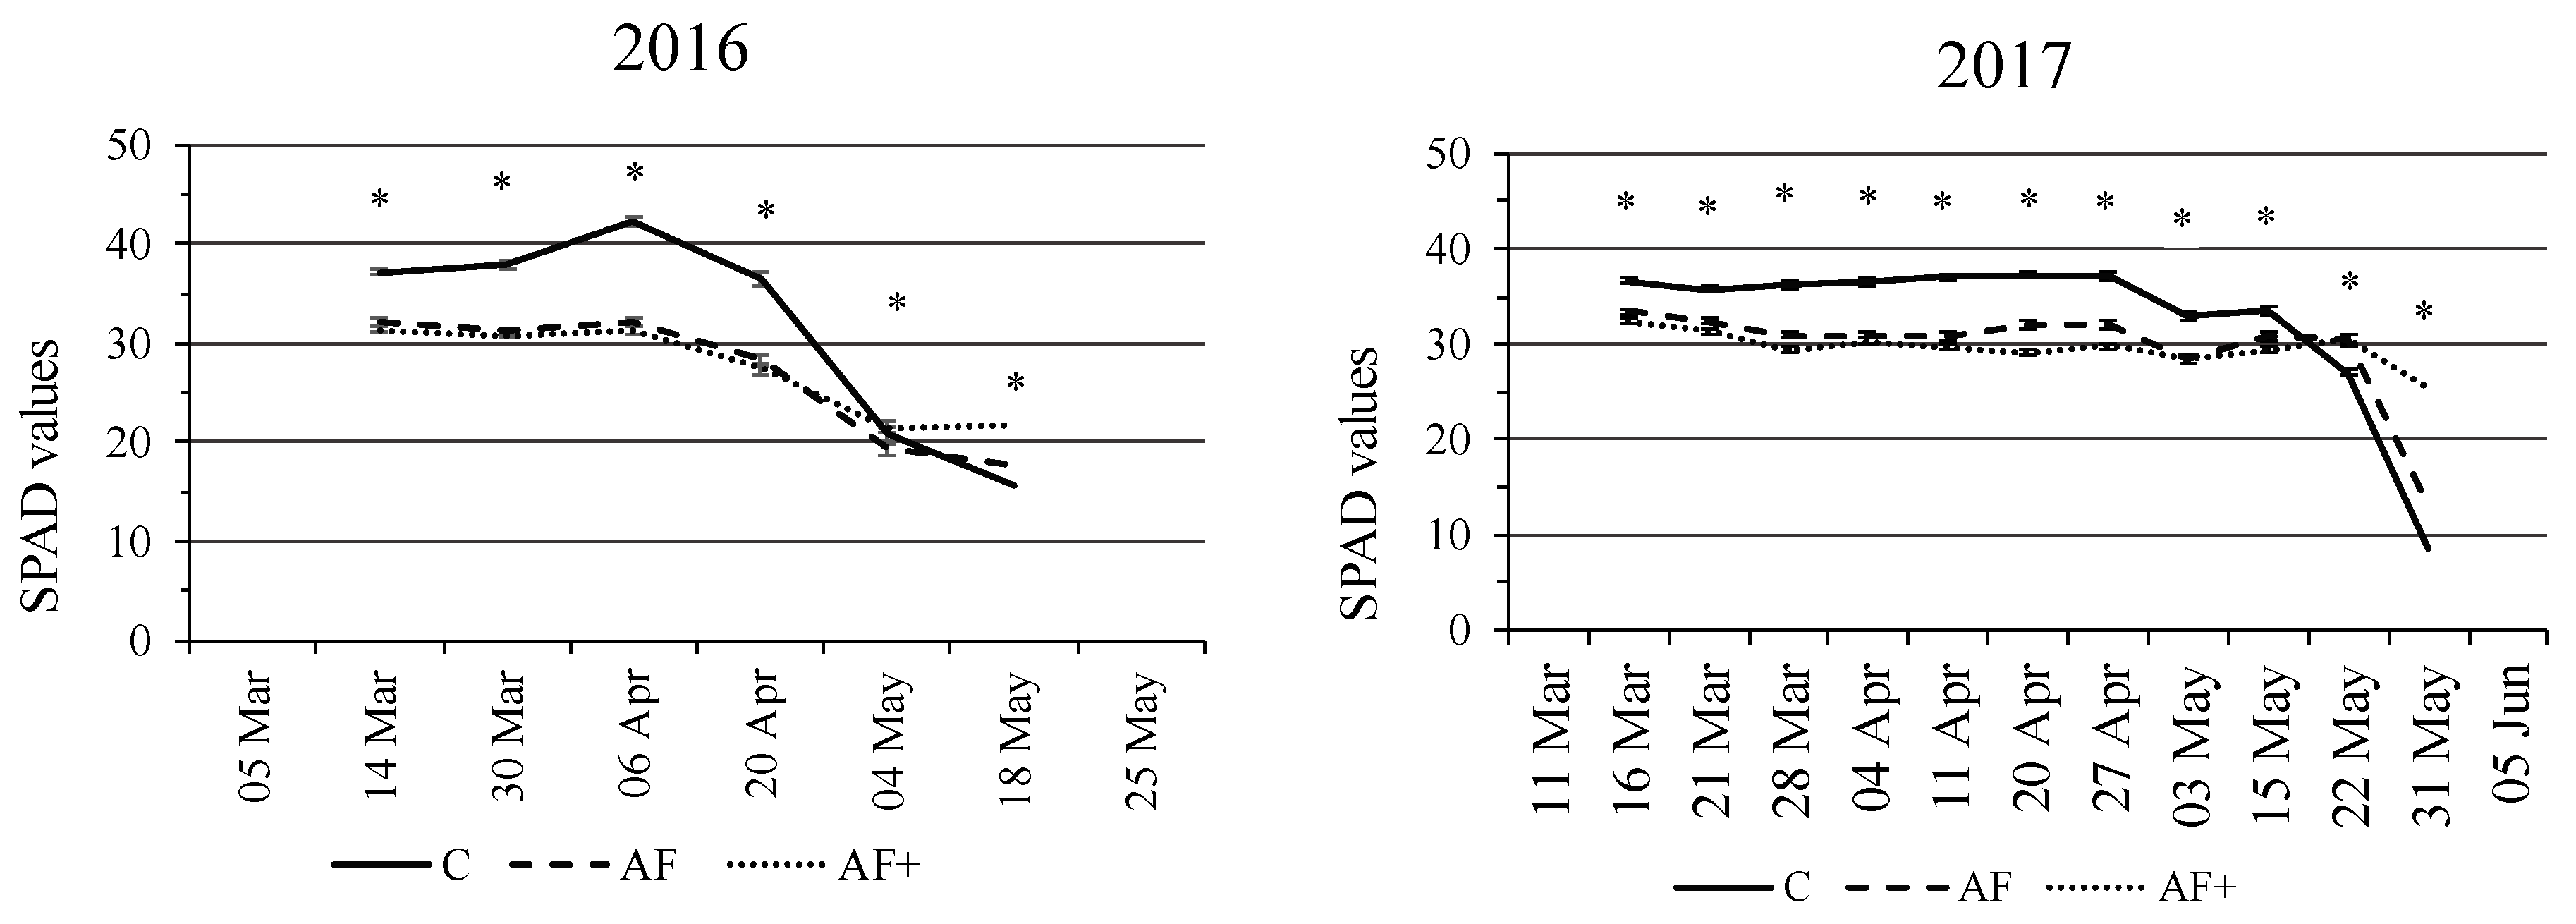
The durum wheat phenology showed different dynamics between treatments, starting from the first week of April (BBCH 40, “booting stage”) (Figure 1). At that time, by considering the genotype as a random effect of the environment, the ranking of the three treatments according to the phenological stage was the same in 2016 and 2017: the control treatment allowed the fastest growth, followed by AF and AF+, according to the shading level. However, the gap varied from year to year, as in 2016, the developmental delay was similar in AF and AF+, while in 2017, the delay was greater in AF+.
Additionally, these average data hid a wide variability between the genotypes.
Under full sun conditions (control), the wheat reached BBCH 47 (flag leaf sheath opening) at 134 DAS, within a range of 125 to 150 DAS according to the genotypes. In AF conditions, wheat reached the same stage with a delay, at 126 to 154 days. In AF+, this delay increased as BBCH 47 was reached at 126 to 164 DAS (2016–2017 mean). Similar delays were observed when considering the time needed to reach the end of anthesis (BBCH 69): 138–159 DAS (varietal mean 147 DAS) in the control, 140–167 DAS (mean 151 DAS) in AF, and 143–171 DAS (mean 156) in AF+.

3.3. Leaf Greenness

At the beginning of the SPAD recording (mid-March), the average SPAD value measured on the flag leaf was higher in the control compared with AF and AF+ (37 vs. 33 and 31 SPAD units, respectively), with similar values in both years. The three treatments were ranked in the same order till the end of April, i.e., the end of flowering (BBCH 69) (Figure 2), with the SPAD values under the full sun being significantly higher than the two agroforestry systems. In the last part of the cycle, SPAD decreased in all the treatments, but with different dynamics according to the year, as leaf senescence was postponed and shorter in 2017. In both years, the control treatment showed the fastest decline in leaf greenness, while the agroforestry treatments maintained a higher greenness from the end of April 2016 and mid-May 2017. Generally, leaf senescence in AF+ was delayed compared with AF (Figure 2) because of greater shading and later leaf formation.

3.4. Plant Morphology

The plant height and spike length were significantly affected in the two agroforestry treatments (Table 1). On average over 25 genotypes and 3 years, the height reduction of the cultivated plants was reduced by 10% and 18% in the AF and AF+ treatments, respectively, compared with the full sun treatment (76 cm high on average). Plant height reductions went up to a maximum of −27% in AF and −32% in AF+ compared with C. Similarly, the spike length was significantly reduced each year in the two agroforestry treatments (−22% in AF and −34% in AF+, compared with the control) (Table 1).
The length of the last internode was longer in AF and shorter in AF+ than in full sun conditions in all three years of the study, although the variations were not significant (+4% and −5% in AF and AF+, respectively, vs. the control). However, a large variability was found between genotypes, some of which extended the upper internode by >20% in the AF treatment compared with the full sun treatment, while some other genotypes had a shorter last internode in the AF treatment.
The leaf growth habit classification (1 = erectophile, 9 = planophile) highlighted differences in the canopy coverage. In the AF treatment, the plants tended to have more prostrate leaves than in AF+ and C, but this was not statistically significant (Table 1). On the contrary, AF+ had statistically more vertically oriented leaves compared with the full sun conditions. Significant differences were also recorded between genotypes, some of which showing leaves that were very erect with an index close to 1 (erect), regardless of the treatment and observation time (BBCH 30 and 41). Other genotypes had an intermediate elevation angle with an index of 5 (plagiophile) on both dates of notation.
These indications were confirmed by the values of the MTA provided by the LAI-2200 during the 2017 growing season. From late March to mid-May, the AF+ treatment resulted in the most vertically oriented leaves on each date, leading to significantly higher MTA values compared with other treatments (Table 1). The control treatment resulted in intermediate values of leaf elevation angle, while in AF, the MTA was minimal, suggesting the most horizontally oriented leaves (average of all genotypes).

3.5. Yield and Yield Components

The yield and yield components were analyzed by considering the different genotypes as a random effect of the environment. Under the full sun (C), the durum wheat yielded from ~1 ton/ha (2015) to ~2.3 ton/ha in 2017 (Table 2). In the agroforestry treatments, the yield was significantly reduced, except in 2015, when heavy rains just after sowing prevented correct germination in the control treatment (due to water stagnation), while in the AF treatment, water was quickly incorporated and did not stagnate.
On average over the 3 years, the yield was reduced by 43% in AF (p ≤ 0.05), with the productivity ranging from 0.9 t/ha (2016 and 2017) to 1.2 t/ha (2015), while the reduction in PAR was 30%. In AF+, with a PAR reduction of 51%, the yield significantly decreased by 83% on average, with particularly high losses in 2017.
Large genetic variability was observed between the tested genotypes. In AF, the average yield reduction was 43%, though there was great variability, ranging from −12% to −74%; in AF+ the average reduction (−83%) fell in the range interval from −72% to −97%.
To understand these reductions, the main yield components were measured, starting with plant density. At maturity, this component was commonly lower than the sowing density (350 seeds/m²) in all the treatments and years (Table 3). In 2015, because of early flooding, the plant density was reduced, particularly in the controls (only 24% of the sowing density of 350 seed/m²), whereas the plant density approached the sowing seed density in 2016 and 2017. The plant density was generally higher in the agroforestry treatments than under the full sun, on average, by +22% in AF and +3% in AF+, with significant differences in 2015 and 2017.
In contrast, the number of spikes per plant (tillering index) and the number of grains per spike were significantly reduced in the agroforestry treatments, resulting in a higher TGW.
The two agroforestry treatments mostly affected the number of grains per spike (−37% in AF and −62% in AF+ compared with the control (Table 3)). The number of spikes per plant was also significantly reduced (−32% and −52% in AF and AF+, respectively) over the three years, compared with the 2.37 spikes per plant of the control. As expected, there was a negative correlation between plant density and the number of spikes per plant (fertile tillers) (r2 = −0.24). The average TGW value of AF was 43.4 g, 12% higher compared with the control (38.6 g) (p < 0.05), while AF+ had an identical value to the control.
The same tendency was observed for the HI (Table 2). The average values were equal to 0.31 in C, 0.33 in AF, and 0.23 in AF+, which were lower than the threshold of 0.5 usually requested. In agreement with the results concerning plant morphology, the agroforestry treatments, AF and AF+, reduced the plant growth, and therefore the biomass, by 47% and 69%, respectively, compared with the control (Table 2).

3.6. Quality Parameters

The average protein content of wheat grains from the control treatment was relatively low (10.2% dry matter (DM)) compared with the standard commercial values of 12–13%. The two agroforestry treatments, AF and AF+, allowed for obtaining significantly higher grain protein contents, namely, 11.72 and 13.91% DM respectively (Table 4), in connection with a lower yield. The correlation coefficient between the protein and average yield of the 25 genotypes was −0.49 in C, −0.46 in AF, and −0.35 in AF+.
Metabolic proteins, consisting of albumins, globulins, and amphiphilic proteins (F5 fraction), were significantly more abundant in the control treatment than in the two agroforestry treatments. In contrast, AF and AF+ led to significantly higher fractions of storage proteins (F1–F4), i.e., 81.2% in AF and 81.3% in AF+ vs. 79.9% in C.
Agroforestry treatments also resulted in a significantly higher gliadin/glutenin ratio compared with the control, of +6% for AF and +11% for AF+ on average for the 2016 and 2017 seasons. Similarly, the F4 fraction (sulfur-rich α-, β-, and γ-gliadins) was significantly higher in both agroforestry treatments. Fi, considered as the fraction of unextractable polymerized proteins, was lower in the agroforestry conditions compared with the control (−11% in AF and −9% in AF+). Similarly, the UPP%, which is the ratio of Fi to the sum of the glutenin polymers, was found to be significantly higher in the full sun conditions compared with the agroforestry treatments (2-year average over 2016 and 2017), particularly in 2017.

4. Discussion

This paper provides the results of an in-depth, three-year study of a durum wheat-olive tree alley cropping system in the Mediterranean region. It demonstrated the multiple effects of agroforestry on the sustainability of wheat cultivation in the context of climate change. Compared with silvoarable systems in the temperate zone, the main originality of this study concerned the choice of olive trees as evergreen species and its high population density.
Indeed, in the literature, the case studies mainly concern deciduous tree species, such as poplar, paulownia, and walnut [9,15,17,32], in temperate systems, as well as Faidherbia albida, jujubier (Zizyphus jujuba Mill.), and Jatropha curcas L. [33,34,35] in the tropics.
When grown under deciduous tree species, a winter–spring crop, such as wheat, can reach its maximum LAI before leafy tree development reaches its maximum, thereby minimizing the interactions. The “reverse phenology” combination is considered a key trait in agroforestry as it allows for sufficient radiation penetration for the understorey crop during the growing season [33].
In our study, olive trees generated continuous shade throughout the wheat-growing season. Additionally, this system was characterized by a short inter-row of only 6 m, much narrower than the usual silvoarable alley cropping designs with poplar and walnut, where the inter-row is from 15 m to 40 m. This explained the very strong reduction in radiation reaching the wheat canopy, from −30% of PAR under the yearly pruned AF treatment to −51% under the unpruned AF+ system. Compared with the full sun conditions, durum wheat under olive trees had its development slowed by +5 days (AF treatment) to +14 days (AF+ treatment). This should be considered carefully, as delayed wheat senescence generally increases the rate and duration of photosynthesis, nutrient uptake, and ultimately yield and quality. Recent studies have shown that the lengthening of the pre-heading phase positively affects the yield more than the lengthening of the grain-filling period [13], particularly when soil moisture or other resources become scarce as summer approaches [33]. However, these benefits cannot compensate for the impact of tree shading, which resulted in decreased plant biomass and reductions in grain yield in the two agroforestry systems studied here, especially under the severe light limiting conditions of AF+. The average data recorded here (−30% and −51% of PAR associated with −43% and −83% grain yield for AF and AF+, respectively), also corroborated the results of other authors regarding deciduous trees species–wheat alley-cropping systems in temperate regions [15,16] in terms of the exponential relationship between the reduction of PAR and reduction in crop yield. In this regard, when designing an agroforestry system, it is essential to have in-depth knowledge of the specific phenological and morphological characteristics of tree and crop species. Our results were in agreement with those of Swieter et al. [9], who found large wheat yield reductions in the small area (0–3 m) bordering the rows of poplars, where the competition for water, nutrients, and light resources is more intense [36]. It is noteworthy that the higher germination rate and plant density in both agroforestry systems compared with full sun, possibly due to reduced flooding after abundant rainfall in December 2015 and 2016 and the more favorable conditions in the topsoil (i.e., warmer with more moisture) in the subsequent year, although in any case, the plant density was much lower than the sowing density.
Indeed, in the two alley-cropping systems (durum wheat-poplar/ash tree) located fairly close to our experimental site, Inurreta-Aguirre et al. [37] also observed a slightly higher crop density in agroforestry (+10%) compared with controls and the plant densities were greatly reduced compared with the sowing density (152 plants/m2 vs. 350 seeds/m2). This study confirmed the number of grains per spike as a crucial yield component. It was reduced by 37% under moderate shading (AF treatment), a value that is very similar to the findings of Artru et al. [16], Dufour et al. [15], and Li et al. [17] (30–37%), whereas, unlike these authors, the thousand-grain weight was rarely increased in our experiment. According to Retkute et al. [19], the effect of radiation reduction on the final yield depends on the phenological stage during which shading occurs, as well as on its duration, where variations have different consequences on yield components. By imposing a shading regime (e.g., an ~30-day period) in pre-flowering, the final yield is mainly affected through the reduction in the number of grains per spike and per unit surface [19,38], while later (after flowering), the effect is a reduction in the number of grains per square meter and in the grain weight [39]. The continuous shading in our agroforestry systems would explain the reduction of almost all components of wheat yield. However, it is hypothesized that not only the reduction in PAR but also the modification of temperatures in AF and AF+, with warmer evenings and cooler mornings due to shelter and windbreak effects, could also be responsible for the drop in yield. Temperature buffering between day- and night-time under tree canopies is quite common in temperate agroforestry systems [36,37,40,41], and experimental increases of night temperatures in wheat crops was demonstrated to reduce yield by 2% to 9% per degree Celsius increase [42,43,44]. The reduction in average yield recorded under the olive agroforestry systems hid a wide intraspecific variability, ranging from −12% to −74% in the most sustainable AF treatment, depending on the variety choice. The results on the large set of genotypes investigated here highlight that there is reasonable scope for screening cultivars that are adapted to agroforestry conditions and for identifying useful morphological and physiological characters to select, as suggested by other authors [45,46,47].
With regard to the grain quality, this study found an increase in protein content when the level of shading was increased, in agreement with similar studies [10,15,16], which was probably due to better remobilization of N in plant tissues and the generally negative correlation with grain yield; however, the SE-HPLC used to investigate the protein composition highlighted that the %UPP was higher under full sun conditions.
Better tolerance to low radiation requires enhanced plasticity of the light-intercepting components, both morphological and physiological. This study found higher levels of SPAD (an index of leaf chlorophyll content) in the agroforestry treatments during grain filling, which indicates delayed senescence. In a study with shading levels similar to our agroforestry treatments, Lakshmanakumar et al. [48] documented a significant reduction in the rate of photosynthesis, stomatal conductance, and transpiration, together with an increased mesophyll intracellular CO2 concentration, with an increasing level of shading. Instead, Li et al. [45], under mild shading (−8% and −15% of PAR), observed prolonged functionality of the upper leaves, with improvement in both actual photochemical efficiency and electron transport rate (ETR) between photosystem II (PSII) and photosystem I (PSI), supporting the enhanced efficiency when using the limited light available.
It is therefore expected that moderate shading may improve the growth and yield of winter wheat in agroforestry systems through physiological and morphological compensations [45,49,50,51]. The shading adaptation strategy also includes changes in the canopy architecture, with an increase in canopy size (LAI), elongation of the last internode, and a change in biomass partitioning across plant organs [16]. Li et al. [45] observed that shading promotes remobilization of stored dry matter from the lower internodes toward the grains, which may partly explain the similar harvest indexes between the full sun conditions and agroforestry treatments, despite the great difference in plant biomass. Undoubtedly, tree shading in agroforestry is responsible for the reduction in plant size, biomass, and leaf area in wheat, but this may partially be compensated for by increases in the fraction of the top and bottom leaf area for facilitating solar radiation interception, as observed by some authors [15,50]. In our study, under moderate shading (AF treatment), durum wheat exhibited interesting morphological changes, such as the lengthening of the last internode and reduction in the leaf elevation angle compared with the full sun conditions, which may facilitate light interception and could be used in variety screening and breeding programs that are oriented toward agroforestry.

5. Conclusions

Durum wheat cultivation within the narrow alleys of olive orchards is an extreme continuous shading system that is suitable for highlighting the drawbacks and advantages of silvoarable models, whose reintroduction in the Mediterranean area is considered strategic due to climate change and land use.
Growth and yield reductions of wheat are expected under agroforestry but are generally compensated for by improved land equivalent ratios (LER) [52]. Moderate shading conditions appear to be acceptable in the design of sustainable agroforestry systems by adopting adequate tree density and distances, as well as pruning, although further improvements can be achieved through appropriate variety choices. The screening of varieties is a crucial point, as breeding programs of the last few decades have gradually shifted toward the needs of intensive agriculture (high availability of resources, including radiation) and the food industry (grain quality). The morphological and physiological plant plasticity of wheat regarding the adaptation to shading includes key traits, such as spike fertility, reduced leaf elevation angles, and a delay in leaf senescence, with the latter being essential under extremely high temperatures during the seed filling stage. The great number of parameters studied in this experiment on a large set of durum wheat genotypes allowed for demonstrating contrasting responses depending on the variety choice. Therefore, there is reasonable scope in screening ideotypes for agroforestry conditions and deeper investigations are necessary to search for additional useful traits.

Supplementary Materials

The following are available online at https://www.mdpi.com/2073-4395/10/11/1789/s1, Figure S1: Dynamics of the yearly mean maximum and minimum temperatures (T) and linear regression trends at the INRA Station (Mauguio—Montpellier) from 1997 to 2017; Figure S2: Sketch of the olive tree/durum wheat intercropping in the AF (left) and AF+ (right) treatments.

Author Contributions

Conceptualization, D.D.; methodology, D.D. and M.F.S.; formal analysis, D.D., A.P., and M.F.S.; investigation, B.B., H.H., and A.P.; resources, D.D. and M.F.S.; data curation, D.D.; writing—original draft preparation, A.P.; writing—review and editing, D.D., A.P., and T.V.; supervision, D.D.; project administration, D.D.; funding acquisition, D.D. All authors have read and agreed to the published version of the manuscript.

Funding

This study was undertaken in the frame of the AGFORWARD project (grant agreement no. 613520), co-funded by the European Commission, Directorate-General for Research and Innovation, within the 7th Framework Program of RTD, Theme 2—Biotechnologies, Agriculture, and Food.

Conflicts of Interest

The authors declare no conflict of interest.

References

  1. Moriondo, M.; Bindi, M. Impact of climate change on the phenology of typical Mediterranean crops. Ital. J. Agrometeorol. 2007, 3, 5–12. [Google Scholar]
  2. Ferrise, R.; Moriondo, M.; Bindi, M. Probabilistic assessments of climate change impacts on durum wheat in the Mediterranean region. Nat. Hazards Earth Syst. Sci. 2011, 11, 1293–1302. [Google Scholar] [CrossRef]
  3. Gouache, D.; Le Bris, X.; Bogard, M.; Deudon, O.; Pagé, C.; Gate, P. Evaluating agronomic adaptation options to increasing heat stress under climate change during wheat grain filling in France. Eur. J. Agron. 2012, 39, 62–70. [Google Scholar] [CrossRef]
  4. Xiao, D.; Bai, H.; Liu, D.L. Impact of future climate change on wheat production: A simulated case for china’s wheat system. Sustainability 2018, 10, 1277. [Google Scholar] [CrossRef] [Green Version]
  5. Mosquera-Losada, M.R.; Santiago-Freijanes, J.; Rois-Díaz, M.; Moreno, G.; Herder, M.D.; Aldrey-Vázquez, J.; Ferreiro-Domínguez, N.; Pantera, A.; Pisanelli, A.; Rigueiro-Rodríguez, A. Agroforestry in Europe: A land management policy tool to combat climate change. Land Use Policy 2018, 78, 603–613. [Google Scholar] [CrossRef]
  6. Taguas, E.V.; Peña, A.; Ayuso, J.L.; Pérez, R.; Yuan, Y.; Giráldez, J.V. Rainfall variability and hydrological and erosive response of an olive tree microcatchment under no-tillage with a spontaneous grass cover in Spain. Earth Surf. Process. Landforms 2010, 35, 750–760. [Google Scholar] [CrossRef]
  7. Kavvadias, V.; Koubouris, G. Sustainable soil management practices in olive groves. In Soil Fertility Management for Sustainable Development; Springer Science and Business Media LLC: Berlin/Heidelberg, Germany, 2019; pp. 167–188. [Google Scholar]
  8. Duarte, F.; Jones, N.; Fleskens, L. Traditional olive orchards on sloping land: Sustainability or abandonment? J. Environ. Manag. 2008, 89, 86–98. [Google Scholar] [CrossRef]
  9. Swieter, A.; Langhof, M.; Lamerre, J.; Greef, J.M. Long-term yields of oilseed rape and winter wheat in a short rotation alley cropping agroforestry system. Agrofor. Syst. 2019, 93, 1853–1864. [Google Scholar] [CrossRef] [Green Version]
  10. Pardon, P.; Reubens, B.; Mertens, J.; Verheyen, K.; De Frenne, P.; De Smet, G.; Van Waes, C.; Reheul, D. Effects of temperate agroforestry on yield and quality of different arable intercrops. Agric. Syst. 2018, 166, 135–151. [Google Scholar] [CrossRef]
  11. Garatuza-Payan, J.; Argentel-Martinez, L.; Yépez, E.A.; Arredondo, T. Initial response of phenology and yield components of wheat (Triticum durum L., CIRNO C2008) under experimental warming field conditions in the Yaqui Valley. PeerJ 2018, 6, e5064. [Google Scholar] [CrossRef] [Green Version]
  12. Mäkinen, H.; Kaseva, J.; Trnka, M.; Balek, J.; Kersebaum, K.; Nendel, C.; Gobin, A.; Olesen, J.; Bindi, M.; Ferrise, R.; et al. Sensitivity of European wheat to extreme weather. Field Crops Res. 2018, 222, 209–217. [Google Scholar] [CrossRef]
  13. Al-Karaki, G.N. Phenological development-yield relationships in durum wheat cultivars under late-season high-temperature stress in a semiarid environment. ISRN Agron. 2012, 2012, 456856. [Google Scholar] [CrossRef] [Green Version]
  14. Carboni, G. Evaluation of Conservation Tillage and Rotation with Legumes as Adaptation and Mitigation Strategies of Climate Change on Durum Wheat in Sardinia. Ph.D. Thesis, Università degli Studi di Sassari, Sassari, Italy, 2011. [Google Scholar]
  15. Dufour, L.; Metay, A.; Talbot, G.; Dupraz, C. Assessing light competition for cereal production in temperate agroforestry systems using experimentation and crop modelling. J. Agron. Crop. Sci. 2012, 199, 217–227. [Google Scholar] [CrossRef]
  16. Artru, S.; Garré, S.; Dupraz, C.; Hiel, M.-P.; Blitz-Frayret, C.; Lassois, L. Impact of spatio-temporal shade dynamics on wheat growth and yield, perspectives for temperate agroforestry. Eur. J. Agron. 2017, 82, 60–70. [Google Scholar] [CrossRef]
  17. Li, F.; Meng, P.; Fu, D.; Wang, B. Light distribution, photosynthetic rate and yield in a Paulownia-wheat intercropping system in China. Agrofor. Syst. 2008, 74, 163–172. [Google Scholar] [CrossRef]
  18. Wang, B.J.; Zhang, W.; Ahanbieke, P.; Gan, Y.W.; Xu, W.L.; Li, L.H.; Christie, P. Interspecific interactions alter root length density, root diameter and specific root length in jujube/wheat agroforestry systems. Agrofor. Syst. 2014, 88, 835–850. [Google Scholar] [CrossRef]
  19. Retkute, R.; Smith-Unna, S.E.; Smith, R.W.; Burgess, A.J.; Jensen, O.; Johnson, G.N.; Preston, S.P.; Murchie, E.H. Exploiting heterogeneous environments: Does photosynthetic acclimation optimize carbon gain in fluctuating light? J. Exp. Bot. 2015, 66, 2437–2447. [Google Scholar] [CrossRef] [Green Version]
  20. Ehret, M.; Gras, R.; Wachendorf, M. The effect of shade and shade material on white clover/perennial ryegrass mixtures for temperate agroforestry systems. Agrofor. Syst. 2015, 89, 557–570. [Google Scholar] [CrossRef]
  21. Barro, R.S.; Varella, A.C.; Lemaire, G.; De Medeiros, R.B.; De Saibro, J.C.; Nabinger, C.; Bangel, F.V.; Carassai, I.J. Forage yield and nitrogen nutrition dynamics of warm-season native forage genotypes under two shading levels and in full sunlight. Rev. Bras. Zootec. 2012, 41, 1589–1597. [Google Scholar] [CrossRef] [Green Version]
  22. Chauhan, S.K.; Sharma, S.C.; Beri, V.; Yadav, S.; Gupta, N. Yield and carbon sequestration potential of wheat (Triticum aestivum)-poplar (Populus deltoides) based agri-silvicultural system. Indian J. Agric. Sci. 2010, 80, 129–135. [Google Scholar]
  23. Lancashire, P.D.; Bleiholder, H.; Boom, T.V.D.; Langelüddeke, P.; Stauss, R.; Weber, E.; Witzenberger, A. A uniform decimal code for growth stages of crops and weeds. Ann. Appl. Biol. 1991, 119, 561–601. [Google Scholar] [CrossRef]
  24. Zadoks, J.C.; Chang, T.T.; Konzak, C.F. A decimal code for the growth stages of cereals. Weed Res. 1974, 14, 415–421. [Google Scholar] [CrossRef]
  25. Hoel, B.O. Effect of irradiance on chlorophyll estimation with the minolta SPAD-502 leaf chlorophyll meter. Ann. Bot. 1998, 82, 389–392. [Google Scholar] [CrossRef] [Green Version]
  26. Chang, S.X.; Robison, D.J. Nondestructive and rapid estimation of hardwood foliar nitrogen status using the SPAD-502 chlorophyll meter. For. Ecol. Manag. 2003, 181, 331–338. [Google Scholar] [CrossRef]
  27. Dachkevitch, T.; Autran, J.C. Prediction of baking quality of bread wheats in breeding programs by size-exclusion high-performance liquid chromatography. Cereal Chem. 1989, 66, 448–456. [Google Scholar]
  28. Morel, M.-H.; Dehlon, P.; Autran, J.C.; Leygue, J.P.; Bar-L’Helgouac’h, C. Effects of temperature, sonication time, and power settings on size distribution and extractability of total wheat flour proteins as determined by size-exclusion high-performance liquid chromatography. Cereal Chem. J. 2000, 77, 685–691. [Google Scholar] [CrossRef]
  29. Samson, M.-F.; Morel, M.-H. Heat denaturation of durum wheat semolina β-amylase effects of chemical factors and pasta processing conditions. J. Food Sci. 1995, 60, 1313–1320. [Google Scholar] [CrossRef]
  30. Morel, M.-H.; Bar-L’Helgouac’H, C. Reliable Estimates of Gliadin, Total and Unextractable Glutenin Polymers and Total Protein Content, from Single Se-Hplc Analysis of Total Wheat Flour Protein Extract; Royal Society of Chemistry (RSC): London, UK, 2007; pp. 140–143. [Google Scholar]
  31. Panozzo, A.; Huan, H.Y.; Bernazeau, B.; Meunier, F.; Turc, O.; Duponnois, R.; Prin, Y.; Desclaux, D. Impact of olive trees on the microclimatic and edaphic environment of the understorey durum wheat in a Mediterranean alley cropping system. Arch. Agron. Soil. Sci. (under review).
  32. Bisht, N.; Sah, V.K.; Satyawali, K.; Tewari, S.; Kandpal, G. Assessment of soil quality and wheat yield under open and poplar based farming system in Tarai region of Uttarakhand. Indian J. Agric. Res. 2018, 52. [Google Scholar] [CrossRef]
  33. Sida, T.S.; Baudron, F.; Kim, H.; Giller, K.E. Climate-smart agroforestry: Faidherbia albida trees buffer wheat against climatic extremes in the Central Rift Valley of Ethiopia. Agric. For. Meteorol. 2018, 248, 339–347. [Google Scholar] [CrossRef]
  34. Francis, G.; Oliver, J.; Sujatha, M. High yielding and trait specific genotypes and genetic associations among yield and yield contributing traits in Jatropha curcas L. Agrofor. Syst. 2017, 92, 1417–1436. [Google Scholar] [CrossRef]
  35. Yang, T.; Duan, Z.P.; Zhu, Y.; Gan, Y.W.; Wang, B.J.; Hao, X.D.; Xu, W.L.; Zhang, W.; Li, L.H. Effects of distance from a tree line on photosynthetic characteristics and yield of wheat in a jujube tree/wheat agroforestry system. Agrofor. Syst. 2018, 93, 1545–1555. [Google Scholar] [CrossRef]
  36. Kanzler, M.; Böhm, C.; Mirck, J.; Schmitt, D.; Veste, M. Microclimate effects on evaporation and winter wheat (Triticum aestivum L.) yield within a temperate agroforestry system. Agrofor. Syst. 2019, 93, 1821–1841. [Google Scholar] [CrossRef]
  37. Inurreta-Aguirre, H.D.; Lauri, P.-E.; Dupraz, C.; Gosme, M. Yield components and phenology of durum wheat in a Mediterranean alley-cropping system. Agrofor. Syst. 2018, 92, 961–974. [Google Scholar] [CrossRef]
  38. Demotes-Mainard, S.; Jeuffroy, M.-H. Effects of nitrogen and radiation on dry matter and nitrogen accumulation in the spike of winter wheat. Field Crops Res. 2004, 87, 221–233. [Google Scholar] [CrossRef]
  39. Campuzano, G.E.; Miralles, D.J.; Slafer, G.A. Yield determination in triticale as affected by radiation in different development phases. Eur. J. Agron. 2008, 28, 597–605. [Google Scholar] [CrossRef]
  40. Renaud, V.; Innes, J.L.; Dobbertin, M.; Rebetez, M. Comparison between open-site and below-canopy climatic conditions in Switzerland for different types of forests over 10 years (1998−2007). Theor. Appl. Clim. 2010, 105, 119–127. [Google Scholar] [CrossRef] [Green Version]
  41. Gosme, M.; Dufour, L.; Inurreta-Aguirre, H.; Dupraz, C. Microclimate effect of agroforestry on diurnal temperature cycle. In Proceedings of the 3rd European Agroforestry Conference—Montpellier, Montpellier, France, 23–25 May 2016; pp. 183–186. [Google Scholar]
  42. García, G.A.; Dreccer, M.F.; Miralles, D.J.; Serrago, R.A. High night temperatures during grain number determination reduce wheat and barley grain yield: A field study. Glob. Chang. Biol. 2015, 21, 4153–4164. [Google Scholar] [CrossRef]
  43. García, G.A.; Miralles, D.J.; Serrago, R.A.; Alzueta, I.; Huth, N.I.; Dreccer, M.F. Warm nights in the Argentine Pampas: Modelling its impact on wheat and barley shows yield reductions. Agric. Syst. 2018, 162, 259–268. [Google Scholar] [CrossRef]
  44. Hossain, A.; Da Silva, J.A.T. Phenology, growth and yield of three wheat (Triticum aestivum L.) varieties as affected by high temperature stress. Not. Sci. Biol. 2012, 4, 97–109. [Google Scholar] [CrossRef] [Green Version]
  45. Li, H.; Jiang, D.; Wollenweber, B.; Dai, T.; Cao, W. Effects of shading on morphology, physiology and grain yield of winter wheat. Eur. J. Agron. 2010, 33, 267–275. [Google Scholar] [CrossRef]
  46. Gill, R.I.S.; Singh, B.; Kaur, N. Productivity and nutrient uptake of newly released wheat varieties at different sowing times under poplar plantation in north-western India. Agrofor. Syst. 2009, 76, 579–590. [Google Scholar] [CrossRef]
  47. Arenas-Corraliza, M.G.; López-Díaz, M.L.; Moreno, G. Winter cereal production in a Mediterranean silvoarable walnut system in the face of climate change. Agric. Ecosyst. Environ. 2018, 264, 111–118. [Google Scholar] [CrossRef]
  48. Lakshmanakumar, P.; Bana, O.P.S.; Guru, S.K. Physiological basis of yield variability in wheat (Triticum aestivum L.) under varying degree of shades. Indian J. Plant. Physiol. 2013, 18, 164–168. [Google Scholar] [CrossRef]
  49. Gu, L.; Baldocchi, D.; Verma, S.B.; Black, T.A.; Vesala, T.; Falge, E.; Dowty, P.R. Advantages of diffuse radiation for terrestrial ecosystem productivity. J. Geophys. Res. Space Phys. 2002, 107, 2. [Google Scholar] [CrossRef] [Green Version]
  50. Mu, H.; Jiang, D.; Wollenweber, B.; Dai, T.; Jing, Q.; Cao, W. Long-term low radiation decreases leaf photosynthesis, photochemical efficiency and grain yield in winter wheat. J. Agron. Crop. Sci. 2010, 196, 38–47. [Google Scholar] [CrossRef]
  51. Wang, Z.; Yin, Y.; He, M.; Zhang, Y.; Lu, S.; Li, Q.; Shi, S. Allocation of photosynthates and grain growth of two wheat cultivars with different potential grain growth in response to pre- and post-anthesis shading. J. Agron. Crop. Sci. 2003, 189, 280–285. [Google Scholar] [CrossRef]
  52. Panozzo, A.; Bernazeau, B.; Desclaux, D. Durum wheat in organic olive orchard: Good deal for the farmers? Agrofor. Syst. 2019, 94, 707–717. [Google Scholar] [CrossRef]
Figure 1. Phenological stages (BBCH (Badische Anilin- und Soda Fabrik (BASF), Bayer, Ciba-Geigy, and Hoechst) scale; [24]) of durum wheat grown in the three treatments as the average of 25 varieties in the 2016 and 2017 growing seasons. The least significant difference (LSD) for the interaction “date × treatment” (p ≤ 0.05). Asterisks indicate significant differences between treatments at each date (Tukey’s HSD test, p ≤ 0.05). C: controls, AF: pruned olive trees, AF+: un-pruned olive trees.
Agronomy 10 01789 g001
Figure 2. Leaf (last fully expanded) chlorophyll content measured as SPAD (soil plant analysis development) units (±SE) in three treatments as the average of 25 genotypes (6 plants were measured for each genotype/replicate) in the 2016 and 2017 growing seasons. Asterisks indicate significant differences between treatments for each date (Tukey’s HSD test, p ≤ 0.05). C: controls; AF: pruned olive trees; AF+: un-pruned olive trees.
Agronomy 10 01789 g002
Table 1. Morphological traits of plants grown under the full sun (C), AF, and AF+ agroforestry treatments, as an average of all genotypes from 2015–2017 (means). Morphological trait values arose from plant phenotyping at maturity. The average mean tip angle (MTA) and leaf growth habit were recorded only in 2016–2017 and are presented as the average of all the observation dates from the last week of March till the end of May.
Plant Height
(cm)
Spike Length
(cm)
Last Internode Length
(cm)
Leaf MTA
(°)
Leaf Growth Habit
(1–9 Visual Scale)
Treatment201520162017Average201520162017Average201520162017AverageAverage 2017Average 2017
C81.84
(±2.57) a
73.78
(±2.34) a
75.17
(±2.26) a
75.95
(±1.41) a
7.18
(±0.19) a
5.91
(±0.17) a
6.02
(±0.19) a
6.21
(±0.12) a
14.22
(±0.63) a
11.37
(±0.59) a
18.17
(±0.76) a
14.66
(±0.49) a
64.18
(±0.32) b
2.79
(±0.11) a
AF71.67
(±2.27) b
63.03
(1.47) b
72.72
(±2.75) a
68.66
(±1.38) b
(−10%)
6.10
(±0.18) b
4.46
(±0.13) b
4.61
(±0.14) b
4.86
(±0.10) b
(−22%)
14.37
(±0.69) a
12.44
(±0.45) a
18.67
(±0.66) a
15.31
(±0.43) a
(+4%)
62.19

(±0.38) c
(−3%)
2.96
(±0.12) a
(+6%)
AF+70.89
(±2.58) b
62.10
(±1.56) b
59.98
(±1.74) b
62.25
(±1.11) c
(−18%)
5.28
(±0.19) c
4.31
(±0.13) b
3.53
(±0.10) c
4.09
(±0.09) c
(−34%)
16.09
(±0.83) a
10.78
(±0.44) a
16.62
(±0.62) a
14.00
(±0.44) a
(−5%)
66.27
(±0.49) a
(+4%)
1.56
(±0.09) b
(−44%)
Means with different letters were significantly different between treatments within the same year/column according to Tukey’s HSD test. Morphological traits of the AF and AF+ treatments were also expressed as a percentage variation compared with the C treatment.
Table 2. Yield, harvest index (HI), and biomass/plant (g of dry matter (DM); at harvest, including grain) of durum wheat (average of 25 varieties, ±SE) in three treatments in 2015, 2016, and 2017.
TreatmentGrain Yield (t/ha)HIBiomass/Plant (g DM)
201520162017Average
(%var/C)
20162017Average
(%var/C)
20162017Average
(%var/C)
C0.97
(±0.12) a
1.58
(±0.10) a
2.29
(±0.09) a
1.76
(±0.07) a
0.28
(±0.01) b
0.34
(±0.01) a
0.31
(±0.01) a
112.40
(±4.75) a
105.74
(±3.96) a
109.07
(±3.09) a
AF1.21
(±0.07) a
0.91
(±0.05) b
0.99
(±0.08) b
1.00
(±0.04) b
(−43%)
0.32
(±0.01) a
0.34
(±0.01) a
0.33
(±0.01) a
(+6%)
49.42
(±2.94) b
66.59
(±4.11) b
58.00
(±2.66) b
(−47%)
AF+0.40
(±0.04) b
0.48
(±0.03) c
0.10
(±0.01) c
0.30
(±0.02) c
(−83%)
0.25
(±0.01) b
0.20
(±0.01) b
0.23
(±0.01) b
(−27%)
46.98
(±2.96) b
21.02
(±1.90) c
34.00
(±2.18) c
(−69%)
Within the same year, means with different letters were significantly different according to Tukey’s HSD test (p ≤ 0.05). Average yield reductions in AF and AF+ compared with the control (C) are expressed as a variation percentage. C: controls; AF: pruned olive trees; AF+: un-pruned olive trees.
Table 3. Yield components of durum wheat grown in the C, AF, and AF+ treatments (means of all genotypes in 2015, 2016, and 2017). Number of plants per square meter, number of spikes per plant (where one plant means one seed sown), number of grains per spike, and thousand-grain weight (TGW).
Plants/m²No. Spikes/PlantNo. Grains/SpikeTGW (g/1000 Kernels)
Treatment201520162017Average
(%var/C)
201520162017Average
(%var/C)
201520162017Average
(%var/C)
201520162017Average
(%var/C)
C81.25
(±10.88) b
249.80
(±13.94) b
241.09
(±5.92) b
213.67 b
(±8.72)
3.22
(±0.19) a
1.49
(±0.11) a
2.86
(±0.16) a
2.37
(±0.11) a
41.32
(±4.89) a
22.02
(1.17) a
20.81
(±0.76) a
25.18
(±1.31) a
44.67
(±1.22) a
34.90
(±1.11) c
39.59
(±0.58) a
38.64
(±0.65) b
AF108.45
(±10.12) a
283.31
(±13.52) b
310.98
(±6.22) a
260.44
(±9.27) a
(+22%)
2.33
(±0.11) b
1.05
(±0.04) b
1.82
(±0.08) b
1.61
(±0.06) b
(−32%)
25.58
(±1.20) b
12.76
(±0.95) b
14.28
(±0.92) b
15.91
(±0.73) b
(−37%)
45.36
(±1.18) a
45.26
(±1.10) a
40.80
(±0.56) a
43.42
(±0.57) a
(+12%)
AF+129.56
(±10.45) a
327.06
(±13.40) b
138.60
(±8.91) c
220.15
(±11.40) b
(+3%)
1.71
(±0.11) c
0.94
(±0.03) b
1.17
(±0.08) c
1.14
(±0.04) c
(−52%)
18.91
(±1.96) b
10.24
(±0.79) c
6.59
(±0.58) c
9.70
(±0.61) c
(−62%)
40.02
(±1.22) b
39.32
(±1.25) b
36.90
(±1.19) b
38.33
(±0.77) b
(−0.8%)
In a column, means (±SE) with different letters were significantly different according to Tukey’s HSD. Yield components in the AF and AF+ treatments are also expressed as a percentage variation compared with the C treatment.
Table 4. Quality parameters analyzed in 2016 and 2017 for grain samples from the three treatments (C, AF, and AF+) regarding the protein content (%DM) and protein composition using SE-HPLC analysis, according to Dachkevitch and Autran [27]: protein fractions from F1 to F5 (as a percentage of the total protein content), the gliadins/glutenins ratio, Fi (SDS-unextractable polymeric proteins as a percentage of the total protein content), and the %UPP (100 × Fi/(F1 + F2 + Fi)).
TreatmentGrain Protein
% DM
(% var/C)
F1F2F3F4F5Gliadins/Glutenins Ratio
(%var/C)
Fi%UPP
20162017Average
(%var/C)
C10.17
(±0.12) c
7.51
(±0.09) a
20.80
(±0.16) b
9.96
(±0.08) b
33.33
(±0.26) b
20.15
(±0.16) a
0.92
(±0.01) b
8.26
(±0.26) a
18.94
(±0.72) a
25.92
(±0.72) a
22.39
(±0.62) a
AF11.72
(±0.12) b
(+15%)
7.32
(±0.10) a
21.72
(±0.16) a
9.74
(±0.07) b
35.03
(±0.24) a
18.80
(±0.13) b
0.97
(±0.01) a
(+6%)
7.39
(±0.22) b
(−11%)
18.62
(±0.68) a
21.63
(±0.73) b
20.14
(±0.52) b
(−10%)
AF+13.91
(±0.18) a
(+37%)
7.04
(±0.21) a
20.57
(±0.24) b
10.73
(±0.35) a
35.46
(±0.37) a
18.69
(±0.20) b
1.02
(±0.02) a
(+11%)
7.51
(±0.26) ab
(−9%)
18.30
(±0.83) a
23.97
(±0.82) ab
21.19
(±0.65) ab
(−5%)
All data, except for %UPP (whose values were significantly different between the two years) were calculated as an average over the 2016 and 2017 data (±SE). In a column, means with different letters were significantly different according to Tukey’s HSD test. The average grain protein, gliadin/glutenin ratio, Fi, and %UPP are also expressed as a percentage variation compared with the C treatment.
Publisher’s Note: MDPI stays neutral with regard to jurisdictional claims in published maps and institutional affiliations.

